
Spatial Analysis of Groundwater Hydrochemistry through Integrated Multivariate Analysis: A Case Study in the Urbanized Langat Basin, Malaysia

 ,
,
Abstract
1. Introduction
2. Materials and Methods
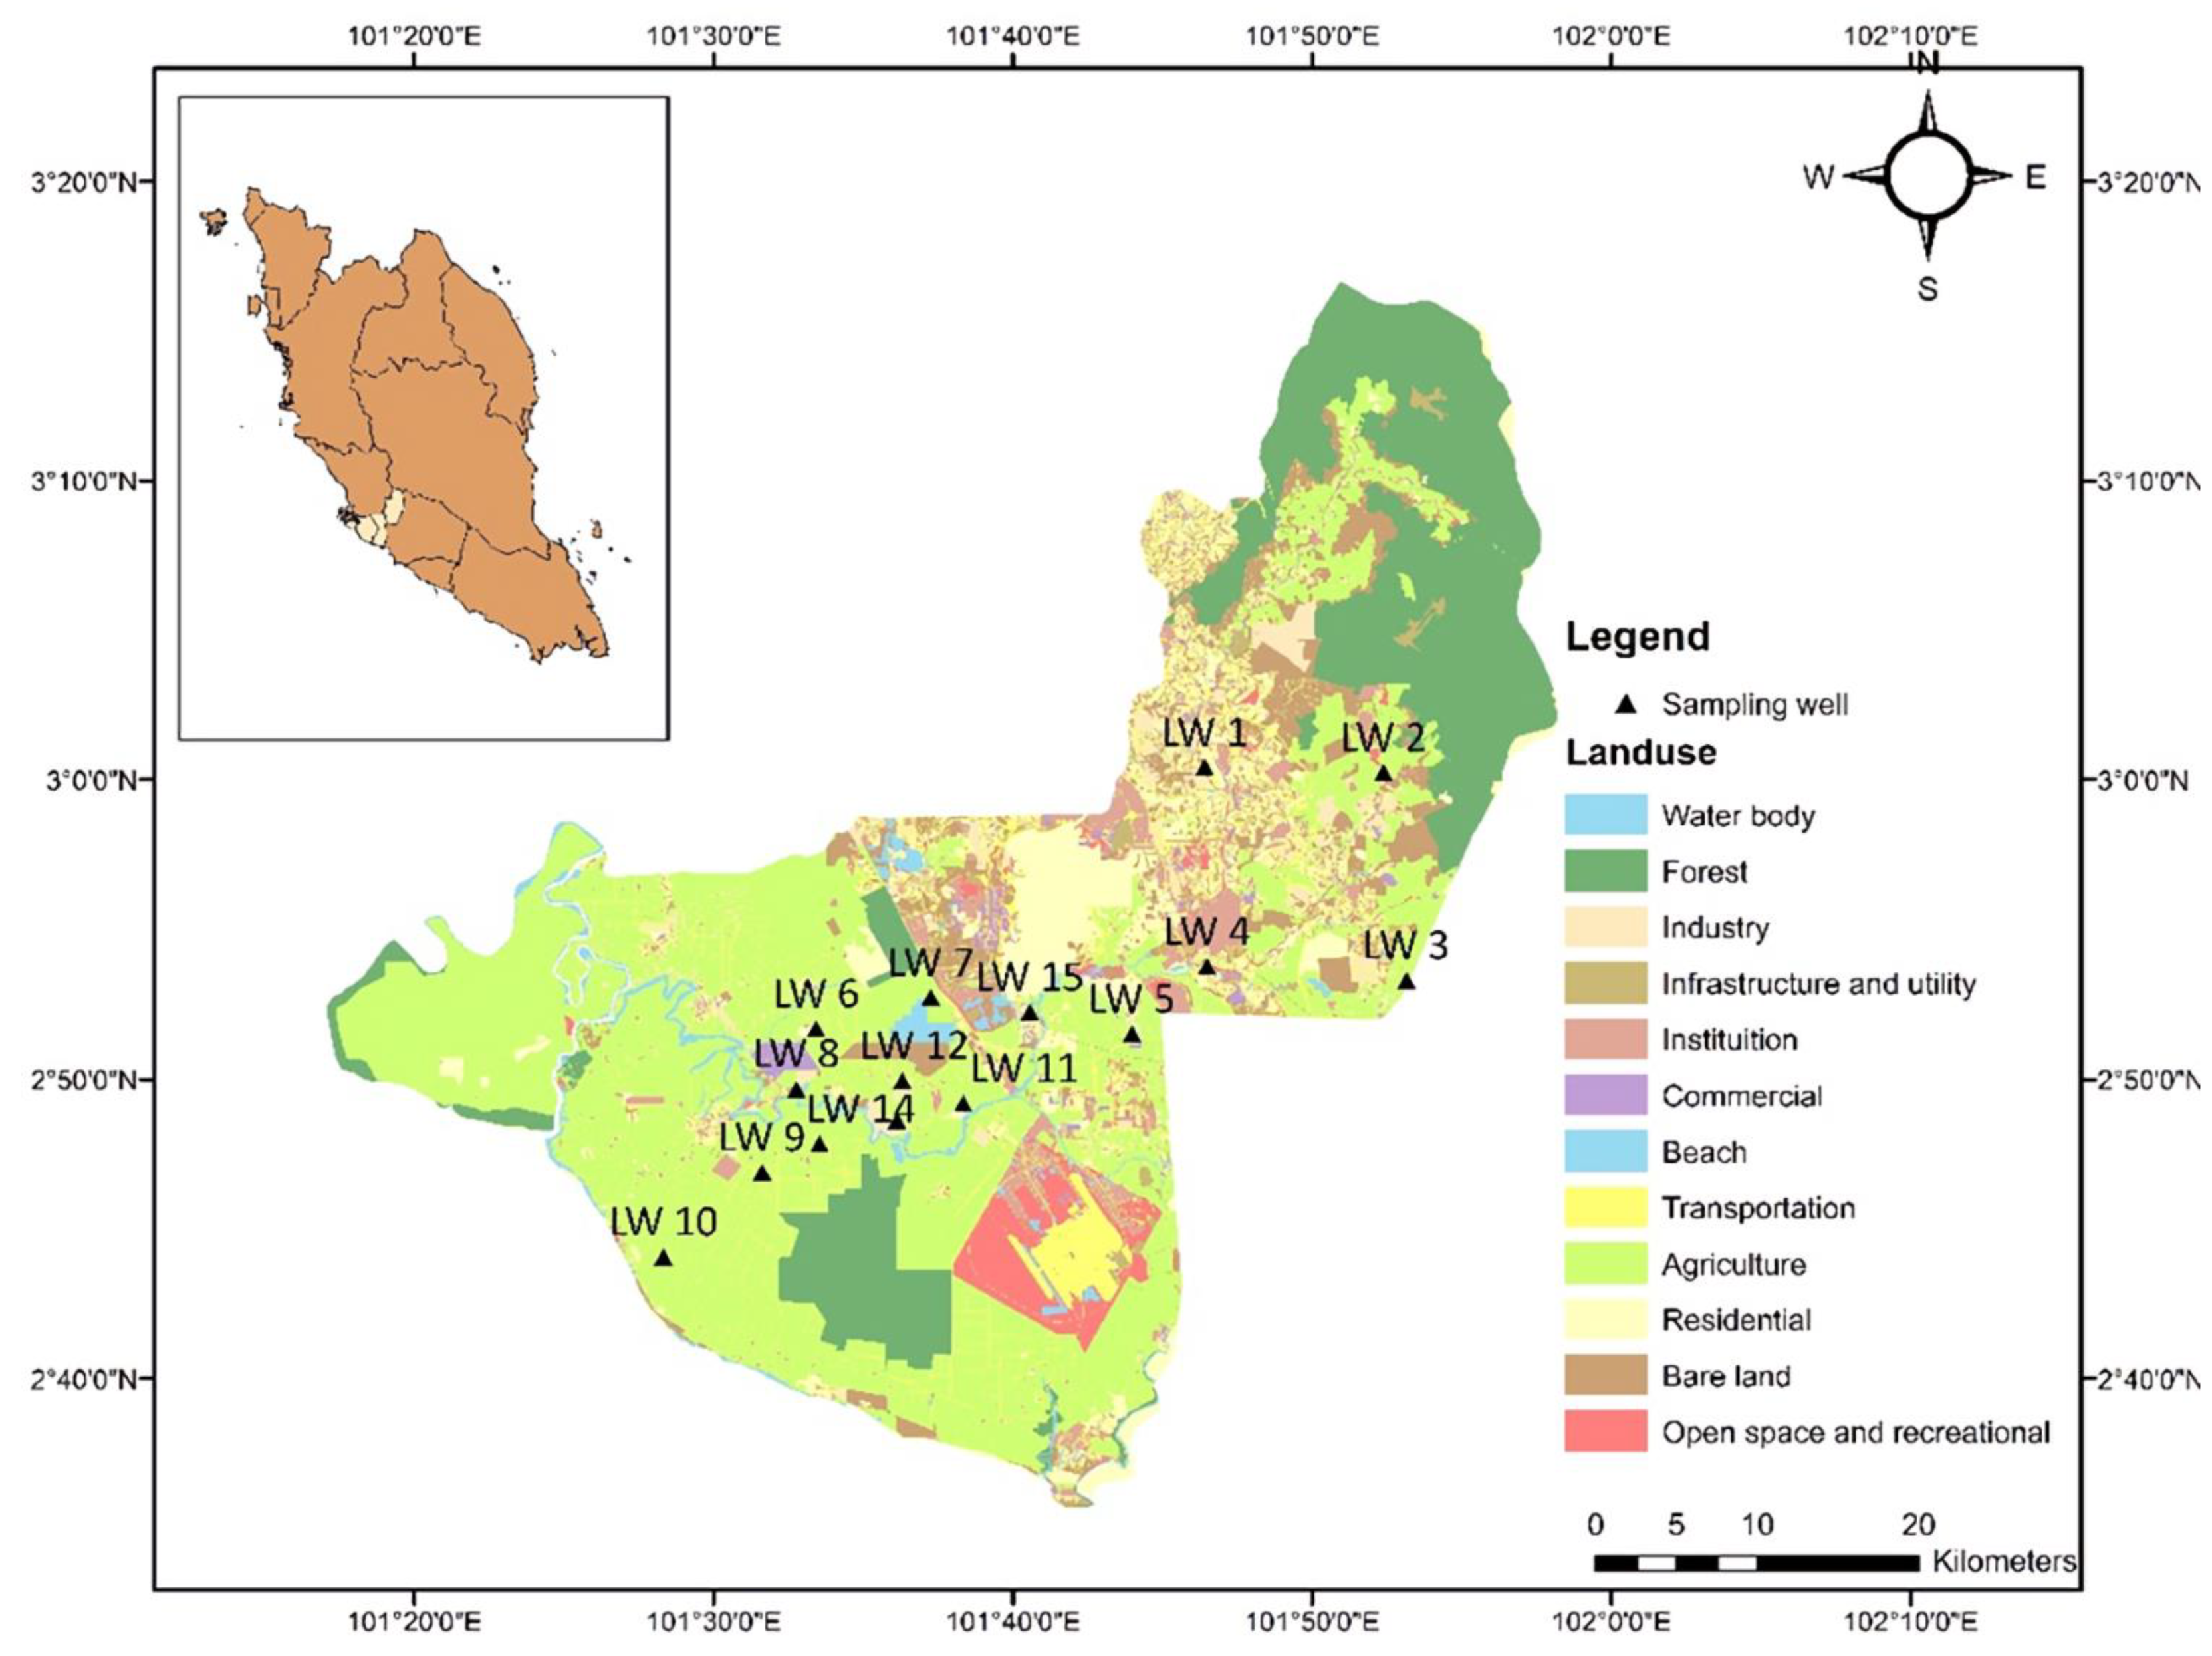
2.1. Study Area
2.2. Physicochemical Parameter, Major Ions, and Heavy Metals
2.3. Data Analysis
2.3.1. Statistical Analysis
2.3.2. Hydrochemical Facies
2.3.3. Hierarchical Analysis Component (HCA)
2.3.4. Principal Component Analysis (PCA)
3. Results and Discussion
3.1. Descriptive Analyses
3.1.1. Physicochemical Properties of the Groundwater in the Langat Basin
3.1.2. Major Ions Distribution in the Langat Basin
3.1.3. Occurrences and Distribution of Heavy Metals in the Groundwater of the Langat Basin
3.2. Correlation Matrix
3.3. Hydrochemical Facies
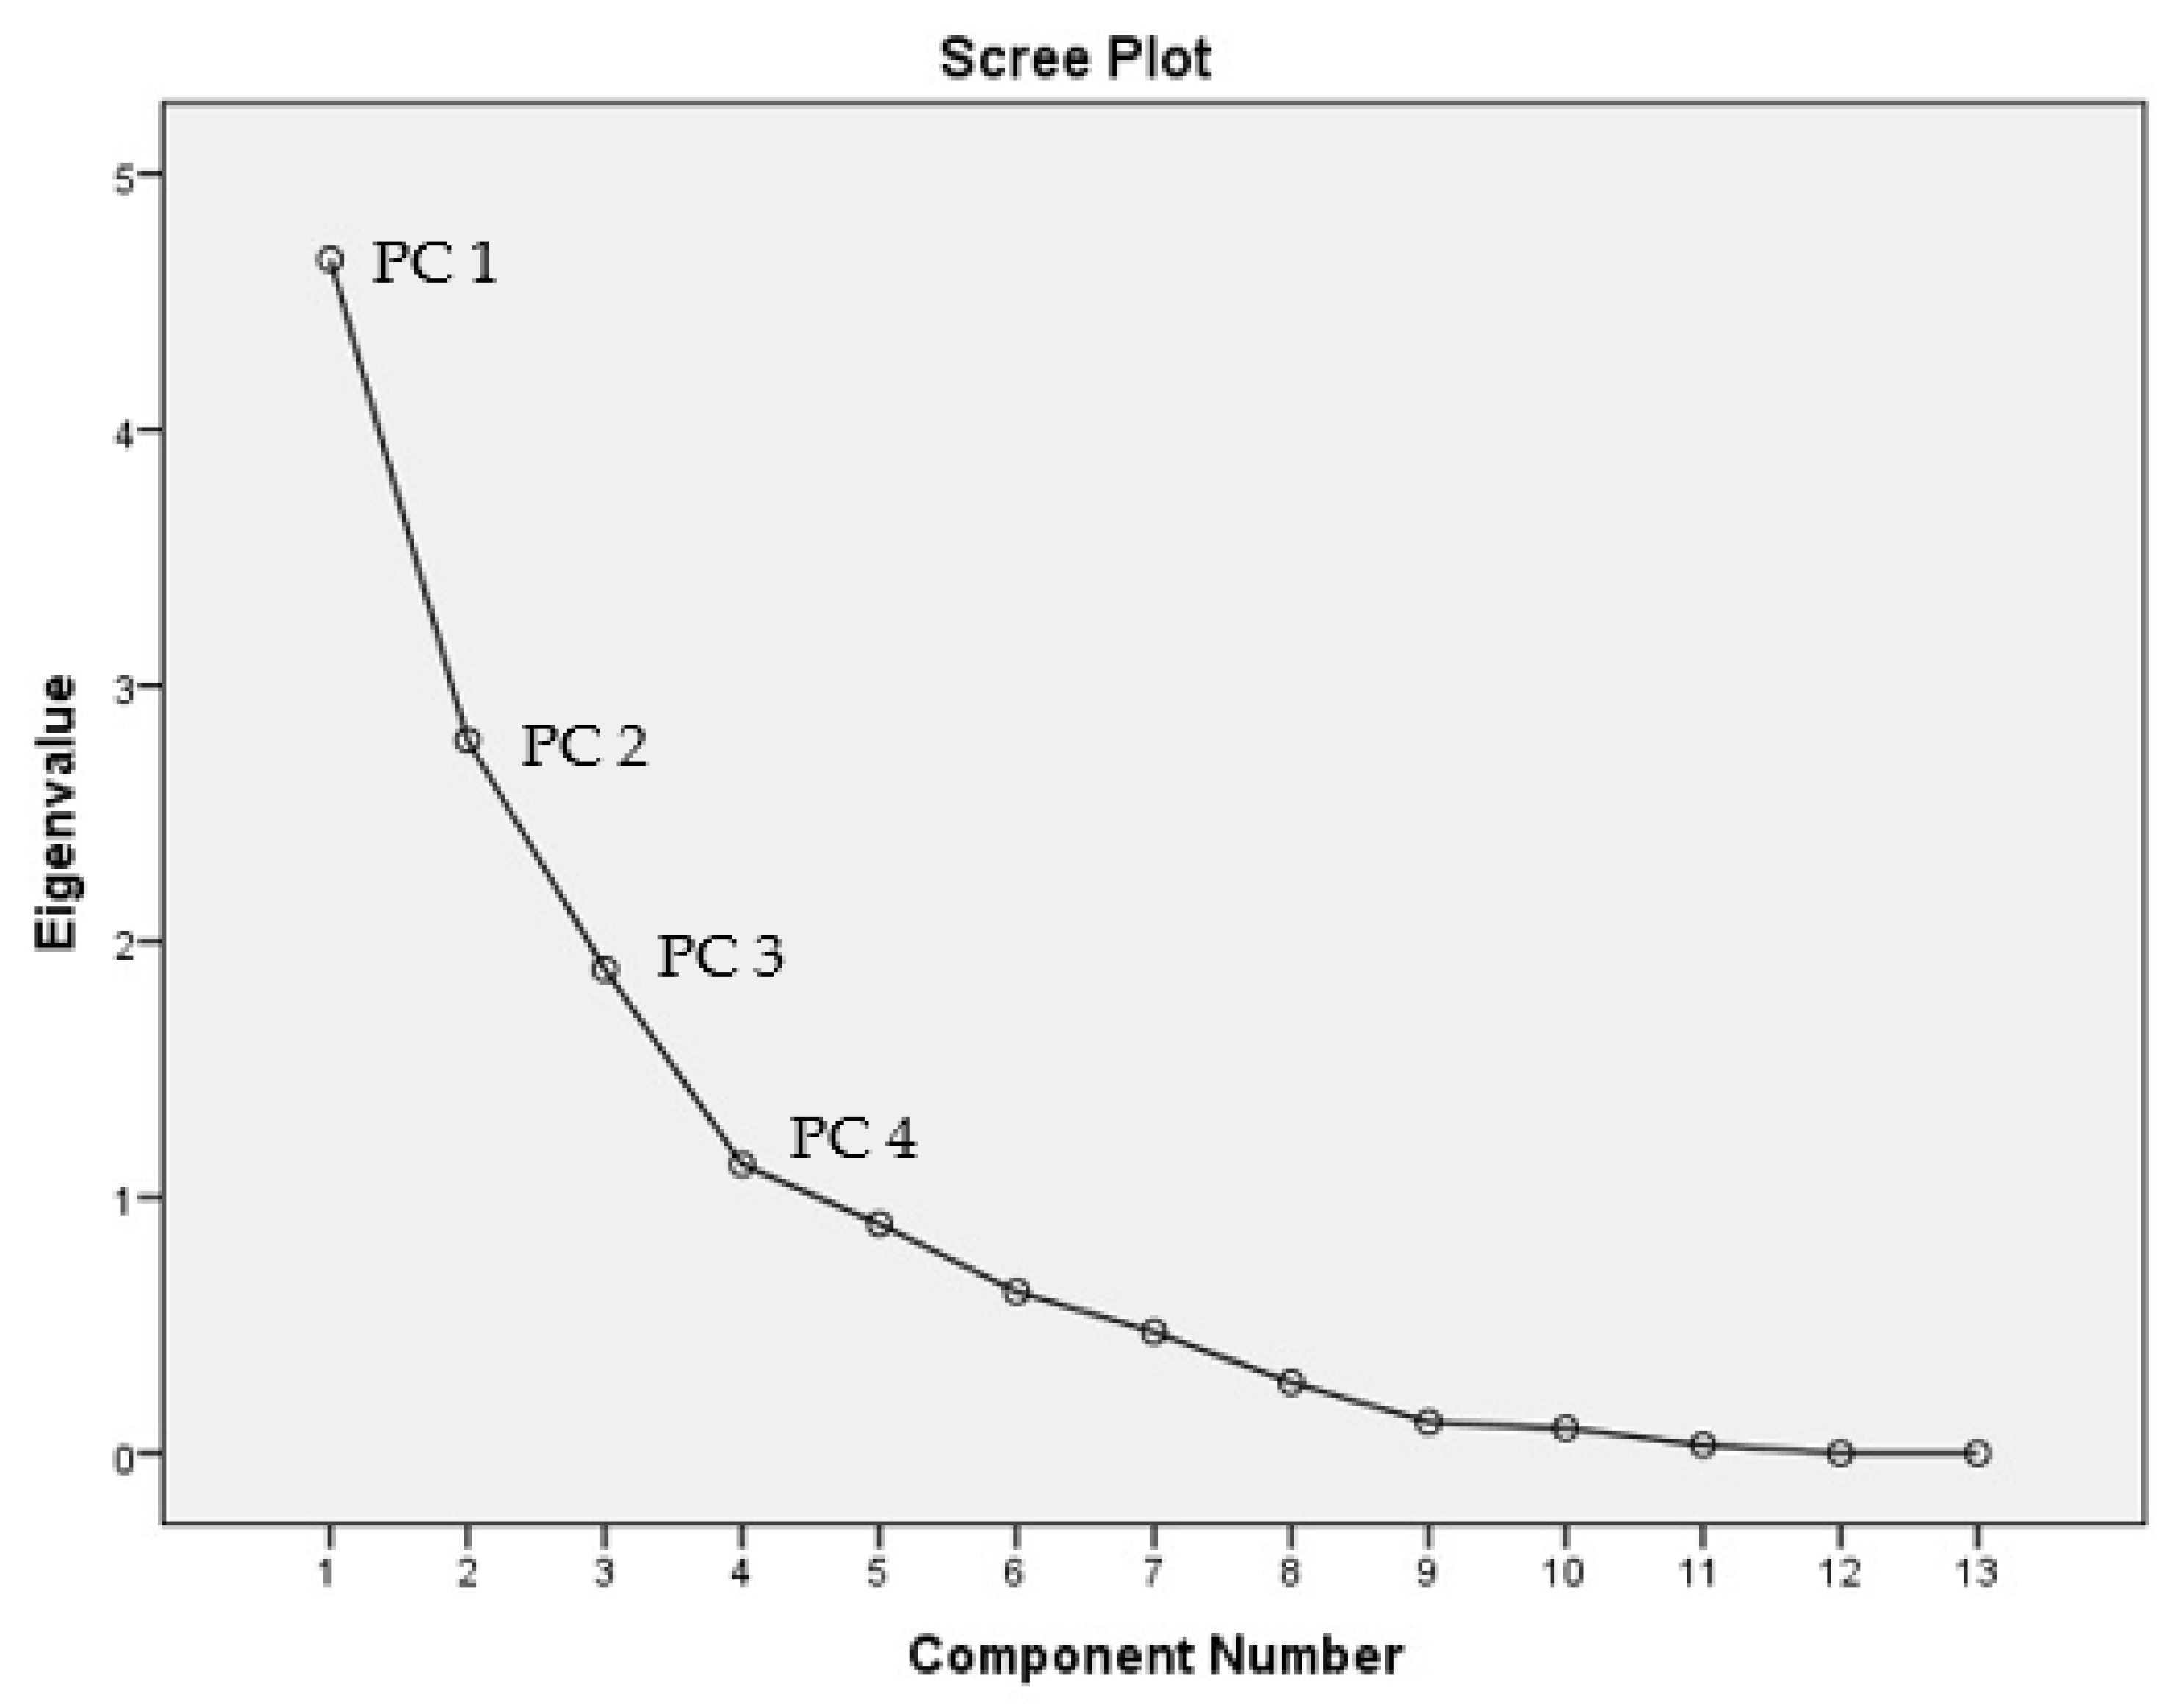
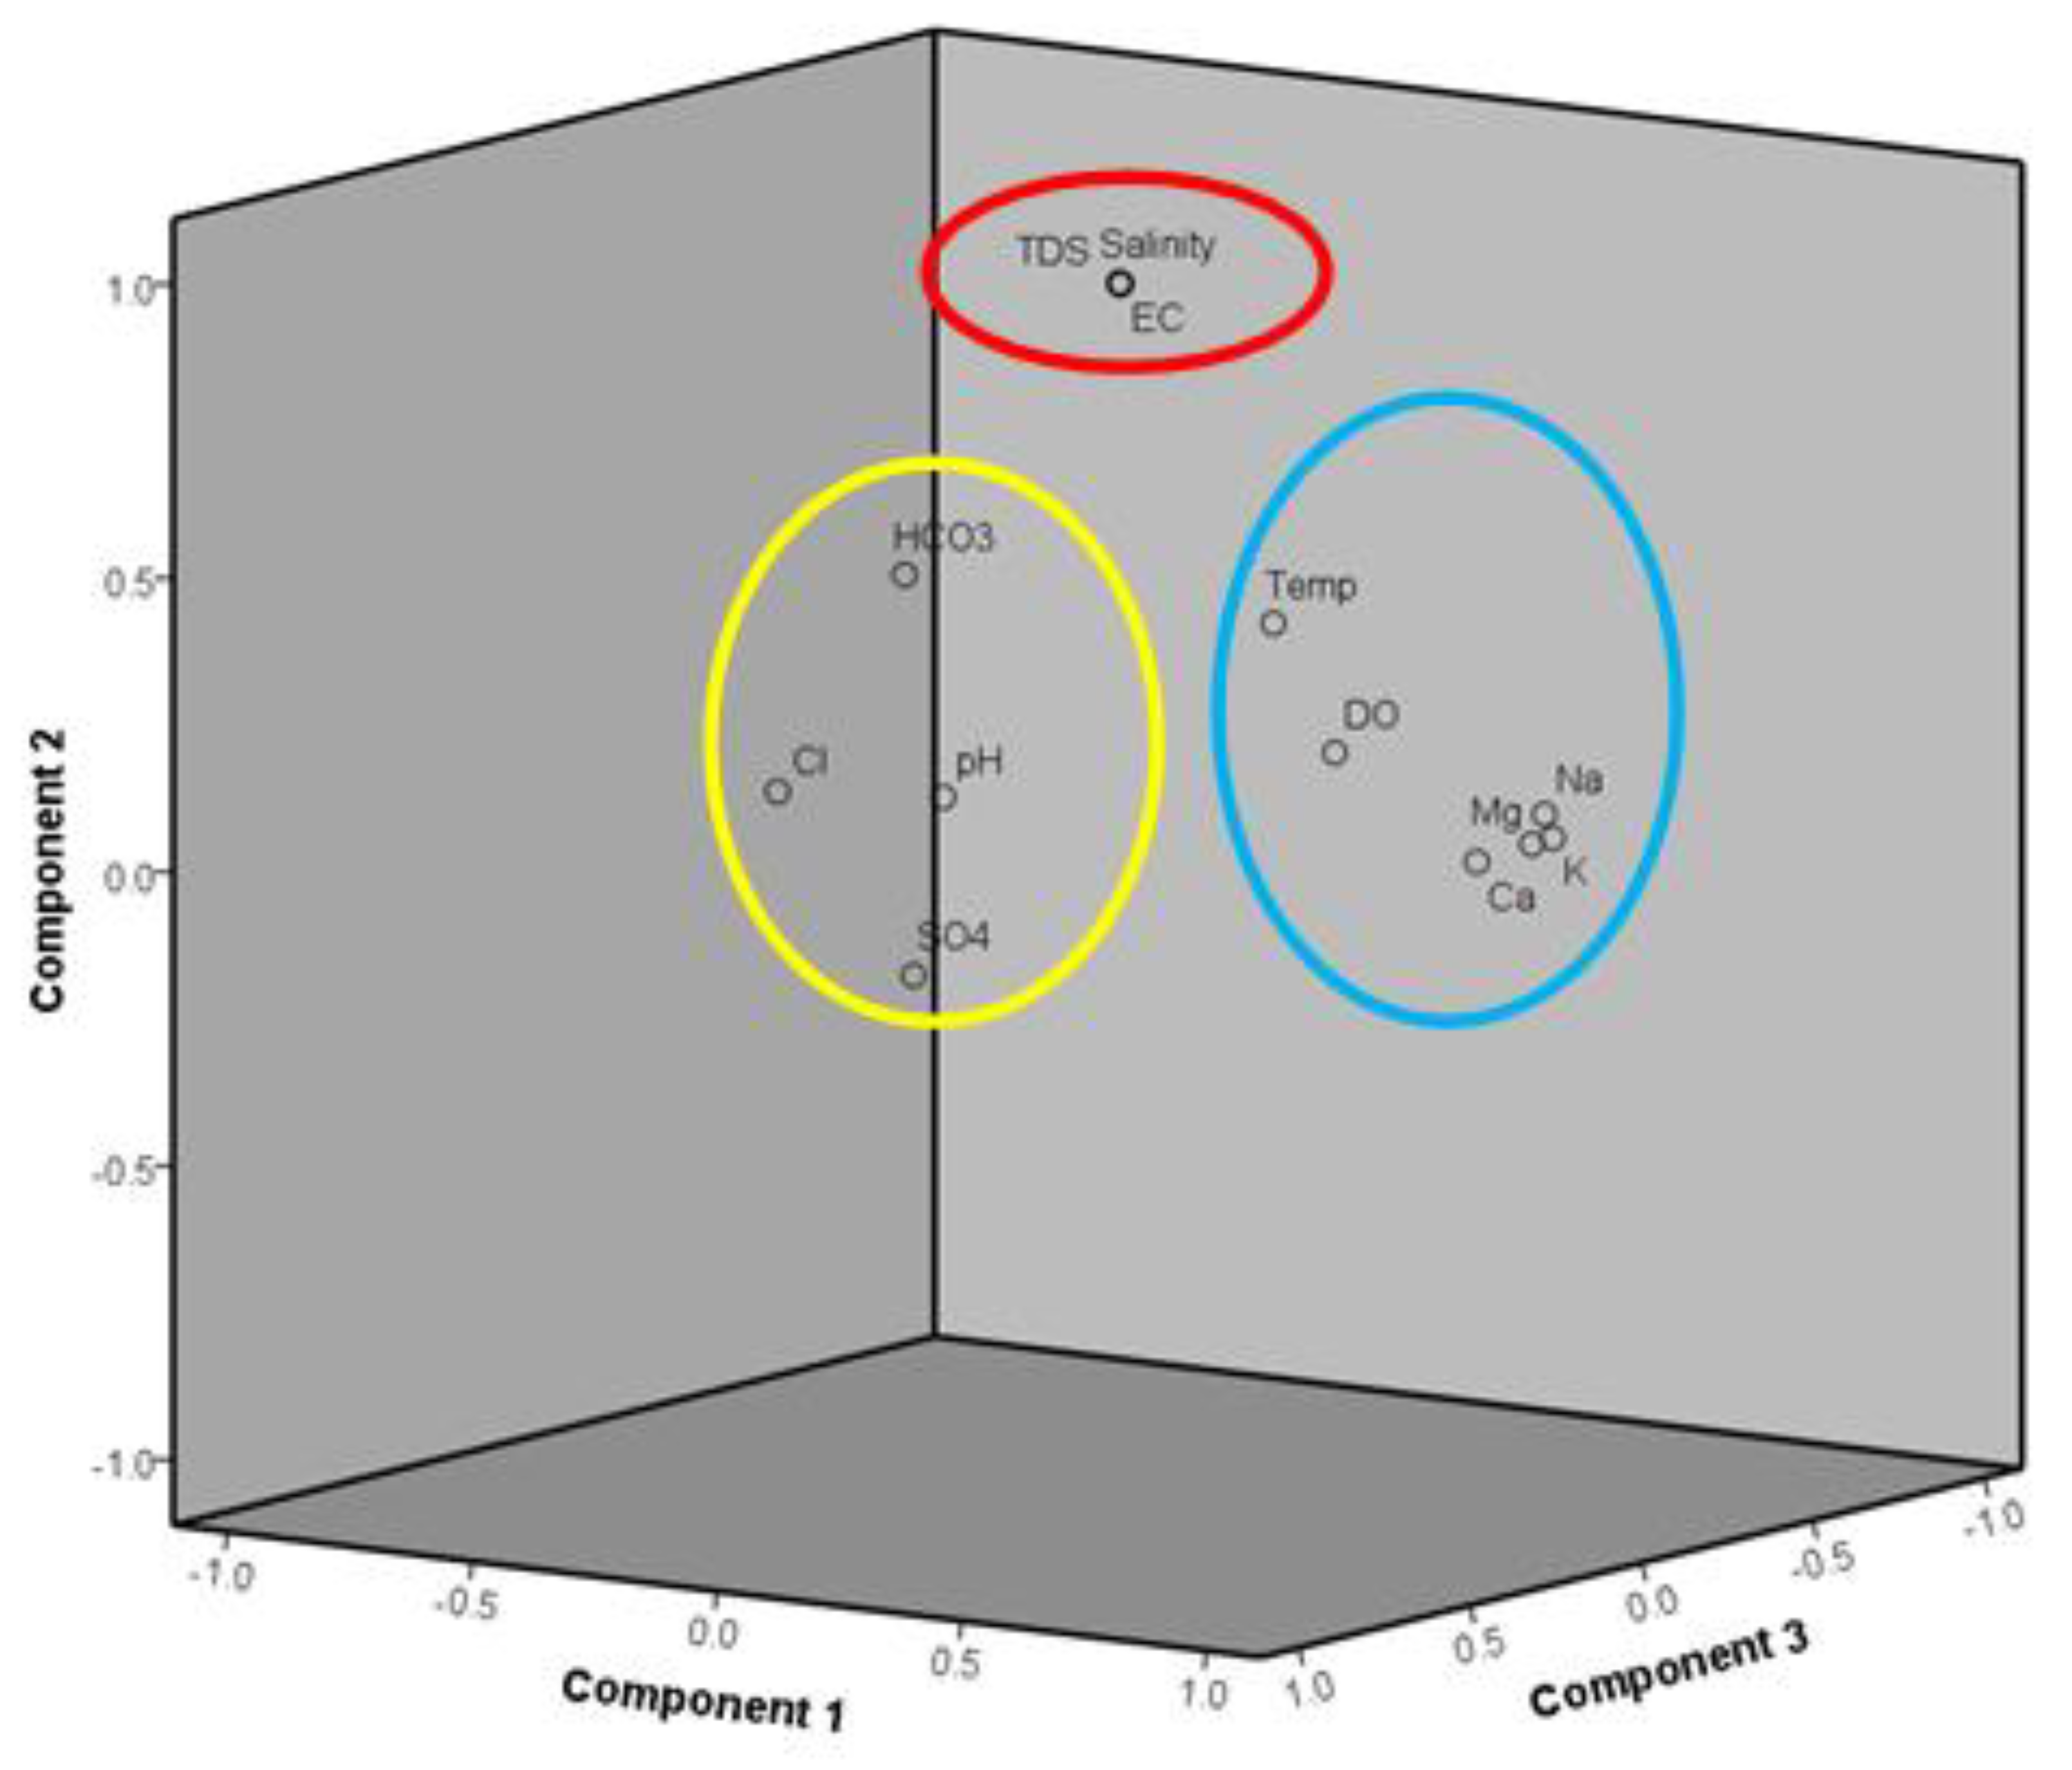
3.4. Principal Component Analysis (PCA)
3.5. Hierarchical Component Analysis (HCA)
4. Conclusions
Supplementary Materials
Author Contributions
Funding
Institutional Review Board Statement
Informed Consent Statement
Data Availability Statement
Acknowledgments
Conflicts of Interest
References
- Giordano, M. Global Groundwater? Issues and Solutions. Annu. Rev. Environ. Resour. 2009, 34, 153–178. [Google Scholar] [CrossRef]
- Zainuddin, A.H.; Wee, S.Y.; Aris, A.Z. Occurrence and potential risk of organophosphorus pesticides in urbanised Linggi River, Negeri Sembilan, Malaysia. Environ. Geochem. Health 2020, 1–13. [Google Scholar] [CrossRef]
- Usman, U.N.; Toriman, M.E.; Juahir, H. Assessment of Groundwater Quality Using Multivariate Statistical Techniques in Terengganu. Sci. Technol. 2015. [Google Scholar] [CrossRef]
- Gude, V.G. Desalination of deep groundwater aquifers for freshwater supplies–Challenges and strategies. Groundw. Sustain. Dev. 2018, 6, 87–92. [Google Scholar] [CrossRef]
- Sayyed, J.A.; Bhosle, A.B. Analysis of Chloride, Sodium and Potassium in Groundwater Samples of Nanded City in Mahabharata, India. Eur. J. Exp. Bio. 2011, 1, 74–82. [Google Scholar]
- Abdullah, S.; Chand, F.; Zakaria, S.; Loganathan, P. Transforming the Water Sector: National Integrated Water Resources Management Plan. Strategies and Road Map Volume 2—Appendices. J. Chem. Inf. Modeling 2019, 53. [Google Scholar] [CrossRef]
- Mridha, G.C.; Hossain, M.M.; Uddin, M.S.; Masud, M.S. Study on availability of groundwater resources in Selangor state of Malaysia for an efficient planning and management of water resources. J. Water Clim. Chang. 2019, 11, 1050–1066. [Google Scholar] [CrossRef]
- Mohamed, A.F.; Yaacob, W.W.; Taha, M.R.; Samsudin, A.R. Groundwater and soil vulnerability in the Langat Basin Malaysia. Eur. J. Sci. Res. 2009, 27, 628–635. [Google Scholar]
- Kusin, F.M.; Azani, N.N.M.; Hasan, S.N.M.S.; Sulong, N.A. Distribution of heavy metals and metalloid in surface sediments of heavily-mined area for bauxite ore in Pengerang, Malaysia and associated risk assessment. Catena 2018, 165, 454–464. [Google Scholar] [CrossRef]
- Academy of Sciences Malaysia. Strategies to Enhance Water Demand Management in Malaysia, 2016. Available online: www.akademisains.gov.my/asm-publication/water-demand-management/ (accessed on 17 February 2021).
- Bodrud-Doza, M.D.; Islam, A.T.; Ahmed, F.; Das, S.; Saha, N.; Rahman, M.S. Characterization of groundwater quality using water evaluation indices, multivariate statistics and geostatistics in central Bangladesh. Water Sci. 2016, 30, 19–40. [Google Scholar] [CrossRef]
- Crowther, J. Groundwater chemistry and cation budgets of tropical karst outcrops, Peninsular Malaysia, I. Calcium and magnesium. J. Hydrol. 1989, 107, 169–192. [Google Scholar] [CrossRef]
- Ahmed, A.M.; Sulaiman, W.N. Evaluation of groundwater and soil pollution in a landfill area using electrical resistivity imaging survey. Environ. Manag. 2001, 28, 655–663. [Google Scholar] [CrossRef]
- Samuding, K.; Abustan, I.; Rahman, M.T.A.; Isa, M.H. Distribution of Heavy Metals Profile in Groundwater System at Solid Waste Disposal Site. Eur. J. Sci. Res. 2009, 37, 58–66. [Google Scholar]
- Rahim, B.E.A.; Yusoff, I.; Samsudin, A.R.; Yaacob, W.Z.W.; Rafek, A.G.M. Deterioration of groundwater quality in the vicinity of an active open-tipping site in West Malaysia. Hydrogeol. J. 2010, 18, 997–1006. [Google Scholar] [CrossRef]
- Kato, M.; Onuma, S.; Kato, Y.; Thang, N.D.; Yajima, I.; Hoque, M.Z.; Shekhar, H.U. Toxic elements in well water from Malaysia. Toxicol. Environ. Chem. 2010, 92, 1609–1612. [Google Scholar] [CrossRef]
- Taha, M.R.; Yaacob, W.Z.W.; Samsudin, A.R.; Yaakob, J. Groundwater quality at two landfill sites in Selangor, Malaysia. Bull. Geol. Soc. Malays. 2011, 57, 13–18. [Google Scholar] [CrossRef]
- Islami, N.; Taib, S.H.; Yusoff, I.; Ghani, A.A. Integrated geoelectrical resistivity, hydrochemical and soil property analysis methods to study shallow groundwater in the agriculture area, Machang, Malaysia. Environ. Earth Sci. 2012, 65, 699–712. [Google Scholar] [CrossRef]
- Ashraf, M.A.; Yusoff, I.; Yusof, M.; Alias, Y. Study of contaminant transport at an open-tipping waste disposal site. Environ. Sci. Pollut. Res. 2013, 20, 4689–4710. [Google Scholar] [CrossRef] [PubMed]
- Juanah, M.S.E.; Ibrahim, S.; Sulaiman, W.N.A.; Latif, P.A. Groundwater resources assessment using integrated geophysical techniques in the southwestern region of Peninsular Malaysia. Arab. J. Geosci. 2013, 6, 4129–4144. [Google Scholar] [CrossRef]
- Shirazi, S.M.; Imran, H.M.; Akib, S.; Yusop, Z.; Harun, Z.B. Groundwater vulnerability assessment in the Melaka State of Malaysia using DRASTIC and GIS techniques. Environ. Earth Sci. 2013, 70, 2293–2304. [Google Scholar] [CrossRef]
- Shamsuddin, M.K.N.; Sulaiman, W.N.A.; Suratman, S.; Zakaria, M.P.; Samuding, K. Groundwater and surface-water utilisation using a bank infiltration technique in Malaysia. Hydrogeol. J. 2014, 22, 543–564. [Google Scholar] [CrossRef]
- Mogaji, K.A.; Lim, H.S.; Abdullar, K. Modeling groundwater vulnerability to pollution using Optimized DRASTIC model. IOP Conf. Ser. Earth Environ. Sci. 2014, 20. [Google Scholar] [CrossRef]
- Atta, M.; Yaacob, W.Z.W.; Jaafar, O.B. The potential impact of leachate-contaminated groundwater of an ex-landfill site at Taman Beringin Kuala Lumpur, Malaysia. Environ. Earth Sci. 2015, 73, 3913–3923. [Google Scholar] [CrossRef]
- Haque, S.; Roslan, N. Groundwater Quality Aspect Owing to Urbanization in Langat Basin (Kajang, Semenyih) Malaysia. Asian J. Environ. Ecol. 2017, 4, 1–9. [Google Scholar] [CrossRef]
- Machiwal, D.; Jha, M.K. Regional Studies Identifying sources of groundwater contamination in a hard-rock aquifer system using multivariate statistical analyses and GIS-based geostatistical modeling techniques. J. Hydrol. Reg. Stud. 2015, 4, 80–110. [Google Scholar] [CrossRef]
- Gunaalan, K.; Ranagalage, M.; Gunarathna, M.; Kumari, M.; Vithanage, M.; Srivaratharasan, T.; Saravanan, S.; Warnasuriya, T.W.S. Application of geospatial techniques for groundwater quality and availability assessment: A case study in Jaffna Peninsula, Sri Lanka. ISPRS Int. J. Geo Inf. 2018, 7, 20. [Google Scholar] [CrossRef]
- Vasileiou, E.; Papazotos, P.; Dimitrakopoulos, D.; Perraki, M. Expounding the origin of chromium in groundwater of the Sarigkiol basin, Western Macedonia, Greece: A cohesive statistical approach and hydrochemical study. Environ. Monit. 2019, 1–34. [Google Scholar] [CrossRef] [PubMed]
- Pande, C.B.; Moharir, K. Spatial analysis of groundwater quality mapping in hard rock area in the Akola and Buldhana districts of Maharashtra, India. Appl. Water Sci. 2018, 8, 1–17. [Google Scholar] [CrossRef]
- DOSM. Poket Stats Negeri Selangor ST 2 2020. Jabatan Perangkaan Malaysia. 2020. Available online: www.dosm.gov.my/v1/index.php?r=column/cone&menu_id=dFc3aExhVktPbUpoZys1dWoyUWFPQT09# (accessed on 10 October 2018).
- Nampak, H.; Pradhan, B.; Abd, M. Application of GIS based data driven evidential belief function model to predict groundwater potential zonation. J. Hydrol. 2014, 513, 283–300. [Google Scholar] [CrossRef]
- Hutchison, C.S.; Tan, D.N.K. Geology of Peninsular Malaysia; Published jointly by the University of Malaya [and] the Geological Society of Malaysia: Kuala Lumpur, Malaysia, 2009. [Google Scholar]
- Shamsuddin, M.K.N.; Sulaiman, W.N.A.; Suratman, S.; Zakaria, M.P.; Samuding, K. Conjunctive use of surface water and groundwater via the bank infiltration method. Arab. J. Geosci. 2014, 7, 3731–3753. [Google Scholar] [CrossRef]
- The Study on the Sustainable Groundwater Resources and Environmental Management for the Langat Basin in Malaysia. Available online: https://openjicareport.jica.go.jp/pdf/11684388.pdf (accessed on 21 May 2021).
- Memarian, H.; Balasundram, S.K. Hydrological Trend Analysis Integrated with Landscape Analysis at the Watershed Scale (Case Study: Langat Basin, Malaysia). Landsc. Ecol. Influ. Land Use Anthropog. Impacts Landscape Creat. 2016. [Google Scholar] [CrossRef]
- APHA. Standard Methods for the Examination of Water and Wastewater, 22nd ed.; American Water Works Association, Water Environment Federation: Washington, DC, USA, 2010. [Google Scholar]
- Chidambaram, S.; Karmegam, U.; Prasanna, M.V.; Sasidhar, P. A study on evaluation of probable sources of heavy metal pollution in groundwater of Kalpakkam region, South India. Environmentalist 2012, 32, 371–382. [Google Scholar] [CrossRef]
- Thirumalini, S.; Joseph, K. Correlation between electrical conductivity and total dissolved solids in natural waters. Malays. J. Sci. 2009, 28, 55–61. [Google Scholar] [CrossRef]
- Huang, G.; Zhang, M.; Liu, C.; Li, L.; Chen, Z. Heavy metal (loid) s and organic contaminants in groundwater in the Pearl River Delta that has undergone three decades of urbanization and industrialization: Distributions, sources, and driving forces. Sci. Total Environ. 2018, 635, 913–925. [Google Scholar] [CrossRef]
- Selvakumar, S.; Ramkumar, K.; Chandrasekar, N.; Magesh, N.S.; Kaliraj, S. Groundwater quality and its suitability for drinking and irrigational use in the Southern Tiruchirappalli district, Tamil Nadu, India. Appl. Water Sci. 2017, 7, 411–420. [Google Scholar] [CrossRef]
- Zhang, B.; Song, X.; Zhang, Y.; Han, D.; Tang, C. Hydrochemical characteristics and water quality assessment of surface water and groundwater in Songnen plain, Northeast China. Water Res. 2012, 46, 2737–2748. [Google Scholar] [CrossRef] [PubMed]
- Zhu, B.; Wang, X.; Rioual, P. Multivariate indications between environment and ground water recharge in a sedimentary drainage basin in northwestern China. J. Hydrol. 2017, 549, 92–113. [Google Scholar] [CrossRef]
- Wood, M.D.; Beresford, N.A.; Copplestone, D. Limit of detection values in data analysis: Do they matter? Radioprotection 2011, 46, S85–S90. [Google Scholar] [CrossRef]
- Annapoorna, H.; Janardhana, M.R. Assessment of groundwater quality for drinking purpose in rural areas surrounding a defunct copper mine. Aquat. Procedia 2015, 4, 685–692. [Google Scholar] [CrossRef]
- Ravikumar, P.; Venkatesharaju, K.; Somashekar, R.K. Major ion chemistry and hydrochemical studies of groundwater of Bangalore South Taluk, India. Environ. Monit. Assess. 2010, 163, 643–653. [Google Scholar] [CrossRef] [PubMed]
- Piper, A.M. A graphic procedure in the geochemical interpretation of water-analyses. Eos Trans. Am. Geophys. Union 1944, 25, 914–928. [Google Scholar] [CrossRef]
- Kura, N.U.; Ramli, M.F.; Sulaiman, W.N.A.; Ibrahim, S.; Aris, A.Z. An overview of groundwater chemistry studies in Malaysia. Environ. Sci. Pollut. Res. 2018, 25, 7231–7249. [Google Scholar] [CrossRef] [PubMed]
- Souid, F.; Agoubi, B.; Telahigue, F.; Chahlaoui, A.; Kharroubi, A. Groundwater salinization and seawater intrusion tracing based on Lithium concentration in the shallow aquifer of Jerba Island, southeastern Tunisia. J. Afr. Earth Sci. 2018, 138, 233–246. [Google Scholar] [CrossRef]
- Masoud, A.A.; El-Horiny, M.M.; Atwia, M.G.; Gemail, K.S.; Koike, K. Assessment of groundwater and soil quality degradation using multivariate and geostatistical analyses, Dakhla Oasis, Egypt. J. Afr. Earth Sci. 2018, 142, 64–81. [Google Scholar] [CrossRef]
- Voutsis, N.; Kelepertzis, E.; Tziritis, E.; Kelepertsis, A. Assessing the hydrogeochemistry of groundwaters in ophiolite areas of Euboea Island, Greece, using multivariate statistical methods. J. Geochem. Explor. 2015, 159, 79–92. [Google Scholar] [CrossRef]
- Lezzaik, K.; Milewski, A.; Mullen, J. The groundwater risk index: Development and application in the Middle East and North Africa region. Sci. Total Environ. 2018, 628, 1149–1164. [Google Scholar] [CrossRef]
- Selvakumar, S.; Chandrasekar, N.; Kumar, G. Hydrogeochemical characteristics and groundwater contamination in the rapid urban development areas of Coimbatore, India. Water Res Ind. 2017, 17, 26–33. [Google Scholar] [CrossRef]
- Signes-Pastor, A.; Burló, F.; Mitra, K.; Carbonell-Barrachina, A.A. Arsenic biogeochemistry as affected by phosphorus fertilizer addition, redox potential and pH in a west Bengal (India) soil. Geoderma 2007, 137, 504–510. [Google Scholar] [CrossRef]
- Isa, N.M.; Aris, A.Z.; Sulaiman, W.N.A. Extent and severity of groundwater contamination based on hydrochemistry mechanism of sandy tropical coastal aquifer. Sci. Total Environ. 2012, 438, 414–425. [Google Scholar] [CrossRef]
- Abd Manap, M.; Sulaiman, W.N.A.; Ramli, M.F.; Pradhan, B.; Surip, N. A knowledge-driven GIS modeling technique for groundwater potential mapping at the Upper Langat Basin, Malaysia. Arab. J. Geosci. 2013, 6, 1621–1637. [Google Scholar] [CrossRef]
- Chenini, I.; Farhat, B.; Mammou, A.B.; Chenini, I.; Farhat, B.; Mammou, A.B. Identification of major sources controlling groundwater chemistry from a multilayered aquifer system Identification of major sources controlling groundwater chemistry from a multilayered aquifer system. Chem. Speciat. Bioavailab. 2015, 22, 183–189. [Google Scholar] [CrossRef]
- Lim, W.Y.; Aris, A.Z.; Zakaria, M.P. Spatial variability of metals in surface water and sediment in the Langat river and geochemical factors that influence their water-sediment interactions. Sci. World J. 2012. [Google Scholar] [CrossRef]
- Sefie, A.; Aris, A.Z.; Ramli, M.F.; Narany, T.S.; Shamsuddin, M.K.N.; Saadudin, S.B.; Zali, M.A. Hydrogeochemistry and groundwater quality assessment of the multilayered aquifer in Lower Kelantan Basin, Kelantan, Malaysia. Environ. Earth Sci. 2018, 77, 1–15. [Google Scholar] [CrossRef]
- Kamal, Z.A.; Sulaiman, M.S.; Hakim, M.K.; Syahira, A.; Hamzah, Z.; Khan, M.M.A. Investigation of Seawater Intrusion in Coastal Aquifers of Kelantan, Malaysia using Geophysical and Hydrochemical Techniques. In IOP Conference Series: Earth and Environmental Science; IOP Publishing: Kelantan Malaysia, 2020; Volume 549, p. 012018. Available online: https://iopscience.iop.org/article/10.1088/1755-1315/549/1/012018/meta (accessed on 21 May 2021).
- Singh, K.C.; Kumar, A.A.; Shashtri, S.; Kumar, A.A.; Kumar, P.; Mallick, J. Multivariate statistical analysis and geochemical modeling for geochemical assessment of groundwater of Delhi, India. J. Geochem. Explor. 2017, 175, 59–71. [Google Scholar] [CrossRef]
- WHO. (2017); Guidelines for Drinking-Water Quality: Fourth Edition Incorporating the First Addendum; World Health Organization: Geneva, Switzerlands; Available online: apps.who.int/iris/bitstream/handle/10665/254637/9789241549950-eng.pdf (accessed on 8 August 2020).
- MOH. Drinking and Raw Water Quality Standard. Engineering Services Division Malaysia. 2016. Available online: environment.com.my/wp-content/uploads/2016/05/Drinking-Water-MOH.pdf (accessed on 8 August 2020).
- Zereg, S.; Boudoukha, A.; Benaabidate, L. Impacts of natural conditions and anthropogenic activities on groundwater quality in Tebessa plain, Algeria. Sustain. Environ. Res. 2018, 28, 340–349. [Google Scholar] [CrossRef]
- Yang, L.; Zhu, G.; Shi, P.; Li, J.; Liu, Y.; Tong, H.; Zhang, Y. Spatiotemporal characteristics of hydrochemistry in Asian arid inland basin–a case study of Shiyang River Basin. Environ. Sci. Pollut. Res. 2018, 25, 2293–2302. [Google Scholar] [CrossRef]
- Keesari, T.; Sharma, D.A.; Rishi, M.S.; Pant, D.; Mohokar, H.V.; Jaryal, A.K.; Sinha, U.K. Isotope investigation on groundwater recharge and dynamics in shallow and deep alluvial aquifers of southwest Punjab. Appl. Radiat. Isot. 2017, 129, 163–170. [Google Scholar] [CrossRef]
- Ramachandran, A.; Krishnamurthy, R.R.; Jayaprakash, M.; Shanmugasundharam, A. Environmental impact assessment of surface water and groundwater quality due to flood hazard in Adyar River Bank. Acta Ecol. Sin. 2019, 39, 125–132. [Google Scholar] [CrossRef]
- González-Fernández, B.; Menéndez-Casares, E.; Meléndez-Asensio, M.; Fernández-Menéndez, S.; Ramos-Muñiz, F.; Cruz-Hernández, P.; González-Quirós, A. Sources of mercury in groundwater and soils of west Gijón (Asturias, NW Spain). Sci. Total Environ. 2014, 481, 217–231. [Google Scholar] [CrossRef]
- Wang, L.; Hou, D.; Cao, Y.; Sik, Y.; Tack, F.M.G.; Rinklebe, J.; Connor, D.O. Remediation of mercury contaminated soil, water, and air: A review of emerging materials and innovative technologies. Environ. Int. 2020, 134, 105281. [Google Scholar] [CrossRef] [PubMed]
- Andrea, C.; Stefano, C.; Andrea, E.; Elena, P.; Elisa, P.; Asta, G.; Urbanc, J.; Enrico, Z.; Luca, Z. Mercury in the unconfined aquifer of the Isonzo/Soča River alluvial plain downstream from the Idrija mining area. Chemosphere 2018, 195, 749–761. [Google Scholar] [CrossRef]
- Abiriga, D.; Vestgarden, L.S.; Klempe, H. Groundwater contamination from a municipal landfill: Effect of age, landfill closure, and season on groundwater chemistry. Sci. Total Environ. 2020, 737, 140307. [Google Scholar] [CrossRef]
- Melegy, A.A.; Shaban, A.M.; Hassaan, M.M.; Salman, S.A. Geochemical mobilization of some heavy metals in water resources and their impact on human health in Sohag Governorate, Egypt. Arab. J. Geosci. 2013, 7, 4541–4552. [Google Scholar] [CrossRef]
- Tao, Y.; Yuan, Z.; Wei, M.; Xiaona, H. Characterization of heavy metals in water and sediments in Taihu Lake, China. Environ. Monit. Assess. 2012, 184, 4367–4382. [Google Scholar] [CrossRef] [PubMed]
- Patil, V.T.; Patil, P.R. Physicochemical analysis of selected groundwater samples of Amalner town in Jalgaon District, Maharashtra, India. Eur. J.Chem. 2010, 7, 111–116. [Google Scholar] [CrossRef]
- Ledesma-Ruiz, R.; Mahlknecht, J. Geochemical and Isotopic Characterization of Groundwater in Tecate, Baja California, Mexico. Procedia Earth Planet. Sci. 2017, 17, 516–519. [Google Scholar] [CrossRef]
- Sheikhy Narany, T.; Ramli, M.F.; Aris, A.Z.; Nor, W.; Sulaiman, A.; Juahir, H.; Fakharian, K. Identification of the Hydrogeochemical Processes in Groundwater Using Classic Integrated Geochemical Methods and Geostatistical Techniques, in Amol-Babol Plain, Iran. Sci. World J. 2014, 1–15. [Google Scholar] [CrossRef] [PubMed]
- Varughese, S.; Devi Prasad, K.V. Physico-chemical analysis of groundwater samples in the Varahanadi watershed, India. Agris Line Papers Econ. Inform. 2012, 2, 1662–1669. [Google Scholar] [CrossRef]
- Rezaei, A.; Hassani, H.; Jabbari, N. Evaluation of groundwater quality and assessment of pollution indices for heavy metals in North of Isfahan Province, Iran. Sustain. Water Resour. Manag. 2017, 5, 491–512. [Google Scholar] [CrossRef]
- Tirkey, P.; Bhattacharya, T.; Chakraborty, S.; Baraik, S. Groundwater for Sustainable Development Assessment of groundwater quality and associated health risks: A case study of Ranchi city, Jharkhand, India. Groundw. Sustain. Dev. 2017, 5, 85–100. [Google Scholar] [CrossRef]
- Kumar, P.S.; Delson, P.D.; Babu, P.T. Appraisal of heavy metals in groundwater in Chennai city using a HPI model. Bull. Environ. Contam. Toxicol. 2012, 89, 793–798. [Google Scholar] [CrossRef] [PubMed]
- Wongsasuluk, P.; Chotpantarat, S.; Siriwong, W.; Robson, M. Heavy metal contamination and human health risk assessment in drinking water from shallow groundwater wells in an agricultural area in Ubon Ratchathani province, Thailand. Environ. Geochem. Health 2014, 36, 169–182. [Google Scholar] [CrossRef] [PubMed]
- Hepburn, E.; Northway, A.; Bekele, D.; Liu, G.; Currell, M. A method for separation of heavy metal sources in urban groundwater using multiple lines of evidence. Environ. Pollut. 2018, 241, 787–799. [Google Scholar] [CrossRef]
- Kura, N.U.; Ramli, M.F.; Sulaiman, W.N.A.; Ibrahim, S.; Aris, A.Z.; Mustapha, A. Evaluation of factors influencing the groundwater chemistry in a small tropical island of Malaysia. Int. J. Environ. Res. Public Health 2013, 10, 1861–1881. [Google Scholar] [CrossRef] [PubMed]
- Sefie, A.; Aris, A.Z.; Shamsuddin, M.K.N.; Tawnie, I.; Suratman, S.; Idris, A.N.; BahrenSaadudin, S.; Wan Ahmad, W.K. Hydrogeochemistry of Groundwater from Different Aquifer in Lower Kelantan Basin, Kelantan, Malaysia. Procedia Environ. Sci. 2015, 30, 151–156. [Google Scholar] [CrossRef]
- Mrazovac, S.; Vojinović-Miloradov, M. Correlation of main physicochemical parameters of some groundwater in northern Serbia. J. Geochem. Explor. 2011, 108, 176–182. [Google Scholar] [CrossRef]
- Gibbs, R.J. Mechanism controlling world water chemistry. Science 1970, 170, 1088–1090. [Google Scholar] [CrossRef] [PubMed]
- Gulgundi, M.S.; Shetty, A. Groundwater quality assessment of urban Bengaluru using multivariate statistical techniques. Appl. Water Sci. 2018, 8, 43. [Google Scholar] [CrossRef]
- Adelopo, A.O.; Haris, P.I.; Alo, B.I.; Huddersman, K.; Jenkins, R.O. Multivariate analysis of the effects of age, particle size and landfill depth on heavy metals pollution content of closed and active landfill precursors. Waste Manag. 2018, 78, 227–237. [Google Scholar] [CrossRef]
- Kumar, P.J.S.; James, E.J. Physicoche mical parameters and their sources in groundwater in the Thirupathur region, Tamil Nadu, South India. Appl. Water Sci. 2013, 3, 219–228. [Google Scholar] [CrossRef]
- Khan, M.N.; Mobin, M.; Abbas, Z.K.; Arabia, S. Fertilizers and Their Contaminants in Soils, Surface and Groundwater. Encycl. Anthr. 2018, 5, 225–240. [Google Scholar]
- Dash, A.; Das, H.K.; Mishra, B. Hydrogeochemistry and ground water quality in and around Joda of Keonjhar District, Odisha, India. Int. J. Innov. Sci. Res. 2014, 12, 409–419. [Google Scholar]
- Zghibi, A.; Merzougui, A.; Zouhri, L.; Tarhouni, J. Journal of African Earth Sciences Understanding groundwater chemistry using multivariate statistics techniques to the study of contamination in the Korba unconfined aquifer system of Cap-Bon (North-east of Tunisia). J. Afr. Earth Sci. 2014, 89, 1–15. [Google Scholar] [CrossRef]
- Κίρλας, Μ.Χ. Simulation of Groundwater Flow Using the MODFLOW Code in the Alluvial Aquifer of Korisos Basin, NW Greece. Available online: https://www.researchgate.net/publication/321012204_Simulation_of_groundwater_flow_using_the_MODFLOW_code_in_the_alluvial_aquifer_of_Korisos_basin_NW_Greece (accessed on 21 May 2021).


| Study Area | Method | Studied Elements | Reference |
|---|---|---|---|
| North of Kuala Lumpur, Kinta Valley, Perak and Alor Setar, Kedah | Hydrochemistry analysis | Major ions | [12] |
| Disposal site in Seri Petaling, Selangor | 2D electrical resistivity, geochemistry, and Analysis of variance (ANOVA) | Resistivity image, in situ parameters, major ions and trace elements | [13] |
| Disposal site in Taiping Perak | Hydrochemistry analysis, surfer software | Soil samples, heavy metals | [14] |
| Langat Basin, Selangor | 2D resistivity measurement, MODFLOW (modular finite-difference flow model), and SWOT (Strengths, Weaknesses, Opportunities, and Threats) analysis | In situ parameters, major ions, and heavy metals | [8] |
| Ampar Tenang landfill, Selangor | Sodium adsorption ratio (SAR), piper diagram, 2D resistivity technique | Resistivity image and major ions | [15] |
| Rosob Village, Sabah | Hydrochemistry analysis | Heavy metals | [16] |
| Ampar Tenang and Bukit Tagar landfill, Selangor | Hydrochemistry analysis | Major ions, trace elements, and heavy metals | [17] |
| North Kelantan | 2D resistivity measurement, hydrochemistry, and soil particle size analysis | Resistivity image, soil samples, major ions | [18] |
| Ampar Tenang landfill, Selangor | Physiochemical and biochemical analysis | Physiochemical parameters, organic contaminants, and heavy metals | [19] |
| North of Gemas, Negeri Sembilan | 2D electrical resistivity measurement, induced polarization, and borehole geophysical techniques | Resistivity images, pumping test data, and rock and soil data | [20] |
| Melaka state | DRASTIC model (Depth to water, Recharge, Aquifer media, Soil media, Topography, Impact of the vadose zone, Hydraulic conductivity) with GIS and remote sensing | Groundwater level, recharge, lithology, soil type, topography, hydraulic conductivity, and land use data | [21] |
| Southwest state of Selangor within the Langat Basin | Bank infiltration (BI), pumping test, 2D resistivity survey, soil sieve analyses | Resistivity images, isotope and major ions | [22] |
| Batang Padang, Perak | GIS-based optimized DRASTIC model and analytic Process (AHP) | Borehole data, average annual rainfall, geophysical data, soil map, remote sensing imagery, and geophysical data | [23] |
| Ex-landfill Taman Beringin, Selangor | Hydrochemical analysis, physicochemical analysis, and water quality analysis | Physicochemical parameters, heavy metals, NH3-N, Cl, F, Pb, Ni, and Fe | [24] |
| Semenyih and Kajang, Selangor | Geological analysis, hydrochemical analysis, piper diagram, and well water chemistry interpretation | Major ions, physicochemical parameters, | [25] |
| Langat Basin | Hydrochemical analysis, piper diagram, multivariate analysis | Physicochemical parameters, major ions, and heavy metals | Current study |
| A.s.l (m) | Geological Setting |
|---|---|
| >30 | acid intrusives (undifferentiated) |
| >20 | Phyllite, schist, and slate; limestone and sandstone |
| >10 | Peat, humic clay, and silt; clay, silt, sand, and gravel |
| >1 | Clay and silt |
| Hydrology | Mean |
|---|---|
| Temperature | 27 °C |
| Annual precipitation | 2200 mm |
| Annual evapotranspiration | 1284 mm |
| Groundwater recharge rate | 108 mm |
| Groundwater discharge rate | 846 mm |
| Transmissivity | 0.024 m2/s |
| Vertical hydraulic conductivity/permeability | 7 × 10⁻⁹ m/s |
| Aquifer thickness | 10–100 m |
| Sustainable pumping rate | 26,849 million liter per day (MLD) |
| Water type | Ca-Mg-Cl [15] Na-Cl (current study) |
| Stations | A.s.l | Coordinate | Water Table | Depth of Borehole | Site Description | |
|---|---|---|---|---|---|---|
| m | N | E | m | m | ||
| LW1 | 30 | 3.00705 | 101.773 | 5.35 | 11.0 | Residential area |
| LW2 | 47 | 3.00409 | 101.873 | 1.00 | NA | Residential area and near to a palm oil plantation |
| LW3 | 50 | 2.88834 | 101.886 | 3.50 | NA | Residential area |
| LW4 | 20 | 2.89599 | 101.774 | 3.12 | 45.0 | Near to a river and a shrub area |
| LW5 | 36 | 2.85851 | 101.732 | 2.91 | 22.7 | Residential area |
| LW6 | 26 | 2.86136 | 101.557 | 4.96 | 13.0 | Residential area and near to a river |
| LW7 | 11 | 2.87883 | 101.621 | 4.23 | 11.7 | Wetland and near to a palm oil plantation |
| LW8 | 4 | 2.82795 | 101.546 | 3.42 | 49.5 | Part of agricultural activities |
| LW9 | 6 | 2.78176 | 101.527 | 4.58 | NA | Near to a l palm oil plantation and a lake, and part of agricultural activities |
| LW10 | 5 | 2.73455 | 101.472 | 2.00 | 65.0 | Residential area, near to a coastal area and agricultural activities |
| LW11 | 10 | 2.81993 | 101.639 | 3.7 | 15.8 | Residential area, near to a palm oil plantation and farming activities |
| LW12 | 8 | 2.83261 | 101.605 | 8.75 | 16.0 | Residential area, and near to industrial activities |
| LW13 | 11 | 2.81055 | 101.602 | 8.87 | NA | Near to industrial areas and a palm oil plantation |
| LW14 | 7 | 2.79758 | 101.559 | 0.83 | NA | Residential area, near to a palm oil plantation and a construction site |
| LW15 | 11 | 2.87069 | 101.676 | 2.93 | 18.0 | Residential area |
| Parameters | Unit | Mean (SD) | WHO | MOH |
|---|---|---|---|---|
| pH | 6.13 ± 0.89 | 6.5–8.5 | 6.5–9.0 | |
| Temperature | °C | 29.64 ± 0.90 | - | - |
| DO | mg/L | 1.25 ± 0.35 | - | - |
| Salinity | ppt | 1.14 ± 2.22 | - | - |
| EC | µS/cm | 2286.38 ± 4318.75 | 500 | - |
| TDS | mg/L | 1352.58 ± 2534.34 | 500 | 1000 |
| HCO3− | mg/L | 185.93 ± 241.87 | 500 | - |
| Cl− | mg/L | 74.64 ± 86.77 | 250 | 250 |
| SO42− | mg/L | 38.6 ± 58.22 | 250 | 250 |
| Ca2+ | mg/L | 14.58 ± 22.01 | 75 | - |
| Mg2+ | mg/L | 6.94 ± 6.74 | 50 | 150 |
| K+ | mg/L | 12.85 ± 13.87 | - | - |
| Na+ | mg/L | 24.41 ± 19.64 | 200 | 200 |
| Fe | mg/L | 6.035 ± 9.027 | NA | 0.3 |
| Mn | mg/L | 0.378 ± 0.600 | NA | 0.1 |
| As | mg/L | 0.01 ± 0.019 | 0.01 | 0.01 |
| Cu | mg/L | 0.002 ± 0.002 | 2 | 1 |
| Pb | mg/L | 0.005 ± 0.002 | 0.01 | 0.01 |
| Zn | mg/L | 0.023 ± 0.024 | NA | 3 |
| Ni | mg/L | 0.003 ± 0.001 | 0.07 | 0.02 |
| Cd | mg/L | 0.001 ± 0.000 | 0.003 | 0.003 |
| Se | mg/L | 0.001 ± 0.001 | 0.04 | 0.01 |
| Cr | mg/L | 0.001 ± 0.002 | 0.05 | 0.05 |
| Hg | mg/L | 0.010 ± 0.013 | 0.0006 | 0.001 |
| pH | Temp | Sal | Cond | DO | TDS | HCO3− | Cl− | Ca2+ | Mg2+ | K+ | Na+ | SO42− | |
|---|---|---|---|---|---|---|---|---|---|---|---|---|---|
| pH | 1 | −0.055 | 0.191 | 0.201 | 0.127 | 0.206 | 0.429 ** | 0.398 ** | 0.013 | 0.041 | 0.052 | 0.103 | 0.261 |
| Temp | 1 | 0.306 * | 0.307 * | −0.010 | 0.302 * | −0.047 | −0.061 | 0.115 | 0.235 | 0.210 | 0.199 | 0.056 | |
| Sal | 1 | 1.000 ** | 0.100 | 1.000 ** | 0.625 ** | 0.266 | 0.179 | 0.256 | 0.218 | 0.244 | 0.018 | ||
| Cond | 1 | 0.111 | 1.000 ** | 0.631 ** | 0.272 | 0.184 | 0.265 | 0.228 | 0.253 | 0.021 | |||
| DO | 1 | 0.110 | −0.155 | −0.213 | 0.074 | 0.235 | 0.205 | 0.149 | −0.126 | ||||
| TDS | 1 | 0.641 ** | 0.281 | 0.186 | 0.269 | 0.232 | 0.256 | 0.026 | |||||
| HCO3− | 1 | 0.761 ** | 0.161 | 0.216 | 0.229 | 0.224 | 0.342 * | ||||||
| Cl− | 1 | −0.026 | 0.004 | 0.032 | 0.048 | 0.544 ** | |||||||
| Ca2+ | 1 | 0.688 ** | 0.692 ** | 0.689 ** | 0.165 | ||||||||
| Mg2+ | 1 | 0.981 ** | 0.915 ** | 0.097 | |||||||||
| K+ | 1 | 0.930 ** | 0.131 | ||||||||||
| Na+ | 1 | 0.018 | |||||||||||
| SO42− | 1 |
| Parameters | PC1 | PC2 | PC3 | PC4 |
|---|---|---|---|---|
| K+ | 0.958 | 0.112 | 0.041 | 0.024 |
| Mg+ | 0.940 | 0.105 | 0.076 | 0.139 |
| Na+ | 0.929 | 0.147 | 0.022 | 0.026 |
| Ca+ | 0.814 | 0.060 | 0.057 | −0.091 |
| Salinity | 0.111 | 0.981 | 0.097 | 0.011 |
| EC | 0.120 | 0.980 | 0.102 | 0.022 |
| TDS | 0.123 | 0.979 | 0.111 | 0.026 |
| Cl− | −0.037 | 0.212 | 0.882 | 0.038 |
| SO42− | 0.146 | −0.102 | 0.745 | −0.100 |
| HCO3− | 0.105 | 0.571 | 0.714 | 0.096 |
| DO | 0.215 | 0.121 | −0.385 | 0.734 |
| pH level | 0.042 | 0.157 | 0.510 | 0.576 |
| Temperature | 0.234 | 0.373 | −0.178 | −0.482 |
| Eigenvalue | 3.505 | 3.488 | 2.326 | 1.154 |
| Total variance | 26.965 | 26.831 | 17.891 | 8.880 |
| Total cumulative | 26.965 | 53.796 | 71.686 | 80.566 |
Publisher’s Note: MDPI stays neutral with regard to jurisdictional claims in published maps and institutional affiliations. |
© 2021 by the authors. Licensee MDPI, Basel, Switzerland. This article is an open access article distributed under the terms and conditions of the Creative Commons Attribution (CC BY) license (https://creativecommons.org/licenses/by/4.0/).
Share and Cite
Zainol, N.F.M.; Zainuddin, A.H.; Looi, L.J.; Aris, A.Z.; Isa, N.M.; Sefie, A.; Ku Yusof, K.M.K. Spatial Analysis of Groundwater Hydrochemistry through Integrated Multivariate Analysis: A Case Study in the Urbanized Langat Basin, Malaysia. Int. J. Environ. Res. Public Health 2021, 18, 5733. https://doi.org/10.3390/ijerph18115733
Zainol NFM, Zainuddin AH, Looi LJ, Aris AZ, Isa NM, Sefie A, Ku Yusof KMK. Spatial Analysis of Groundwater Hydrochemistry through Integrated Multivariate Analysis: A Case Study in the Urbanized Langat Basin, Malaysia. International Journal of Environmental Research and Public Health. 2021; 18(11):5733. https://doi.org/10.3390/ijerph18115733
Chicago/Turabian StyleZainol, Nur Fatihah Mohamad, Azim Haziq Zainuddin, Ley Juen Looi, Ahmad Zaharin Aris, Noorain Mohd Isa, Anuar Sefie, and Ku Mohd Kalkausar Ku Yusof. 2021. "Spatial Analysis of Groundwater Hydrochemistry through Integrated Multivariate Analysis: A Case Study in the Urbanized Langat Basin, Malaysia" International Journal of Environmental Research and Public Health 18, no. 11: 5733. https://doi.org/10.3390/ijerph18115733
APA StyleZainol, N. F. M., Zainuddin, A. H., Looi, L. J., Aris, A. Z., Isa, N. M., Sefie, A., & Ku Yusof, K. M. K. (2021). Spatial Analysis of Groundwater Hydrochemistry through Integrated Multivariate Analysis: A Case Study in the Urbanized Langat Basin, Malaysia. International Journal of Environmental Research and Public Health, 18(11), 5733. https://doi.org/10.3390/ijerph18115733