Postnatal Care Service Utilisation in Ethiopia: Reflecting on 20 Years of Demographic and Health Survey Data


Abstract
:1. Introduction
2. Materials and Methods
2.1. Data
2.2. Study Setting
2.3. Outcome Variable
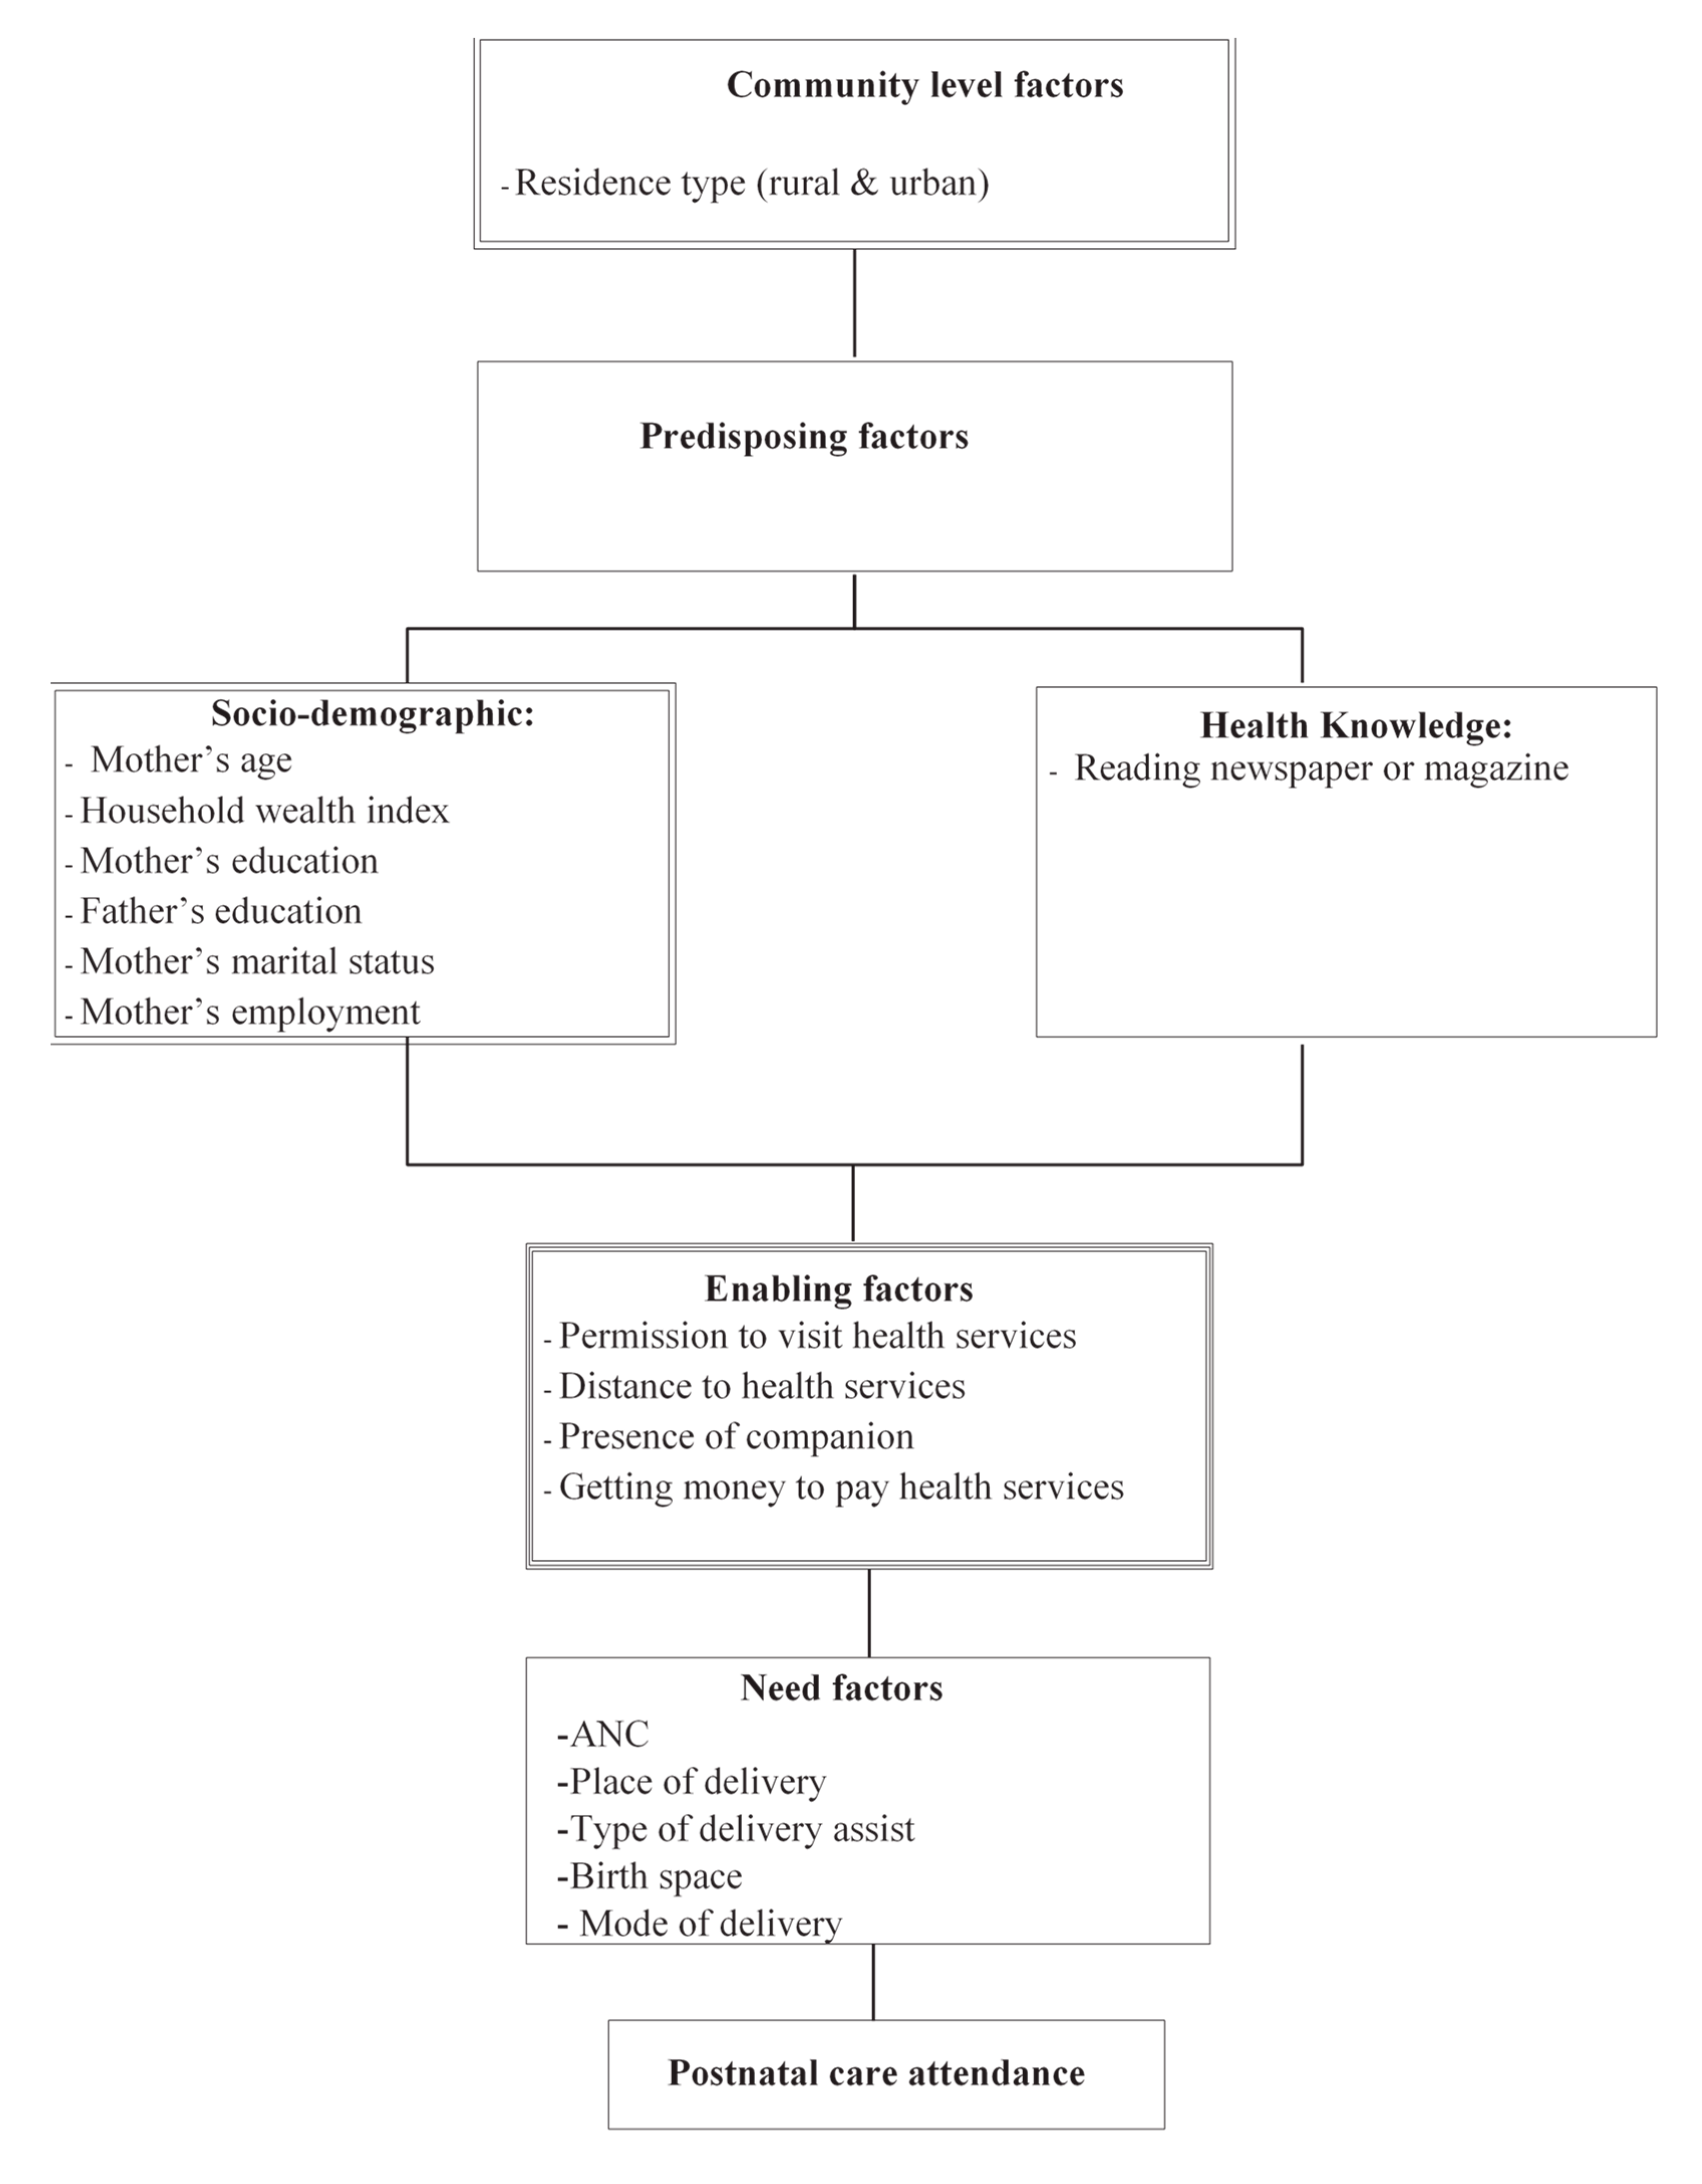
2.4. Independent Variables
2.5. Statistical Analysis
2.6. Ethics
3. Results
3.1. Background Characteristics of the Study Population
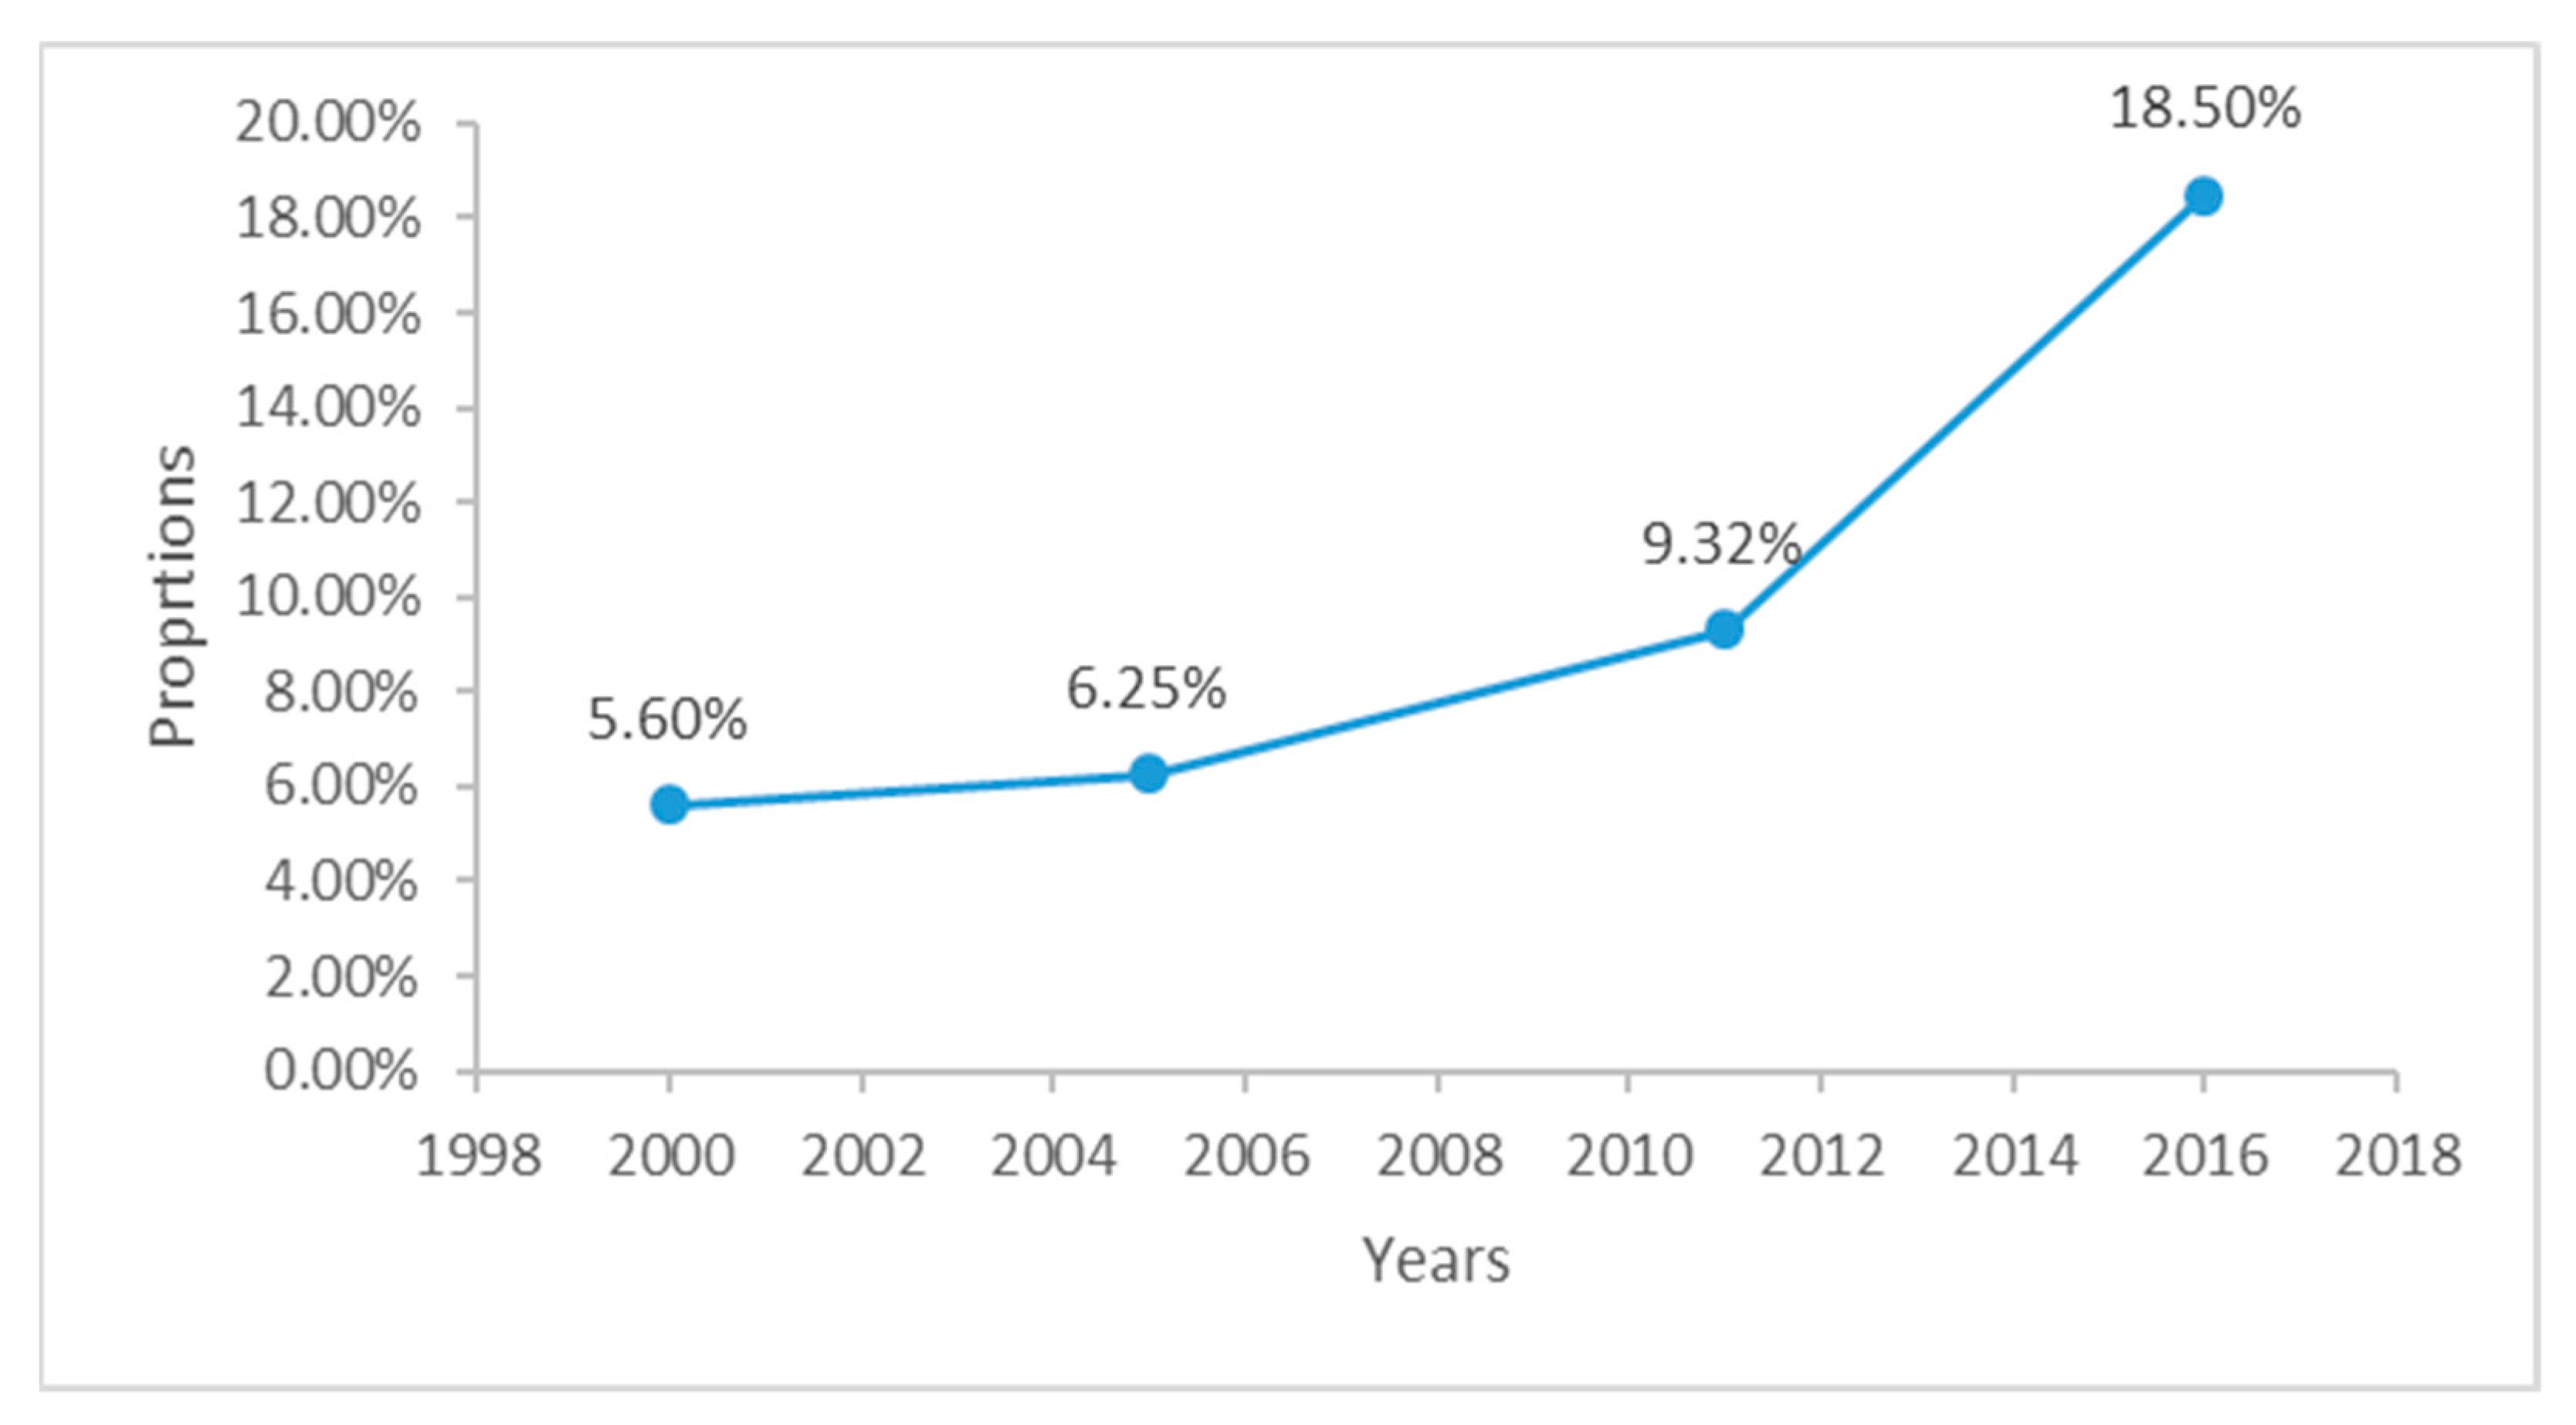
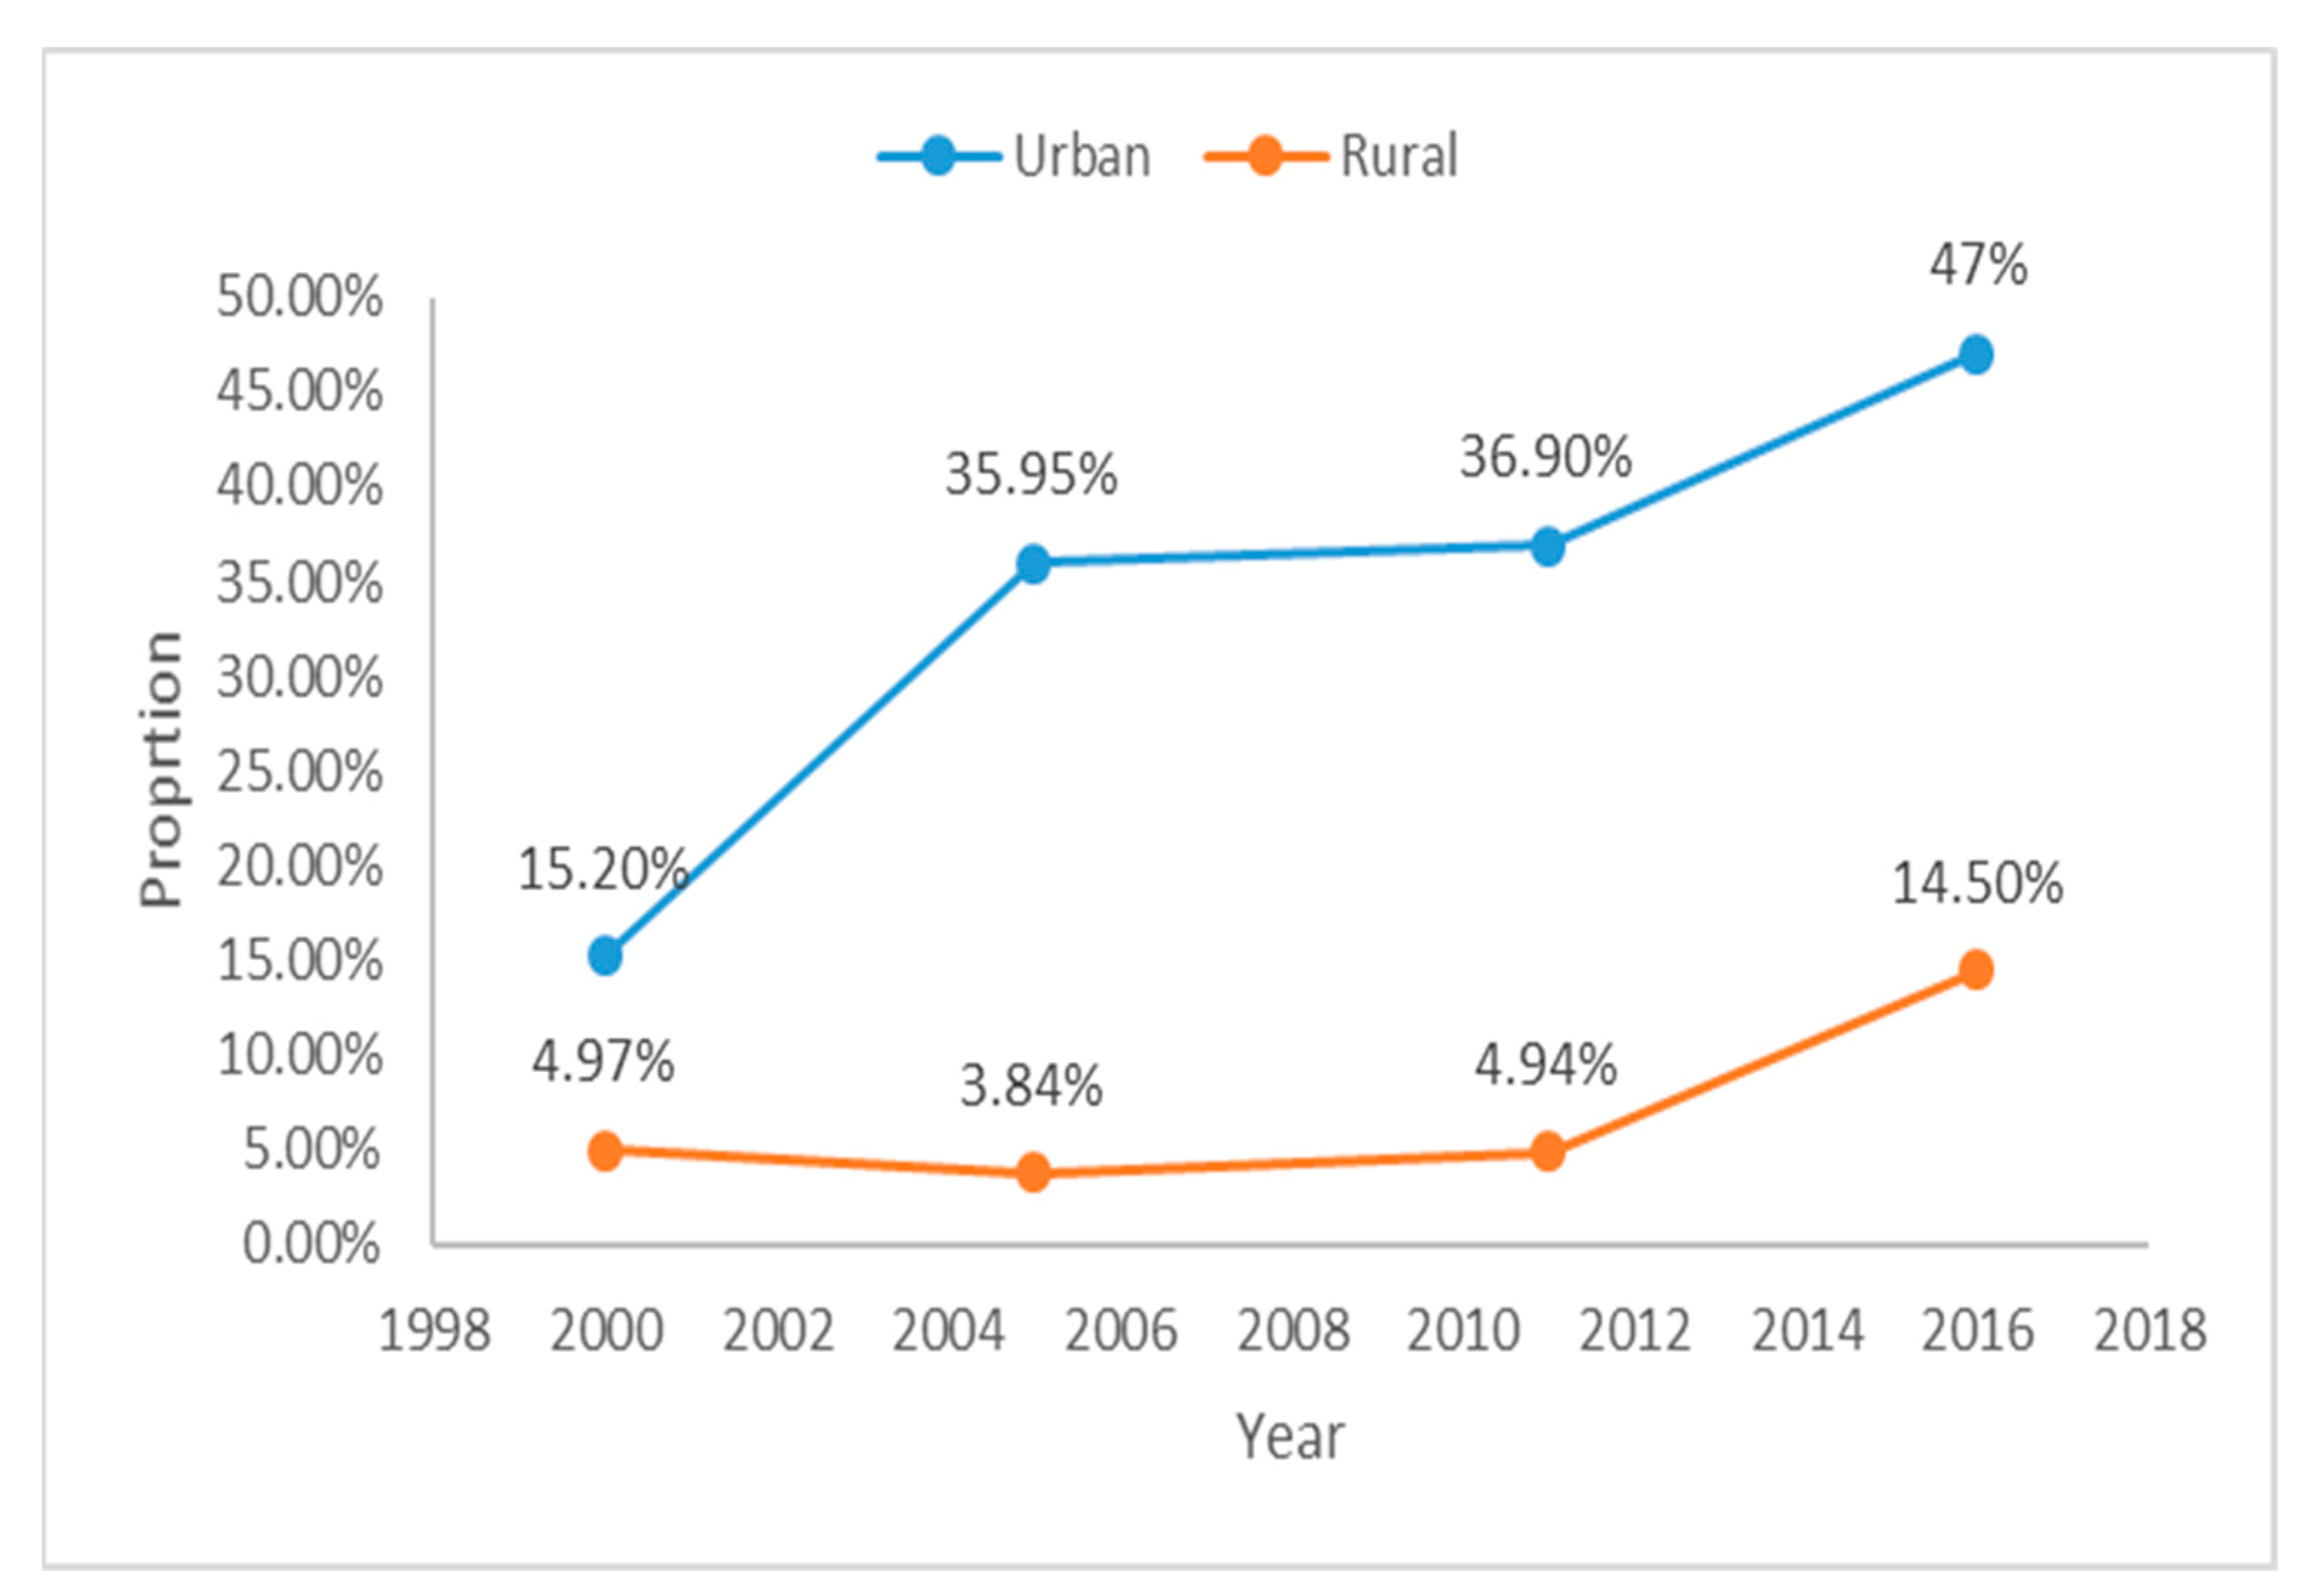
3.2. Utilisation of PNC Services in Ethiopia
3.3. Determinants of PNC in Ethiopia
3.4. Determinants of PNC Service Utilisation in Urban–Rural Ethiopia
4. Discussion
5. Conclusions
Author Contributions
Funding
Data Availability Statement
Acknowledgments
Conflicts of Interest
Abbreviations
| ANC | Antenatal care |
| SDG | Sustainable Development Goal |
| MDG | Millennium Development Goal |
| WHO | World Health Organization |
| ICF | Inner City Fund |
| EDHS | Ethiopia Demographic and Health Survey |
| PNC | Postnatal care |
| CSA | Central Statistical Agency |
| MOH | Minster of Health |
| CIS | Confidence Interval |
| DHS | Demographic and Health Survey |
| SNNPR | Southern Nations, Nationalities, and People’s Region |
| BCC | Behavioural change communication |
References
- Tessema, G.A.; Laurence, C.O.; Melaku, Y.A.; Misganaw, A.; Woldie, S.A.; Hiruye, A.; Amare, A.T.; Lakew, Y.; Zeleke, B.M.; Deribew, A. Trends and causes of maternal mortality in Ethiopia during 1990–2013: Findings from the Global Burden of Diseases study 2013. BMC Public Health 2017, 17, 160. [Google Scholar] [CrossRef] [PubMed] [Green Version]
- WHO. Trends in Maternal Mortality: 1990–2015: Estimates from WHO, UNICEF, UNFPA, World Bank Group and the United Nations Population Division: Executive Summary; World Health Organization: Geneva, Switzerland, 2015. [Google Scholar]
- WHO. Trends in Maternal Mortality 2000 to 2017: Estimates by WHO, UNICEF. UNFPA, World Bank Group and the United Nations Population Division; World Health Organization: Geneva, Switzerland, 2019. [Google Scholar]
- WHO. Strategies towards Ending Preventable Maternal Mortality (EPMM); World Health Organization: Geneva, Switzerland, 2015. [Google Scholar]
- Bhutta, Z.A.; Das, J.K.; Bahl, R.; Lawn, J.E.; Salam, R.A.; Paul, V.K.; Sankar, M.J.; Blencowe, H.; Rizvi, A.; Chou, V.B.; et al. Can available interventions end preventable deaths in mothers, newborn babies, and stillbirths, and at what cost? Lancet 2014, 384, 347–370. [Google Scholar] [CrossRef]
- Ronsmans, C.; Graham, W.J. Maternal mortality: Who, when, where, and why. Lancet 2006, 368, 1189–1200. [Google Scholar] [CrossRef]
- WHO. WHO Recommendations on Postnatal Care of the Mother and Newborn; World Health Organization: Geneva, Switzerland, 2014. [Google Scholar]
- Lawn, J. Saving mothers and newborn live—The crucial first days after birth. In The State of the World’s Children; Unicef: New York, NY, USA, 2009; pp. 80–82. [Google Scholar]
- Mekonnen, T.; Dune, T.; Perz, J.; Ogbo, F.A. Trends and Determinants of Antenatal Care Service Use in Ethiopia between 2000 and 2016. Int. J. Environ. Res. Public Health 2019, 16, 748. [Google Scholar] [CrossRef] [Green Version]
- Bobo, F.T.; Yesuf, E.A.; Woldie, M. Inequities in utilization of reproductive and maternal health services in Ethiopia. Int. J. Equity Health 2017, 16, 105. [Google Scholar] [CrossRef] [PubMed] [Green Version]
- Regassa, N. Antenatal and postnatal care service utilization in southern Ethiopia: A population-based study. Afr. Health Sci. 2011, 11, 390–397. [Google Scholar]
- CSA Ethiopia; ICF International USA. Ethiopia: Demographic and Health Survey 2011; Central Statistical Agency: Addis Ababa, Ethiopia, 2012.
- Koblinsky, M.; Tain, F.; Tesfaye, S. Reducing maternal mortality and increasing use of skilled birth attendance: Ethiopia and Mdg-5. Ethiop. J. Reprod. Health 2018, 4. [Google Scholar]
- Sisay, M.M.; Geremew, T.T.; Demlie, Y.W.; Alem, A.T.; Beyene, D.K.; Melak, M.F.; Gelaye, K.A.; Ayele, T.A.; Andargie, A.A. Spatial patterns and determinants of postnatal care use in Ethiopia: Findings from the 2016 demographic and health survey. BMJ Open 2019, 9, e025066. [Google Scholar] [CrossRef]
- Wudineh, K.G.; Nigusie, A.A.; Gesese, S.S.; Tesu, A.A.; Beyene, F.Y. Postnatal care service utilization and associated factors among women who gave birth in Debretabour town, North West Ethiopia: A community-based cross-sectional study. BMC Pregnancy Childbirth 2018, 18, 508. [Google Scholar] [CrossRef]
- Bitew, T.; Hanlon, C.; Kebede, E.; Honikman, S.; Onah, M.N.; Fekadu, A. Antenatal depressive symptoms and utilisation of delivery and postnatal care: A prospective study in rural Ethiopia. BMC Pregnancy Childbirth 2017, 17, 206. [Google Scholar] [CrossRef] [Green Version]
- Akibu, M.; Tsegaye, W.; Megersa, T.; Nurgi, S. Prevalence and determinants of complete postnatal care service utilization in northern Shoa, Ethiopia. J. Pregnancy 2018, 2018. [Google Scholar] [CrossRef] [Green Version]
- Berhe, A.; Bayray, A.; Berhe, Y.; Teklu, A.; Desta, A.; Araya, T.; Zielinski, R.; Roosevelt, L. Determinants of postnatal care utilization in Tigray, Northern Ethiopia: A community based cross-sectional study. PLoS ONE 2019, 14, e0221161. [Google Scholar] [CrossRef] [PubMed] [Green Version]
- Fekadu, G.A.; Ambaw, F.; Kidanie, S.A. Facility delivery and postnatal care services use among mothers who attended four or more antenatal care visits in Ethiopia: Further analysis of the 2016 demographic and health survey. BMC Pregnancy Childbirth 2019, 19, 64. [Google Scholar] [CrossRef] [PubMed] [Green Version]
- Ayele, B.G.; Woldu, M.A.; Gebrehiwot, H.W.; Gebre-Egziabher, E.G.; Gebretnsae, H.; Hadgu, T.; Abrha, A.A.; Medhanyie, A.A. Magnitude and determinants for place of postnatal care utilization among mothers who delivered at home in Ethiopia: A multinomial analysis from the 2016 Ethiopian demographic health survey. Reprod. Health 2019, 16, 162. [Google Scholar] [CrossRef] [PubMed]
- Sustainable Development Goals Online. United Nations. Available online: http://www.un.org/sustainabledevelopment/sustainable-development-goals/ (accessed on 28 June 2019).
- Corsi, D.J.; Neuman, M.; Finlay, J.E.; Subramanian, S. Demographic and health surveys: A profile. Int. J. Epidemiol. 2012, 41, 1602–1613. [Google Scholar] [CrossRef]
- United Nations. World Population Prospects 2019; United Nations, Affairs DoEaS: New York, NY, USA, 2019. [Google Scholar]
- Central Statistical Agency [Ethiopia]; Inner City Fund International. Ethiopia Demographic and Health Survey 2016; Central Statistical Agency: Addis Ababa, Ethiopia, 2016. [Google Scholar]
- WHO. Postpartum Care of the Mother and Newborn: A practical Guide; WHO: Geneva, Switzerland, 1998.
- Neupane, S.; Doku, D. Utilization of postnatal care among Nepalese women. Matern. Child Health J. 2013, 17, 1922–1930. [Google Scholar] [CrossRef]
- Andersen, R.M. Revisiting the behavioral model and access to medical care: Does it matter? J. Health Soc. Behave. 1995, 36, 1–10. [Google Scholar] [CrossRef]
- Otundo Richard, M. WHO Recommendations on Antenatal Care for a Positive Pregnancy Experience in Kenya. SSRN 2019, 3449460. [Google Scholar] [CrossRef]
- Fekadu, G.A.; Kassa, G.M.; Berhe, A.K.; Muche, A.A.; Katiso, N.A. The effect of antenatal care on use of institutional delivery service and postnatal care in Ethiopia: A systematic review and meta-analysis. BMC Health Serv. Res. 2018, 18, 577. [Google Scholar] [CrossRef] [Green Version]
- Titaley, C.R.; Dibley, M.J.; Roberts, C.L. Factors associated with non-utilisation of postnatal care services in Indonesia. J. Epidemiol. Commun. Health 2009, 63, 827–831. [Google Scholar] [CrossRef] [PubMed]
- Tawfik, Y.; Rahimzai, M.; Ahmadzai, M.; Clark, P.A.; Kamgang, E. Integrating family planning into postpartum care through modern quality improvement: Experience from Afghanistan. Glob. Health Sci. Pract. 2014, 2, 226–233. [Google Scholar] [CrossRef] [Green Version]
- Tarekegn, S.M.; Lieberman, L.S.; Giedraitis, V. Determinants of maternal health service utilization in Ethiopia: Analysis of the 2011 Ethiopian Demographic and Health Survey. BMC Pregnancy Childbirth 2014, 14, 161. [Google Scholar] [CrossRef] [Green Version]
- Say, L.; Raine, R. A systematic review of inequalities in the use of maternal health care in developing countries: Examining the scale of the problem and the importance of context. Bull. World Health Organ. 2007, 85, 812–819. [Google Scholar] [CrossRef] [PubMed]
- Pearson, L.; Gandhi, M.; Admasu, K.; Keyes, E. User fees and matenity services in Ethiopia. Int. J. Gynaecol. Obstet. 2011, 115, 310–315. [Google Scholar] [CrossRef] [PubMed]
- Ahmed, S.; Creanga, A.A.; Gillespie, D.G.; Tsui, A.O. Economic status, education and empowerment: Implications for maternal health service utilization in developing countries. PLoS ONE 2010, 5, e11190. [Google Scholar] [CrossRef] [PubMed] [Green Version]


| Total Population | Urban | Rural | |||||||
|---|---|---|---|---|---|---|---|---|---|
| Variables | N | Prevalence (95%CI) | p Value | N | Prevalence (95%CI) | p Value | N | Prevalence (95%CI) | p Value |
| PNC Yes | 1744 | 9.82(9.03–10.6) | p < 0.001 | 636 | 9.8(9.03–10.6) | p < 0.001 | 1107 | 6.24(5.6–6.90) | p < 0.001 |
| No | 15,997 | 90.17(89.3–90.9) | p < 0.001 | 1132 | 90.17(89.3–90.9) | p < 0.001 | 14,864 | 90.17(89.3–90.9) | p < 0.00 |
| Predisposing factors | |||||||||
| Maternal education | |||||||||
| No education | 12,799 | 72 (72.5–73.6) | p < 0.001 | 575 | 32.5(28.5–36.8) | p < 0.001 | 12,223 | 76.5(75–78) | p < 0.001 |
| Primary | 4029 | 22.7(21.4–24.3) | 609 | 34.4(31–37.9) | 3421 | 21.4(20–23) | |||
| Secondary | 912 | 5.1(4.5–5.8) | 584 | 33(29.5–36.6) | 328 | 2(1.7–2.4) | |||
| Maternal working status | |||||||||
| Not working | 9753 | 57.8(55.9–59.6) | p < 0.001 | 902 | 51.2(46.8–55.5) | p = 0.142 | 8851 | 58.5(56.5–60.6) | p < 0.01 |
| Professional | 2146 | 12.7(11.6–13.8) | 604 | 34.2(30–38.7) | 1543 | 10(9.1–11.3) | |||
| Agricultural | 4968 | 29.4(27.6–31.3) | 256 | 14.5(11.2–18.6) | 4713 | 31(29.2–33.2) | |||
| Partner education | |||||||||
| No education | 9615 | 54.5(52.8–56.2) | p < 0.001 | 391 | 22.2(19.4–25.3) | p < 0.001 | 9224 | 58(56.3–59.8) | p < 0.001 |
| Primary | 6116 | 34.6(33.1–36.2) | 559 | 31.8(28.4–35.5) | 5557 | 35(33.3–36.6) | |||
| Secondary | 1906 | 10.8(9.9–11.7) | 805 | 45.8(41.9–49.8) | 1100 | 7(6.2–7.6) | |||
| Partner working status | |||||||||
| Not working | 567 | 3.25(2.7–3.8) | p < 0.001 | 91 | 5.3(3.7–7.5) | p = 0.052 | 477 | 3(2.4–3.6) | p < 0.001 |
| Professional | 1856 | 10.6(9.7–11.6) | 841 | 49.6(45.9–53.3) | 1015 | 6.4(5.8–7.1) | |||
| Agricultural | 14,990 | 86(84.9–87.1) | 762 | 45(41–48.9) | 14,227 | 90.5(89–91) | |||
| Household wealth index | |||||||||
| Poor | 10,289 | 60.2(58–62) | p < 0.001 | 110 | 6.5(4.6–9.19) | p < 0.001 | 10,179 | 66(63.9–68) | p < 0.001 |
| Middle | 4584 | 26.8(25.2–28.5) | 224 | 13.4(10.3–17.1) | 4360 | 28.2(26.5–30) | |||
| Rich | 2210 | 12.9(11.6–14.3) | 1338 | 80(76–83.5) | 871 | 5.6(4.8–6.5) | |||
| Mother’s age | |||||||||
| 15–24 | 5595 | 31.5(30.4–32.6) | p = 0.014 | 523 | 29.5(26–33.2) | p = 0.017 | 5072 | 31.7(30–32) | p = 0.189 |
| 25–34 | 8521 | 48(46.8–49.2) | 978 | 55.3(51.9–58.6) | 7543 | 47.2(46–48) | |||
| 35–49 | 3624 | 20.4(19.5–21.3) | 267 | 15(13.2–17.2) | 3356 | 21(20–22) | |||
| Marital status | |||||||||
| Never married | 109 | 0.61(0.46–0.81) | p = 0.003 | 33 | 1.86([1.2–2.8) | p = 0.209 | 76 | 0.47(0.33–0.67) | p = 0.040 |
| Currently married | 16,720 | 94.2(93.6–94.8) | 1579 | 89.3(86.6–91.5) | 15,140 | 94(94–95) | |||
| Formerly married | 911 | 5.13(4.6–5.7) | 156 | 8.8(6.7–11.3) | 755 | 4.7(4.2–5.3) | |||
| Reading magazine | |||||||||
| Yes | 358 | 7.79(7.12–8.51) | p < 0.001 | 261 | 14.9(12.4–17.8) | p < 0.001 | 94 | 0.59(0.44–0.79) | p < 0.001 |
| No | 1382 | 2.02(1.70–2.38) | 371 | 21(17.8–24.4) | 1011 | 6.33(5.71–7.01) | |||
| Need factors | |||||||||
| ANC visit | |||||||||
| None | 10,796 | 61(59.1–62.8) | p < 0.001 | 459 | 26.1(21.6–31.1) | p < 0.001 | 10,337 | 64.8(62.9–66.6) | p < 0.001 |
| 1–3 | 3901 | 22(20.9–23.2) | 436 | 24.8(21.4–28.5) | 3465 | 21.7(20.5–22.9) | |||
| Four or more | 3001 | 16.9(15.7–18.2) | 862 | 49(44.1–53.9) | 2140 | 13.4(12.2–14.6) | |||
| Place of delivery | |||||||||
| Home | 15,354 | 86.5(85–87.8) | p < 0.001 | 797 | 45(39.1–51) | p < 0.001 | 14,558 | 91(89.8–92.3) | p < 0.001 |
| Health facility | 2385 | 13.4(12.1–14.9) | 971 | 54.9(48.9–60.8) | 1414 | 8.8(7.7–10.1) | |||
| Type of delivery assist | |||||||||
| Health professional | 2468 | 13.9(12.5–15.3) | p < 0.001 | 1008 | 57(50.9–62.8) | p < 0.001 | 1461 | 9.1(7.9–10.4) | p < 0.001 |
| Traditional birth attendant (TBA) | 5493 | 30.9(29–32.8) | 362 | 20.4(16.4–25.2) | 5131 | 32(30.2–34) | |||
| Other non-health professional | 9779 | 55.1(53–57.1) | 398 | 22.5(18.6–26.9) | 9380 | 58(56–60) | |||
| Birth interval | |||||||||
| No previous birth | 3273 | 18.4(17.6–19.3) | p < 0.001 | 531 | 30.1(26.6–33.9) | p = 0.005 | 2741 | 17.1(16.3–18.03) | p < 0.001 |
| <24months | 2378 | 13.4(12.5–14.3) | 181 | 10.2(8.4–12.3) | 2197 | 13.7(12.8–14.7) | |||
| ≥24 months | 12,074 | 68(67–69) | 1050 | 59.5(55.5–63.5) | 11,024 | 69.0(67.9–70.1) | |||
| Enabling factors | |||||||||
| Accompany for medical help | |||||||||
| Big problem | 7798 | 59.1(57.2–61) | p < 0.001 | 483 | 33.1(29.1–37.3) | p = 0.138 | 7315 | 62.3(60.3–64.3) | p < 0.001 |
| Not a big problem | 5388 | 40.8(38.9–42.7) | 976 | 66.8(62.6–70.8) | 4412 | 37.6(35.6–39.6) | |||
| Distance from the health facility | |||||||||
| Big problem | 9226 | 69.9(67.9–71.8) | p < 0.001 | 402 | 27.6(23.9–31.6) | p = 0.013 | 8823 | 75.2([73.3–77.06) | p < 0.001 |
| Not a big problem | 3959 | 30(28.1–32) | 1054 | 72.3(68.4–76.03) | 2905 | 24.7(22.9–26.6) | |||
| Permission for medical help | |||||||||
| Big problem | 4790 | 36.3(34.4–38.3) | p < 0.001 | 260 | 17.8(14.4–21.7) | p = 0.234 | 4530 | 38.6([36.5–40.7) | p = 0.003 |
| Not a big problem | 8394 | 63.6(61.7–65.5) | 1195 | 82.16(78.2–85.5) | 7199 | 61.3(59.2–63.4) | |||
| Variables | Unadjusted OR | 95%CI | p Value | Adjusted OR | 95%CI | p Value |
|---|---|---|---|---|---|---|
| Predisposing Factors | ||||||
| Maternal education | ||||||
| No education | 1.00 | |||||
| Primary | 2.57 | 2.16–3.05 | p < 0.001 | 0.95 | 0.72–1.26 | p = 0.75 |
| Secondary | 11.8 | 9.50–14.7 | p < 0.001 | 1.19 | 0.80–1.77 | p = 0.388 |
| Maternal Working status | ||||||
| Not working | 1.00 | |||||
| Professional | 2.33 | 1.92–2.84 | p < 0.001 | 1.02 | 0.77–1.35 | p = 0.869 |
| Agricultural | 0.78 | 0.64–0.94 | p = 0.013 | 1.13 | 0.87–1.48 | p = 0.335 |
| Residence | ||||||
| Rural | 1.00 | |||||
| Urban | 6.77 | 4.22–9.65 | p < 0.001 | 2.99 | 1.43–3.45 | p = 0.003 |
| Father’s education | ||||||
| No education | 1.00 | |||||
| Primary | 1.53 | 1.28–1.83 | p < 0.001 | 0.96 | 0.74–1.25 | p = 0.781 |
| Secondary | 5.27 | 4.36–6.37 | p < 0.001 | 0.86 | 0.62–1.20 | p = 0.399 |
| Father’s working status | ||||||
| Not working | 1.00 | |||||
| Professional | 1.57 | 1.07–2.31 | p = 0.020 | 1.52 | 1.000094–2.34 | p = 0.050 |
| Agricultural | 0.37 | 0.26–0.53 | p < 0.001 | 1.32 | 0.904–1.943 | p = 0.149 |
| Household wealth index | ||||||
| Poor | 1.00 | |||||
| Middle | 1.92 | 1.58–2.33 | p < 0.001 | 1.25 | 0.970–1.628 | p = 0.083 |
| Rich | 7.71 | 6.34–9.38 | p < 0.001 | 1.57 | 1.12–2.20 | p = 0.008 |
| Mother’s age | ||||||
| 15–24 | 1.00 | |||||
| 25–34 | 1.07 | 0.91–1.26 | p = 0.349 | 1.042 | 0.784–1.385 | p = 0.774 |
| 35–49 | 0.80 | 0.65– 0.99) | p = 0.046 | 0.832 | 0.573–1.220 | p = 0.338 |
| Need factors | ||||||
| ANC visit | ||||||
| None | 1.00 | |||||
| 1–3 | 4.22 | 3.40–5.25 | p < 0.001 | 1.911 | 1.36–2.66 | p < 0.001 |
| Four or more | 12.1 | 9.92–14.9 | p < 0.001 | 1.10 | 2.15–4.21 | p < 0.001 |
| Place of delivery | ||||||
| Home | 1.00 | |||||
| Health facility | 22.8 | 18.8–27.6 | p < 0.001 | 2.56 | 1.048–6.25 | p = 0.039 |
| Type of delivery assist | ||||||
| Health professional | 1.00 | |||||
| TBA | 0.06 | 0.05–0.08 | p < 0.001 | 0.218 | 0.085–0.559 | p = 0.002 |
| Other non-health professional | 0.02 | 0.02– 0.03 | p < 0.001 | 0.149 | 0.058–0.383 | p < 0.001 |
| Birth interval | ||||||
| No previous birth | 1.00 | |||||
| <24months | 0.34 | 0.26–0.44 | p < 0.001 | 0.75 | 0.477–1.194 | p = 0.230 |
| ≥24 months | 0.56 | 0.48–0.66 | p < 0.001 | 1.28 | 0.919–1.795 | p = 0.141 |
| Enabling factors | ||||||
| Accompany for medical help | ||||||
| Big problem | 1.00 | |||||
| Not a big problem | 2.29 | 1.93–2.72 | p < 0.001 | 0.99 | 0.786–1.268 | p = 0.991 |
| Distance from the health facility | ||||||
| Big problem | 1.00 | |||||
| Not a big problem | 3.68 | 3.14–4.32 | p < 0.001 | 1.29 | 1.02–1.61 | p = 0.028 |
| Permission for medical help | ||||||
| Big problem | 1.00 | |||||
| Not a big problem | 1.79 | 1.48–2.17 | p < 0.001 | 0.92 | 0.705–1.208 | p = 0.563 |
| Urban Residence | Rural Residence | |||||||||||
|---|---|---|---|---|---|---|---|---|---|---|---|---|
| Variables | Unadjusted OR | 95%CI | p Value | Adjusted OR | 95%CI | p Value | Unadjusted OR | 95%CI | p value | Adjusted OR | 95%CI | p Value |
| Predisposing factor | ||||||||||||
| Maternal education | ||||||||||||
| No education | 1.00 | 1.00 | 1.00 | 1.00 | ||||||||
| Primary | 1.80 | 1.20–2.69 | p = 0.004 | 0.63 | 0.35–1.13 | p = 0.125 | 2.16 | 1.7–2.6 | p < 0.001 | 1.06 | 0.77–1.4 | p = 0.72 |
| Secondary | 4.00 | 2.73–5.85 | p < 0.001 | 0.89 | 0.50–1.59 | p = 0.711 | 6.47 | 4.3–9.5 | p < 0.001 | 1.29 | 0.6–2.4 | p = 0.44 |
| Maternal Working status | ||||||||||||
| Not working | 1.00 | 1.00 | 1.00 | 1.00 | ||||||||
| Professional | 1.27 | 0.91–1.79 | p = 0.156 | 1.08 | 0.69–1.70 | p = 0.714 | 1.73 | 1.32–2.26 | p < 0.001 | 0.97 | 0.69–1.37 | p = 0.90 |
| Agricultural | 0.74 | 0.41–1.31 | p = 0.305 | 1.16 | 0.57–2.35 | p = 0.680 | 0.93 | 0.75–1.15 | p = 0.524 | 1.12 | 0.84–1.49 | p = 0.423 |
| Father’s education | ||||||||||||
| No education | 1.00 | 1.00 | 1.00 | 1.00 | ||||||||
| Primary | 1.64 | 1.07–2.51 | p = 0.023 | 1.17 | 0.63–2.16 | p = 0.610 | 1.29 | 1.05–1.57 | p = 0.012 | 0.92 | 0.68–1.23 | p = 0.581 |
| Secondary | 2.92 | 2.07–4.11 | p < 0.001 | 1.37 | 0.76–2.46 | p = 0.291 | 2.45 | 1.83–3.28 | p < 0.001 | 0.72 | 0.47–1.10 | p = 0.132 |
| Father’s working status | ||||||||||||
| Not working | 1.00 | 1.00 | 1.00 | 1.00 | ||||||||
| Professional | 0.56 | 0.29 1.08 | p =0.085 | 1.00 | 0.46–2.15 | p = 0.998 | 1.43 | 0.90–2.26 | p = 0.12 | 1.95 | 1.12–3.38 | p = 0.017 |
| Agricultural | 0.47 | 0.24–0.90 | p = 0.025 | 1.03 | 0.49–2.17 | p = 0.934 | 0.512 | 0.33–0.77 | p = 0.001 | 1.55 | 0.97–2.48 | p = 0.066 |
| Marital status | ||||||||||||
| Never married | 1.00 | 1.00 | 1.00 | 1.00 | ||||||||
| Formerly married | 0.69 | 0.24–1.97 | p = 0.493 | 1.05 | 0.50–2.19 | p = 0.333 | 0.416 | 0.15–1.09 | p = 0.075 | 1.40 | 0.73–2.70 | p = 0.305 |
| Currently married | 1.08 | 0.45–2.59 | p = 0.857 | 0.36 | 0.14–0.91 | p = 0.032 | ||||||
| Household wealth index | ||||||||||||
| Poor | 1.00 | 1.00 | 1.00 | 1.00 | ||||||||
| Middle | 2.51 | 1.00–6.29 | p < 0.001 | 1.32 | 0.411–4.25 | p = 0.083 | 1.75 | 1.43–2.14 | p < 0.001 | 1.19 | 0.90–1.57 | p = 0.201 |
| Rich | 4.25 | 1.83–9.84 | p < 0.001 | 1.43 | 0.51–3.96 | p = 0.008 | 3.62 | 2.76–4.76 | p < 0.001 | 1.85 | 1.23–2.79 | p = 0.003 |
| Mother’s age | ||||||||||||
| 15–24 | 1.00 | 1.00 | 1.00 | 1.00 | ||||||||
| 25–34 | 1.50 | 1.06–2.11 | p = 0.020 | 1.17 | 0.70–1.95 | p = 0.774 | 0.86 | 0.70–1.05 | p = 0.150 | 1.03 | 0.71–1.49 | p = 0.873 |
| 35–49 | 0.98 | 0.62–1.55 | p = 0.961 | 0.57 | 0.25–1.29 | p = 0.338 | 0.81 | 0.63–1.03 | p = 0.096 | 0.96 | 0.62–1.49 | p = 0.888 |
| Need factors | ||||||||||||
| ANC visit | ||||||||||||
| None | 1.00 | 1.00 | 1.00 | 1.00 | ||||||||
| 1–3 | 3.09 | 1.79–5.34 | p < 0.001 | 0.77 | 0.39–1.50 | p < 0.001 | 3.88 | 3.04–4.97 | p < 0.001 | 2.27 | 1.55–3.32 | p < 0.001 |
| Four or more | 7.73 | 4.71–12.6 | p < 0.001 | 1.78 | 0.92–3.41 | p < 0.001 | 8.58 | 6.66–11.0 | p < 0.001 | 3.27 | 2.21–4.83 | p < 0.001 |
| Place of delivery | ||||||||||||
| Home | 1.00 | 1.00 | 1.00 | 1.00 | ||||||||
| Health facility | 9.89 | 6.56–14.9 | p < 0.001 | 2.11 | 0.63–7.01 | p = 0.039 | 20.5 | 16.2–25.8 | p < 0.001 | 2.68 | 0.81–8.86 | p = 0.105 |
| Type of delivery assist | ||||||||||||
| Health professional | 1.00 | 1.00 | 1.00 | 1.00 | ||||||||
| TBA | 0.086 | 0.05–0.14 | p < 0.001 | 0.185 | 0.053–0.648 | p = 0.008 | 0.078 | 0.06–0.10 | p < 0.001 | 0.22 | 0.06–0.76 | p = 0.017 |
| Other non-health professional | 0.084 | 0.04–0.015 | p < 0.001 | 0.181 | 0.046–0.706 | p = 0.014 | 0.031 | 0.02–0.04 | p < 0.001 | 0.14 | 0.04–0.51 | p = 0.002 |
| Birth interval | ||||||||||||
| No previous birth | 1.00 | 1.00 | 1.00 | 1.00 | ||||||||
| <24months | 0.43 | 0.26–0.70 | p = 0.001 | 0.953 | 0.45–2.01 | p = 0.901 | 0.407 | 0.29–0.56 | p < 0.001 | 0.67 | 0.37–1.20 | p = 0.186 |
| ≥24 months | 0.75 | 0.54–1.03 | p = 0.079 | 1.78 | 1.08–2.95 | p = 0.023 | 0.64 | 0.52–0.79 | p < 0.001 | 1.11 | 0.71–1.72 | p = 0.634 |
| Accompany for medical help | ||||||||||||
| Big problem | 1.00 | 1.00 | 1.00 | 1.00 | ||||||||
| Not a big problem | 1.27 | 0.92–1.76 | p = 0.139 | 0.89 | 0.59–1.35 | p = 0.605 | 1.87 | 1.51–2.32 | p < 0.001 | 1.02 | 0.75–1.38 | p = 0.883 |
| Distance from the health facility | ||||||||||||
| Big problem | 1.00 | 1.00 | 1.00 | 1.00 | ||||||||
| Not a big problem | 1.53 | 1.09–2.14 | p = 0.014 | 1.18 | 0.75–1.88 | p = 0.459 | 2.60 | 2.12–3.17 | p < 0.001 | 1.35 | 1.03–1.76 | p = 0.029 |
| Permission for medical help | ||||||||||||
| Big problem | 1.00 | 1.00 | 1.00 | 1.00 | ||||||||
| Not a big problem | 1.32 | 0.83–2.09 | p = 0.234 | 0.66 | 0.343–1.27 | p = 0.213 | 1.39 | 1.11–1.74 | p = 0.004 | 0.97 | 0.72–1.31 | p = 0.893 |
Publisher’s Note: MDPI stays neutral with regard to jurisdictional claims in published maps and institutional affiliations. |
© 2020 by the authors. Licensee MDPI, Basel, Switzerland. This article is an open access article distributed under the terms and conditions of the Creative Commons Attribution (CC BY) license (http://creativecommons.org/licenses/by/4.0/).
Share and Cite
Mekonnen, T.; Dune, T.; Perz, J.; Ogbo, F.A. Postnatal Care Service Utilisation in Ethiopia: Reflecting on 20 Years of Demographic and Health Survey Data. Int. J. Environ. Res. Public Health 2021, 18, 193. https://doi.org/10.3390/ijerph18010193
Mekonnen T, Dune T, Perz J, Ogbo FA. Postnatal Care Service Utilisation in Ethiopia: Reflecting on 20 Years of Demographic and Health Survey Data. International Journal of Environmental Research and Public Health. 2021; 18(1):193. https://doi.org/10.3390/ijerph18010193
Chicago/Turabian StyleMekonnen, Tensae, Tinashe Dune, Janette Perz, and Felix Akpojene Ogbo. 2021. "Postnatal Care Service Utilisation in Ethiopia: Reflecting on 20 Years of Demographic and Health Survey Data" International Journal of Environmental Research and Public Health 18, no. 1: 193. https://doi.org/10.3390/ijerph18010193
APA StyleMekonnen, T., Dune, T., Perz, J., & Ogbo, F. A. (2021). Postnatal Care Service Utilisation in Ethiopia: Reflecting on 20 Years of Demographic and Health Survey Data. International Journal of Environmental Research and Public Health, 18(1), 193. https://doi.org/10.3390/ijerph18010193