Abstract
The purposes of this study were: (1) to determine if smartphone-derived heart rate variability (HRV) could detect changes in training load during an overload microcycle and taper, and (2) to determine the reliability of HRV measured in the morning and measured immediately prior to the testing session. Twelve powerlifters (male = 10, female = 2) completed a 3-week resistance training program consisting of an introduction microcycle, overload microcycle, and taper. Using a validated smartphone application, daily measures of resting, ultra-short natural logarithm of root mean square of successive differences were recorded in the morning (LnRMSSDM) and immediately before the test session (LnRMSSDT) following baseline, post-overload, and post-taper testing. LnRMSSDM decreased from baseline (82.9 ± 13.0) to post-overload (75.0 ± 9.9, p = 0.019), while post-taper LnRMSSDM (81.9 ± 7.1) was not different from post-overload (p = 0.056) or baseline (p = 0.998). No differences in LnRMSSDT (p < 0.05) were observed between baseline (78.3 ± 9.0), post-overload (74.4 ± 10.2), and post-taper (78.3 ± 8.0). LnRMSSDM and LnRMSSDT were strongly correlated at baseline (ICC = 0.71, p < 0.001) and post-overload (ICC = 0.65, p = 0.010), whereas there was no relationship at post-taper (ICC = 0.44, p = 0.054). Bland–Altman analyses suggest extremely wide limits of agreement (Bias ± 1.96 SD) between LnRMSSDM and LnRMSSDT at baseline (4.7 ± 15.2), post-overload (0.5 ± 16.9), and post-taper (3.7 ± 15.3). Smartphone-derived HRV, recorded upon waking, was sensitive to resistance training loads across an overload and taper microcycles in competitive strength athletes, whereas the HRV was taken immediately prior to the testing session was not.
1. Introduction
Athlete monitoring is a strategy that many strength and conditioning coaches use to assess fatigue and adaptation with regard to training [1,2]. While intense training is a major physiological stressor experienced by athletes, other factors such as sleep, nutrition, and emotional state may add to the overall stress imposed. The accumulation of these stressors will require sufficient recovery, or else noticeable decreases in performance may be experienced [2]. An effective monitoring tool for athletes in training would need to be sensitive enough to detect important perturbations in homeostasis and provide adequate information needed to alter training loads to optimize recovery. Current methods of monitoring training loads can be classified by their ability to monitor internal or external load. External load represents the total work performed during training [1] and can be quantified using the training volume. Monitoring the external load has the potential to provide the feedback needed for making informed decisions; however, it lacks the ability to assess the physiological and psychological responses to training, which is referred to as internal load.
One physiological measure that is gaining popularity as a monitoring tool is heart rate variability (HRV). HRV is the variation in time intervals between consecutive heartbeats and provides a physiological marker of autonomic regulation [3]. The root mean square of successive R–R interval differences (RMSSD) is a parasympathetically-derived HRV marker that has been shown to be the most reliable metric of athletic monitoring. This non-invasive measure has been proposed to provide an objective assessment of training status [4,5,6] and training load [7,8,9]. Using HRV to monitor the recovery status or guide exercise prescription [10] has previously been limited to evaluation in laboratory settings because of the need for lengthy recording procedures and specialized equipment [11]. Recently, the development of portable smartphone applications capable of accurately measuring HRV in field settings has made this assessment more practical and cost-effective [12]. Previous research has demonstrated that smartphone-derived HRV is sensitive to detect changes in training loads in soccer players [7,8] and competitive swimmers [9]. For best results, it is recommended that athletes record HRV upon waking [4], though this approach may provide poor compliance. As such, it may be more practical to record HRV immediately prior to a training session. However, it is unknown if HRV measures taken prior to training will be as sensitive to a recovery marker compared to the recommended morning measures.
Furthermore, while HRV has been shown to be an effective, non-invasive tool to monitor fatigue and recovery in endurance and sport team athletes [6,7], investigations in strength athletes are limited. Chen and colleagues examined HRV in competitive weightlifters 72 h following a 2 h resistance training session [13]. Frequency-domain measures of HRV reflected recovery status and weightlifting performance following the training bout. While this indicates that HRV monitoring may be effective for objectively assessing fatigue and adaptation in strength athletes, the recording methods utilized in their study would be impractical for field application. Smart-phone derived HRV measures provide a more efficient and practical approach to monitoring athlete preparedness during periods of intensive resistance training; however, more research is warranted to determine the efficacy of this method. Additionally, smartphone applications allow for HRV measures to be recorded immediately before training, which could lead to better athlete compliance. For these reasons, smartphone-derived HRV appears to be an appealing monitoring tool for guiding the training process. Currently, it remains unknown whether HRV reflects the training and recovery state following a resistance training microcycle and taper. Furthermore, whether HRV measured prior to a training bout is as sensitive for monitoring recovery as the preferred method of measuring upon waking [4] remains to be elucidated. Therefore, the purposes of this study were two-fold: (1) to determine the effect of an overload microcycle and taper on smartphone-derived HRV; and (2) to examine the reliability between HRV measures taken upon waking and those taken just prior to training. We hypothesized that smartphone-derived HRV would decrease following the overload microcycle and return to baseline following the taper. Furthermore, we hypothesized that there would be a difference between morning HRV and pre-testing HRV, and that morning HRV would be a better indicator of daily preparedness.
2. Materials and Methods
2.1. Study Design
This study examined the effect of an intensified week of resistance training and taper on HRV and investigated the reliability between two HRV measures, immediately upon waking and immediately prior to a testing session. During the initial visit to the Exercise Physiology Lab, participants were familiarized with the HRV recording procedures. Additionally, written instructions were provided to ensure consistent measurement procedures. Participants completed a 3-week resistance training program consisting of introduction, overload, and taper microcycles. HRV measures were recorded at two time points on the 5th day of each microcycle. The first measurement was self-recorded by each participant upon waking and the second measurement was self-recorded with the help of a trained research assistant upon arriving at the training facility. In addition to measuring HRV, the participants completed a bench press one-repetition maximum (1RM) and bench press repetition-to-failure (RTF) assessment in order to determine the changes in sport-specific performance across overload and taper microcycles.
2.2. Participants
Fifteen powerlifters (men: n = 12; women: n = 3) were recruited to participate in this study; however, 3 participants (men: n = 2; women: n = 1) were excluded from the analysis due to noncompliance with the HRV measurement protocol. An a priori power analysis (G power; ANOVA: repeated measures) revealed that a minimum of 6 participants were necessary to detect a 3.9 unit (lnRMSSDx20) difference in HRV (effect size = 0.35, α = 0.05, power = 80%, correlation among variables = 0.85, non-centrality parameter = 14.7, critical F = 4.4). The effect size and correlation used in the analysis were extracted from Flatt et al. [8]. Twelve participants completed the study; 10 men (height: 179.4 ± 4.2 cm; body mass: 96.9 ± 11.3; body fat %: 23.3 ± 5.3; relative bench press 1RM: 1.5 ± 0.2) and 2 women (height: 164.1 ± 4.7 cm; body mass: 71.7 ± 12.6; body fat %: 33.8 ± 1.0; relative bench press 1RM: 0.8 ± 0.0). The participants were competitive powerlifters and recreational powerlifters. Competitive powerlifters were defined as individuals who have previously competed in a sanctioned powerlifting competition (n = 8), whilst recreational powerlifters (n = 4) were defined as those who had not competed, but performed each of the powerlifts (back squat, bench press, and deadlift) at least once a week with the intent of increasing exercise-specific maximal strength. Participants were recruited from the university and a local powerlifting training center. All participants were healthy, non-smoking volunteers who met the criteria for exercise participation according to American College of Sports Medicine guidelines [14]. To minimize any confounding effects associated with age-related differences in skeletal muscle recovery between younger and older individuals, participants were all between the ages of 18–40 years.
All prospective participants completed an exercise screening questionnaire, PAR-Q, and health history questionnaire to determine if they met the inclusion criteria and were healthy for study participation [14]. To qualify for inclusion in the study, the participants had to have at least one year of resistance training experience and meet the national qualifying requirements established by the United States Powerlifting Association [15]. The powerlifting totals comprised of the participant’s highest squat, bench press, and deadlift were gathered from a previous competition or test session. All experimental procedures were conducted in accordance with the Declaration of Helsinki and approved by the University Institutional Review Board (16-017-ME).
2.3. Procedures
During the initial visit, participants were informed of study procedures and provided written consent. After consent was obtained, the participants’ standing height was measured to the nearest 0.1 cm using a stadiometer (SECA 67310, SECA®, Chino, CA, USA) and the weight was measured to the nearest 0.1 kg using a digital scale (Tanita BWB-800, Tanita®, Arlington Heights, IL, USA). Body composition was assessed using dual-energy X-ray absorptiometry (Lunar Prodigy, General Electric Healthcare, Madison, WI, USA). Participants were provided with instruction regarding the resistance training program and performance measures administered during the study. Furthermore, participants were instructed on how to rate their perceived recovery and perceived exertion during the study.
Within one week after the initial visit, the participants reported to the weight training facility to begin the 3-week resistance training program. The introduction microcycle consisted of 3 non-consecutive days over a 5-day period using a total-body program (Table 1). Training loads were determined using the rating of perceived exertion (RPE) scale based on repetitions in reserve [16]. This scale has been validated as a method of gauging resistance training intensity in novice and experienced lifters [16]. All exercise sets during the introduction microcycle were performed between an RPE of 6 to 8. On the fifth day of the introduction week (BL), baseline performance assessments were performed before completing the third resistance training session.

Table 1.
Resistance training during introduction, overload, and taper microcycles.
Two days after baseline testing, the participants began an overload week of resistance training, with the purpose of overreaching. Resistance training was performed on 4 consecutive days using a total-body program (Table 1). Daily undulations in training volume and intensity were used to incorporate the high-load and high-volume training as a means to induce central and peripheral fatigue. All sets were performed using repetition maximums and training loads were adjusted to ensure all sets were performed to muscular exhaustion. On the fifth day of the overload week (PostOL), participants completed the same assessments administered during the initial baseline testing session. To minimize any confounding effects for the time of day, the participants completed the post-overload test session during the same time of day as the initial baseline testing. Following the post-overload test session, the participants received 48 h of rest before tapering.
The taper week consisted of two non-consecutive days of training over a 4-day period. Each day contained the same total body exercises used in the overload week; however, the total training volume was substantially reduced (Table 1). In an attempt to enhance performance, training intensity remained high during the taper [17,18]. Training loads were adjusted to 90% and 85% of the average load used during days 3 and 4, respectively, of the overload week. Post-taper performance measures were recorded on the fifth day of the taper week (PostTP). Each participant performed the same measures at the same time of day as performed during the BL and PostOL.
Prior to arrival at each performance testing session, the participants were instructed to refrain from caffeine for at least 12 h, and alcohol at least 24 h prior to testing. Before participating in the performance testing, the participants rated their perceptual recovery using the Perceived Recovery Status (PRS) scale. After indicating their perceived recovery, participants completed a full-body, dynamic warmup that was standardized for each session. All training sessions were monitored by a certified strength and conditioning specialist.
2.4. Heart Rate Variability (HRV)
Participants received the equipment needed to measure daily HRV during their initial visit. HRV was self-recorded using a smartphone application [12] with a pulse-wave finger sensor (PWFS) (ithleteTM, HRV Fit Ltd., Southampton, UK) that inserted into the headphone outlet of a smartphone or tablet device [19]. The smartphone application processed the R–R intervals and calculated the log-transformed root mean square of successive R–R intervals (LnRMSSD). For easier interpretation, the application multiplied the LnRMSSD by twenty to convert it to a value on a ~100-unit scale [12]. The application did not allow for the manual inspection of the R–R intervals, however, it was equipped with an irregular beat detection and a correction process [20].
Morning HRV (LnRMSSDM) was recorded upon waking and elimination. The PWFS was connected to the smartphone device and the participants’ left index finger was inserted into the PWFS. Following a brief stabilization period, a 55 s recording of HRV was taken in a seated position with the participant’s left hand within 20 cm of their chest. Participants were allowed to breathe at their own pace during the measurement period, since LnRMSSD has been shown to be consistent under paced or spontaneous breathing [21]. Pre-testing HRV (LnRMSSDT) was recorded using the same procedures as soon as participants arrived at the testing facility.
2.5. Internal and External Loads
The PRS scale ranges from 0 to 10 with 0–2 representing poor recovery and anticipating poor performance, 4–6 consisting of moderate recovery and expecting normal performance, and 7–10 representing high recovery and expecting increased performance [22]. The participants were informed of the purpose of the PRS scale and read specific instructions on how to interpret the scale. The PRS scale was used each day during each training and testing session to assess perceptual recovery. Training loads were determined by calculating the weekly volume load (sets × repetitions × load) for all resistance exercises performed. In addition to the volume load, training loads were quantified by collecting a session rating of perceived exertion (sRPE), a metric that is capable of quantifying a global rating of internal load [2]. Each participant reported their sRPE 15 min following the completion of the training session.
2.6. Assessment of Bench Press Performance
After the completion of a dynamic warmup, participants completed a 1RM bench press assessment. All bench press assessments were performed on an instrumented bench press (Forza Super Bench, Forza Strength Systems, Spokane Valley, WA, USA) using a 20.4 kg powerlifting competition barbell (Rogue Fitness, Columbus, OH, USA). Participants were instructed on how to perform the bench press to meet United States Powerlifting Association standards [15]. Hand position on the barbell was recorded for each participant and was maintained consistent for each trial. Participants began the assessment by performing five progressive warm-up sets in the bench press before attempting a 1RM. The first set consisted of 5 repetitions with an unloaded barbell, followed by 3 repetitions at 40%, 2 repetitions at 55%, and 1 repetition each at 70% and 85% of previously acquired 1RM. During each bench press attempt, the participants un-racked the barbell with assistance from a spotter. After receiving a secure hand off, the barbell was lowered to the chest and held motionless with a definite and visible pause. Once the primary investigator determined that the bar was motionless, a verbal “press” command was given and the participant proceeded to press the barbell to the lockout position. Participants were given verbal encouragement to press the barbell with maximal velocity on each repetition. The mean concentric velocity (MCV) was measured and recorded for each of the warm up repetitions using a linear position transducer (GymAware PowerTool, Kinematic Performance Technology, Canberra, Australia), which has been previously validated for measuring barbell velocity [23]. The MCV for the load–velocity profile was determined by averaging the mean velocities during the warm-up sets at 40%, 55%, 70%, and 85% 1RM and was used for analysis.
Two minutes after completing the one repetition at 85% of 1RM, the participants began 1RM bench press attempts. The weight for each attempt was selected by the primary investigator using measured repetition velocity and perceptual feedback (i.e., RPE) from the participant. The velocity feedback was used to objectively assess each attempt and subsequent loads were selected based on the reported ACV for competitive powerlifters in the bench press [24]. Additionally, a 1RM was determined based on the methods of Zourdos and colleagues [16]: (1) the participant reported a 10 RPE and the primary investigator agreed a subsequent attempt would not be successful with a 2.3 kg load increase or (2) the participant reported a 9 or 9.5 RPE followed by a failed attempt with a 2.3 kg load increase. If the participant failed to complete the concentric portion of the lift or did not pause on the chest, the attempt was deemed unsuccessful.
Ten minutes after a successful 1RM bench press, the participants completed a bench press RTF assessment with 70% of 1RM. Participants were instructed to adhere to the same bench press guidelines as performed during the 1RM attempts. Spotters were available to provide verbal encouragement and safely rack the bar as the participant reached muscular failure. Muscular failure was determined by the inability to complete the concentric phase of the bench press.
2.7. Data Analysis
Data were analyzed using SPSS Statistics version 23.0 (IBM Corporation, Armonk, NY, USA) and Jamovi (version 0.9, Sydney, Australia), and Excel Office 365 (Microsoft Corporation, Redmond, WA, USA). The Shapiro–Wilk test was used to assess data normality. A 2 × 3 repeated measures analysis of variance (ANOVA) was used to compare the mean differences between LnRMSSDM and LnRMSSDT across BL, PostOL, and PostTP. When appropriate, a Tukey post hoc analysis was used to determine where the mean differences occurred. A one-way repeated measures ANOVA was used to compare bench press 1RM, MCV, and RTF across BL, PostOL, and PostTP, and a Tukey post hoc analysis was used to determine where differences occurred. For the perceived measures (sRPE and PRS) and non-normally distributed data, a Friedman’s test was used to compare differences and pairwise comparisons with p-value adjustments were used for post hoc analyses. Cohen’s d effect sizes [25] were calculated and interpreted using the following thresholds: 0 to 0.2 (trivial), 0.2 to 0.6 (small), 0.6 to 1.2 (moderate), 1.2 to 2.0 (large), >2.0 (very large) [26].
Changes (Δ, post-test–pre-test) in outcome variables across microcycles were quantified and Pearson’s correlations were used to determine the relationship between ΔLnRMSSD and Δbench press performance. Intra-day reliability between LnRMSSDM and LnRMSSDT were analyzed using an intraclass correlation coefficient (ICC). The ICC and Pearson correlations were interpreted using the following thresholds: ≤0.30 (small), 0.31 to 0.49 (moderate), 0.50 to 0.69 (large), 0.70 to 0.89 (very large), and ≥0.90 (near perfect) [26]. Additionally, Bland–Altman plots were generated to assess the agreement between LNRMSSDM and LNRMSSDT at each of the time points [27]. Data are presented as mean ± standard deviation unless otherwise indicated, and the level of significance was set at p ≤ 0.05.
3. Results
3.1. Internal and External Load Comparisons
External loads and internal loads during the introduction, overload, and taper microcycles are displayed in Table 2. There was a significant main effect for the total training volume (p < 0.001). The training volume during the overload was higher than the introduction microcycle (p < 0.001, d = 3.41) and taper microcycle (p < 0.001, d = 3.85). During the taper, the total volume load was lower than the introduction (p < 0.001, d = −0.64). There was a significant main effect for the session perceived exertion (p < 0.001). Overload sRPE values were higher than introduction values (d = 3.36) and taper microcycle (p < 0.001, d = 4.17). During the taper, the sRPE values were lower compared to the introduction (p < 0.001, d = −1.24). There was a significant main effect for perceived recovery (p < 0.001). PRS scores at PostOL were lower than BL (p < 0.001, d = −1.76) and PostTP (p < 0.001, d = −2.37). At PostTP, PRS was higher compared to BL (p < 0.001, d = 1.21).
Table 2.
The comparison of the external load, internal load, heart rate variability and bench press performance across microcycles (n = 12).
3.2. Inter-Day LnRMSSD Comparisons
Means and SDs for LnRMSSDM and LnRMSSDT across each time point are presented in Table 2. There was no condition × time interaction (p = 0.363; n2p = 0.088) and no main effect for condition (p = 0.090, n2p = 0.239). There was a significant main effect for time (p = 0.007; n2p = 0.363). LnRMSSDM at PostOL was lower than BL LnRMSSDM (p = 0.019, d = −0.68). PostTP LnRMSSDM was not different from PostOL (p = 0.056, d = 0.80) and BL (p = 0.998, d = −0.10). Compared to BL, LnRMSSDT was not different from PostOL (p = 0.590, d = −0.41) or PostTP (p = 1.000, d = 0.00). There was no change in LnRMSSDT between PostOL and PostTP (p = 0.590, d = 0.43). Figure 1 displays individual changes of LnRMSSDM and LnRMSSDT during BL, PostOL, and PostTP.
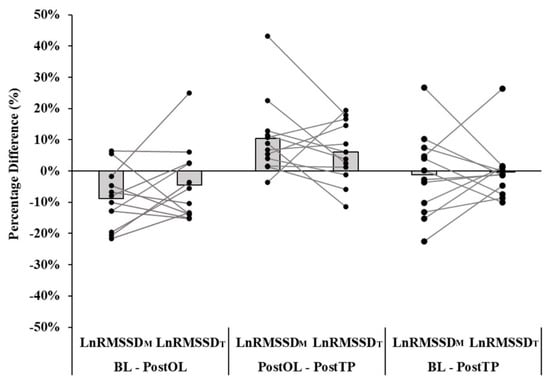
Figure 1.
Individual changes in the natural logarithm of root mean square of successive R–R interval differences during the morning (LnRMSSDM) and pre-testing (LnRMSSDT) time points between baseline (BL), post-overload (PostOL), and post-taper (PostTP) test days.
3.3. Intra-Day LnRMSSD Comparisons
LnRMSSDM and LnRMSSDT showed large to very large correlations at BL (ICC = 0.71, 95% CI: 0.25–0.91, p < 0.001) and PostOL (ICC = 0.65, 95% CI: 0.14–0.89, p = 0.010). LnRMSSDM and LnRMSSDT were not related at PostTP (ICC = 0.44, 95% CI: −0.09–0.79, p = 0.054). Bland–Altman plots are presented in Figure 2. The constant error (CE) between LnRMSSDM and LnRMSSDT at BL was 4.7 units (lnRMSSDx20) and the 95% limits of agreement varied from −10.6 to 19.9. At PostOL, the CE between LnRMSSDM and LnRMSSDT was 0.5 units and the 95% limits of agreement ranged from −16.4 to 17.5. The CE between LnRMSSDM and LnRMSSDT at PostTP was 3.7 units and the 95% limits of agreement ranged from −11.7 to 19.0.
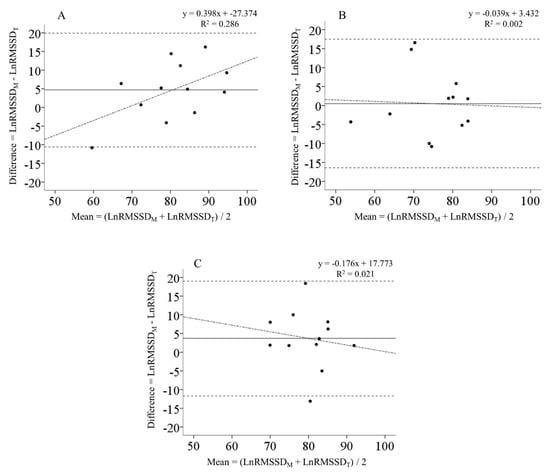
Figure 2.
Bland–Altman plots comparing heart rate variability recorded upon waking (LnRMSSDM) and heart rate variability recorded upon arriving at the training facility (LnRMSSDT) during the (A) baseline, (B) post-overload, and (C) post-taper test sessions. The solid lines represent the mean bias while the horizontal dashed lines represent the 95% limits of agreement. The dashed-dotted regression lines represent the trend between the differences and means.
3.4. Bench Press Performance Comparisons
Bench press 1RM, MCV, and RTF during the introduction, overload, and taper microcycles are displayed in Table 2. There was a significant main effect for bench press 1RM (p < 0.001, n2p = 0.672). There was no difference in 1RM between BL and PostOL (p = 0.262, d = −0.05). Following the taper, 1RM increased above BL (p < 0.001, d = 0.15) and PostOL (p < 0.001, d = 0.21). There was a significant main effect for bench press MCV (p < 0.001, n2p = 0.478). Following the overload, MCV was lower than BL (p = 0.003, d = −0.73). MCV at PostTP increased above PostOL (p = 0.002, d = 0.74), but was not different from BL (p = 0.956, d = 0.13). There was a significant main effect for bench press RTF (p < 0.001, n2p = 0.666). There was no difference in RTF between BL and PostOL (p = 0.099, d = −0.58). The total repetitions completed at PostTP were higher than BL (p < 0.001, d = 0.96) and PostOL (p < 0.001, d = 1.36).
There were no significant associations between ΔLnRMSSDM and Δ1RM, ΔMCV, ΔRTF between BL, PostOL, and PostTP (p = 0.087–0.981). Furthermore, ΔLnRMSSDT was not associated with Δ1RM, ΔMCV, ΔRTF across any microcycles (p = 0.094–0.871). Correlation coefficients are presented in Table 3.
Table 3.
Correlation coefficients for changes (Δ) in LnRMSSD and bench press performance across microcycles.
4. Discussion
This study evaluated the changes in smartphone-derived LnRMSSD taken upon awakening in the morning and right before performance testing on three days: (1) before and (2) following a microcycle of overload training and (3) following a taper microcycle in competitive powerlifters. The primary findings were that LnRMSSDM decreased following the overload and returned to baseline following the taper; however, there was no change in LnRMSSDT across each of the test sessions.
The overload microcycle consisted of high-volume and high-intensity resistance training utilizing multi-joint exercises of squat, bench press, and deadlift. Previous investigations have demonstrated that this type of training can cause tremendous homeostatic perturbations that may lead to decrements in performance [28], which may be referred to as overreaching [18]. Raeder et al. found that 6 days of intensified resistance training produced increases in muscle damage indicated by significantly elevated creatine kinase concentrations [28]. Repetitive muscle contractions occurring during high-load, high volume, resistance training can compromise muscle fiber integrity involving damage of the sarcomeres and contractile proteins. Chen et al. noted a significant increase in muscle soreness and creatine kinase following an intense resistance training session in a group of competitive weightlifters [13]. Additionally, the participants’ experienced a significant decrease in HRV (high frequency spectral power) 24 h post-training.
In the present study, a 4-day overload microcycle was associated with a reduction in LnRMSSDM values compared to BL. While no physiological markers of muscle damage were taken, participants reported significantly lower PRS scores indicating poor recovery and expected decreases in performance. In the investigation by Chen et al., a significant reduction in HRV (high frequency) was mirrored by a non-significant 3 kg decrease in back squat performance 24 h following the training session [13]. Similarly, the present study observed that LnRMSSDM mirrored the changes in bench press performance. The overload microcycle had a large decrease in MCV and a very large decrease in RTF. Flatt and colleagues demonstrated that a high-volume training session produced a very large decrease in perceived recovery and bench press velocity, while supine LnRMSSD experienced a small decrease 24 h following training [29]. While the MCV and RTF were suppressed following the overload, bench press 1RM was unchanged. The discrepancy between changes in bench press velocity and 1RM may be explained by previous observations noting that measures of velocity and power tend to decrease earlier than measures of maximal strength following intensified resistance training. A 3-week high-intensity resistance training program increased 9.6 m sprint times by 6.3% while back squat 1RM increased by 16.0% in resistance-trained males [30]. It is speculated that a longer duration of overload, such as in previous investigations [28], may have produced decrements in maximal strength.
The taper period consisted of reduced training volume and intensity to allow for fatigue dissipation and recovery [17]. During the taper, total volume load and sRPE were significantly lower than overload values. The very large load reduction produced a large increase in LnRMSSDM above overload values. Additionally, a very large increase in participants’ PRS indicated better perceived recovery. Bench press performance mirrored changes in LnRMSSDM, as PostTP 1RM, MCV, and RTF were higher than at PostOL. These findings support the results of Chen et al. wherein HRV and weightlifting performance increased following a recovery period [13]. While similar results were observed in the present study, HRV measurements recorded by Chen et al. consisted of 5 min measures utilizing an electrocardiogram. In the present study, HRV was measured via a PWFS and smartphone application which highlights the practicality of the field device.
Advances in technology allow for more practical athlete monitoring. Smartphone-derived LnRMSSD allows for HRV monitoring to be utilized by coaches and athletes in the field. It has been suggested that HRV measurements be recorded upon waking [4]; however, this approach may not be the most practical. For instance, upon-waking measures require each athlete to have the necessary equipment needed (i.e., heart rate monitor and smartphone/tablet) to record the HRV. An additional concern with upon-waking-measures is the difficulty in daily compliance experienced with most self-recorded measures [31]. Therefore, smartphone-derived LnRMSSD measurements recorded upon arriving at the training facility could be more practical than measures performed upon waking.
During baseline and overload testing, LnRMSSDM and LnRMSSDT showed very large to large correlations, while no significant association was seen at PostTP. Additionally, Bland–Altman plots showed extremely wide limits of agreement between LnRMSSDM and LnRMSSDT, suggesting large individual errors between measurements. Our results conflict with a previous investigation by Nakamura et al. wherein they found a very high reliability of intra-day LnRMSSD measures [32]. However, in their study, intra-day LnRMSSD measures were recorded only 10 min apart and LnRMSSD measures were captured using a portable heart rate monitor and assessed using HRV computer software. In the present study, the time difference between LnRMSSDM and LnRMSSDT for some participants was as large as 10 h. During this time, the participants may have been exposed to non-training related stressors (i.e., academic or work stress) that could have influenced the relationship between LnRMSSDT and LnRMSSDM. It appeared that LnRMSSDM was more sensitive to changes in the training loads than LnRMSSDT. Therefore, it is recommended that smartphone-derived LnRMSSD should be recorded upon waking, as this method is most sensitive to changes in resistance training loads.
Previous studies have demonstrated that ultra-short, smartphone-derived LnRMSSD were sensitive to changes in the training loads in competitive athletes [7,8,9]. In collegiate female soccer players, a very large increase (ES = 2.26) in training load resulted in a small decrease (ES = −0.29 to 0.37) in weekly LnRMSSD values [7]. Similarly, a 20% increase in training load during an overload week resulted in a 5.5% decrease in LnRMSSD in collegiate sprint swimmers [9]. However, no performance measures were provided to compare to the changes in HRV. The current study is the first study to examine the effect of smartphone-derived LnRMSSD in powerlifters. The results of this study suggest that smartphone-derived LnRMSSD is sensitive to changes in resistance training loads at the group level; however, individual responses showed high variability. Changes in LnRMSSD were not associated with changes in bench press 1RM, MCV, or RTF across each of the microcycles. Similarly, Flatt et al. found no significant associations between ΔLnRMSSD and Δcounter-movement jump peak power, Δback squat MCV, and Δbench press MCV [29]. Collectively, these findings suggest that individual measures of LnRMSSD may not accurately predict changes in performance. Thus, athletes and coaches should practice caution when using LnRMSSD to autoregulate training.
A potential limitation of this study is that the participants’ previous training methods and recovery status were not determined prior to the introduction microcycle. This may account for some of the intra-individual differences that existed in response to the standardized training program. During the screening process, participants were excluded if they had peaked for a competition within the past 4 weeks, and all participants included in the study were instructed to refrain from any additional exercise.
The present study examined changes in smartphone-derived LnRMSSD following a 4-day overload and one-week taper. Training strategies for intermediate to advanced strength athletes may include multiple overload weeks before tapering. Thus, future research is warranted to examine weekly changes in smartphone-derived HRV during resistance training programs with longer periods of overload. This approach would allow for calculations of weekly HRV mean and a coefficient of variation. The coefficient of variation of the weekly mean LnRMSSD has been shown to be useful in assessing how individual athletes respond to training [7,9]. Therefore, future investigations should evaluate weekly changes in the LnRMSSD mean and coefficient of variation across a resistance training program consisting of multiple weeks of overload followed by a taper. Furthermore, future research should investigate performance outcomes following a fixed resistance training program compared to an autoregulated program guided by smartphone-derived HRV measures.
5. Conclusions
In the current study, smartphone-derived LnRMSSD, recorded upon waking, was sensitive to changes in training load across the overload and taper microcycles. Similarly, bench press performance mirrored the pattern in LnRMSSDM. LnRMSSDT was not different across microcycles and the effect sizes were smaller compared to the changes in LnRMSSDM. In addition, large individual differences existed between LnRMSSDM and LnRMSSDT at each of the three time points. This suggests that LnRMSSD recordings later in the day should be used with caution if seeking a surrogate to the preferred morning measures. Therefore, smartphone-derived HRV, recorded upon waking, is a non-invasive method of determining preparedness in a group of strength athletes during periods of intensified training. Coaches can use the team data to determine the internal strain imposed on the athletes from training and autoregulate training as warranted. A substantial decline in HRV would provide an early indication of excessive fatigue and a potential decline in performance. Thus, the coach can adjust the team’s training loads to allow for adequate recovery and monitor HRV until it returns to baseline values. While the current study demonstrates that smartphone-derived HRV can provide meaningful data for monitoring team preparedness, the high variability of individual responses in the current study suggests that coaches should be cautious of using smartphone-derived HRV to autoregulate training on an individual basis.
Author Contributions
Conceptualization, T.D.W. and M.R.E.; data curation, T.D.W.; formal analysis, T.D.W. and M.R.E.; investigation, T.D.W., M.R.E., M.V.F. and P.A.B.; methodology, T.D.W., M.R.E., M.V.F. and P.A.B.; project administration, T.D.W.; supervision, M.R.E. and P.A.B.; writing—original draft, T.D.W.; writing—review and editing, T.D.W., M.R.E., M.V.F. and P.A.B. All authors have read and agreed to the published version of the manuscript.
Funding
This research received no external funding.
Institutional Review Board Statement
The study was conducted according to the guidelines of the Declaration of Helsinki, and approved by the Institutional Review Board of The University of Alabama (#16-017-ME, 8 September 2016).
Informed Consent Statement
Informed consent was obtained from all subjects involved in the study.
Data Availability Statement
No new data were created or analyzed in this study. Data sharing is not applicable to this article.
Acknowledgments
The authors thank the participants for volunteering their time and effort to this study. We also thank Strong Inc. 24-h Gym for allowing us access to the training facility. Materials used in this study for HRV analysis (i.e., PWFS and ithleteTM applications) were provided by HRV Fit Ltd.
Conflicts of Interest
The authors declare no conflict of interest. The funders had no role in the design of the study; in the collection, analyses, or interpretation of data; in the writing of the manuscript, or in the decision to publish the results.
References
- Halson, S.L. Monitoring training load to understand fatigue in athletes. Sports Med. 2014, 44, 139–147. [Google Scholar] [CrossRef] [PubMed]
- Scott, B.R.; Duthie, G.M.; Thornton, H.R.; Dascombe, B.J. Training monitoring for resistance exercise: Theory and applications. Sports Med. 2016, 46, 687–698. [Google Scholar] [CrossRef] [PubMed]
- Achten, J.; Jeukendrup, A.E. Heart rate monitoring. Sports Med. 2003, 33, 517–538. [Google Scholar] [CrossRef] [PubMed]
- Buchheit, M. Monitoring training status with HR measures: Do all roads lead to Rome. Front. Physiol. 2014, 27, 73. [Google Scholar] [CrossRef]
- Esco, M.; Flatt, A.; Nakamura, F. Initial weekly HRV response is related to the prospective change in VO2max in female soccer players. Int. J. Sports Med. 2016, 37, 436–441. [Google Scholar] [CrossRef]
- Tian, Y.; He, Z.-H.; Zhao, J.-x.; Tao, D.-L.; Xu, K.-Y.; Earnest, C.P.; Mc Naughton, L.R. Heart rate variability threshold values for early-warning nonfunctional overreaching in elite female wrestlers. J. Strength Cond. Res. 2013, 27, 1511–1519. [Google Scholar] [CrossRef]
- Flatt, A.A.; Esco, M.R. Smartphone-derived heart-rate variability and training load in a female soccer team. Int. J. Sports Physiol. Perform. 2015, 10, 994–1000. [Google Scholar] [CrossRef]
- Flatt, A.A.; Esco, M.R.; Nakamura, F.Y. Individual heart rate variability responses to preseason training in high level female soccer players. J. Strength Cond. Res. 2016, 31, 531–538. [Google Scholar] [CrossRef]
- Flatt, A.A.; Hornikel, B.; Esco, M.R. Heart rate variability and psychometric responses to overload and tapering in collegiate sprint-swimmers. J. Sci. Med. Sport 2016, 20, 606–610. [Google Scholar] [CrossRef]
- Kiviniemi, A.M.; Hautala, A.J.; Kinnunen, H.; Nissila, J.; Virtanen, P.; Karjalainen, J.; Tulppo, M.P. Daily exercise prescription on the basis of HR variability among men and women. Med. Sci. Sports Exerc. 2010, 42, 1355–1363. [Google Scholar] [CrossRef]
- Esco, M.R.; Flatt, A.A. Ultra-short-term heart rate variability indexes at rest and post-exercise in athletes: Evaluating the agreement with accepted recommendations. J. Sports Sci. Med. 2014, 13, 535–541. [Google Scholar] [PubMed]
- Flatt, A.A.; Esco, M.R. Validity of the ithleteTM smart phone application for determining ultra-short-term heart rate variability. J. Hum. Kinet. 2013, 39, 85–92. [Google Scholar] [CrossRef] [PubMed]
- Chen, J.-L.; Yeh, D.-P.; Lee, J.-P.; Chen, C.-Y.; Huang, C.-Y.; Lee, S.-D.; Chen, C.-C.; Kuo, T.B.; Kao, C.-L.; Kuo, C.-H. Parasympathetic nervous activity mirrors recovery status in weightlifting performance after training. J. Strength Cond. Res. 2011, 25, 1546–1552. [Google Scholar] [CrossRef] [PubMed]
- American College of Sports Medicine. ACSM’s Guidelines fo Exercise Testing and Prescription; Lippincott Williams & Wilkins: Philadelphia, PA, USA, 2017. [Google Scholar]
- The United States Powerlifting Association. Available online: http://www.uspa.net/ (accessed on 20 May 2016).
- Zourdos, M.C.; Klemp, A.; Dolan, C.; Quiles, J.M.; Schau, K.A.; Jo, E.; Helms, E.; Esgro, B.; Duncan, S.; Merino, S.G. Novel resistance training-specific rating of perceived exertion scale measuring repetitions in reserve. J. Strength Cond. Res. 2016, 30, 267–275. [Google Scholar] [CrossRef]
- Murach, K.A.; Bagley, J.R. Less is more: The physiological basis for tapering in endurance, strength, and power athletes. Sports 2015, 3, 209–218. [Google Scholar] [CrossRef]
- Halson, S.L.; Jeukendrup, A.E. Does overtraining exist? Sports Med. 2004, 34, 967–981. [Google Scholar] [CrossRef]
- Heathers, J.A. Smartphone-enabled pulse rate variability: An alternative methodology for the collection of heart rate variability in psychophysiological research. Int. J. Psychophysiol. 2013, 89, 297–304. [Google Scholar] [CrossRef]
- Wegerif, S.C. Method, System and Software Product for the Measurement of Heart Rate Variability. U.S. Patent 8,666,482, 4 March 2014. [Google Scholar]
- Saboul, D.; Pialoux, V.; Hautier, C. The impact of breathing on HRV measurements: Implications for the longitudinal follow-up of athletes. Eur. J. Sport Sci. 2013, 13, 534–542. [Google Scholar] [CrossRef]
- Laurent, C.M.; Green, J.M.; Bishop, P.A.; Sjökvist, J.; Schumacker, R.E.; Richardson, M.T.; Curtner-Smith, M. A practical approach to monitoring recovery: Development of a perceived recovery status scale. J. Strength Cond. Res. 2011, 25, 620–628. [Google Scholar] [CrossRef]
- Hori, N.; Andrews, W. Reliability of velocity, force and power obtained from the Gymaware optical encoder during countermovement jump with and without external loads. J. Aust. Strength Cond. 2009, 17, 12–17. [Google Scholar]
- Helms, E.R.; Storey, A.; Cross, M.R.; Brown, S.R.; Lenetsky, S.; Ramsay, H.; Dillen, C.; Zourdos, M.C. RPE and velocity relationships for the back squat, bench press, and deadlift in powerlifters. J. Strength Cond. Res. 2016, 31, 292–297. [Google Scholar] [CrossRef]
- Cohen, J. Statistical Power Analysis for the Behavioral Sciences; Lawrence Earlbaum Associates: Hillsdale, NJ, USA, 1988; Volume 2. [Google Scholar]
- Hopkins, W.; Marshall, S.; Batterham, A.; Hanin, J. Progressive statistics for studies in sports medicine and exercise science. Med. Sci. Sports Exerc. 2009, 41, 3–13. [Google Scholar] [CrossRef] [PubMed]
- Bland, J.M.; Altman, D. Statistical methods for assessing agreement between two methods of clinical measurement. Lancet 1986, 327, 307–310. [Google Scholar] [CrossRef]
- Raeder, C.; Wiewelhove, T.; Simola, R.Á.D.P.; Kellmann, M.; Meyer, T.; Pfeiffer, M.; Ferrauti, A. Assessment of fatigue and recovery in male and female athletes after 6 days of intensified strength training. J. Strength Cond. Res. 2016, 30, 3412–3427. [Google Scholar] [CrossRef]
- Flatt, A.A.; Globensky, L.; Bass, E.; Sapp, B.L.; Riemann, B.L. Heart Rate Variability, Neuromuscular and Perceptual Recovery Following Resistance Training. Sports 2019, 7, 225. [Google Scholar] [CrossRef]
- Fry, A.C.; Webber, J.M.; Weiss, L.W.; Fry, M.D.; Li, Y. Impaired performances with excessive high-intensity free-weight training. J. Strength Cond. Res. 2000, 14, 54–61. [Google Scholar]
- Plews, D.J.; Laursen, P.B.; Meur, Y.L.; Hausswirth, C.; Kilding, A.E.; Buchheit, M. Monitoring training with heart-rate variability: How much compliance is needed for valid assessment? Int. J. Sports Physiol. Perform. 2014, 9, 783–790. [Google Scholar] [CrossRef]
- Nakamura, F.Y.; Pereira, L.A.; Esco, M.R.; Flatt, A.A.; Moraes, J.E.; Abad, C.C.C.; Loturco, I. Intraday and interday reliability of ultra-short-term heart rate variability in rugby union players. J. Strength Cond. Res. 2016, 31, 548–551. [Google Scholar] [CrossRef]


Publisher’s Note: MDPI stays neutral with regard to jurisdictional claims in published maps and institutional affiliations. |
© 2020 by the authors. Licensee MDPI, Basel, Switzerland. This article is an open access article distributed under the terms and conditions of the Creative Commons Attribution (CC BY) license (http://creativecommons.org/licenses/by/4.0/).