A Scoping Review of Spatial Analysis Approaches Using Health Survey Data in Sub-Saharan Africa


Abstract
:1. Introduction
2. Methods
2.1. Eligibility Criteria
2.2. Search Methods
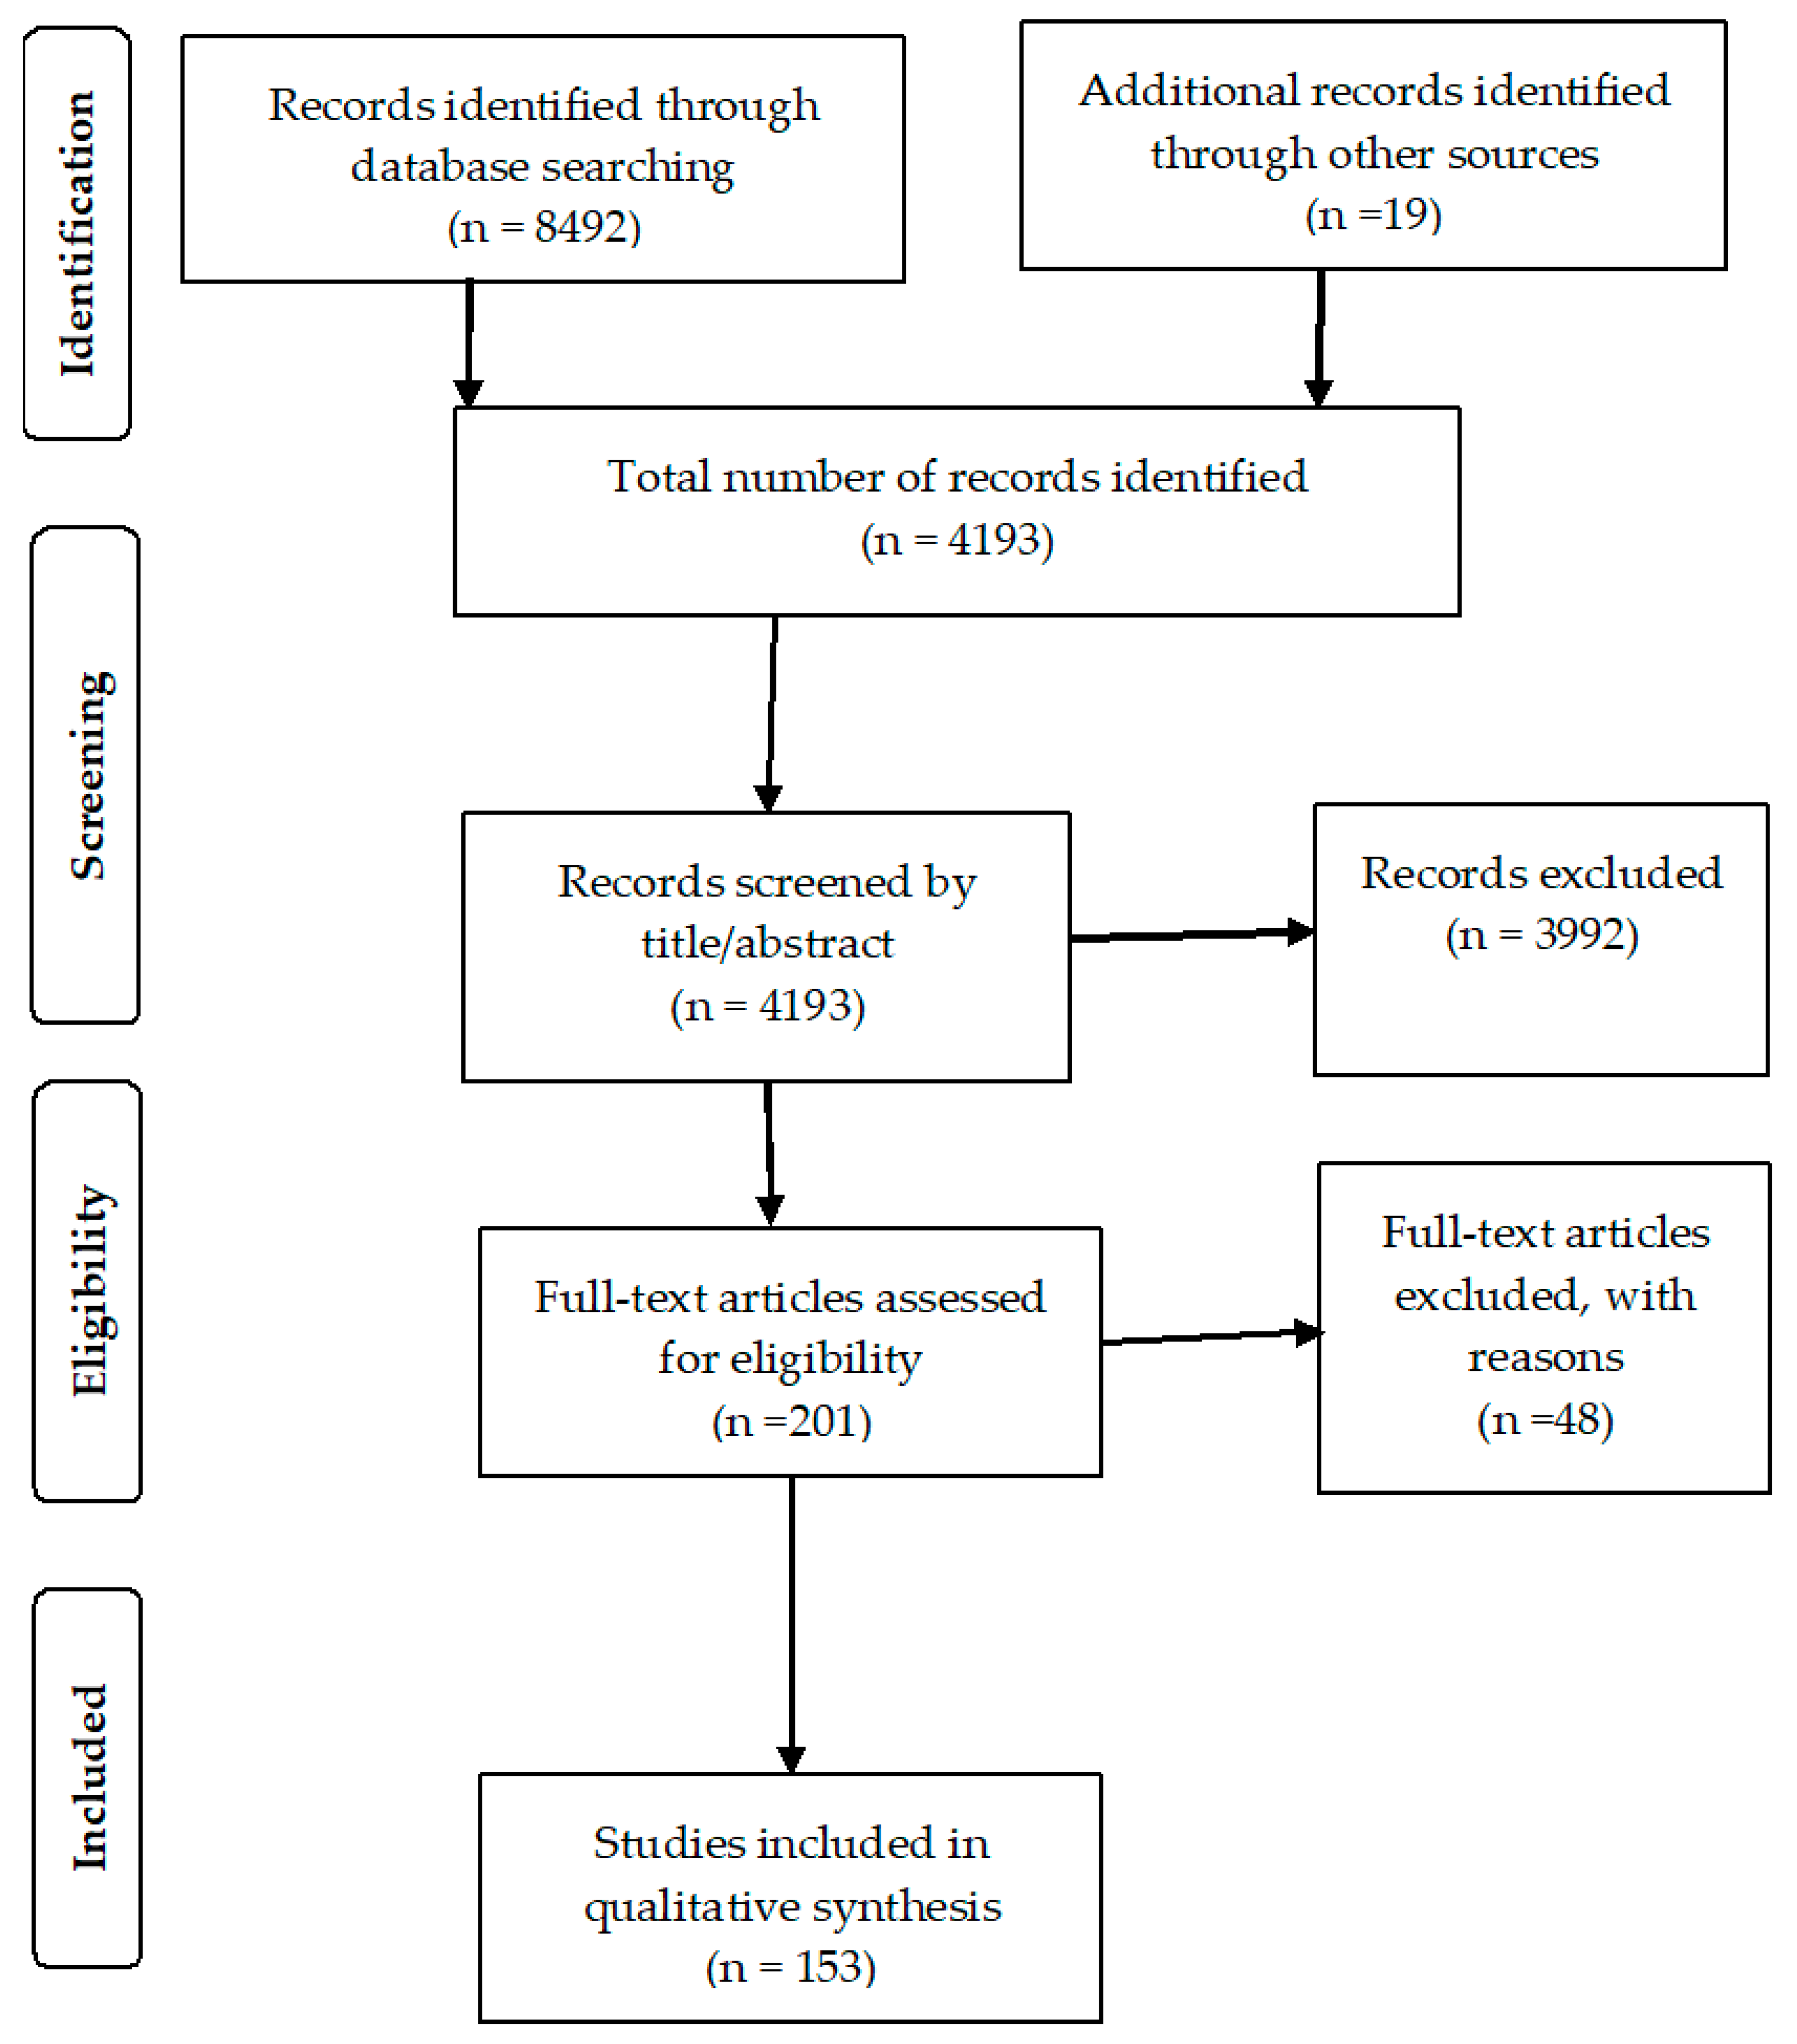
2.3. Study Selection
2.4. Data Extraction
3. Results
3.1. Study Characteristics
3.2. Spatial Methods Used
3.3. Spatial Autocorrelation/Clustering
3.4. Spatial Modelling and Prediction
3.5. Spatial Methods Used
3.6. Health Discipline and Themes
3.7. Demography
4. Discussion
4.1. Limitations
4.2. Strengths
4.3. Recommendations
5. Conclusions
Supplementary Materials
Author Contributions
Acknowledgments
Conflicts of Interest
References
- Cressie, N.; Wikle, C.K. Statistics for Spatio-Temporal Data; Wiley: Hoboken, NJ, USA, 2011. [Google Scholar]
- Bergquist, R.; Manda, S. The world in your hands: GeoHealth then and now. Geospat. Health 2019, 14, 3–16. [Google Scholar] [CrossRef] [PubMed] [Green Version]
- United Nations Department of Economic and Social Affairs (UN DESA). The Sustainable Development Goals Report 2016; UN: New York, NY, USA, 2016. [Google Scholar]
- Abekah-Nkrumah, G. Spatial variation in the use of reproductive health services over time: A decomposition analysis. BMC Pregnancy Childbirth 2018, 18, 63. [Google Scholar] [CrossRef] [PubMed]
- Subnational Estimates Working Group of the HIV Modelling Consortium. Evaluation of geospatial methods to generate subnational HIV prevalence estimates for local level planning. AIDS 2016, 30, 1467–1474. [Google Scholar] [CrossRef] [PubMed] [Green Version]
- Larmarange, J.; Bendaud, V. HIV estimates at second subnational level from national population-based surveys. AIDS 2014, 28 (Suppl. 4), S469–S476. [Google Scholar] [CrossRef] [Green Version]
- Kulldorff, M.; Information Management Services, Inc. SaTScanTM v8.0: Software for the Spatial and Space-Time Scan Statistics. Available online: http://www.satscan.org/ (accessed on 1 October 2019).
- GeoDa Center for Geospatial Analysis and Computation. GeoDa and Methods for Geospatial Analysis; Arizona State University: Tempe, AZ, USA, 2010; Available online: http://geodacenter.asu.edu/ (accessed on 15 February 2020).
- Esri. ArcGIS Desktop Version 10.1; Environmental Systems Research Institute: Redlands, CA, USA, 2011. [Google Scholar]
- Belitz, C.; Brezger, A.; Kneib, T.; Lang, S. BayesX Methodology Manual. 2003. Available online: https://pdfs.semanticscholar.org/346d/56bb6aa017a043a8a9e19e619430e68838a6.pdf (accessed on 19 October 2019).
- Lunn, D.; Thomas, A.; Best, N.; Spiegelhalter, D. WinBUGS—A Bayesian modelling framework: Concepts, structure, and extensibility. Stat. Comput. 2000, 10, 325–337. [Google Scholar] [CrossRef]
- Rue, H.; Martino, S.; Chopin, N. Approximate Bayesian inference for latent Gaussian models by using integrated nested Laplace approximations. J. R. Stat. Soc. Ser. B Stat. Methodol. 2009, 71, 319–392. [Google Scholar] [CrossRef]
- Manda, S.O.M.; Kandala, N.B.; Ghilagaber, G. Advanced Techniques for Modelling Maternal and Child Health in Africa. In Advanced Techniques for Modelling Maternal and Child Health in Africa; Kandala, N., Ghilagaber, G., Eds.; Springer: Berlin/Heidelberg, Germany, 2014; pp. 1–7. [Google Scholar]
- Boyda, D.C.; Holzman, S.B.; Berman, A.; Grabowski, M.K.; Chang, L.W. Geographic Information Systems, spatial analysis, and HIV in Africa: A scoping review. PLoS ONE 2019, 14, e0216388. [Google Scholar] [CrossRef]
- Munn, Z.; Peters, M.; Stern, C.; Tufanaru, C.; McArthur, A.; Aromataris, E. Systematic review or scoping review? Guidance for authors when choosing between a systematic or scoping review approach. BMC Med. Res. Methodol. 2018, 18, 143. [Google Scholar] [CrossRef]
- Tricco, A.C.; Lillie, E.; Zarin, W.; O’Brien, K.K.; Colquhoun, H.; Levac, D.; Moher, D.; Peters, M.D.M.; Horsley, Y.; Weeks, L.; et al. PRISMA Extension for Scoping Reviews (PRISMA-ScR): Checklist and Explanation. Ann. Intern. Med. 2018, 169, 467–473. [Google Scholar] [CrossRef] [Green Version]
- Veritas Health Innovation. Covidence Systematic Review Software; Veritas Health Innovation: Melbourne, Australia, 2019.
- Hounton, S.; Winfrey, W.; Barros, A.J.D.; Askew, I. Patterns and trends of postpartum family planning in Ethiopia, Malawi, and Nigeria: Evidence of missed opportunities for integration. Glob. Health Action 2015, 8, 29738. [Google Scholar] [CrossRef] [Green Version]
- Nubé, M.; Sonneveld, B.G.J.S. The geographical distribution of underweight children in Africa. Bull. World Health Organ. 2005, 83, 764–770. [Google Scholar] [PubMed]
- Brdar, S.; Gavrić, K.; Ćulibrk, D.; Crnojevic, V. Unveiling Spatial Epidemiology of HIV with Mobile Phone Data. Sci. Rep. 2016, 6, 19342. [Google Scholar] [CrossRef] [PubMed] [Green Version]
- Yourkavitch, J.; Burgert, C.; Assaf, S.; Delgado, S. Using geographical analysis to identify child health inequality in sub-Saharan Africa. PLoS ONE 2018, 13, e0201870. [Google Scholar] [CrossRef] [PubMed]
- Okano, J.T.; Okano, J.T.; Blower, S. Using geospatial mapping to design HIV elimination strategies for sub-Saharan Africa. Sci. Transl. Med. 2017, 9, eaag0019. [Google Scholar] [CrossRef] [Green Version]
- Ruktanonchai, C.W.; Ruktanonchai, N.W.; Nove, A.; Lopes, S.; Pezzulo, C.; Bosco, C.; Alegana, V.A.; Burgent, C.R.; Ayiko, R.; Charles, A.S.E.K.; et al. Equality in Maternal and Newborn Health: Modelling Geographic Disparities in Utilisation of Care in Five East African Countries. PLoS ONE 2016, 11, e0162006. [Google Scholar]
- VanderElst, D.; Speybroeck, N. An adjusted bed net coverage indicator with estimations for 23 African countries. Malar. J. 2013, 12, 457. [Google Scholar] [CrossRef] [Green Version]
- Tenikue, M.; Shapiro, D.; Tenikue, M. Women’s education, infant and child mortality, and fertility decline in urban and rural sub-Saharan Africa. Demogr. Res. 2017, 37, 669–708. [Google Scholar]
- Tansley, G.; Schuurman, N.; Amram, O.; Yanchar, N. Spatial Access to Emergency Services in Low- and Middle-Income Countries: A GIS-Based Analysis. PLoS ONE 2015, 10, e0141113. [Google Scholar] [CrossRef]
- Burroway, R.; Hargrove, A. Education is the antidote: Individual- and community-level effects of maternal education on child immunizations in Nigeria. Soc. Sci. Med. 2018, 213, 63–71. [Google Scholar] [CrossRef]
- Chikandiwa, A.; Burgess, E.; Otwombe, K.; Chimoyi, L. Use of contraceptives, high risk births and under-five mortality in Sub Saharan Africa: Evidence from Kenyan (2014) and Zimbabwean (2011) demographic health surveys. BMC Womens Health 2018, 18, 173. [Google Scholar] [CrossRef]
- Bosomprah, S.; Tatem, A.J.; Dotse-Gborgbortsi, W.; Aboagye, P.; Matthews, Z. Spatial distribution of emergency obstetric and newborn care services in Ghana: Using the evidence to plan interventions. Int. J. Gynecol. Obstet. 2015, 132, 130–134. [Google Scholar] [CrossRef] [PubMed]
- Carrel, M.; Janko, M.; Mwandagalirwa, M.K.; Morgan, C.; Fwamba, F.; Muwonga, J.; Tshefu, A.K.; Meshnick, S.; Emch, M. Changing spatial patterns and increasing rurality of HIV prevalence in the Democratic Republic of the Congo between 2007 and 2013. Health Place 2016, 39, 79–85. [Google Scholar] [CrossRef] [PubMed] [Green Version]
- Gitonga, C.W.; Karanja, P.; Kihara, J.; Mwanje, M.T.; Juma, E.; Snow, R.W.; Noor, A.; Brooker, S. Implementing school malaria surveys in Kenya: Towards a national surveillance system. Malar. J. 2010, 9, 306. [Google Scholar] [CrossRef] [Green Version]
- Brodish, P.H.; Singh, K. Association between Schistosoma haematobium Exposure and Human Immunodeficiency Virus Infection among Females in Mozambique. Am. J. Trop. Med. Hyg. 2016, 94, 1040–1044. [Google Scholar] [CrossRef] [PubMed] [Green Version]
- Østby, G.; Urdal, H.; Tollefsen, A.F.; Kotsadam, A.; Belbo, R.; Ormhaug, C. Organized Violence and Institutional Child Delivery: Micro-Level Evidence From Sub-Saharan Africa, 1989v2014. Demography 2018, 55, 1295–1316. [Google Scholar] [CrossRef] [PubMed] [Green Version]
- Akullian, A.; Onyango, M.; Klein, D.; Odhiambo, J.; Bershteyn, A. Geographic coverage of male circumcision in western Kenya. Medicine 2017, 96, e5885. [Google Scholar] [CrossRef]
- Kotsadam, A.; Østby, G.; Rustad, S.A.; Tollefsen, A.F.; Urdal, H. Development aid and infant mortality. Micro-level evidence from Nigeria. World Dev. 2018, 105, 59–69. [Google Scholar] [CrossRef]
- Gonese, E.; Dzangare, J.; Gregson, S.; Jonga, N.; Mugurungi, O.; Mishra, V. Comparison of HIV Prevalence Estimates for Zimbabwe from Antenatal Clinic Surveillance (2006) and the 2005–06 Zimbabwe Demographic and Health Survey. PLoS ONE 2010, 5, e13819. [Google Scholar] [CrossRef]
- Pond, B.S. Malaria indicator surveys demonstrate a markedly lower prevalence of malaria in large cities of sub-Saharan Africa. Malar. J. 2013, 12, 313. [Google Scholar] [CrossRef] [Green Version]
- Carrel, M.; Patel, J.; Taylor, S.M.; Janko, M.; Kashamuka, M.; Tshefu, A.K.; Escalante, A.A.; McCollum, A.; Alam, M.T.; Udhayakumar, V.; et al. Social Science & Medicine The geography of malaria genetics in the Democratic Republic of Congo: A complex and fragmented landscape. Soc. Sci. Med. 2014, 133, 233–241. [Google Scholar]
- Cuadros, D.F.; Li, J.; Branscum, A.J.; Akullian, A.; Jia, P.; Mziray, E.N.; Tanser, F. Mapping the spatial variability of HIV infection in Sub-Saharan Africa: Effective information for localized HIV prevention and control. Sci. Rep. 2017, 7, 9093. [Google Scholar] [CrossRef] [PubMed] [Green Version]
- Soares, R.J.; Ca, A. Spatial heterogeneity of haemoglobin concentration in preschool-age children in sub-Saharan Africa. Bull. World Health Organ. 2011, 89, 459–468. [Google Scholar] [CrossRef] [PubMed]
- Noor, A.; Mutheu, J.J.; Tatem, A.J.; Hay, S.; Snow, R.W. Insecticide-treated net coverage in Africa: Mapping progress in 2000–07. Lancet 2008, 373, 58–67. [Google Scholar] [CrossRef] [Green Version]
- Taylor, S.M.; Messina, J.P.; Hand, C.C.; Juliano, J.J.; Muwonga, J.; Tshefu, A.K.; Atua, B.; Emch, M.; Meshnick, S. Molecular Malaria Epidemiology: Mapping and Burden Estimates for the Democratic Republic of the Congo, 2007. PLoS ONE 2011, 6, e16420. [Google Scholar] [CrossRef] [PubMed] [Green Version]
- Yao, J.; Murray, A.T.; Agadjanian, V.; Hayford, S.R. Geographic influences on sexual and reproductive health service utilization in rural Mozambique. Appl. Geogr. 2011, 32, 601–607. [Google Scholar] [CrossRef] [PubMed] [Green Version]
- Brownwright, T.; Dodson, Z.; Van Panhuis, W. Spatial clustering of measles vaccination coverage among children in sub-Saharan Africa. BMC Public Health 2017, 17, 957. [Google Scholar] [CrossRef] [PubMed] [Green Version]
- Bogale, G.G.; Alemu, K.; Degefie, D.T.; Gelaw, Y.A. Spatial patterns of childhood diarrhea in Ethiopia: Data from Ethiopian demographic and health surveys (2000, 2005, and 2011). BMC Infect. Dis. 2017, 17, 426. [Google Scholar] [CrossRef] [Green Version]
- O’Meara, W.P.; Platt, A.C.; Naanyu, V.; Cole, D.C.; Ndege, S. Spatial autocorrelation in uptake of antenatal care and relationship to individual, household and village-level factors: Results from a community-based survey of pregnant women in six districts in western Kenya. Int. J. Health Geogr. 2013, 12, 55. [Google Scholar] [CrossRef] [Green Version]
- Sartorius, B.; Sartorius, K. Identifying and Targeting Mortality Disparities: A Framework for Sub-Saharan Africa Using Adult Mortality Data from South Africa. PLoS ONE 2013, 8, e71437. [Google Scholar] [CrossRef] [Green Version]
- Cuadros, D.F.; Abu-Raddad, L.J. Geographical Patterns of HIV Sero-Discordancy in High HIV Prevalence Countries in Sub-Saharan Africa. Int. J. Environ. Res. Public Health 2016, 13, 865. [Google Scholar] [CrossRef] [Green Version]
- Cuadros, D.F.; Awad, S.F.; Abu-Raddad, L.J. Mapping HIV clustering: A strategy for identifying populations at high risk of HIV infection in sub-Saharan Africa. Int. J. Health Geogr. 2013, 12, 28. [Google Scholar] [CrossRef] [Green Version]
- Lakew, Y.; Benedict, S.; Haile, D. Social determinants of HIV infection, hotspot areas and subpopulation groups in Ethiopia: Evidence from the National Demographic and Health Survey in 2011. BMJ Open 2015, 5, 008669. [Google Scholar] [CrossRef] [PubMed] [Green Version]
- Gómez-Barroso, D.; García-Carrasco, E.; Herrador, Z.; Ncogo, P.; Romay-Barja, M.; Eka, M.; Nseng, G.; Rivas, M.R.; Santana, M.A.; Valladares, B.; et al. Spatial clustering and risk factors of malaria infections in Bata district, Equatorial Guinea. Malar. J. 2017, 16, 146. [Google Scholar] [CrossRef] [PubMed] [Green Version]
- Namosha, E.; Sartorius, B.; Tanser, F. Spatial Clustering of All-Cause and HIV-Related Mortality in a Rural South African Population (2000–2006). PLoS ONE 2013, 8, e69279. [Google Scholar] [CrossRef] [PubMed] [Green Version]
- Cuadros, D.F.; Abu-Raddad, L.J. Spatial variability in HIV prevalence declines in several countries in sub-Saharan Africa. Health Place 2014, 28, 45–49. [Google Scholar] [CrossRef] [Green Version]
- Dunn, G.; Johnson, G.D. Spatial and Spatio-temporal Epidemiology The geo-spatial distribution of childhood diarrheal disease in West Africa, 2008–2013: A covariate-adjusted cluster analysis. Spat. Spatio-Temporal Epidemiol. 2018, 26, 127–141. [Google Scholar] [CrossRef]
- Haile, D.; Azage, M.; Molla, T.; Rainey, R. Exploring spatial variations and factors associated with childhood stunting in Ethiopia: Spatial and multilevel analysis. BMC Pediatr. 2016, 16, 36. [Google Scholar] [CrossRef] [Green Version]
- Hirai, M.; Roess, A.; Huang, C.; Graham, J. Exploring geographic distributions of high-risk water, sanitation, and hygiene practices and their association with child diarrhea in Uganda. Glob. Health Action 2016, 9, 32833. [Google Scholar] [CrossRef] [Green Version]
- Turi, K.N.; Christoph, M.J.; Grigsby-Toussaint, D. Spatial Distribution of Underweight, Overweight and Obesity among Women and Children: Results from the 2011 Uganda Demographic and Health Survey. Int. J. Environ. Res. Public Health 2013, 10, 4967–4981. [Google Scholar] [CrossRef] [Green Version]
- Lakew, Y.; Reda, A.A.; Tamene, H.; Benedict, S.; Deribe, K. Geographical variation and factors influencing modern contraceptive use among married women in Ethiopia: Evidence from a national population based survey. Reprod. Health 2013, 10, 52. [Google Scholar] [CrossRef] [Green Version]
- Uthman, O.A. Geographical variations and contextual effects on age of initiation of sexual intercourse among women in Nigeria: A multilevel and spatial analysis. Int. J. Health Geogr. 2008, 7, 27. [Google Scholar] [CrossRef] [PubMed] [Green Version]
- Takahashi, S.; Metcalf, C.J.E.; Ferrari, M.J.; Tatem, A.J.; Lessler, J. The geography of measles vaccination in the African Great Lakes region. Nat. Commun. 2017, 8, 15585. [Google Scholar] [CrossRef] [PubMed]
- Burke, M.; Heft-Neal, S.; Bendavid, E. Sources of variation in under-5 mortality across sub-Saharan Africa: A spatial analysis. Lancet Glob. Health 2016, 4, e936–e945. [Google Scholar] [CrossRef] [Green Version]
- López-Carr, D.; Mwenda, K.M.; Pricope, N.G.; Kyriakidis, P.; Jankowska, M.M.; Weeks, J.; Funk, C.; Husak, G.; Michaelsen, J. Climate-Related Child Undernutrition in the Lake Victoria Basin: An Integrated Spatial Analysis of Health Surveys, NDVI, and Precipitation Data. IEEE J. Sel. Top. Appl. Earth Obs. Remote. Sens. 2016, 9, 2830–2835. [Google Scholar] [CrossRef]
- Gosoniu, L.; Msengwa, A.; Lengeler, C.; Vounatsou, P. Spatially Explicit Burden Estimates of Malaria in Tanzania: Bayesian Geostatistical Modeling of the Malaria Indicator Survey Data. PLoS ONE 2012, 7, e23966. [Google Scholar] [CrossRef] [Green Version]
- Adigun, A.B.; Gajere, E.N.; Oresanya, O.; Vounatsou, P. Malaria risk in Nigeria: Bayesian geostatistical modelling of 2010 malaria indicator survey data. Malar. J. 2015, 14, 156. [Google Scholar] [CrossRef] [Green Version]
- Stensgaard, A.-S.; Vounatsou, P.; Onapa, A.W.; Utzinger, J.; Pedersen, E.M.; Kristensen, T.K.; Simonsen, P.E. Ecological Drivers of Mansonella perstans Infection in Uganda and Patterns of Co-endemicity with Lymphatic Filariasis and Malaria. PLoS Negl. Trop. Dis. 2016, 10, e0004319. [Google Scholar] [CrossRef]
- Giardina, F.; Kasasa, S.; Sié, A.; Utzinger, J.; Tanner, M.; Vounatsou, P. Effects of vector-control interventions on changes in risk of malaria parasitaemia in sub-Saharan Africa: A spatial and temporal analysis. Lancet Glob. Health 2014, 2, e601–e615. [Google Scholar] [CrossRef] [Green Version]
- Ssempiira, J.; Nambuusi, B.; Kissa, J.; Agaba, B.; Makumbi, F.; Kasasa, S.; Vounatsou, P. Geostatistical modelling of malaria indicator survey data to assess the effects of interventions on the geographical distribution of malaria prevalence in children less than 5 years in Uganda. PLoS ONE 2017, 12, e0174948. [Google Scholar] [CrossRef]
- Gemperli, A.; Vounatsou, P.; Kleinschmidt, I.; Bagayoko, M.; Lengeler, C.; Smith, T.A. Spatial patterns of infant mortality in Mali: The effect of malaria endemicity. Am. J. Epidemiol. 2004, 159, 64–72. [Google Scholar] [CrossRef] [PubMed] [Green Version]
- Messina, J.; Taylor, S.M.; Meshnick, S.R.; Linke, A.M.; Tshefu, A.K.; Atua, B.; Mwandagalirwa, M.K.; Emch, M. Population, behavioural and environmental drivers of malaria prevalence in the Democratic Republic of Congo. Malar. J. 2011, 10, 161. [Google Scholar] [CrossRef] [PubMed] [Green Version]
- Mmbando, B.; Kamugisha, M.L.; Lusingu, J.; Francis, F.; Ishengoma, D.S.; Theander, T.G.; Lemnge, M.M.; Hviid, T.V.F. Spatial variation and socio-economic determinants of Plasmodium falciparum infection in northeastern Tanzania. Malar. J. 2011, 10, 145. [Google Scholar] [CrossRef] [PubMed] [Green Version]
- Grady, S.C.; Frake, A.N.; Zhang, Q.; Bene, M.; Jordan, D.R.; Dossantos, T.C.; Kadhim, A.; Namanya, J.; Pierre, L.M.; Fan, Y.; et al. Neonatal mortality in East Africa and West Africa: A geographic analysis of district-level demographic and health survey data. Geospat. Health 2017, 12, 501. [Google Scholar] [CrossRef] [PubMed] [Green Version]
- Homan, T.; Maire, N.; Hiscox, A.; Di Pasquale, A.; Kiche, I.; Onoka, K.; Mweresa, C.; Mukubana, W.R.; Ross, A.; Smith, T.A.; et al. Spatially variable risk factors for malaria in a geographically heterogeneous landscape, western Kenya: An explorative study. Malar. J. 2016, 15, 1. [Google Scholar] [CrossRef] [PubMed] [Green Version]
- Wabiri, N.; Shisana, O.; Zuma, K.; Freeman, J. Assessing the spatial nonstationarity in relationship between local patterns of HIV infections and the covariates in South Africa: A geographically weighted regression analysis. Spat. Spatio-Temporal Epidemiol. 2016, 16, 88–99. [Google Scholar] [CrossRef]
- Okango, E.; Mwambi, H.; Ngesa, O.; Achia, T. Semi-Parametric Spatial Joint Modeling of HIV and HSV-2 among Women in Kenya. PLoS ONE 2015, 10, e0135212. [Google Scholar] [CrossRef]
- Noor, A.M.; Clements, A.C.A.; Gething, P.W.; Moloney, G.; Borle, M.; Shewchuk, T.; Hay, S.I.; Smow, R.W. Spatial prediction of Plasmodium falciparum prevalence in Somalia. Malar. J. 2008, 7, 159. [Google Scholar] [CrossRef] [Green Version]
- Jones, A.D.; Acharya, Y.; Galway, L.P. Urbanicity Gradients Are Associated with the Household- and Individual-Level Double Burden of Malnutrition in Sub-Saharan Africa. J. Nutr. 2016, 146, 1257–1267. [Google Scholar] [CrossRef] [Green Version]
- Chipeta, M.G.; Terlouw, A.; Phiri, K.; Diggle, P. Adaptive geostatistical design and analysis for prevalence surveys. Spat. Stat. 2016, 15, 70–84. [Google Scholar] [CrossRef] [Green Version]
- Gosoniu, L.; Veta, A.M.; Vounatsou, P. Bayesian Geostatistical Modeling of Malaria Indicator Survey Data in Angola. PLoS ONE 2010, 5, e9322. [Google Scholar] [CrossRef] [Green Version]
- Diboulo, E.; Sié, A.; Vounatsou, P. Assessing the effects of malaria interventions on the geographical distribution of parasitaemia risk in Burkina Faso. Malar. J. 2016, 15, 228. [Google Scholar] [CrossRef] [Green Version]
- Riedel, N.; Vounatsou, P.; Miller, J.M.; Gosoniu, L.; Chizema-Kawesha, E.; Mukonka, V.; Steketee, R.W. Geographical patterns and predictors of malaria risk in Zambia: Bayesian geostatistical modelling of the 2006 Zambia national malaria indicator survey (ZMIS). Malar. J. 2010, 9, 37. [Google Scholar] [CrossRef] [PubMed] [Green Version]
- Fronterre, C.; Giorgi, E.; Diggle, P. Geostatistical inference in the presence of geomasking: A composite-likelihood approach. Spat. Stat. 2018, 28, 319–330. [Google Scholar] [CrossRef] [Green Version]
- Giorgi, E.; Diggle, P.; Snow, R.W.; Noor, A. Geostatistical methods for disease mapping and visualization using data from spatio-temporally referenced prevalence surveys. Int. Stat. Rev. 2018, 86, 571–597. [Google Scholar] [CrossRef]
- Schur, N.; Hürlimann, E.; Garba, A.; Traoré, M.S.; Ndir, O.; Ratard, R.C.; Tchuem Tchuenté, L.A.; Kristensen, T.K.; Utzinger, J.; Vounatsou, P. Geostatistical Model-Based Estimates of Schistosomiasis Prevalence among Individuals Aged <= 20 Years in West Africa. PLoS Negl. Trop. Dis. 2011, 5, e1194. [Google Scholar]
- Amoah, B.; Giorgi, E.; Heyes, D.J.; Van Buuren, S.; Diggle, P. Geostatistical modelling of the association between malaria and child growth in Africa. Int. J. Health Geogr. 2018, 17, 7. [Google Scholar] [CrossRef] [PubMed]
- Bosco, C.; Alegana, V.; Bird, T.; Pezzulo, C.; Bengtsson, L.; Sorichetta, A.; Steele, J.; Hornby, G.; Ruktanonchai, C.; Ruktanonchai, N.; et al. Exploring the high-resolution mapping of gender-disaggregated development indicators. J. R. Soc. Interface 2017, 14, 20160825. [Google Scholar] [CrossRef] [PubMed] [Green Version]
- Utazi, C.E.; Thorley, J.; Alegana, V.A.; Ferrari, M.J.; Takahashi, S.; Metcalf, C.J.E.; Lessler, J.; Tatem, A.J. High resolution age-structured mapping of childhood vaccination coverage in low and middle income countries. Vaccine 2018, 36, 1583–1591. [Google Scholar] [CrossRef] [PubMed]
- Golding, N.; Burstein, R.; Longbottom, J.; Browne, A.J.; Fullman, N.; Osgood-Zimmerman, A.; Earlm, I.; Bhatt, S.; Cameron, E.; Casey, D.C.; et al. Mapping under-5 and neonatal mortality in Africa, 2000–2015: A baseline analysis for the Sustainable Development Goals. Lancet 2017, 390, 2171–2182. [Google Scholar] [CrossRef] [Green Version]
- Kneib, T. Mixed model-based inference in geoadditive hazard regression for interval-censored survival times. Comput. Stat. Data Anal. 2006, 51, 777–792. [Google Scholar] [CrossRef] [Green Version]
- Samadoulougou, S.; Maheu-Giroux, M.; Kirakoya-Samadoulougou, F.; De Keukeleire, M.; De Castro, M.C.; Robert, A. Multilevel and geo-statistical modeling of malaria risk in children of Burkina Faso. Parasites Vectors 2014, 7, 350. [Google Scholar] [CrossRef] [Green Version]
- Noor, A.; Alegana, V.A.; Patil, A.P.; Snow, R.W. Predicting the unmet need for biologically targeted coverage of insecticide-treated nets in Kenya. Am. J. Trop. Med. Hyg. 2010, 83, 854–860. [Google Scholar] [CrossRef] [PubMed] [Green Version]
- Brooker, S.; Clements, A.C. Spatial heterogeneity of parasite co-infection: Determinants and geostatistical prediction at regional scales. Int. J. Parasitol. 2008, 39, 591–597. [Google Scholar] [CrossRef] [PubMed] [Green Version]
- Ssempiira, J.; Nambuusi, B.; Kissa, J.; Agaba, B.; Makumbi, F.; Kasasa, S.; Vounatsou, P. The contribution of malaria control interventions on spatio-temporal changes of parasitaemia risk in Uganda during 2009–2014. Parasites Vectors 2017, 10, 450. [Google Scholar] [CrossRef] [PubMed] [Green Version]
- Bennett, A.; Yukich, J.; Miller, J.M.; Keating, J.; Moonga, H.; Hamainza, B.; Kamuliwo, M.; Andrade-Pacheco, R.; Vounatsou, P.; Steketee, R.W.; et al. The relative contribution of climate variability and vector control coverage to changes in malaria parasite prevalence in Zambia 2006–2012. Parasit Vectors. Parasites Vectors 2016, 9, 431. [Google Scholar] [CrossRef] [Green Version]
- Oluwole, A.S.; Ekpo, U.F.; Karagiannis-Voules, D.A.; Abe, E.M.; Olamiju, F.O.; Isiyaku, S.; Okoronkwo, C.; Saka, Y.; Nebe, O.J.; Braide, E.I.; et al. Bayesian Geostatistical Model-Based Estimates of Soil-Transmitted Helminth Infection in Nigeria, Including Annual Deworming Requirements. PLoS Negl. Trop. Dis. 2015, 9, e0003740. [Google Scholar] [CrossRef] [PubMed] [Green Version]
- Alegana, V.A.; Atkinson, P.M.; Pezzulo, C.; Sorichetta, A.; Weiss, D.; Bird, T.; Erbach-Schoenberg, E.; Tatem, A.J. Fine resolution mapping of population age-structures for health and development applications. J. R. Soc. Interface 2015, 12, 20150073. [Google Scholar] [CrossRef] [Green Version]
- Colson, K.E.; Dwyer-Lindgren, L.; Achoki, T.; Fullman, N.; Schneider, M.; Mulenga, P.; Hangoma, P.; Ng, M.; Masiye, F.; Gakidou, E. Benchmarking health system performance across districts in Zambia: A systematic analysis of levels and trends in key maternal and child health interventions from 1990 to 2010. BMC Med. 2015, 13, 69. [Google Scholar] [CrossRef] [Green Version]
- Coburn, B.J.; Okano, J.T.; Blower, S. Current drivers and geographic patterns of HIV in Lesotho: Implications for treatment and prevention in Sub-Saharan Africa. BMC Med. 2013, 11, 224. [Google Scholar] [CrossRef] [Green Version]
- Aoun, N.; Matsuda, H.; Sekiyama, M. Geographical accessibility to healthcare and malnutrition in Rwanda. Soc. Sci. Med. 2015, 130, 135–145. [Google Scholar] [CrossRef]
- Messina, J.P.; Mwandagalirwa, M.K.; Taylor, S.M.; Emch, M.; Meshnick, S.R. Spatial and social factors drive anemia in Congolese women. Health Place 2013, 24, 54–64. [Google Scholar] [CrossRef] [Green Version]
- Kpienbaareh, D.; Atuoye, K.N.; Ngabonzima, A.; Bagambe, P.G.; Rulisa, S.; Luginaah, I.; Cechetto, D.F. Social Science & Medicine Spatio-temporal disparities in maternal health service utilization in Rwanda: What next for SDGs? Soc. Sci. Med. 2019, 226, 164–175. [Google Scholar] [PubMed]
- Alegana, V.A.; Wright, J.; Uusiku, P.; Noor, A.; Snow, R.W.; Atkinson, P.M. Spatial modelling of healthcare utilisation for treatment of fever in Namibia. Int. J. Health Geogr. 2012, 11, 6. [Google Scholar] [CrossRef] [PubMed] [Green Version]
- Palk, L.; Blower, S. Geographic variation in sexual behavior can explain geospatial heterogeneity in the severity of the HIV epidemic in Malawi. BMC Med. 2018, 16, 22. [Google Scholar] [CrossRef]
- Tewara, M.A.; Mbah-fongkimeh, P.N.; Dayimu, A.; Kang, F. Small-area spatial statistical analysis of malaria clusters and hotspots in Cameroon; 2000–2015. BMC Infect. Dis. 2018, 18, 636. [Google Scholar] [CrossRef] [PubMed]
- Sartorius, B.K.D.; Sartorius, K.; Chirwa, T.F.; Fonn, S. Infant mortality in South Africa—Distribution, associations and policy implications, 2007: An ecological spatial analysis. Int. J. Health Geogr. 2011, 10, 61. [Google Scholar] [CrossRef] [PubMed] [Green Version]
- Ejigu, B.A.; Wencheko, E.; Berhane, K. Spatial pattern and determinants of anaemia in Ethiopia. PLoS ONE 2018, 13, e0197171. [Google Scholar] [CrossRef] [Green Version]
- Acheson, E.S.; Kerr, J.T. Nets versus spraying: A spatial modelling approach reveals indoor residual spraying targets Anopheles mosquito habitats better than mosquito nets in Tanzania. PLoS ONE 2018, 13, e0205270. [Google Scholar] [CrossRef] [Green Version]
- Kamuliwo, M.; Kirk, K.E.; Chanda, E.; ElBadry, M.A.; Lubinda, J.; Weppelmann, T.A.; Mukonka, V.; Zhang, W.; Mushinge, G.; Mwanza-Ingwe, M.; et al. Spatial patterns and determinants of malaria infection during pregnancy in Zambia. Trans. R. Soc. Trop. Med. Hyg. 2015, 109, 514–521. [Google Scholar] [CrossRef]
- Chimoyi, L.; Musenge, E. Spatial analysis of factors associated with HIV infection among young people in Uganda, 2011. BMC Public Health 2014, 14, 555. [Google Scholar] [CrossRef] [Green Version]
- Birhanu, A.Y.; Alemu, K.; Dadi, A.F.; Alamirrew, A. Spatial distribution of antenatal care utilization and associated factors in Ethiopia: Evidence from Ethiopian demographic health surveys. BMC Pregnancy Childbirth 2018, 18, 242. [Google Scholar]
- Kandala, N.B.; Magadi, M.A.; Madise, N.J. An investigation of district spatial variations of childhood diarrhoea and fever morbidity in Malawi. Soc. Sci. Med. 2006, 62, 1138–1152. [Google Scholar] [CrossRef]
- Adebayo, S.B. A Bayesian semiparametric multilevel survival modelling of age at first birth in Nigeria Ezra Gayawan Table of Contents. Demogr. Res. 2013, 28, 1339–1372. [Google Scholar]
- Sacko, M.; Landoure, A.; Dembe, R.; Clements, A.C.A.; Bosque, E.; Coulibaly, G.; Gabrielli, A.F.; Fenwick, A.; Brooker, S. A Comparative Study of the Spatial Distribution of Schistosomiasis in Mali in 1984–1989 and 2004–2006. PLoS Negl. Trop. Dis. 2009, 3, e431. [Google Scholar]
- Kazembe, L.N. An additive regression model for investigating the relationship between childhood health and socio-economic status. Spat. Spatio-Temporal Epidemiol. 2013, 6, 71–84. [Google Scholar] [CrossRef] [PubMed]
- Chirwa, T.; Mantempa, J.N.; Kinziunga, F.L.; Kandala, J.D.; Kandala, N.-B. An exploratory spatial analysis of geographical inequalities of birth intervals among young women in the Democratic Republic of Congo (DRC): A cross-sectional study. BMC Pregnancy Childbirth 2014, 14, 271. [Google Scholar] [CrossRef] [PubMed] [Green Version]
- Adebayo, S.B.; Fahrmeir, L.; Klasen, S. Analyzing infant mortality with geoadditive categorical regression models: A case study for Nigeria. Econ. Hum. Boil. 2004, 2, 229–244. [Google Scholar] [CrossRef]
- Niragire, F.; Achia, T.N.O.; Lyambabaje, A.; Ntaganira, J. Bayesian Mapping of HIV Infection among Women of Reproductive Age in Rwanda. PLoS ONE 2015, 10, e0119944. [Google Scholar] [CrossRef] [Green Version]
- Ngwira, A.; Kazembe, L.N. Bayesian random effects modelling with application to childhood anaemia in Malawi. BMC Public Health 2015, 15, 161. [Google Scholar] [CrossRef] [Green Version]
- Tsiko, R.G. Bayesian spatial analysis of childhood diseases in Zimbabwe. BMC Public Health 2015, 15, 842. [Google Scholar] [CrossRef] [Green Version]
- Tonye, S.G.M.; Kouambeng, C.; Wounang, R.; Vounatsou, P. Challenges of DHS and MIS to capture the entire pattern of malaria parasite risk and intervention effects in countries with different ecological zones: The case of Cameroon. Malar. J. 2018, 17, 156. [Google Scholar] [CrossRef] [Green Version]
- Kandala, N.-B.; Ghilagaber, G. A Geo-Additive Bayesian Discrete-Time Survival Model and its Application to Spatial Analysis of Childhood Mortality in Malawi. Qual. Quant. 2006, 40, 935–957. [Google Scholar] [CrossRef]
- Ngwira, A.; Stanley, C.C. Determinants of Low Birth Weight in Malawi: Bayesian Geo-Additive Modelling. PLoS ONE 2015, 10, e0130057. [Google Scholar] [CrossRef] [PubMed]
- Wakefield, J.; Fuglstad, G.-A.; Riebler, A.; Godwin, J.; Wilson, K.; Clark, S.J. Estimating under-five mortality in space and time in a developing world context. Stat. Methods Med. Res. 2018, 28, 2614–2634. [Google Scholar] [CrossRef] [PubMed]
- Kandala, N.-B.; Tigbe, W.; Manda, S.O.; Stranges, S. Geographic Variation of Hypertension in Sub-Saharan Africa: A Case Study of South Africa. Am. J. Hypertens. 2013, 26, 382–391. [Google Scholar] [CrossRef] [Green Version]
- Kandala, N.-B.; Stranges, S. Geographic Variation of Overweight and Obesity among Women in Nigeria: A Case for Nutritional Transition in Sub-Saharan Africa. PLoS ONE 2014, 9, e101103. [Google Scholar] [CrossRef]
- Kazembe, L.N.; Kamndaya, M.S. Spatial and Spatio-temporal Epidemiology Hierarchical spatial modelling of pneumonia prevalence when response outcome has misclassification error: Applications to household data from Malawi. Spat. Spatio-Temporal Epidemiol. 2016, 16, 35–42. [Google Scholar] [CrossRef]
- Kinyoki, D.K.; Kandala, N.; Manda, S.O.; Krainski, E.T.; Fuglstad, G.; Moloney, G.M.; Berkley, J.A.; Noor, A.M. Assessing comorbidity and correlates of wasting and stunting among children in Somalia using cross-sectional household surveys: 2007 to 2010. BMJ Open 2016, 6, e009854. [Google Scholar] [CrossRef] [Green Version]
- Kandala, N.; Madungu, T.P.; Emina, J.B.O.; Nzita, K.P.D.; Cappuccio, F.P. Malnutrition among children under the age of five in the Democratic Republic of Congo (DRC): Does geographic location matter? BMC Public Health 2011, 11, 261. [Google Scholar] [CrossRef] [Green Version]
- Manda, S.O.M.; Lombard, C.L.; Mosala, T. Divergent spatial patterns in the prevalence of the human immunodeficiency virus (HIV) and syphilis in South African pregnant women. Geospat. Health 2012, 6, 221. [Google Scholar] [CrossRef] [Green Version]
- Kandala, N.; Brodish, P.; Buckner, B.; Foster, S.; Madise, N. Millennium development goal 6 and HIV infection in Zambia: What can we learn from successive household surveys ? AIDS 2011, 25, 95–106. [Google Scholar] [CrossRef] [Green Version]
- Noor, A.M.; ElMardi, K.A.; Abdelgader, T.M.; Patil, A.P.; Amine, A.A.A.; Bakhiet, S.; Mukhtar, M.M.; Snow, R.W. Malaria risk mapping for control in the republic of Sudan. Am. J. Trop. Med. Hyg. 2012, 87, 1012–1021. [Google Scholar] [CrossRef] [PubMed] [Green Version]
- Khatab, K.; Kandala, N.-B. Latent variable modelling of risk factors associated with childhood diseases: Case study for Nigeria. Asian Pac. J. Trop. Dis. 2011, 1, 169–176. [Google Scholar] [CrossRef]
- Kinyoki, D.K.; Manda, S.O.; Moloney, G.M.; Odundo, E.O.; Berkley, J.A.; Noor, A.M.; Kandala, N. Modelling the Ecological Comorbidity of Acute Respiratory Infection, Diarrhoea and Stunting among Children Under the Age of 5 Years in Somalia. Int. Stat. Rev. 2017, 85, 164–176. [Google Scholar] [CrossRef] [PubMed] [Green Version]
- Kazembe, L.N.; Mpeketula, P.M.G. Quantifying Spatial Disparities in Neonatal Mortality Using a Structured Additive Regression Model. PLoS ONE 2010, 5, e11180. [Google Scholar] [CrossRef]
- Ouédraogo, M.; Samadoulougou, S.; Rouamba, T.; Hien, H.; Sawadogo, J.E.M.; Tinto, H.; Alegana, V.A.; Speybroeck, N.; Kirakoya-Samadoulougou, F. Spatial distribution and determinants of asymptomatic malaria risk among children under 5 years in 24 districts in Burkina Faso. Malar. J. 2018, 17, 460. [Google Scholar] [CrossRef]
- Odwa, D.; Mkandawire, P. Spatial variation of management of childhood diarrhea in Malawi. Health Place 2014, 29, 84–94. [Google Scholar] [CrossRef]
- Kang, S.Y.; Battle, K.E.; Gibson, H.S.; Ratsimbasoa, A.; Randrianarivelojosia, M.; Ramboarina, S.; Zimmerman, P.A.; Weiss, D.J.; Cameron, E.; Gething, P.W.; et al. Spatio-temporal mapping of Madagascar’s Malaria Indicator Survey results to assess Plasmodium falciparum endemicity trends between 2011 and 2016. BMC Med. 2018, 16, 71. [Google Scholar] [CrossRef] [Green Version]
- Kandala, N.; Ji, C.; Stranges, S.; Stallard, N.; Cappuccio, F.P. Spatial analysis of risk factors for childhood morbidity in Nigeria. Am. J. Trop. Med. Hyg. 2007, 77, 770–779. [Google Scholar] [CrossRef] [PubMed]
- Kandala, N.; Emina, J.B.; Nzita, P.D.K.; Cappuccio, F.P. Diarrhoea, acute respiratory infection, and fever among children in the Democratic Republic of Congo. Soc. Sci. Med. 2009, 68, 1728–1736. [Google Scholar] [CrossRef] [Green Version]
- Kinyoki, D.K.; Berkley, J.A.; Moloney, G.M.; Odundo, E.O.; Kandala, N.-B.; Noor, A.M. Environmental predictors of stunting among children under-five in Somalia: Cross-sectional studies from 2007 to 2010. BMC Public Health 2016, 16, 654. [Google Scholar] [CrossRef] [Green Version]
- Khatab, K. Childhood Malnutrition in Egypt using Geoadditive Gaussian and Latent Variable Models. Am. J. Trop. Med. Hyg. 2010, 82, 653–663. [Google Scholar] [CrossRef] [PubMed] [Green Version]
- Adebayo, S.B.; Yahya, W.B. Modelling Immunization Coverage in Nigeria Using Bayesian Structured Additive Regression BT. In Advanced Techniques for Modelling Maternal and Child Health in Africa; Kandala, N.-B., Ghilagaber, G., Eds.; Springer: Dordrecht, The Netherlands, 2014; pp. 123–145. [Google Scholar]
- Manda, S.O.M.; Feltbower, R.G.; Gilthorpe, M.S. A Multivariate Random Frailty Effects Model for Multiple Spatially Dependent Survival Data BT. In Modern Methods for Epidemiology; Tu, Y.-K., Greenwood, D.C., Eds.; Springer: Dordrecht, The Netherlands, 2012; pp. 157–172. [Google Scholar]
- Ghilagaber, G.; Antai, D.; Kandala, N.-B. Modeling Spatial Effects on Childhood Mortality Via Geo-additive Bayesian Discrete-Time Survival Model: A Case Study from Nigeria BT. In Advanced Techniques for Modelling Maternal and Child Health in Africa; Kandala, N.-B., Ghilagaber, G., Eds.; Springer: Dordrecht, The Netherlands, 2014; pp. 29–48. [Google Scholar]
- Khatab, K. Bayesian Geoadditive Mixed Latent Variable Models with Applications to Child Health Problems in Egypt and Nigeria BT. In Advanced Techniques for Modelling Maternal and Child Health in Africa; Kandala, N.-B., Ghilagaber, G., Eds.; Springer: Dordrecht, The Netherlands, 2014; pp. 49–81. [Google Scholar]
- Kazembe, L.N. Mapping Socio-economic Inequalities in Health Status among Malawian Children: A Mixed Model Approach BT. In Advanced Techniques for Modelling Maternal and Child Health in Africa; Kandala, N.-B., Ghilagaber, G., Eds.; Springer: Dordrecht, The Netherlands, 2014; pp. 83–106. [Google Scholar]
- Manda, S.O.M. Macro Determinants of Geographical Variation in Childhood Survival in South Africa Using Flexible Spatial Mixture Models BT. In Advanced Techniques for Modelling Maternal and Child Health in Africa; Kandala, N.-B., Ghilagaber, G., Eds.; Springer: Dordrecht, The Netherlands, 2014; pp. 147–168. [Google Scholar]
- Kandala, N.-B. Spatial Variation of Predictors of Prevalent Hypertension in Sub-Saharan Africa: A Case Study of South-Africa BT. In Advanced Techniques for Modelling Maternal and Child Health in Africa; Kandala, N.-B., Ghilagaber, G., Eds.; Springer: Dordrecht, The Netherlands, 2014; pp. 211–237. [Google Scholar]
- Adebayo, S.B.; Gayawan, E. Stepwise Geoadditive Regression Modelling of Levels and Trends of Fertility in Nigeria: Guiding Tools towards Attaining MDGs BT. In Advanced Techniques for Modelling Maternal and Child Health in Africa; Kandala, N.-B., Ghilagaber, G., Eds.; Springer: Dordrecht, The Netherlands, 2014; pp. 253–277. [Google Scholar]
- Abiodun, A.A.; Adebayo, S.B.; Oyejola, B.A.; Anyanti, J. A Spatial Analysis of Age at Sexual Initiation Among Nigerian Youth as a Tool for HIV Prevention: A Bayesian Approach BT. In Advanced Techniques for Modelling Maternal and Child Health in Africa; Kandala, N.-B., Ghilagaber, G., Eds.; Springer: Dordrecht, The Netherlands, 2014; pp. 279–302. [Google Scholar]
- Kandala, N.-B.; Manda, S.O.M.; Tigbe, W. Assessing Geographic Co-morbidity Associated with Vascular Diseases in South Africa: A Joint Bayesian Modeling Approach BT. In Advanced Techniques for Modelling Maternal and Child Health in Africa; Kandala, N.-B., Ghilagaber, G., Eds.; Springer: Dordrecht, The Netherlands, 2014; pp. 303–320. [Google Scholar]
- Kandala, N.-B.; Manda, S.; Tigbe, W.W.; Mwambi, H.; Stranges, S. Geographic distribution of cardiovascular comorbidities in South Africa: A national cross-sectional analysis. J. Appl. Stat. 2013, 41, 1203–1216. [Google Scholar] [CrossRef]
- Sartorius, K.; Sartorius, B. A spatial model to quantify the mortality impact of service delivery in Sub-Saharan Africa: An ecological design utilizing data from South Africa. Int. J. Health Geogr. 2013, 12, 8. [Google Scholar] [CrossRef] [Green Version]
- Ngesa, O.; Mwambi, H.; Achia, T. Bayesian Spatial Semi-Parametric Modeling of HIV Variation in Kenya. PLoS ONE 2014, 9, e103299. [Google Scholar] [CrossRef] [Green Version]
- Kazembe, L.N.; Appleton, C.C.; Kleinschmidt, I. Choice of treatment for fever at household level in Malawi: Examining spatial patterns. Malar. J. 2007, 6, 40. [Google Scholar] [CrossRef] [PubMed] [Green Version]
- Kazembe, L.N.; Kandala, N.-B. Estimating areas of common risk in low birth weight and infant mortality in Namibia: A joint spatial analysis at sub-regional level. Spat. Spatio-Temporal Epidemiol. 2015, 12, 27–37. [Google Scholar] [CrossRef] [PubMed]
- Kazembe, L.N.; Appleton, C.C.; Kleinschmidt, I. Geographical disparities in core population coverage indicators for roll back malaria in Malawi. Int. J. Equity Health 2007, 6, 5. [Google Scholar] [CrossRef] [PubMed] [Green Version]
- Kazembe, L.N.; Muula, A.S.; Simoonga, C. Joint spatial modelling of common morbidities of childhood fever and diarrhoea in Malawi. Health Place 2009, 15, 165–172. [Google Scholar] [CrossRef]
- Kazembe, L.N.; Muula, A.; Appleton, C.C.; Kleinschmidt, I. Modelling the effect of malaria endemicity on spatial variations in childhood fever, diarrhoea and pneumonia in Malawi. Int. J. Health Geogr. 2007, 6, 33. [Google Scholar] [CrossRef] [Green Version]
- Manda, S.; Masenyetse, L.; Cai, B.; Meyer, R. Mapping HIV prevalence using population and antenatal sentinel-based HIV surveys: A multi-stage approach. Popul. Health Metr. 2015, 13, 22. [Google Scholar] [CrossRef] [Green Version]
- Okango, E.; Mwambi, H.; Ngesa, O. Spatial modeling of HIV and HSV-2 among women in Kenya with spatially varying coefficients. BMC Public Health 2016, 16, 355. [Google Scholar] [CrossRef] [PubMed] [Green Version]
- Chitunhu, S.; Musenge, E. Spatial and socio-economic effects on malaria morbidity in children under 5years in Malawi in 2012. Spat. Spatio-Temporal Epidemiol. 2016, 16, 21–33. [Google Scholar] [CrossRef] [PubMed]
- Mtambo, O.P.; Masangwi, S.; Kazembe, L.N. Spatial quantile regression using INLA with applications to childhood overweight in Malawi. Spat. Spatio-Temporal Epidemiol. 2015, 13, 7–14. [Google Scholar] [CrossRef] [PubMed]
- Ruktanonchai, C.W.; Nilsen, K.; Alegana, V.A.; Bosco, C.; Ayiko, R.; Seven Kajeguka, A.C.; Matthews, Z.; Tatem, A.J. Temporal trends in spatial inequalities of maternal and newborn health services among four east African countries, 1999–2015. BMC Public Health 2018, 18, 1339. [Google Scholar] [CrossRef]
- Kinyoki, D.K.; Berkley, J.A.; Moloney, G.M.; Odundo, E.O.; Kandala, N.; Noor, A.M. Space—Time mapping of wasting among children under the age of five years in Somalia from 2007 to 2010. Spat. Spatio-Temporal Epidemiol. 2016, 16, 77–87. [Google Scholar] [CrossRef] [Green Version]
- Pullan, R.L.; Freeman, M.C.; Gething, P.W.; Brooker, S.J. Geographical Inequalities in Use of Improved Drinking Water Supply and Sanitation across Sub-Saharan Africa: Mapping and Spatial Analysis of Cross-sectional Survey Data. PLoS Med. 2014, 11, e1001626. [Google Scholar] [CrossRef] [PubMed] [Green Version]
- Acheson, E.S.; Plowright, A.A.; Kerr, J.T. Where have all the mosquito nets gone? Spatial modelling reveals mosquito net distributions across Tanzania do not target optimal Anopheles mosquito habitats. Malar. J. 2015, 14, 322. [Google Scholar] [CrossRef] [Green Version]
- Ayele, D.G.; Zewotir, T.T.; Mwambi, H.G. Structured additive regression models with spatial correlation to estimate under-five mortality risk factors in Ethiopia. BMC Public Health 2015, 15, 268. [Google Scholar] [CrossRef] [Green Version]
- Anselin, L.; Getis, A. Spatial statistical analysis and geographic information systems. Ann. Reg. Sci. 1992, 26, 19–33. [Google Scholar] [CrossRef]
- Cliff, A.D.; Ord, J.K. Spatial Autocorrelation; Pion Press: London, UK, 1973. [Google Scholar]
- Kulldorff, M. A spatial scan statistic. Commun. Stat.-Theory Methods 1997, 26, 1481–1496. [Google Scholar] [CrossRef]
- Schloeder, C.A.; Zimmermann, N.E.; Jacobs, M. Comparison of Methods for Interpolating Soil Properties Using Limited Data. Soil Sci. Soc. Am. J. 2001, 65, 470–479. [Google Scholar] [CrossRef]
- Wu, Y.H.E.; Hung, M.C. Comparison of Spatial Interpolation Techniques Using Visualization and Quantitative Assessment. 2016. Available online: https://www.intechopen.com/books/applications-of-spatial-statistics/comparison-of-spatial-interpolation-techniques-using-visualization-and-quantitative-assessment (accessed on 20 March 2020).
- Banerjee, S.; Carlin, B.P.; Gelfand, A.E. Hierarichical Modeling and Analysis for Spatial Data; Chapman and Hall/CRC Press: Boca Raton, FL, USA, 2004; 452p. [Google Scholar]
- Besag, J.; York, J. Bayesian image restoration, with two applications in spatial statistics. Ann. Inst. Stat. Math. 1991, 43, 1–20. [Google Scholar] [CrossRef]
- Diggle, P.J.; Ribeiro, P. Model-Based Geostatistics; Springer: New York, NY, USA, 2007; pp. 1–656. Available online: https://link.springer.com/book/10.1007/978-0-387-48536-2 (accessed on 1 November 2019).
- Mercer, L.; Wakefield, J.; Chen, C.; Lumley, T. A comparison of spatial smoothing methods for small area estimation with sampling weights. Spat. Stat. 2014, 8, 69–85. [Google Scholar] [CrossRef] [PubMed] [Green Version]
- Watjou, K.; Faes, C.; Lawson, A.; Kirby, R.S.; Aregay, M.; Carroll, R.; Vandendijck, Y. Spatial small area smoothing models for handling survey data with nonresponse. Stat. Med. 2017, 36, 3708–3745. [Google Scholar] [CrossRef]
- Chen, C.; Wakefield, J.; Lumely, T. The use of sampling weights in Bayesian hierarchical models for small area estimation. Spat. Spatio-Temporal Epidemiol. 2014, 11, 33–43. [Google Scholar] [CrossRef] [Green Version]
- Vandendijck, Y.; Faes, C.; Kirby, R.; Lawson, A.; Hens, N. Model-based inference for small area estimation with sampling weights. Spat. Stat. 2016, 18, 455–473. [Google Scholar] [CrossRef] [Green Version]
- Joubert, J.; Rao, C.; Bradshaw, D.; Dorrington, R.E.; Vos, T.; Lopez, A.D. Characteristics, availability and uses of vital registration and other mortality data sources in post-democracy South Africa. Glob. Health Action 2012, 5, 19263. [Google Scholar] [CrossRef]
- Zulu, L.C.; Kalipeni, E.; Johannes, E. Analyzing spatial clustering and the spatiotemporal nature and trends of HIV/AIDS prevalence using GIS: The case of Malawi, 1994–2010. BMC Infect. Dis. 2014, 14, 285. [Google Scholar] [CrossRef] [Green Version]
- Moise, I.; Kalipeni, E. Applications of geospatial analysis to surveillance data: A spatial examination of HIV/AIDS prevalence in Zambia. GeoJournal 2010, 77, 525–540. [Google Scholar] [CrossRef]
- Kalipeni, E.; Zulu, L.C. HIV and AIDS in Africa: A geographic analysis at multiple spatial scales. GeoJournal 2010, 77, 505–523. [Google Scholar] [CrossRef]
- Heywood, I.D.; Cornelius, S.; Carver, S. An Introduction to Geographical Information Systems; Addison Wesley Longman: New York, NY, USA, 1998. [Google Scholar]


| Focus of the Publication | Number | Percentage | Reference |
|---|---|---|---|
| Spatial Analysis Method | |||
| Description or Aggregation methods | 25 | 16.3% | [4,18,19,20,21,22,23,24,25,26,27,28,29,30,31,32,33,34,35,36,37,38,39,40,41] |
| Autocorrelation/Clustering | 19 | 12.4% | [42,43,44,45,46,47,48,49,50,51,52,53,54,55,56,57,58,59,60] |
| Spatial Regression and Interpolation | |||
| Kriging | 8 | 5.2% | [61,62,63,64,65,66,67,68] |
| Inverse Distance Weighting | 1 | 0.7% | [69] |
| Weighted Kernel Regression | 1 | 0.7% | [70] |
| Geographically Weighted Regression (GWR) | 4 | 2.6% | [71,72,73,74] |
| Spatial Smoothing and Prediction | |||
| Geostatistical data modelling | 32 | 20.9% | [6,41,61,62,64,65,66,67,68,72,75,76,77,78,79,80,81,82,83,84,85,86,87,88,89,90,91,92,93,94,95,96] |
| Lattice data modelling | 76 | 49.7% | [5,6,69,70,71,74,97,98,99,100,101,102,103,104,105,106,107,108,109,110,111,112,113,114,115,116,117,118,119,120,121,122,123,124,125,126,127,128,129,130,131,132,133,134,135,136,137,138,139,140,141,142,143,144,145,146,147,148,149,150,151,152,153,154,155,156,157,158,159,160,161,162,163,164,165,166,167] |
| Application Techniques | |||
| Nonstandard applications (e.g., spatial analysis model assessment, joint spatial modelling, accounting for survey design) | 15 | 9.8% | [5,6,74,122,123,128,132,142,150,151,153,155,157,159,160] |
| Survey design and inadequacy | |||
| Survey design | 4 | 2.6% | [74,122,153,160] |
| Non-response/missing | 2 | 1.3% | [122,159] |
| Computer Software Package | |||
| BayesX | 32 | 20.9% | [88,108,110,113,114,115,116,117,118,119,120,123,124,127,129,131,133,135,138,140,142,143,144,145,147,148,149,150,154,156,161,167] |
| WINBUGS/OPENBUGS | 23 | 15.0% | [47,61,65,67,75,80,91,92,104,112,119,123,128,130,134,142,146,147,155,159,160,161,165] |
| ArcGIS | 29 | 19.9% | [22,23,28,31,39,42,43,44,45,46,48,49,51,53,54,57,58,71,72,73,75,76,98,101,103,105,106,107,109] |
| R-prev package | 3 | 1.3% | [5,6,102] |
| QGIS | 1 | 0.7% | [20] |
| GeoDA | 4 | 2.6% | [21,43,59,71] |
| SaTSCAN | 9 | 5.9% | [45,48,50,51,52,54,103,108,109] |
| R-survey and mgcv package | 1 | 0.7% | [34] |
| ArcView | 1 | 0.7% | [36] |
| MapInfo professional | 2 | 1.3% | [47,104] |
| GeoR | 1 | 0.7% | [59] |
| INLA | 16 | 10.4% | [4,46,74,82,89,93,94,95,122,126,132,134,136,139,162,163] |
| Own code: Fortran | 4 | 3.0% | [63,64,68,78] |
| Study Population | |||
| Age group | |||
| Children (<15 years old) | 82 | 53.6% | [19,21,25,27,29,31,33,35,37,40,42,43,44,45,54,55,56,57,60,61,62,64,65,66,67,68,70,71,75,76,79,81,84,86,87,89,91,92,94,95,98,101,104,106,110,111,112,113,115,117,118,119,120,121,122,125,126,127,131,132,133,134,135,136,137,138,139,140,141,142,143,144,145,146,154,155,156,157,161,162,163,167] |
| Adults (≥15 years old) | 50 | 32.7% | [4,5,6,18,22,23,28,30,32,34,36,39,43,46,47,48,49,50,52,58,63,65,69,74,83,85,96,97,99,100,102,105,107,108,109,114,116,123,124,128,129,147,148,149,150,151,153,158,159,160] |
| All age groups | 17 | 11.1% | [20,24,26,38,53,72,77,80,82,88,90,103,130,152,165,166,167] |
| Gender | |||
| Male | 1 | 0.7% | [34] |
| Female | 23 | 15% | [18,23,28,32,36,46,58,59,74,88,96,99,100,107,109,114,116,124,128,148,150,154,160] |
| Both genders | 125 | 81.6% | [4,5,6,19,20,21,22,24,25,26,27,29,30,31,33,35,37,38,39,40,41,42,43,44,45,47,48,49,50,51,52,53,54,55,56,57,60,62,63,64,65,66,67,68,69,70,71,72,73,75,76,77,78,79,81,82,83,84,85,86,87,89,90,91,92,93,94,95,97,98,101,102,103,104,105,106,108,110,111,112,113,115,117,118,119,120,121,122,123,125,126,127,129,130,131,132,133,134,135,136,137,138,139,140,141,142,143,144,145,146,149,151,152,153,155,156,157,158,159,161,162,163,164,165,166,167] |
| Health Surveys | |||
| Demographic Health Survey | 93 | 60.8% | [4,5,18,20,21,22,23,25,26,27,28,30,33,36,38,39,40,42,44,45,48,49,50,52,54,55,56,57,58,59,60,61,62,68,69,71,76,81,82,85,86,87,88,95,97,98,99,100,102,103,105,106,109,110,111,113,115,116,118,120,121,122,123,124,127,129,131,133,135,137,140,141,142,143,144,146,147,148,150,151,153,154,155,156,157,158,159,162,163,167] |
| Malaria Indicator Survey | 17 | 11.1% | [31,37,60,63,64,67,70,77,78,79,80,89,92,93,101,107,136] |
| Multiple Indicator Cluster Survey | 5 | 3.3 | [75,113,125,140,145] |
| AIDS Indicator survey | 4 | 2.6% | [74,153,160,166] |
| Multi-Surveys | 12 | 7.8% | [6,20,24,53,66,90,96,108,119,130,159,165] |
| Country-Specific Surveys | 23 | 15.0% | [29,32,43,46,47,51,65,72,73,82,83,91,96,104,112,126,128,132,134,139,149,152,164] |
| Country of Study | |||
| Angola | 1 | 0.7% | [78] |
| Burkina Faso | 3 | 2% | [88,89,134] |
| Cameroon | 2 | 1.3% | [103,119] |
| Democratic Republic of Congo | 9 | 6.5% | [30,38,42,69,98,114,120,127,138] |
| Ethiopia | 7 | 4.6% | [45,50,55,58,105,109,167] |
| Equatorial Guinea | 1 | 0.7% | [51] |
| Egypt | 1 | 0.7% | [140] |
| Ghana | 2 | 1.3% | [4,29] |
| Kenya | 10 | 6.5% | [20,31,34,46,72,74,90,122,153,160] |
| Lesotho | 2 | 1.3% | [22,97] |
| Madagascar | 1 | 0.7% | [136] |
| Malawi | 17 | 11.1% | [77,102,110,113,114,120,121,123,133,134,145,154,156,157,158,161,162] |
| Mali | 1 | 0.7% | [68] |
| Mozambique | 2 | 1.3% | [32,43] |
| Multi-Country | 37 | 24.2% | [5,6,10,19,20,21,22,24,25,26,28,33,37,39,40,44,48,49,53,54,60,61,62,66,71,76,83,84,86,87,91,95,96,119,144,163,165] |
| Namibia | 2 | 1.3% | [101,155] |
| Nigeria | 17 | 11.1% | [32,46,77,83,87,97,111,114,125,126,130,134,136,138,139,143,144] |
| Rwanda | 3 | 2.0% | [97,100,116] |
| Senegal | 2 | 1.3% | [81,82] |
| Somalia | 5 | 3.3% | [75,126,132,139,164] |
| South Africa | 11 | 6.5% | [47,52,73,104,123,128,146,147,150,151,152] |
| Sudan | 1 | 0.7% | [130] |
| Tanzania | 4 | 2.6% | [63,70,106,166] |
| Uganda | 6 | 3.9% | [56,57,65,67,92,108] |
| Zambia | 5 | 3.3% | [80,93,96,107,129] |
| Zimbabwe | 2 | 1.3% | [36,119] |
| Method Category | Method | No. of References | Reference |
|---|---|---|---|
| Spatial Clustering and regression | Global Moran’s I | 3 | [42,44,45] |
| Local Moran’s I (LISA) | 3 | [30,46,47] | |
| Kulldorff’s spatial scan statistic | 7 | [45,48,49,50,52,53,54] | |
| Getis-Ord GI* statistic | 7 | [43,45,51,55,56,57,58] | |
| Anselin Local Moran’s I | 3 | [44,45,59] | |
| K-function | 1 | [60] | |
| Spatial Prediction and Interpolation | 10 | [61,62,63,64,65,66,67,68,69,70] | |
| Generalized Weighted Regression | 4 | [71,72,73,74] | |
| Spatial modelling and prediction | Bayesian geostatistical models | 32 | [6,41,61,62,64,65,66,67,68,72,75,76,77,78,79,80,81,82,83,84,85,86,87,88,89,90,91,92,93,94,95,96] |
| Bayesian conditional autoregressive (CAR) models | 76 | [5,6,69,70,71,74,97,98,99,100,101,102,103,104,105,106,107,108,109,110,111,112,113,114,115,116,117,118,119,120,121,122,123,124,125,126,127,128,129,130,131,132,133,134,135,136,137,138,139,140,141,142,143,144,145,146,147,148,149,150,151,152,153,154,155,156,157,158,159,160,161,162,163,164,165,166,167] | |
| Joint modelling | 12 | [5,74,126,128,132,142,150,151,155,157,159,160] |
| Health Discipline | Frequency |
|---|---|
| Mortality | 21 |
| Malaria and fever | 47 |
| HIV/AIDS | 24 |
| Non-communicable diseases | 9 |
| Malnutrition | 12 |
| Diarrhoea | 7 |
| Health services coverage | 38 |
| Other * | 5 |
© 2020 by the authors. Licensee MDPI, Basel, Switzerland. This article is an open access article distributed under the terms and conditions of the Creative Commons Attribution (CC BY) license (http://creativecommons.org/licenses/by/4.0/).
Share and Cite
Manda, S.; Haushona, N.; Bergquist, R. A Scoping Review of Spatial Analysis Approaches Using Health Survey Data in Sub-Saharan Africa. Int. J. Environ. Res. Public Health 2020, 17, 3070. https://doi.org/10.3390/ijerph17093070
Manda S, Haushona N, Bergquist R. A Scoping Review of Spatial Analysis Approaches Using Health Survey Data in Sub-Saharan Africa. International Journal of Environmental Research and Public Health. 2020; 17(9):3070. https://doi.org/10.3390/ijerph17093070
Chicago/Turabian StyleManda, Samuel, Ndamonaonghenda Haushona, and Robert Bergquist. 2020. "A Scoping Review of Spatial Analysis Approaches Using Health Survey Data in Sub-Saharan Africa" International Journal of Environmental Research and Public Health 17, no. 9: 3070. https://doi.org/10.3390/ijerph17093070
APA StyleManda, S., Haushona, N., & Bergquist, R. (2020). A Scoping Review of Spatial Analysis Approaches Using Health Survey Data in Sub-Saharan Africa. International Journal of Environmental Research and Public Health, 17(9), 3070. https://doi.org/10.3390/ijerph17093070