Service Perceptions in Fitness Centers: IPA Approach by Gender and Age


Abstract
1. Introduction
2. Materials and Methods
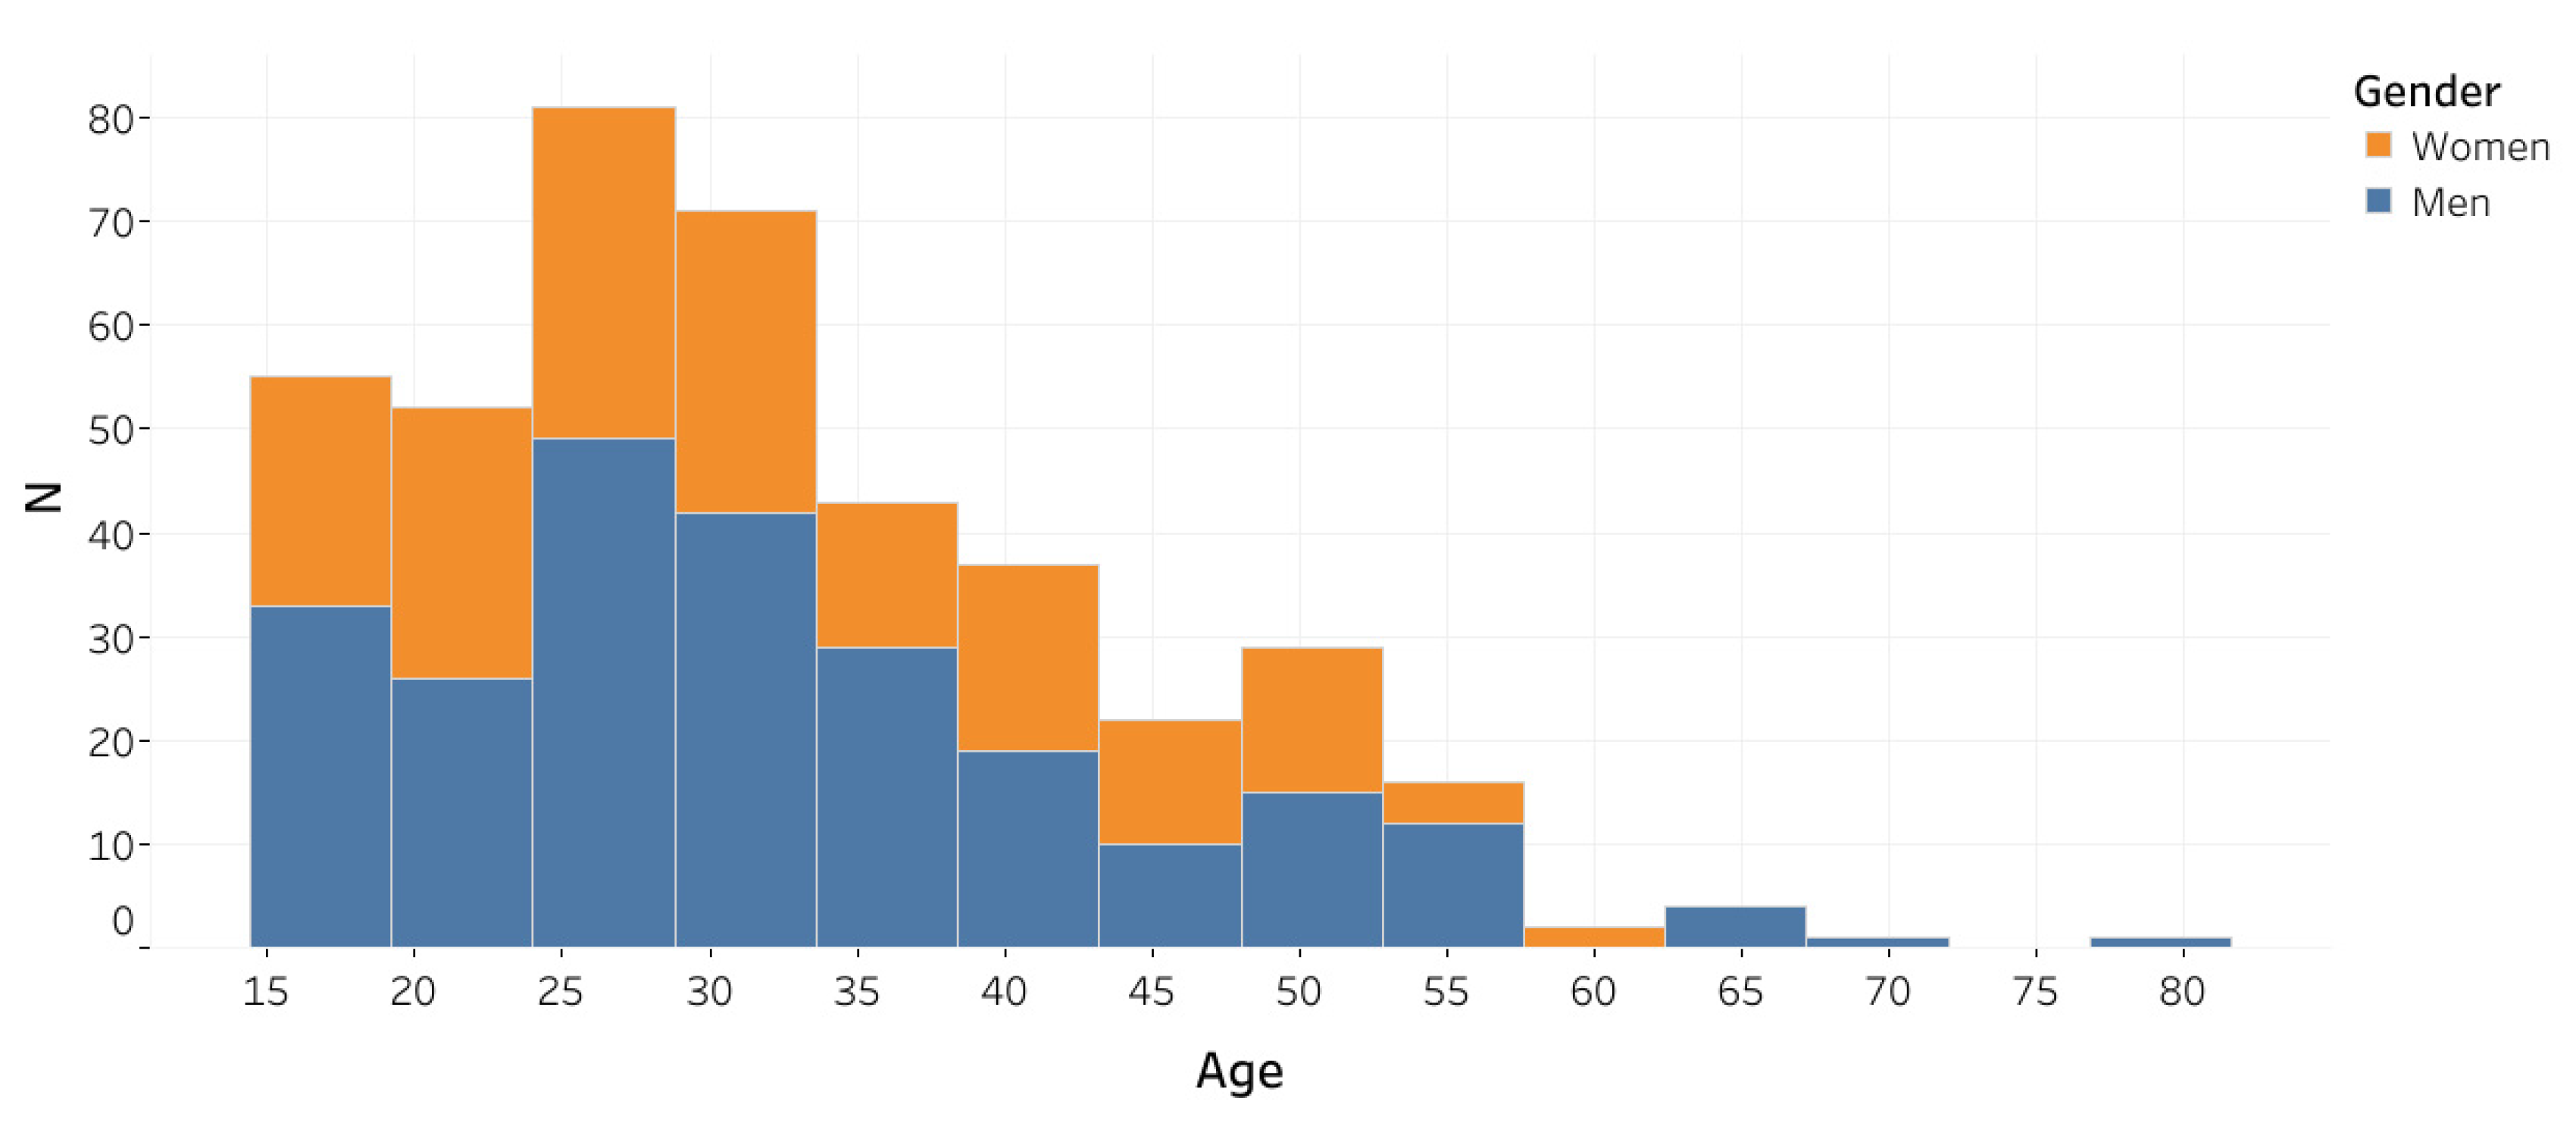
2.1. Design and Participants
2.2. Instrument
2.3. Procedure
2.4. Data Analysis
3. Results
3.1. Gender
3.2. Age
4. Discussion
5. Conclusions
Author Contributions
Funding
Acknowledgments
Conflicts of Interest
References
- IHRSA. The 2019 IHRSA Global Report; International Health; Racquet & Sportsclub Association: Boston, MA, USA, 2019. [Google Scholar]
- Gómez-Tafalla, A.M.; Mestre, J.A. La Importancia Del Gestor Deportivo En El Municipio; INDE: Barcelona, Spain, 2005. [Google Scholar]
- Cheung, R.; Woo, M. Determinants of Perceived Service Quality: An Empirical Investigation of Fitness and Recreational Facilities. Contemp. Manag. Res. 2016, 12, 363–370. [Google Scholar] [CrossRef][Green Version]
- Clavel, I.; García-Unanue, J.; Iglesias-Soler, E.; Felipe, J.L.; Gallardo, L. Prediction of Abandonment in Spanish Fitness Centres. Eur. J. Sport Sci. 2018, 19, 217–224. [Google Scholar] [CrossRef] [PubMed]
- Kruger, J.; Carlson, S.A.; Kohl, H.W. Differences in Perceived Access and Usage. Am. J. Prev. Med. 2007, 32, 500–505. [Google Scholar] [CrossRef] [PubMed]
- Puig, N.; Heinemann, K. El Deporte En La Perspectiva Del Año 2000. Pap. Rev. Sociol. 1991, 38, 123–141. [Google Scholar] [CrossRef]
- O’Neill, M.; Palmer, A. An exploratory study of the effects of experience on consumer perceptions of the service quality construct. Manag. Serv. Qual. Int. J. 2003, 13, 187–196. [Google Scholar] [CrossRef]
- Lagrosen, S.; Lagrosen, Y. Exploring Service Quality in the Health and Fitness Industry. Manag. Serv. Qual. 2007, 17, 41–53. [Google Scholar] [CrossRef]
- Alonso, D.; Rial, J.; Rial, A. Evaluación de La Calidad Percibida de Los Servicios Deportivos En El Ámbito Universitario. Revista de Psicología del Deporte 2013, 22, 143–150. [Google Scholar]
- Calabuig, F.; Quintanilla, I.; Mundina, J. La Calidad Percibida de Los Servicios Deportivos: Diferencias Según Instalación, Género, Edad y Tipo de Usuario En Servicios Náuticos. RICYDE Revista Internacional de Ciencias del Deporte 2008, 4, 25–43. [Google Scholar] [CrossRef]
- García-Fernández, J.; Bernal-García, A.; Lara, A.; Galán, P. La Calidad Percibida de Servicio y Su Influencia En La Fidelidad de Usuarios Mayores En Centros de Fitness Públicos. Escritos Psicol. 2013, 6, 26–34. [Google Scholar] [CrossRef]
- Yildiz, S.M. An Importance-Performance Analysis of Fitness Center Service Quality: Empirical Results from Fitness Centers in Turkey. Afr. J. Bus. Manag. 2011, 5, 7031–7041. [Google Scholar]
- Burillo, P.; Sánchez-Fernández, P.; Dorado, A.; Gallardo, L. Global Customer Satisfaction and Its Components in Local Sports Services. A Discrimminat Analysis. J. Sports Econ. Manag. 2012, 2, 16–33. [Google Scholar]
- Celestino, A.; Biencinto, C. La Satisfacción Del Cliente Externo En Organizaciones de Fitness. Estudio Empírico En Centros de La Comunidad de Madrid. Eur. J. Hum. Mov. 2012, 29, 115–132. [Google Scholar]
- Elasri, A.; Triadó, X.M.; Aparicio, P. La Satisfacción de Los Clientes de Los Centros Deportivos Municipales de Barcelona. Apunts Educación Física y Deportes 2015, 119, 109–117. [Google Scholar] [CrossRef]
- García-Mayor, J.; Vegara-Ferri, J.M.; López-Sánchez, G.F.; Díaz-Suárez, A. Satisfacción de Usuarios de Servicios Deportivos En Orihuela (Alicante). SPORT TK-Revista EuroAmericana de Ciencias del Deporte 2016, 5, 155–162. [Google Scholar] [CrossRef]
- Avourdiadou, S.; Theodorakis, N.D. The Development of Loyalty among Novice and Experienced Customers of Sport and Fitness Centres. Sport Manag. Rev. 2014, 17, 419–431. [Google Scholar] [CrossRef]
- García-Fernández, J. La Fidelidad de Clientes En Centros de Fitness Privados Españoles: La Cadena de Creación y Percepción de Valor. Ph.D. Thesis, Universidad de Sevilla, Seville, Spain, 2012. [Google Scholar]
- Baena-Arroyo, M.J.; García-Fernández, J.; Bernal-García, A.; Lara-Bocanegra, A. Influencia Del Valor Percibido En La Fidelidad de Los Clientes de Actividades Virtuales Frente a Las Actividades Con Técnico En Centros de Fitness. Kronos 2013, 12, 65–73. [Google Scholar]
- Bodet, G. Investigating Customer Satisfaction in a Health Club Context by an Application of the Tetraclasse Model. Eur. Sport Manag. Q. 2006, 6, 149–165. [Google Scholar] [CrossRef]
- Clerfeuille, F.; Poubanne, Y. Differences in the Contributions of Elements of Service to Satisfaction, Commitment and Consumers’ Share of Purchase: A Study from the Tetraclass Model. J. Target. Meas. Anal. Mark. 2003, 12, 66–81. [Google Scholar] [CrossRef]
- Martilla, J.A.; James, J.C. Importance-Performance Analysis. J. Mark. 1977, 41, 77–79. [Google Scholar] [CrossRef]
- Tarrant, M.A.; Smith, E.K. The Use of a Modified Importance-Performance Framework to Examine Visitor Satisfaction with Attributes of Outdoor Recreation Settings. Manag. Leis. 2002, 7, 69–82. [Google Scholar] [CrossRef]
- Rial, A.; Rial, J.; Varela, J.; Real, E. An Application of Importance-Performance Analysis (IPA) to the Management of Sport Centres. Manag. Leis. 2008, 13, 179–188. [Google Scholar] [CrossRef]
- Martínez-Caro, E.; Martínez-Caro, E.; Díaz-Suárez, A. La Calidad Del Servicio En Los Clubes de Fútbol Base de La Región de Murcia. Una Aplicación Del Análisis de Importancia-Satisfacción. SPORT TK-Revista EuroAmericana de Ciencias del Deporte 2014, 3, 33. [Google Scholar] [CrossRef][Green Version]
- Serrano-Gómez, V.; Rial, A.; Sarmento, J.P.; Carvalho, M.J. Análisis de Importancia Valoración (IPA) Como Herramienta de Diagnóstico En La Gestión de Clubes de Golf. Rev. Intercont. Gestão Desportiva 2014, 4, 86–98. [Google Scholar]
- Arias-Ramos, M.; Serrano-Gómez, V.; García-García, O. ¿Existen Diferencias En La Calidad Percibida y Satisfacción Del Usuario Que Asiste a Un Centro Deportivo de Titularidad Privada o Pública? Un Estudio Piloto. Cuad. Psicol. Deporte 2016, 16, 99–110. [Google Scholar]
- Zamorano-Solís, S.; García-Fernández, J. El Análisis de Importancia-Valoración Según Género y Permanencia: El Caso de Los Centros de Fitness. Materiales Para la Historia del Deporte 2018, 16, 24–35. [Google Scholar]
- León-Quismondo, J.; García-Unanue, J.; Burillo, P. Priorities in the Management of Fitness Centers. Application of Importance-Performance Analysis. J. Sports Econ. Manag. 2018, 8, 116–136. [Google Scholar]
- Ábalo, J.; Varela, J.; Rial, A. El Análisis de Importancia-Valoración Aplicado a La Gestión de Servicios. Psicothema 2006, 18, 730–737. [Google Scholar]
- Bacon, D.R. A Comparison of Approaches to Importance-Performance Analysis. Int. J. Mark. Res. 2003, 45, 55–71. [Google Scholar] [CrossRef]
- Alcaraz, N.; Soriano, C.; López, A.; Rosa, D.; Magraner, L.; Porcar, R.M.; Such, M.J.; Sánchez, J.J.; Prat, J.M. Factores de Éxito Desde La Perspectiva Del Usuario En Instalaciones Deportivas, de Ocio y Salud En Comunidad Valenciana; Instituto de Biomecánica de Valencia: Valencia, Spain, 2009. [Google Scholar]
- Nuviala, A.; Grao-Cruces, A.; Tamayo, J.A.; Nuviala, R.; Álvarez, J.; Fernández-Martínez, A. Diseño y Análisis Del Cuestionario de Valoración de Servicios Deportivos (EPOD2). Rev. Int. Med. Cienc. Act. Física Deporte 2013, 13, 419–436. [Google Scholar]
- Sánchez, J. Business & Fitness: El Negocio de Los Centros Deportivos; Editorial UOC: Barcelona, Spain, 2011. [Google Scholar]
- Baena-Arroyo, M.J.; García-Fernández, J.; Gálvez-Ruiz, P.; Grimaldi-Puyana, M. Analyzing Consumer Loyalty through Service Experience and Service Convenience: Differences between Instructor Fitness Classes and Virtual Fitness Classes. Sustainability 2020, 12, 828. [Google Scholar] [CrossRef]
- Afthinos, Y.; Theodorakis, N.D.; Nassis, P. Customers’ Expectations of Service in Greek Fitness Centers. Gender, Age, Type of Sport Center, and Motivation Differences. Manag. Serv. Qual. 2005, 15, 245–258. [Google Scholar] [CrossRef]
- Baena-Arroyo, M.J.; García-Fernández, J.; Bernal-García, A.; Lara-Bocanegra, A.; Gálvez-Ruiz, P. El Valor Percibido y La Satisfacción Del Cliente En Actividades Dirigidas Virtuales y Con Técnico En Centros de Fitness. Rev. Psicol. Deporte 2016, 25, 219–227. [Google Scholar]
- Águila, C.; Sicilia, A.; Muyor, J.M.; Orta, A. Cultura Posmoderna y Perfiles de Práctica En Los Centros Deportivos Municipales. Rev. Int. Med. Ciencias Act. Fis. Deporte 2009, 9, 81–95. [Google Scholar]
- Escamilla-Fajardo, P.; Núñez-Pomar, J.M. Satisfacción y Valor Percibido En Un Servicio Deportivo Público: Una Propuesta de Análisis y Acciones de Gestión. J. Sport. Econ. Manag. 2014, 4, 4–21. [Google Scholar]
- Pérez-Villalba, M.; García-Fernández, J.; Gómez-Chacón, R.; Fernández-Martínez, N. Las Actividades Dirigidas En Centros Deportivos y Su Valor Como Elemento de Fidelización. Sport TK Rev. Euroam. Ciencias Deporte 2018, 7, 17–26. [Google Scholar] [CrossRef]
- Thompson, W.R. Worldwide Survey of Fitness Trends for 2020. ACSMs Heal. Fit. J. 2019, 23, 10–18. [Google Scholar]
- Madeson, M.N.; Hultquist, C.N.; Church, A.; Fisher, L.A. A Phenomenological Investigation of Women’s Experiences With Personal Training. Int. J. Exerc. Sci. 2010, 3, 157–169. [Google Scholar]
- Cunningham, L.F.; Young, C.E.; Lee, M. A Customer-Based Taxonomy of Services: Implications for Service Marketers. Adv. Serv. Mark. Manag. 1997, 6, 189–202. [Google Scholar]
- Mañas-Rodríguez, M.Á.; Giménez-Guerrero, G.; Muyor-Rodríguez, J.M.; Martínez-Tur, V.; Moliner-Cantos, C.P. Los Tangibles Como Predictores de La Satisfacción Del Usuario En Servicios Deportivos. Psicothema 2008, 20, 243–248. [Google Scholar]
- Martínez-Tur, V.; Peiró, J.M.; Ramos, J. Linking Situational Constraints to Customer Satisfaction in a Service Environment. Appl. Psychol. Int. Rev. 2005, 54, 25–36. [Google Scholar] [CrossRef]


| Gender | N | Age in Years | SD |
|---|---|---|---|
| Women | 173 | 31.92 | 11.00 |
| Men | 241 | 31.62 | 11.85 |
| Items | Women | Men | |||||||||
|---|---|---|---|---|---|---|---|---|---|---|---|
| I | SD | P | SD | D | I | SD | P | SD | D | ||
| 1 | Accessibility: closeness to member homes | 4.83 | 0.53 | 4.23 | 1.08 | −0.60 ** | 4.75 | 0.67 | 4.25 | 0.91 | −0.50 ** |
| 2 | Fees | 4.24 | 1.02 | 3.73 | 1.06 | −0.51 ** | 4.09 | 1.10 | 3.77 | 0.94 | −0.32 ** |
| 3 | Hours and days of operation | 4.72 | 0.74 | 4.15 | 1.21 | −0.57 ** | 4.62 | 0.76 | 4.23 | 0.97 | −0.42 ** |
| 4 | Kindness and treat from staff | 4.64 | 0.64 | 4.14 | 1.03 | −0.50 ** | 4.14 | 1.00 | 4.13 | 0.87 | −0.01 ** |
| 5 | Achievement of outcomes from instructors | 4.28 | 0.88 | 3.81 | 1.04 | −0.47 ** | 4.09 | 1.00 | 3.56 | 0.96 | −0.53 ** |
| 6 | Gifts for attracting new customers | 4.17 | 1.03 | 3.06 | 1.12 | −1.11 ** | 3.79 | 1.19 | 2.96 | 1.12 | −0.83 ** |
| 7 | Gifts for rewarding current customers | 4.17 | 0.99 | 2.76 | 1.09 | −1.41 ** | 4.04 | 0.99 | 2.65 | 1.07 | −1.39 ** |
| 8 | Large activity spaces | 4.51 | 0.87 | 3.81 | 0.98 | −0.70 ** | 4.35 | 0.94 | 3.79 | 0.98 | −0.56 ** |
| 9 | Level of maintenance of activity spaces | 4.71 | 0.53 | 4.09 | 0.97 | −0.62 ** | 4.56 | 0.81 | 3.92 | 1.00 | −0.64 ** |
| 10 | Hygiene and cleanliness of activity spaces | 4.75 | 0.57 | 4.15 | 0.95 | −0.60 ** | 4.66 | 0.77 | 4.13 | 0.93 | −0.53 ** |
| 11 | Ventilation (temperature) of activity spaces | 4.56 | 0.80 | 3.84 | 1.07 | −0.72 ** | 4.47 | 0.85 | 3.76 | 1.09 | −0.71 ** |
| 12 | Number of pieces of equipment | 4.58 | 0.75 | 3.85 | 1.00 | −0.73 ** | 4.46 | 0.94 | 3.69 | 1.00 | −0.77 ** |
| 13 | Level of maintenance of equipment/material | 4.67 | 0.60 | 4.03 | 0.93 | −0.64 ** | 4.52 | 0.79 | 3.86 | 1.02 | −0.66 ** |
| 14 | Swimming pool/SPA (general) | 4.53 | 0.94 | 3.93 | 1.15 | −0.60 ** | 4.33 | 1.06 | 3.87 | 1.06 | −0.46 ** |
| 15 | Swimming pool temperature | 4.45 | 0.97 | 3.64 | 1.17 | −0.81 ** | 4.20 | 1.05 | 3.87 | 1.07 | −0.33 ** |
| 16 | Spacious and hygienic restrooms | 3.63 | 0.72 | 4.13 | 0.92 | +0.50 ** | 4.53 | 0.75 | 4.00 | 0.98 | −0.53 ** |
| 17 | Shower quality | 4.38 | 0.92 | 3.71 | 1.01 | −0.67 ** | 4.38 | 0.91 | 3.75 | 1.04 | −0.63 ** |
| 18 | Spacious and safe lockers | 4.51 | 0.83 | 3.98 | 0.98 | −0.53 ** | 4.40 | 0.90 | 3.65 | 1.08 | −0.75 ** |
| 19 | Hair dryer in restrooms | 4.25 | 1.03 | 3.72 | 1.15 | −0.53 ** | 3.85 | 1.10 | 3.50 | 1.12 | −0.35 ** |
| 20 | Variety and number of activities | 4.61 | 0.70 | 4.04 | 0.92 | −0.57 ** | 4.11 | 0.95 | 3.80 | 0.94 | −0.31 ** |
| 21 | Fitness service quality | 4.56 | 0.70 | 4.00 | 0.93 | −0.56 ** | 4.22 | 0.94 | 3.78 | 0.90 | −0.44 ** |
| 22 | Personal training quality | 4.41 | 0.97 | 3.72 | 1.09 | −0.69 ** | 4.05 | 1.02 | 3.59 | 0.97 | −0.46 ** |
| 23 | Lending towels service | 3.69 | 1.27 | 2.93 | 1.05 | −0.76 ** | 3.54 | 1.18 | 2.99 | 1.08 | −0.55 * |
| 24 | Personal hygiene products in restrooms | 3.76 | 1.27 | 2.90 | 1.06 | −0.86 ** | 3.67 | 1.15 | 3.11 | 1.17 | −0.56 ** |
| 25 | Medical/physiotherapist services | 4.21 | 1.05 | 3.44 | 0.94 | −0.77 ** | 3.91 | 1.13 | 3.12 | 1.15 | −0.79 ** |
| 26 | Cafeteria/restaurant | 3.63 | 1.31 | 3.33 | 1.21 | −0.30 | 3.51 | 1.16 | 3.30 | 1.07 | −0.21 * |
| 27 | Wi-Fi | 4.17 | 1.13 | 3.37 | 1.32 | −0.80 ** | 3.93 | 1.29 | 3.23 | 1.40 | −0.70 ** |
| 28 | Client profile in the fitness center | 4.06 | 0.94 | 3.68 | 0.90 | −0.38 ** | 3.97 | 0.97 | 3.72 | 0.82 | −0.25 ** |
| 29 | Fitness center as social meeting point | 3.60 | 1.20 | 3.60 | 0.93 | 0.00 | 3.52 | 1.25 | 3.65 | 0.91 | +0.13 |
| Mean | 4.32 | − | 3.72 | − | −0.60 | 4.16 | − | 3.64 | − | −0.52 | |
| Items | Importance | Performance | |
|---|---|---|---|
| Correlation with Gender | Correlation with Gender | ||
| 1 | Accessibility: closeness to member homes | 0.056 | 0.036 |
| 2 | Fees | 0.069 | −0.001 |
| 3 | Hours and days of operation | 0.104 * | 0.022 |
| 4 | Kindness and treat from staff | 0.098 * | 0.043 |
| 5 | Achievement of outcomes from instructors | 0.089 | 0.140 ** |
| 6 | Gifts for attracting new customers | 0.160 ** | 0.041 |
| 7 | Gifts for rewarding current customers | 0.029 | 0.048 |
| 8 | Large activity spaces | 0.097 * | 0.015 |
| 9 | Level of maintenance of activity spaces | 0.067 | 0.090 |
| 10 | Hygiene and cleanliness of activity spaces | 0.028 | 0.020 |
| 11 | Ventilation (temperature) of activity spaces | 0.056 | 0.038 |
| 12 | Number of pieces of equipment | 0.086 | 0.082 |
| 13 | Level of maintenance of equipment/material | 0.087 | 0.090 |
| 14 | Swimming pool/SPA (general) | 0.109 * | 0.054 |
| 15 | Swimming pool temperature | 0.145 ** | −0.092 |
| 16 | Spacious and hygienic restrooms | 0.089 | 0.064 |
| 17 | Shower quality | 0.012 | −0.023 |
| 18 | Spacious and safe lockers | 0.064 | 0.153 ** |
| 19 | Hair dryer in restrooms | 0.191 ** | 0.110 * |
| 20 | Variety and number of activities | 0.292 ** | 0.148 ** |
| 21 | Fitness service quality | 0.186 ** | 0.134 ** |
| 22 | Personal training quality | 0.204 ** | 0.078 |
| 23 | Lending towels service | 0.070 | −0.017 |
| 24 | Personal hygiene products in restrooms | 0.056 | −0.090 |
| 25 | Medical/physiotherapist services | 0.147 ** | 0.137 |
| 26 | Cafeteria/restaurant | 0.058 | 0.020 |
| 27 | Wi-Fi | 0.098 | 0.044 |
| 28 | Client profile in the fitness center | 0.039 | −0.013 |
| 29 | Fitness center as social meeting point | 0.023 | −0.035 |
| Items | Importance | Performance | |
|---|---|---|---|
| Correlation with Age | Correlation with Age | ||
| 1 | Accessibility: closeness to member homes | −0.049 | −0.050 |
| 2 | Fees | 0.088 | −0.021 |
| 3 | Hours and days of operation | 0.040 | −0.014 |
| 4 | Kindness and treat from staff | 0.071 | 0.001 |
| 5 | Achievement of outcomes from instructors | 0.085 | 0.082 |
| 6 | Gifts for attracting new customers | −0.085 | −0.042 |
| 7 | Gifts for rewarding current customers | 0.010 | −0.013 |
| 8 | Large activity spaces | 0.045 | −0.029 |
| 9 | Level of maintenance of activity spaces | −0.074 | −0.075 |
| 10 | Hygiene and cleanliness of activity spaces | −0.031 | −0.122 * |
| 11 | Ventilation (temperature) of activity spaces | −0.032 | −0.091 |
| 12 | Number of pieces of equipment | −0.040 | 0.008 |
| 13 | Level of maintenance of equipment/material | −0.063 | −0.086 |
| 14 | Swimming pool/SPA (general) | 0.047 | −0.041 |
| 15 | Swimming pool temperature | 0.018 | −0.118 |
| 16 | Spacious and hygienic restrooms | 0.014 | −0.062 |
| 17 | Shower quality | 0.046 | −0.018 |
| 18 | Spacious and safe lockers | −0.001 | −0.102 * |
| 19 | Hair dryer in restrooms | −0.012 | −0.008 |
| 20 | Variety and number of activities | −0.014 | −0.003 |
| 21 | Fitness service quality | −0.051 | −0.034 |
| 22 | Personal training quality | −0.035 | 0.013 |
| 23 | Lending towels service | 0.023 | −0.036 |
| 24 | Personal hygiene products in restrooms | 0.016 | 0.018 |
| 25 | Medical/physiotherapist services | 0.005 | −0.101 |
| 26 | Cafeteria/restaurant | 0.034 | −0.027 |
| 27 | Wi-Fi | −0.095 | 0.023 |
| 28 | Client profile in the fitness center | −0.043 | 0.012 |
| 29 | Fitness center as social meeting point | 0.023 | −0.002 |
© 2020 by the authors. Licensee MDPI, Basel, Switzerland. This article is an open access article distributed under the terms and conditions of the Creative Commons Attribution (CC BY) license (http://creativecommons.org/licenses/by/4.0/).
Share and Cite
León-Quismondo, J.; García-Unanue, J.; Burillo, P. Service Perceptions in Fitness Centers: IPA Approach by Gender and Age. Int. J. Environ. Res. Public Health 2020, 17, 2844. https://doi.org/10.3390/ijerph17082844
León-Quismondo J, García-Unanue J, Burillo P. Service Perceptions in Fitness Centers: IPA Approach by Gender and Age. International Journal of Environmental Research and Public Health. 2020; 17(8):2844. https://doi.org/10.3390/ijerph17082844
Chicago/Turabian StyleLeón-Quismondo, Jairo, Jorge García-Unanue, and Pablo Burillo. 2020. "Service Perceptions in Fitness Centers: IPA Approach by Gender and Age" International Journal of Environmental Research and Public Health 17, no. 8: 2844. https://doi.org/10.3390/ijerph17082844
APA StyleLeón-Quismondo, J., García-Unanue, J., & Burillo, P. (2020). Service Perceptions in Fitness Centers: IPA Approach by Gender and Age. International Journal of Environmental Research and Public Health, 17(8), 2844. https://doi.org/10.3390/ijerph17082844