1. Introduction
Soil is a natural resource with a high intrinsic value for ecosystems and humans that formed the environment with other factors, such as water, air, rock and organisms; therefore, it must be conserved and protected. In general, the content and distribution of chemical elements in soil depend on the composition of the parent rock, the soil-forming process, climate, topography and land use [
1,
2]. Thus, the chemical elements present in a soil can be lithogenic, pedogenic, and anthropogenic, especially the heavy metal elements contents in soils seriously changed by human activity (industry, household garbage and agriculture) [
3,
4].
How to eliminate the human impact and obtain the background value of heavy metals in soil are very important for the evaluation of soil pollution. Relative cumulative frequency and regression analysis are mainly used to constitute the heavy metal geochemical baseline in soils [
5,
6]. The relative cumulative frequency method was established in the 1990s, and then improved by domestic and overseas scholar. Regression analysis is good for revealed the geochemical natural background concentrations of elements without any anthropogenic enrichment.
With only trace levels in soils, heavy metals are well-established to be detrimental to human health and environment. Excessive heavy metal content will directly harm human health; it can even affect the growth and reproduction of animals and plants, and then affect the survival of organisms [
7,
8]. The content of heavy metals in the soils is relatively low in the natural state, but they tend to accumulate from human activities. The common heavy metals Cr, Mn, Co, Ni, Cu, Zn, As, Cd, Hg and Pb are not only ubiquitous in the soil, but also easy to be released by human activities. Therefore, it is beneficial for soil evaluation and human health to carry out research on these heavy metal elements.
In order to better evaluate the harm of heavy metals in soils to humans and the natural environment. Several attempts have been made to separate between anthropogenic and natural contributions on metal contents in soils. Previous studies showed these methods such as statistic evaluation of the outliers, regressions between metals and Al and Fe, and spatial analyses are good to identify heavy mental sources in soils, as well as to establish regional geochemical baseline [
9,
10]. Moreover, geo-accumulation and the enrichment factor are the common assessment methods of heavy metal in soils [
11,
12].
Many studies have focused on the content, evaluation, sources and distribution of heavy metal elements in soil in cities, villages and mountainous areas, but the related research in small-scale densely populated areas is less. In China, colleges and universities are typical places in small-scale densely populated areas. In this study, we report the latest heavy metal elements in soils from different regions in university campuses. The main research objectives are (1) determining the degrees of heavy metal pollution; (2) analyzing the spatial distribution characteristics and sources of heavy metal elements in soil; and (3) constituting the regional baseline geochemical and calculating the background of heavy metal.
2. Materials and Methods
2.1. Study Area
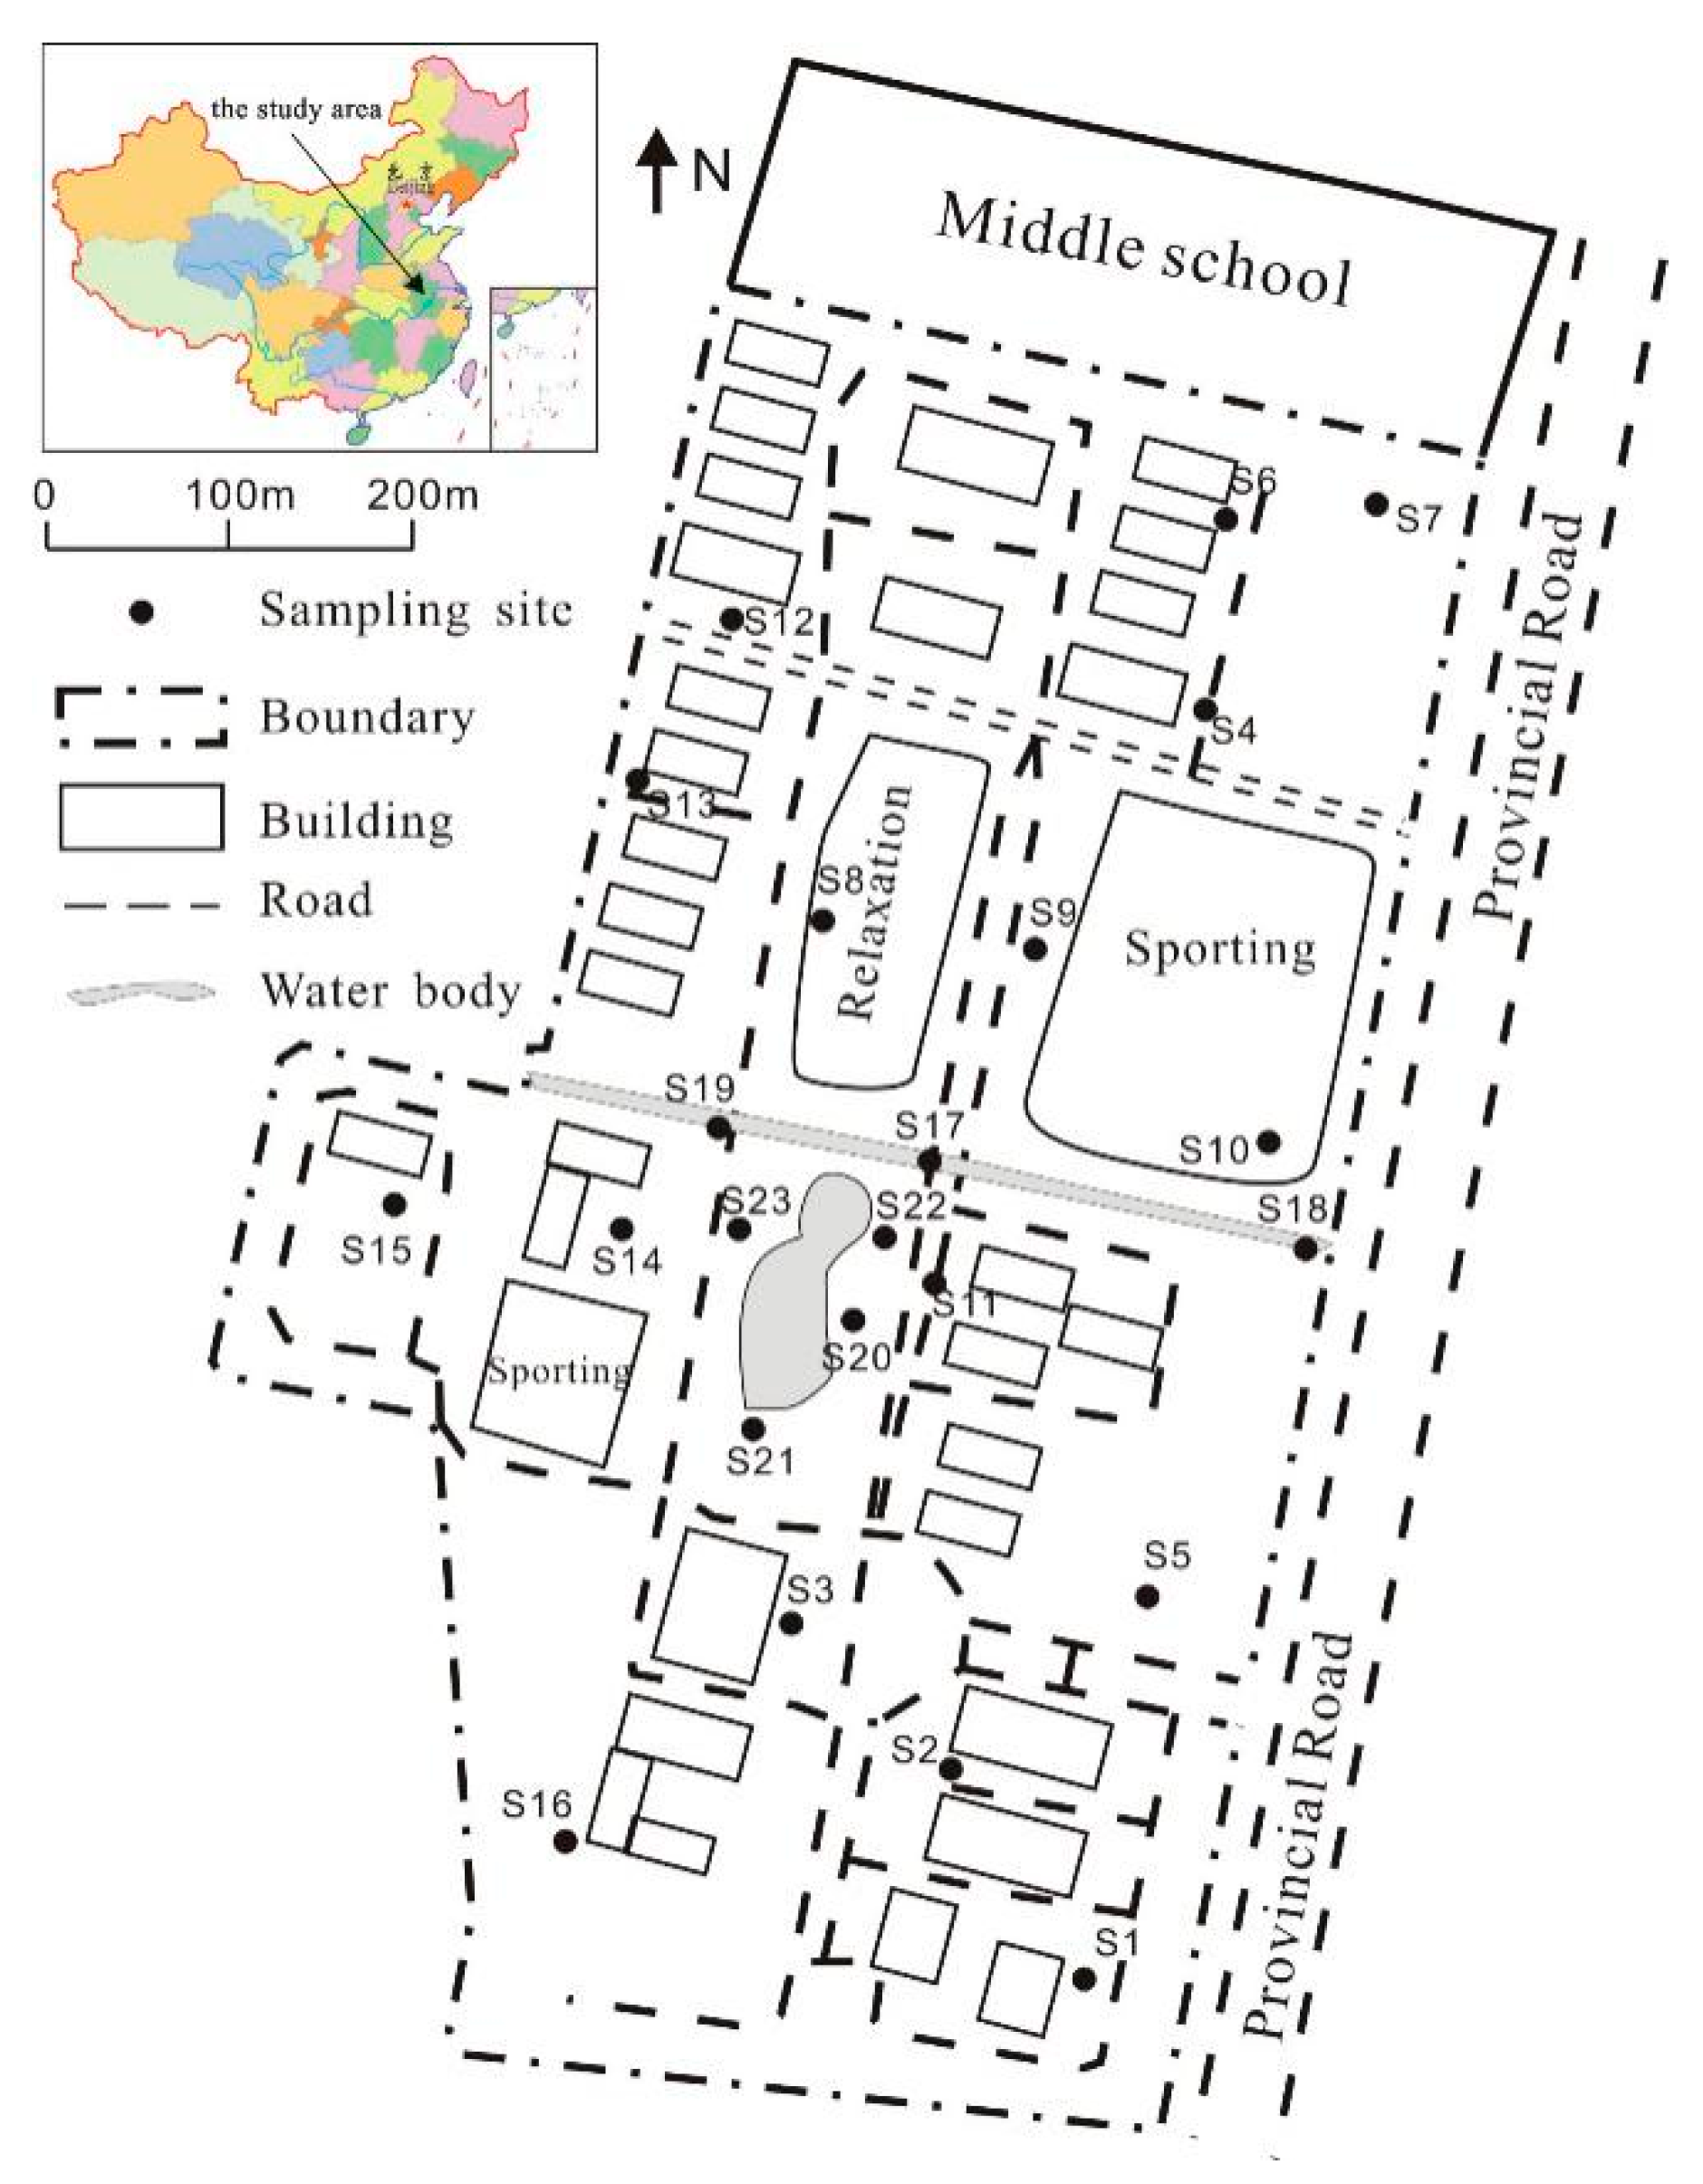
In order to facilitate the implementation of our research work, Suzhou University campus was selected as the research area. The campus was founded in 2004, with a permanent population of about 15,000 people, covering an area of about six hundred thousand square meters. The study area is located in the east of Suzhou city, in Northern Anhui Province, China (
Figure 1), with longitude ranging from 117.0796–117.0878° and latitudes from 33.6341–33.6449°. In the north and east of the campus are a middle school and a provincial road, respectively, and the south and west are surrounded by farmlands. Suzhou city has a large population and belongs to the warm temperate semi-humid monsoon climate area. The economy in the area is mainly agricultural plating and coal industry. There is an east–west river and a reservoir in the campus. Living areas are in the north of the river and include students’ dormitories, canteens and sports grounds. To the south of the river is the teaching area, including the experimental building, teaching building and library.
2.2. Sampling Test and Research Method
A total of 23 soil samples were collected in October 2019, and the site coordinates were noted (
Figure 1). Soil samples were collected from the outer surface, i.e., 5–15 cm depth, by using a plastic spatula, to for avoid the influence by metal tools. Then, samples were packed into polyethylene bags and returned to the laboratory. The soils were then air-dried at room temperature and pressed through a 2 mm stainless-steel mesh screen, to remove debris of plants and stones. About 100 g of soils were removed by using the quartered method, and then they were ground and pushed through another 200-mesh nylon sieve for analysis. Samples pellets were prepared for analysis of heavy metal elements by X-ray fluorescence (XRF) (Explorer 9000SDD) spectrometry (INOS China Co., Ltd, Shanghai City, China), a backing of boric acid in collapsible aluminum cups and pressing at 30 t of pressure. The ten heavy metal elements, Cr, Mn, Co, Ni, Cu, Zn, As, Cd, Hg and Pb, and the major element Fe, were measured. The experiment was carried out in the key laboratory of mine water resources utilization of Anhui education department. National standard sediment sample (GBW07307) was analyzed simultaneously for calibration, and the relative standard derivation was less than 10%.
Geo-accumulation index (
Igeo) and Enrichment factor (
EF) methods were selected to assess the pollution degree of heavy metal in soils. The
Igeo enables the assessment of contamination degrees by comparing the current and pre-industrial concentrations [
11], and it is calculated via Equation (1):
where
Cn is the measured concentration of the element in the samples, and
Bn is the background or pristine value of the element. Previous studies showed the measurement of I
geo can be subdivided into 5 degrees: <0—unpolluted; 0–1—light pollution; 1–3—moderate pollution; 3–5—heavy pollution; >5—serious pollution [
11].
The
EF is calculated via Equation (2):
where
Mx and
Mrx are the sample concentrations of the heavy metal and reference element, while
Mb and
Mrb are their concentrations in a suitable background or baseline reference material [
12].The
EF also could be subdivided into 5 degrees in previous studies: <2—unpolluted; 2–5—light pollution; 5–20—moderate pollution; 20–40—heavy pollution; >40—serious pollution [
12]. The
EF method normalizes the measured heavy metal content with respect to a sample reference metal such as Fe or Al [
13].
In the study of environmental geochemistry, statistical analyses, such as Principal Component Analysis and Cluster Analysis, are often used to reveal the relationship between elements or parameters. In particular, the Principle Component Analysis is an efficient way of displaying complex relationships among many variables and their roles, and the Principal Component Analysis was also used in this study, to explain the controlling factors of heavy metal content in soil. Relative cumulative frequency and regression analysis are mainly used to constitute the heavy metal geochemical baseline in soils. Regression analysis is good for revealing the geochemical natural background concentrations of elements without any anthropogenic enrichment [
6,
14]. The reference element, a fundamental or conservative tracer of the natural metal-bound phases, is assumed to have a uniform flux that forms the coastal bedrock. Various elements have been proposed in the literature to be the potential conservative reference element, such as Al and Fe [
6,
14]. All the statistical analyses of the data were performed by Minitab software (version 15), and the contour map of heavy metal spatial distribution was completed by Surfer software (version 8.0) (Kingsoft company, Beijing City, China).
3. Results and Discussion
3.1. Basic Description of Data
The basic statistical results of heavy metal in soils in study area and the background value in China are listed in
Table 1. It can be seen from
Table 1 that the average content of Fe is close to the soil background value of China (2.92%), with the value be 2.71% [
15]. The coefficient of variation (CV) could reflect the dispersion degree of the sample in space. As can be seen, the CV of element Fe is the lowest, which is 0.09%. Moreover, the average content of element Fe is 2.71 mg/kg, the same as the Median value. It also shows that the distribution of Fe content in soil is stable. In detail, the average contents of Ni, Cu, As, Cd and Hg in the sample are higher than the soil background values of China [
15], which are 40.06, 60.75, 25.03, 0.10 and 0.12 mg/kg, respectively. The average contents of other heavy metals are slightly lower than the soil background values. The CV of element Hg is highest, at 132.94%; the second is 82.80%, and Cu is the third, at 32.68. The CVs of all other heavy metals are smaller, less than 30%.
The average value of heavy metal exceeds the background value, which indicates that heavy metal in soil may be enriched by other sources. The maximum sample points of the heavy metal are analyzed and summarized as follows: (1) The concentrations of Cu, As and Cd in sample 17 are the highest, which are 101.37, 85.65 and 0.14 mg/kg; (2) the concentrations of Cr, Co, Pb and Fe in sample 2 are highest, which are 61.6, 12.43, 27.43 mg/kg and 3.39%; (3) the highest concentrations of Mn, Ni, Zn and Hg are distributed in sample 22, sample 14, sample 19 and sample 4, respectively, with the maximum value 698.07, 54.26, 116.22 and 0.55 mg/kg. It should be noted that sample 17’s site is located under the crossing bridge (Jiayan Bridge) between the main road and the river on the campus, and sample 2 was collected at the entrance of the biochemical laboratory building. Sample 22, sample 14, sample 19 and sample 4 were respectively located on both sides of the reservoir, under the bridge and near the canteen, respectively.
3.2. Environmental Risk Evaluation
The
Igeo and
EF are the common methods for heavy metal assessment in soils. As a "proxy" for the clay content, the element Fe is also considered to act as the reference element to calculate the
EF [
13]. The CV of Fe in
Table 1 shows the contents of the Fe in soils are stable and the average value of Fe content is close to the background value of China. These characteristics, such as stability and lack of obvious artificial sources, are the standards of selection of reference elements; thus, the element Fe is selected as the reference element in this study, to calculate the
EF of heavy metals.
According to the Equations (1) and (2), the
Igeo and
EF of heavy metal elements in soils were calculated, and the results of the
Igeo and
EF are also presented in
Table 1. In
Section 2.2 of this paper, the classification standards of
Igeo and
EF are introduced; according to the standard of
Igeo [
11], the elements Cu and As in the soil are slightly polluted, with the I
geo index 0.77 and 0.30. Moreover, other heavy metal elements are unpolluted, with the I
geo index being less than zero. Compare with the
EF standard [
12], the elements Cu and As in the soil are slightly polluted, with the
EF 2.92 and 2.50, and other heavy metal elements are almost unpolluted. The evaluation results of heavy metal pollution by
EF and
Igeo are basically the same. In conclusion, the heavy metal elements Cu and As in the soil of this area are slightly polluted, and other heavy metals are not polluted.
3.3. Statistical Analysis
As mentioned earlier, the Principle Component Analysis is an efficient way of displaying complex relationships among many variables and their roles [
16]. In order to further reveal the relationship between heavy metal elements in soils, the Principle Component Analysis is conducted for the heavy metal concentrations. The rotated Principal Component Loadings are given in
Table 2 and
Figure 2.
Three Principal Components emerged with the eigenvalue all bigger than 1, which explained more than 76.48% of cumulative variance. The PC1 represents Cd, Cu, Ni and As, with 34.07% of the total variance, while the PC2 includes Fe, Co, Pb, Cr and Mn, with 28.41% of the total variance. The elements Zn and Hg are controlled by PC3, with 14.01% of the variance. The score plot of the three PCs are shown in
Figure 2, and it is characterized by the following: (1) The elements Cu, Ni, As and Cd are considered a group for the higher values in PC1; (2) the elements Fe, Pb, Co and Mn are considered a group for the similar behavior; (3) the elements Zn and Hg are separate, with their representative high value in PC3; (4) the element Cr has a higher value in PC2 and PC1.
Combined with the previous results of elements, Cu and As in soils are lightly polluted, though the PC1 could be one of the factors contributing to the heavy metal concentrations in the soils of the study area. Previous studies show that alloy, fertilizer, coating, mining and smelting could discharge Cu, Ni, As and Cd at the same time, which leads to the enrichment of heavy metal in soils, water bodies and street dust [
17]. The University campus was farmland before the construction, and there were no industrial activities such, as alloy, coating and mining. Moreover, it is speculated that the Cd, Cu, Ni and As in soils are mainly caused by agricultural activities of chemical fertilizer; thus, PC1 represents the impact of agricultural activities. The element Fe is lacking obvious artificial sources, and the elements Co, Pb, Cr and Mn are unpolluted; PC2 represents the natural Pedogenesis in the area. Similarly, the main human activities that can release Zn and Hg at the same time are chemicals, batteries, fertilizers and mining. Thus, PC3 could represent the chemicals and batteries for the higher value of Zn and Hg in PC3.
3.4. Distribution of Heavy Metals
The contour map of spatial distribution of heavy metal elements can reveal the distribution characteristics, spatial migration and sources of heavy metals to a certain extent [
18,
19]. The contour map of spatial distribution of heavy metals in the study area was plotted by Surfer software (
Figure 3), and the Kriging interpolation method was used to calculate the unmeasured area. As a whole, the content of heavy metal elements in the living area in the north of the campus is relatively low, while the content in the teaching area in the south is relatively high, except for the element Hg. The element Hg has different characteristics from other heavy metal elements; it had a higher value in the living area and a lower value in the teaching area. It is concluded that the discharge of domestic waste, including waste batteries, may lead to the enrichment of Hg in the soil of the northern living area.
In addition, the elements Cu, As and Cd are enriched in the river bridge in the campus. Combined with the results of the previous principal component analysis, these elements may be enriched in the soil due to the fertilization process. Therefore, the enrichment of Cu, As and Cd in the campus is related to the surrounding farmland, which may be brought by the river runoff from upstream. Although the elements Mn, Ni and Zn are enriched around the reservoir in campus, the overall content of Mn, Ni and Zn in the study area is not high, and the impact of human activities is weak. This enrichment may reveal a local sink formed by the influence of topography and rainwater runoff in the campus. In addition, the elements Cr, Co and Pb are enriched in the experimental building and teaching building area, which should be affected by biochemical experiments and vehicle parking.
3.5. Regional Geochemical Baseline of Heavy Metal
The regression analysis is often used to construct geochemical baseline, for it can eliminate the influence of anthropogenic and reveal the geochemical natural background concentrations of elements [
20]. Moreover, the selection of the reference element is very important before the regression analysis. The reference element is the basic or conservative tracer of the natural metal combination, and a variety of elements are proposed as potential conservative reference elements, such as Al, Fe, Li, Sc and so on. Among these elements, the elements Al and Fe are the most frequently used elements, for they are easily detected.
In addition,
Section 3.1 in the paper mentions that the content and distribution of element Fe are stable and not affected by the environment. Therefore, Fe is selected as the reference element to establish the regional geochemical baseline of heavy metal in soils. The established regional geochemical baseline equation of heavy metal is shown in
Figure 4. The regression equations between all ten heavy metals and Fe, the 95% confidence interval and prediction interval can be seen in
Figure 4.
At present, the median of elements in the samples are very close to the average of all 10 heavy metal elements, indicating that the statistical distribution patterns of different heavy metal in samples are similar. What is also evidenced is the CV of heavy metals in
Table 1. All 23 soil samples can be obtained from single and uniform parent materials, and their relatively small variability and narrow range between the minimum and maximum values of all elements also confirm this. In addition, this view is supported by the scenario that almost all soil samples in
Figure 4 are within the 95% prediction range.
Previous studies show that the background concentration is determined by analyzing samples which are not affected by human activities, or at least affected by human activities, or according to the regression analysis calculation of standardized elements, or calculated by regression analysis, which based on the normalized element to select the upper 95% confidence interval of the linear regression between reference element and element of interest [
21,
22].
All data points which fall inside the 95% confidence band can be designated as natural sediments, without any contamination, while points above this area can be considered to be sediments with heavy metal accumulated from anthropogenic source. Thus, the regional background concentrations of heavy metal elements could be calculated by the average values of the natural sediment samples. According to the regression curve (
Figure 4), in the 95% confidence interval of the regression curve, the number of sample points of heavy metal elements Cr, Mn, Co, Ni, Cu, Zn, As, Cd, Hg and Pb is 10, 11, 10, 7, 11, 16, 15, 9, 9 and 9, respectively. These sample points can be considered to be natural soil sample points without anthropogenic origin, and the average value of these sample points is the background value of heavy metal in the campus. Thus, the background values of the heavy metals Cr, Mn, Co, Ni, Cu, Zn, As, Cd, Hg and Pb are 50.90, 489.37, 11.76, 37.74, 55.70, 58.22, 20.07, 0.09, 0.08 and 24.13 mg/kg, respectively.
4. Conclusions
The average values of Ni, Cu, As, Cd and Hg contents were higher than the background values of Chinese soil, and the CV of Hg and As were bigger. The elements Cu and As were slightly polluted based on the evaluation methods of Igeo and EF, while other heavy metal elements were not. Principal component analysis showed that the elements Cd, Cu, Ni and As in soils were mainly caused by agricultural activities of chemical fertilizer, and the elements Co, Pb, Cr and Mn represented the natural Pedogenesis in the area, whereas the elements Zn and Hg were impacted by the chemicals and batteries.
With the exclusion of Hg, the other nine heavy metal elements had the lower concentrations in the living area in the north of the campus, while the values in the teaching area in the south were relatively higher. The enrichment of Hg in soil could be induced by the domestic waste, including waste batteries. The elements of Cu, As and Cd were enriched in the river bridge in the campus, which were related to the surrounding farmland. The reservoir in the campus, as a lock sink formed by the topography, enriched the element Mn, Ni and Zn. The spatial enrichments of Cr, Co and Pb were caused by biochemical experiments and vehicle parking.
The regression curves between heavy metal elements and Fe were established in the 95% confidence interval; the number sample points of heavy metal elements Cr, Mn, Co, Ni, Cu, Zn, As, Cd, Hg and Pb was 10, 11, 10, 7, 11, 16, 15, 9, 9 and 9, respectively. The background values of the heavy metals Cr, Mn, Co, Ni, Cu, Zn, As, Cd, Hg and Pb were 50.90, 489.37, 11.76, 37.74, 55.70, 58.22, 20.07, 0.09, 0.08 and 24.13 mg/kg, respectively.
Author Contributions
Methodology, S.C.; software, S.C. and C.W.; investigation, S.H. and Q.C.; data curation, S.H.; writing—original draft preparation, S.C.; writing—review and editing, S.C. and C.W.; funding acquisition, S.C. All authors have read and agreed to the published version of the manuscript.
Funding
The study was supported by the natural Science Projects of Colleges and Universities in Anhui Province (KJ2018A0450), the Natural Science Foundation of Anhui Province (1708085QE125) and the National Natural Science Foundation of China (41773100).
Acknowledgments
The authors would like to thank the National Engineering Research Center of Coal Mine Water Hazard Controlling (Suzhou University). We also acknowledge the editor and the anonymous reviewers for their constructive and valuable comments that largely improved the paper.
Conflicts of Interest
The authors declare no conflict of interest. The funders had no role in the design of the study, in the collection, analyses or interpretation of the data; in the writing of the manuscript; or in the decision to publish the results.
References
- Bravo, S.; García-Ordiales, E.; García-Navarro, F.J.; Amorós, J.Á.; Pérez-de-los-Reyes, C.; Jiménez-Ballesta, R.; Higueras, P. Geochemical distribution of major and trace elements in agricultural soils of Castilla-La Mancha (central Spain): Finding criteria for baselines and delimiting regional anomalies. Environ. Sci. Pollut. R. 2019, 26, 3100–3114. [Google Scholar] [CrossRef] [PubMed]
- Korobova, E. Soil and landscape geochemical factors which contribute to iodine spatial distribution in the main environmental components and food chain in the central Russian plain. J. Geochem. Explor. 2010, 107, 180–192. [Google Scholar] [CrossRef]
- Zheng, Y.; Chen, T.; He, J. Multivariate geo-statistical analysis of heavy metals in top soils from Beijing, China. J. Soil Sediment 2008, 8, 51–58. [Google Scholar] [CrossRef]
- Ihedioha, J.N.; Ukoha, P.O.; Ekere, N.R. Ecological and human health risk assessment of heavy metal contamination in soil of a municipal solid waste dump in Uyo, Nigeria. Environ. Geochem. Hlth. 2017, 39, 497–515. [Google Scholar] [CrossRef] [PubMed]
- Newman, C.P.; Gray, T. Statistical and geochemical fingerprinting analysis of arsenic mobilization and natural background associated with artificial groundwater recharge. Environ. Earth Sci. 2019, 78, 298. [Google Scholar] [CrossRef]
- Lin, C.; He, M.; Li, Y.; Liu, S. Content, enrichment and regional geochemical baseline of antimony in the estuarine sediment of the Daliao river system in China. Chemi. Der. Erde. 2012, 72, 23–28. [Google Scholar] [CrossRef]
- Piscopo, M.; Ricciardiello, M.; Palumbo, G.; Troisi, J. Selectivity of metal bioaccumulation and its relationship with glutathiones-transferase levels in gonadal and gill tissues ofmytilus galloprovincialisexposed to ni (ii), cu (ii) and cd (ii). Rend Lincei 2016, 27, 737–748. [Google Scholar] [CrossRef]
- Piscopo, M.; Trifuoggi, M.; Scarano, C.; Gori, C.; Giarra, A.; Febbraio, F. Relevance of arginine residues in Cu (II)-induced DNA breakage and Proteinase K resistance of H1 histones. Sci. Rep. 2018, 8, 1–10. [Google Scholar] [CrossRef] [PubMed]
- Mil-Home, M.; Stevens, R.L.; Cato, I.; Abrantes, F. Regional geochemical baseline for Portuguese shelf sediments. Environ. Pollut. 2007, 148, 418–427. [Google Scholar] [CrossRef] [PubMed]
- Schiff, K.C.; Weisberg, S.B. Iron as a reference element for determining trace metal enrichment in Southern Califormia coastal shelf sediments. Mar. Environ. Res. 1999, 48, 161–176. [Google Scholar] [CrossRef]
- Muller, G. Index of geo-accumulation in sediments of the Rhine River. J. Geol. 1969, 2, 108–118. [Google Scholar]
- Ravichandran, M.; Baskaran, M.; Santschi, P.H. History of trace metal pollution in Sabine-Neches Estuary, Beaumont, Texas. Environ. Sci. Technol. 1995, 29, 1495–1503. [Google Scholar] [CrossRef] [PubMed]
- Salomons, W.; Forstner, U. Metal in the Hydrocycle; Springer: Berlin/Heidelberg, Germany; Tokyo, Japan, 1984. [Google Scholar]
- Su, Y.Z.; Yang, R. Background concentrations of elements in surface soils and their changes as affected by agriculture in the desert-oasis ecotone in the middle of Herhe River Basin, North-west China. J. Geochem. Explor. 2008, 98, 57–64. [Google Scholar] [CrossRef]
- China environmental monitoring station. Background Value of Soil Elements in China; China Environmental Science Press: Beijing, China, 1990. [Google Scholar]
- Hou, D.; O’Connor, D.; Nathanail, P.; Tian, L.; Ma, Y. Integrated GIS and multivariate statistical analysis for regional scale assessment of heavy metal soil contamination: A critical review. Environ. Pollut. 2017, 231, 1188–1200. [Google Scholar] [CrossRef] [PubMed]
- Siegel, F.R. Environmental Geochemistry of Potential Toxic Metals; Springer: Berlin/Heidelberg, Germany, 2002. [Google Scholar]
- Hu, C.; Alan, L.W.; Lian, G. Estimating the Spatial Distribution of Soil Properties Using Environmental Variables at a Catchment Scale in the Loess Hilly Area, China. Int. J. Environ. Res. Public Health 2019, 16, 491. [Google Scholar] [CrossRef] [PubMed]
- Li, F.; Xiao, M.; Zhang, J.; Liu, C.; Qiu, Z.; Cai, Y. Spatial distribution, chemical fraction and fuzzy comprehensive risk assessment of heavy metals in surface sediments from the Honghu Lake, China. Int. J. Environ. Res. Public Health 2018, 15, 207. [Google Scholar] [CrossRef] [PubMed]
- Jiang, J.; Wang, J.; Liu, S.; Lin, C.; He, M.; Liu, X. Background, baseline, normalization, and contamination of heavy metals in the Liao River Watershed sediments of China. J. Asian Earth Sci. 2013, 73, 87–94. [Google Scholar] [CrossRef]
- Ouali, N.; Belabed, B.E.; Chenchouni, H. Modelling environment contamination with heavy metals in flathead grey mullet Mugil cephalus and upper sediments from north African coasts of the Mediterranean Sea. Sci. Total. Environ. 2018, 639, 156–174. [Google Scholar] [CrossRef] [PubMed]
- Sun, X.; Fan, D.; Liu, M.; Tian, Y.; Pang, Y.; Liao, H. Source identification, geochemical normalization and influence factors of heavy metals in Yangtze River Estuary sediment. Environ. Pollut. 2018, 241, 938–949. [Google Scholar] [CrossRef]
© 2020 by the authors. Licensee MDPI, Basel, Switzerland. This article is an open access article distributed under the terms and conditions of the Creative Commons Attribution (CC BY) license (http://creativecommons.org/licenses/by/4.0/).


