Review

The Effects of Short-Term and Long-term Hearing Changes on Music Exposure: A Systematic Review and Meta-Analysis

1
Laboratory of Hearing and Technology, Research Institute of Audiology and Speech Pathology, College of Natural Sciences, Hallym University, Chuncheon 24252, Korea
2
Division of Speech Pathology and Audiology, College of Natural Sciences, Hallym University, Chuncheon 24252, Korea
3
Department of Otorhinolaryngology-Head and Neck Surgery, Yonsei University Wonju College of Medicine, Wonju 26426, Korea
*
Author to whom correspondence should be addressed.
Int. J. Environ. Res. Public Health 2020, 17(6), 2091; https://doi.org/10.3390/ijerph17062091
Submission received: 24 February 2020 / Revised: 18 March 2020 / Accepted: 18 March 2020 / Published: 21 March 2020
(This article belongs to the Section Health Care Sciences & Services)

Abstract

:
The present study explores the scientific evidence on whether music exposure temporarily or permanently affects hearing sensitivity in young adults. Six electronic databases were searched using related keywords for the four categories of personal listening devices, listening habits, hearing outcomes, and age. The Hedges’ g and its 95% confidence intervals (CIs) were estimated. A Higgins I2 was also used to check for heterogeneity. To test for publication bias, funnel plots were drawn using Egger’s regression. Based on the inclusion criteria, 16 studies were divided into two groups to identify short-term hearing changes (n = 7) and long-term hearing changes (n = 9). In the short term, there was no significant immediate change in the thresholds or amplitudes after the music exposure, although pure-tone thresholds (PTAs) and distortion product otoacoustic emissions (DPOAEs) did show the highest effect size (−0.344, CI −0.727 to 0.038) and (0.124, CI −0.047 to 0.296) at 4 kHz. On the other hand, for long-term hearing changes, the PTA provided the highest effect size at 6 kHz (−0.525, CI −0.897 to −0.154) and 8 kHz (–0.486, CI −0.819 to −0.152), while also implying that habitual and repeated personal listening device (PLD) usage can act on some significant hearing changes in audiological tests. We conclude that the use of a PLD produces a few temporary hearing changes at 4 kHz after its use but that the changes are then reversed. However, it is important to note heavy PLD users’ experience regarding permanent changes in their hearing thresholds at high frequencies, and the public should be educated on this issue.

1. Introduction

Excessive noise exposure, which usually causes damage to the ear’s hair cells, is considered a major cause of hearing disorders worldwide [1]. According to current scientific reporting, nonoccupational noise exposure, such as recreational noise, occurs in as much as 21% of hearing disorders, as opposed to occupational noise at less than 16% [1]. Thus, many contemporary researchers have become concerned about the hearing loss induced by listening to music on personal listening devices (PLDs) in public [2,3].
PLDs have become increasingly popular over the last two decades, and their form has changed from a portable CD player, MP3 player, or iPod [4] to a mobile phone (or smartphone) with a free MP3 player function [5]. With their rapid development, PLDs allow users to listen to high-quality music for an unlimited time at a high volume while providing more listening convenience; that is, they are easy to carry, have longer battery life, and offer larger music storage capacity [6].
Notably, potentially substantial evidence in the literature shows an increasing potential risk from excessive music exposure to young adults’ listening to their music using PLDs [3,5]. In addition, the prevalence of hearing loss with music exposure in young adults ranges from 9.3% to 14%, depending on the study or nation [7]. In addition, several studies have demonstrated that maximum outputs of PLDs can exceed 125 dBA [8]. The preferred listening levels (PLLs) adopted by young users range from 71 to 105 dBA [5,9,10], but approximately 58% of adolescents and college students have exceeded that recommended maximum noise exposure [11], and the prevalence of increased hearing thresholds due to public music exposure via PLDs has not been overlooked [12]. Furthermore, various studies have reported an association between exposure to music at a high intensity and hearing deterioration, including temporary threshold shifts (TTS), tinnitus, hyperacusis, and recruitment, all of which eventually produce permanent hearing loss to the users [2,13,14]. In other words, such hearing deterioration seems to be temporary and quickly recovered at an early stage of music exposure; however, these temporary changes can naturally develop into a permanent hearing loss from habituated and accumulated exposure [12] and then accelerate into an age-related hearing loss [15].
In summary, it is worth exploring the existing evidence to compare between temporary (short-term) and permanent (long-term) hearing changes; by doing so, we can better understand the different aspects of young adults’ hearing changes resulting from excessive music exposure to achieve better public health. Moreover, it is important to characterize the early identification of excessive music exposure on hearing, if any, using a combination of tools that can detect hearing damage at the initial subclinical stage. In this light, the purpose of the present review and meta-analysis is to review new and timely literature for a comparison of the short-term and long-term hearing changes in young PLD users who use these devices often and heavily.

2. Materials and Methods

2.1. Strategy for Systematic Search

To provide transparency in the systematic search and selection, the present study followed the methodology and protocols of the preferred reporting items for the Systematic reviews and meta-analyses (PRISMA) statement [16] and International prospective register of systematic reviews (PROSPERO), part of the National Institute for Health Research (NIHR) [17]. Consequently, the study pre-established data extraction and analysis using inclusion and exclusion criteria for its systematic review procedure (see Figure 1).
To identify articles for inclusion, six electronic databases (i.e., Embase, Medline, PubMed Central, Web of Science, Scopus, and the cumulative index to nursing and allied health (CINAHL)) were searched in October 2019 using the key terms listed in Appendix A. The terms were divided into four groups: (1) PLDs, (2) listening intensity and duration through PLDs, (3) related hearing conditions and symptoms, and (4) age. The terms associated with each group were then listed by the Boolean term “OR” and the resulting four groups were combined using the Boolean term “AND.” The final search was conducted on 25 October, 2019.

2.2. Selection Criteria

All inclusion criteria were consistent in terms of the participants, intervention, control, outcomes, and study design (PICOS) strategy [18]. The PICOS criteria are described in Table 1. Articles that did not correspond to the topic that were not journal articles (letter, book, conference proceeding, only including the abstract and pilot study), or were not peer-reviewed studies and/or written in English were excluded.

2.3. Selection Process for Studies and Data Extraction

Based on combinations of the key terms in different databases (see Appendix A), the articles with potential relevance were identified by carefully investigating the titles and abstracts, while removing duplicate articles. The two authors independently screened all searched articles for eligibility in terms of specific inclusion and exclusion criteria. In the case of inconsistency in interpretation, the authors discussed the issue until the criteria were consistent and then selected the final analysis subjects. Subsequently, the authors assessed the full text of selected articles with a thorough compliance verification following the PICOS criteria. The review and systematic extraction of the data from the studies were included in the systematic review.

2.4. Assessment of the Quality of the Studies

To assess the quality of the selected studies, the Newcastle–Ottawa scale (NOS) for cohort study [19] was used in the present study. The NOS consists of three subcategories (i.e., selection, comparability, and outcomes) with eight items in total. A star system was used to allow a quantitative assessment of study quality, with one star for each item, with the exception of item-related comparability that allowed the assignment of two stars. As a result, the NOS quantitative measure ranged between zero and nine stars.

2.5. Statistical Analysis

In the present study, a statistical software program for meta-analysis, Comprehensive meta-analysis, (Version 3; Biostat, Englewood, NY, USA) was used. After the selected studies were divided according to the designated study design, a meta-analysis was carried out to compare changes in the effect size for both hearing thresholds of pure-tone audiometry (PTA) and amplitude of otoacoustic emissions (OAEs) for the experimental and control groups, for both short-term and long-term hearing changes. For each meta-analysis, the effect size was calculated as Hedges’ g, along with the 95% confidence interval (CI) with a p < 0.05 significance set. The heterogeneity between the studies was calculated as the I2. The degree of heterogeneity was set at low (I2 <40%), medium (40% < I2 <60%), and high (60% < I2) levels. A randomized model was applied to estimate the combined effect. To determine the source of any heterogeneity, a meta-regression analysis was also performed. For additional insight, subgroup analyses were performed based on the PLLs and exposure times. Any small study effects were explored using funnel plots and Egger’s regression.

3. Results

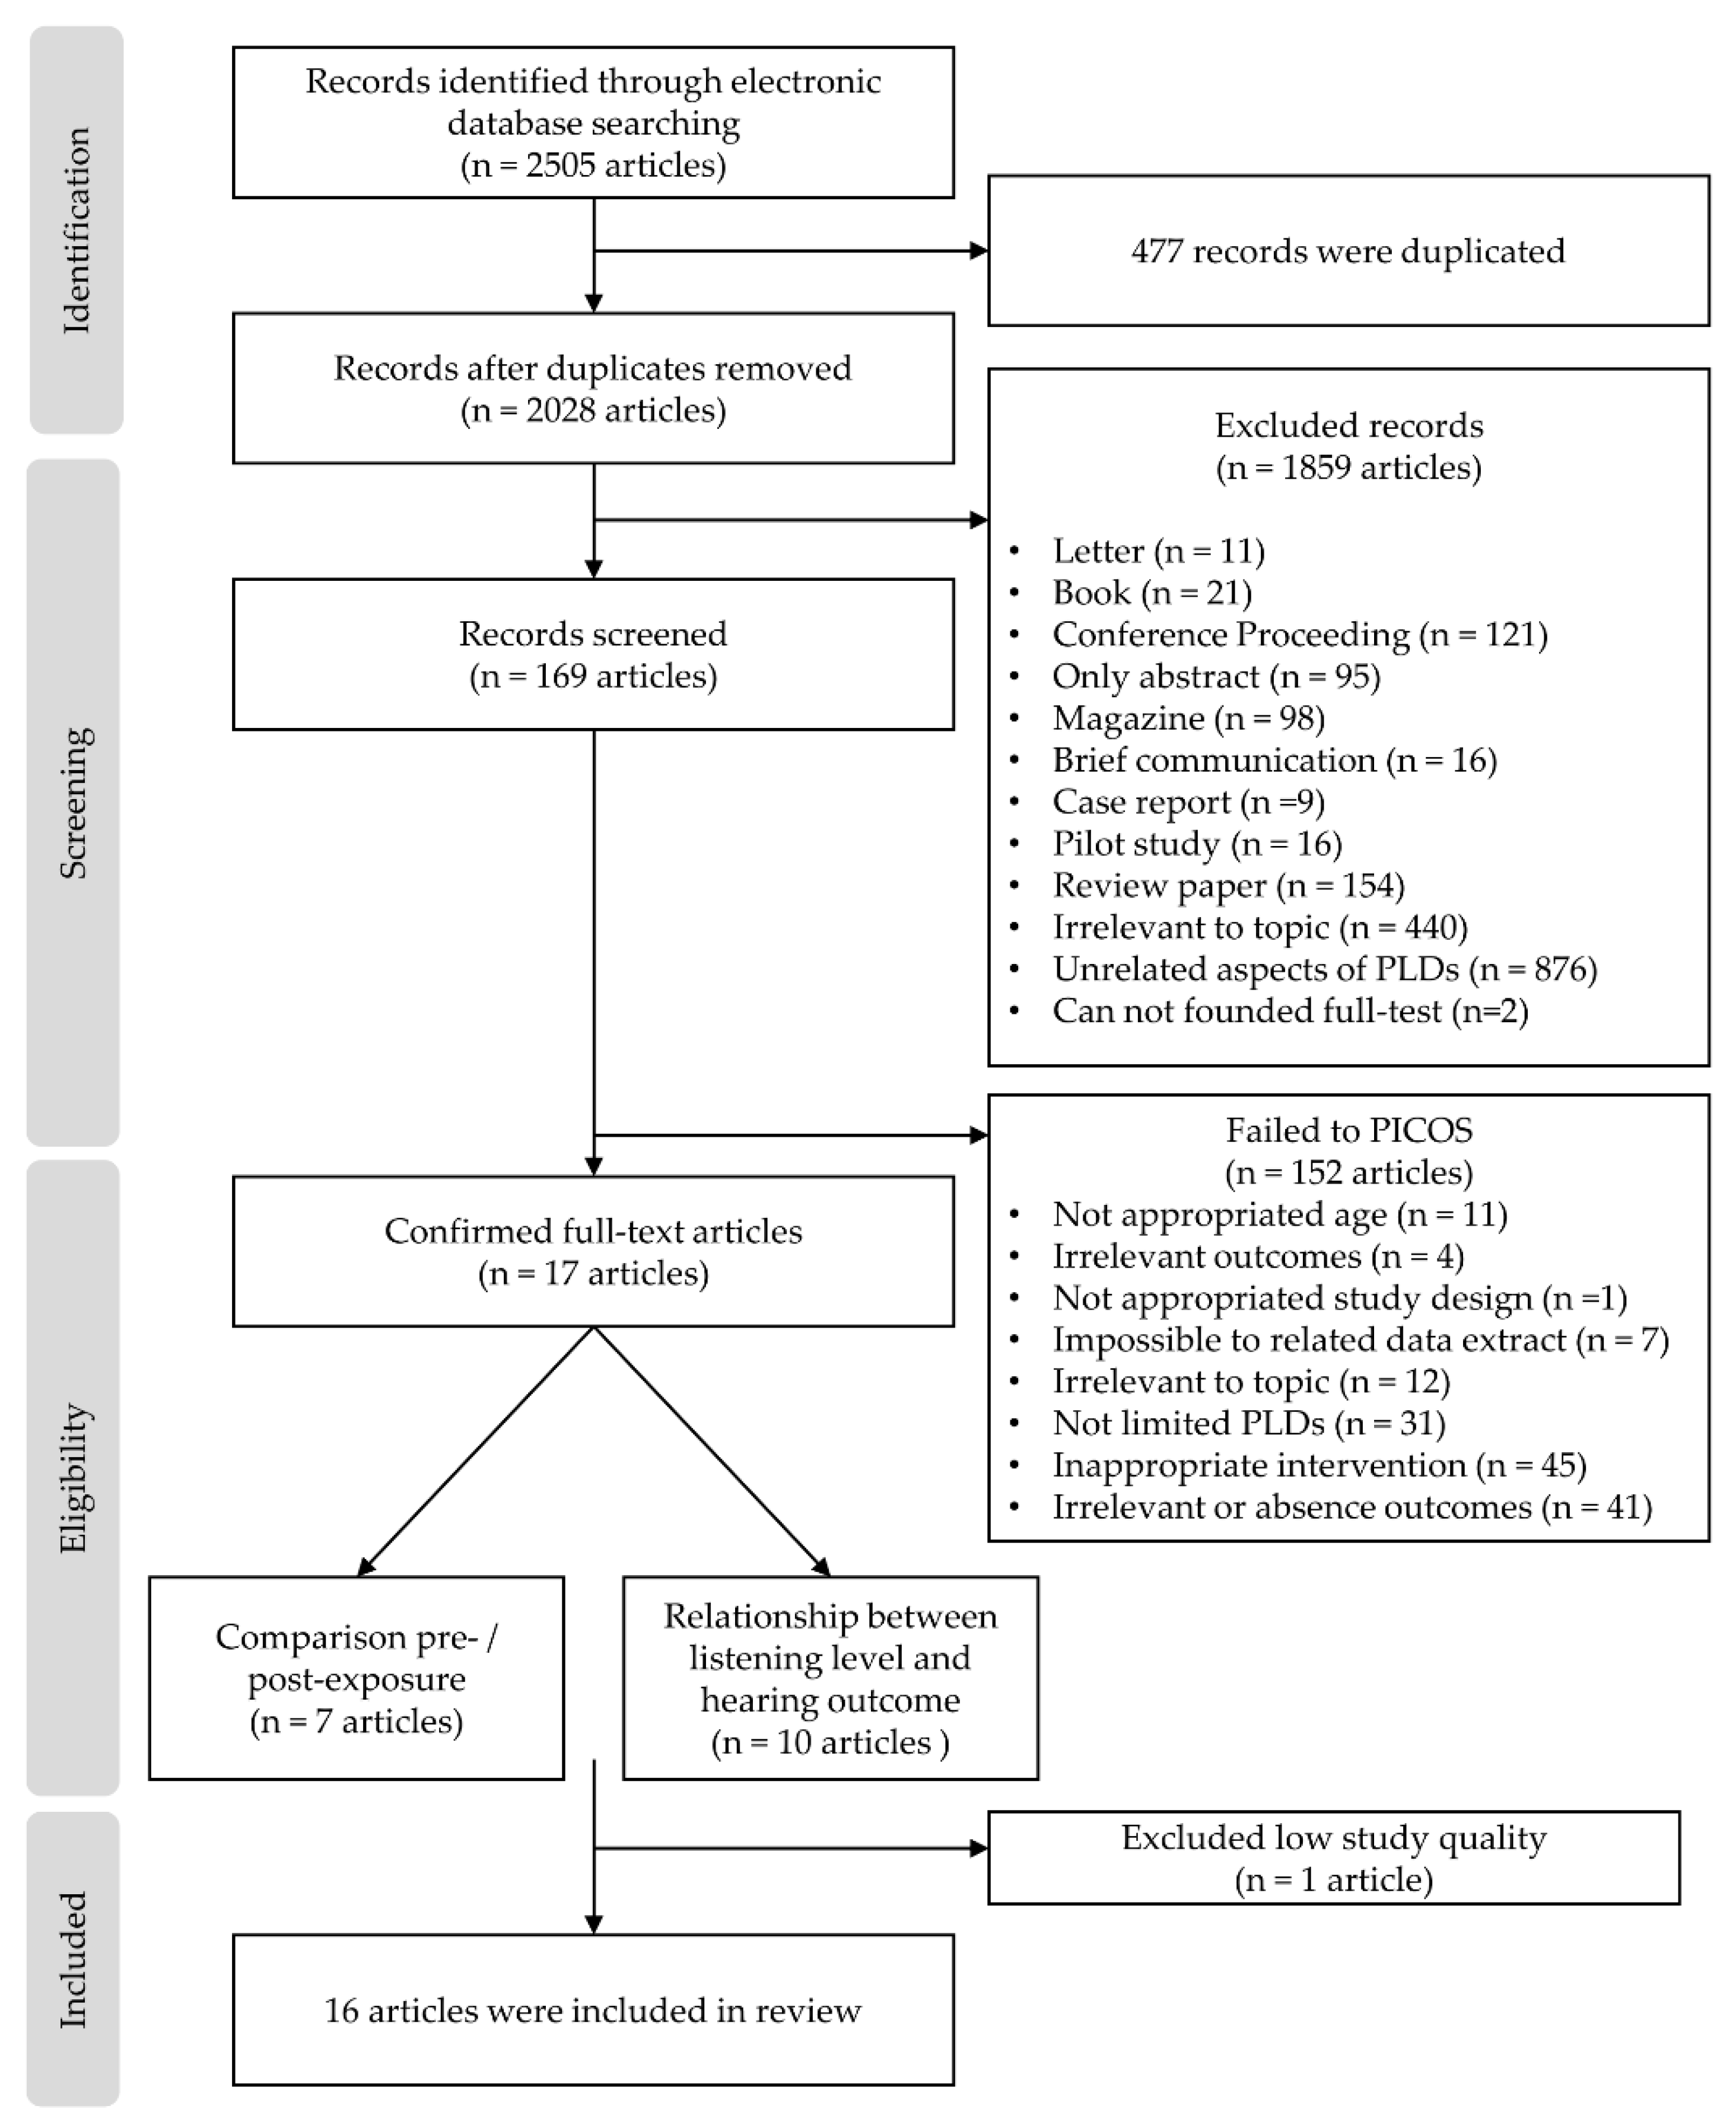
3.1. Selection Outcomes

Using the search strategy, 2505 records were identified in the six electronic databases. After removing 477 duplicates, 1859 articles were removed based on the exclusion criteria, such as not being peer-reviewed, not an academic article, or irrelevant topic. A total of 169 remaining articles that were potentially relevant were screened by carefully reading their titles and abstracts. Using this process, 152 articles were excluded due to noncompliance with PICOS criteria and 17 articles were included. Figure 1 illustrates these processes.
In Table 2, the Newcastle–Ottawa scale (NOS) quality evaluation is provided for all 17 studies. The authors confirmed that four [9,20,21,22] of the selected studies had “good” quality (scored 7–9). The remaining studies were evaluated as having “fair” quality (score 4–6) [20,21,22,23,24,25,26,27,28,29,30,31,32,33,34] except for one study with a score of 3, evaluated as having “poor” quality [35]. Thus, 16 articles were included for systematic review and meta-analysis in this study.

3.2. Study Characteristics

Sixteen studies were included in the systematic review and meta-analysis. These studies were cohort studies or cross-sectional studies and investigated the hearing thresholds in young adults. More specifically, the 16 studies were divided into two groups: temporary (or short-term; within 24 h) hearing changes and permanent (or long-term) hearing changes.
The studies with short-term hearing changes (n = 7) assessed the change in thresholds of PTA or amplitude of distortion product otoacoustic emissions (DPOAEs) of pre- and post-music exposure. The studies related to long-term hearing changes (n = 9) compared the PTA and DPOAE test outcomes of the PLD user group and nonuser group, as divided by questionnaires or interviews. Additionally, both exposure intensity and time (or duration) of PLD use were checked. Each study is summarized in Table 3 and Table 4 for short-term and long-term hearing changes, respectively.

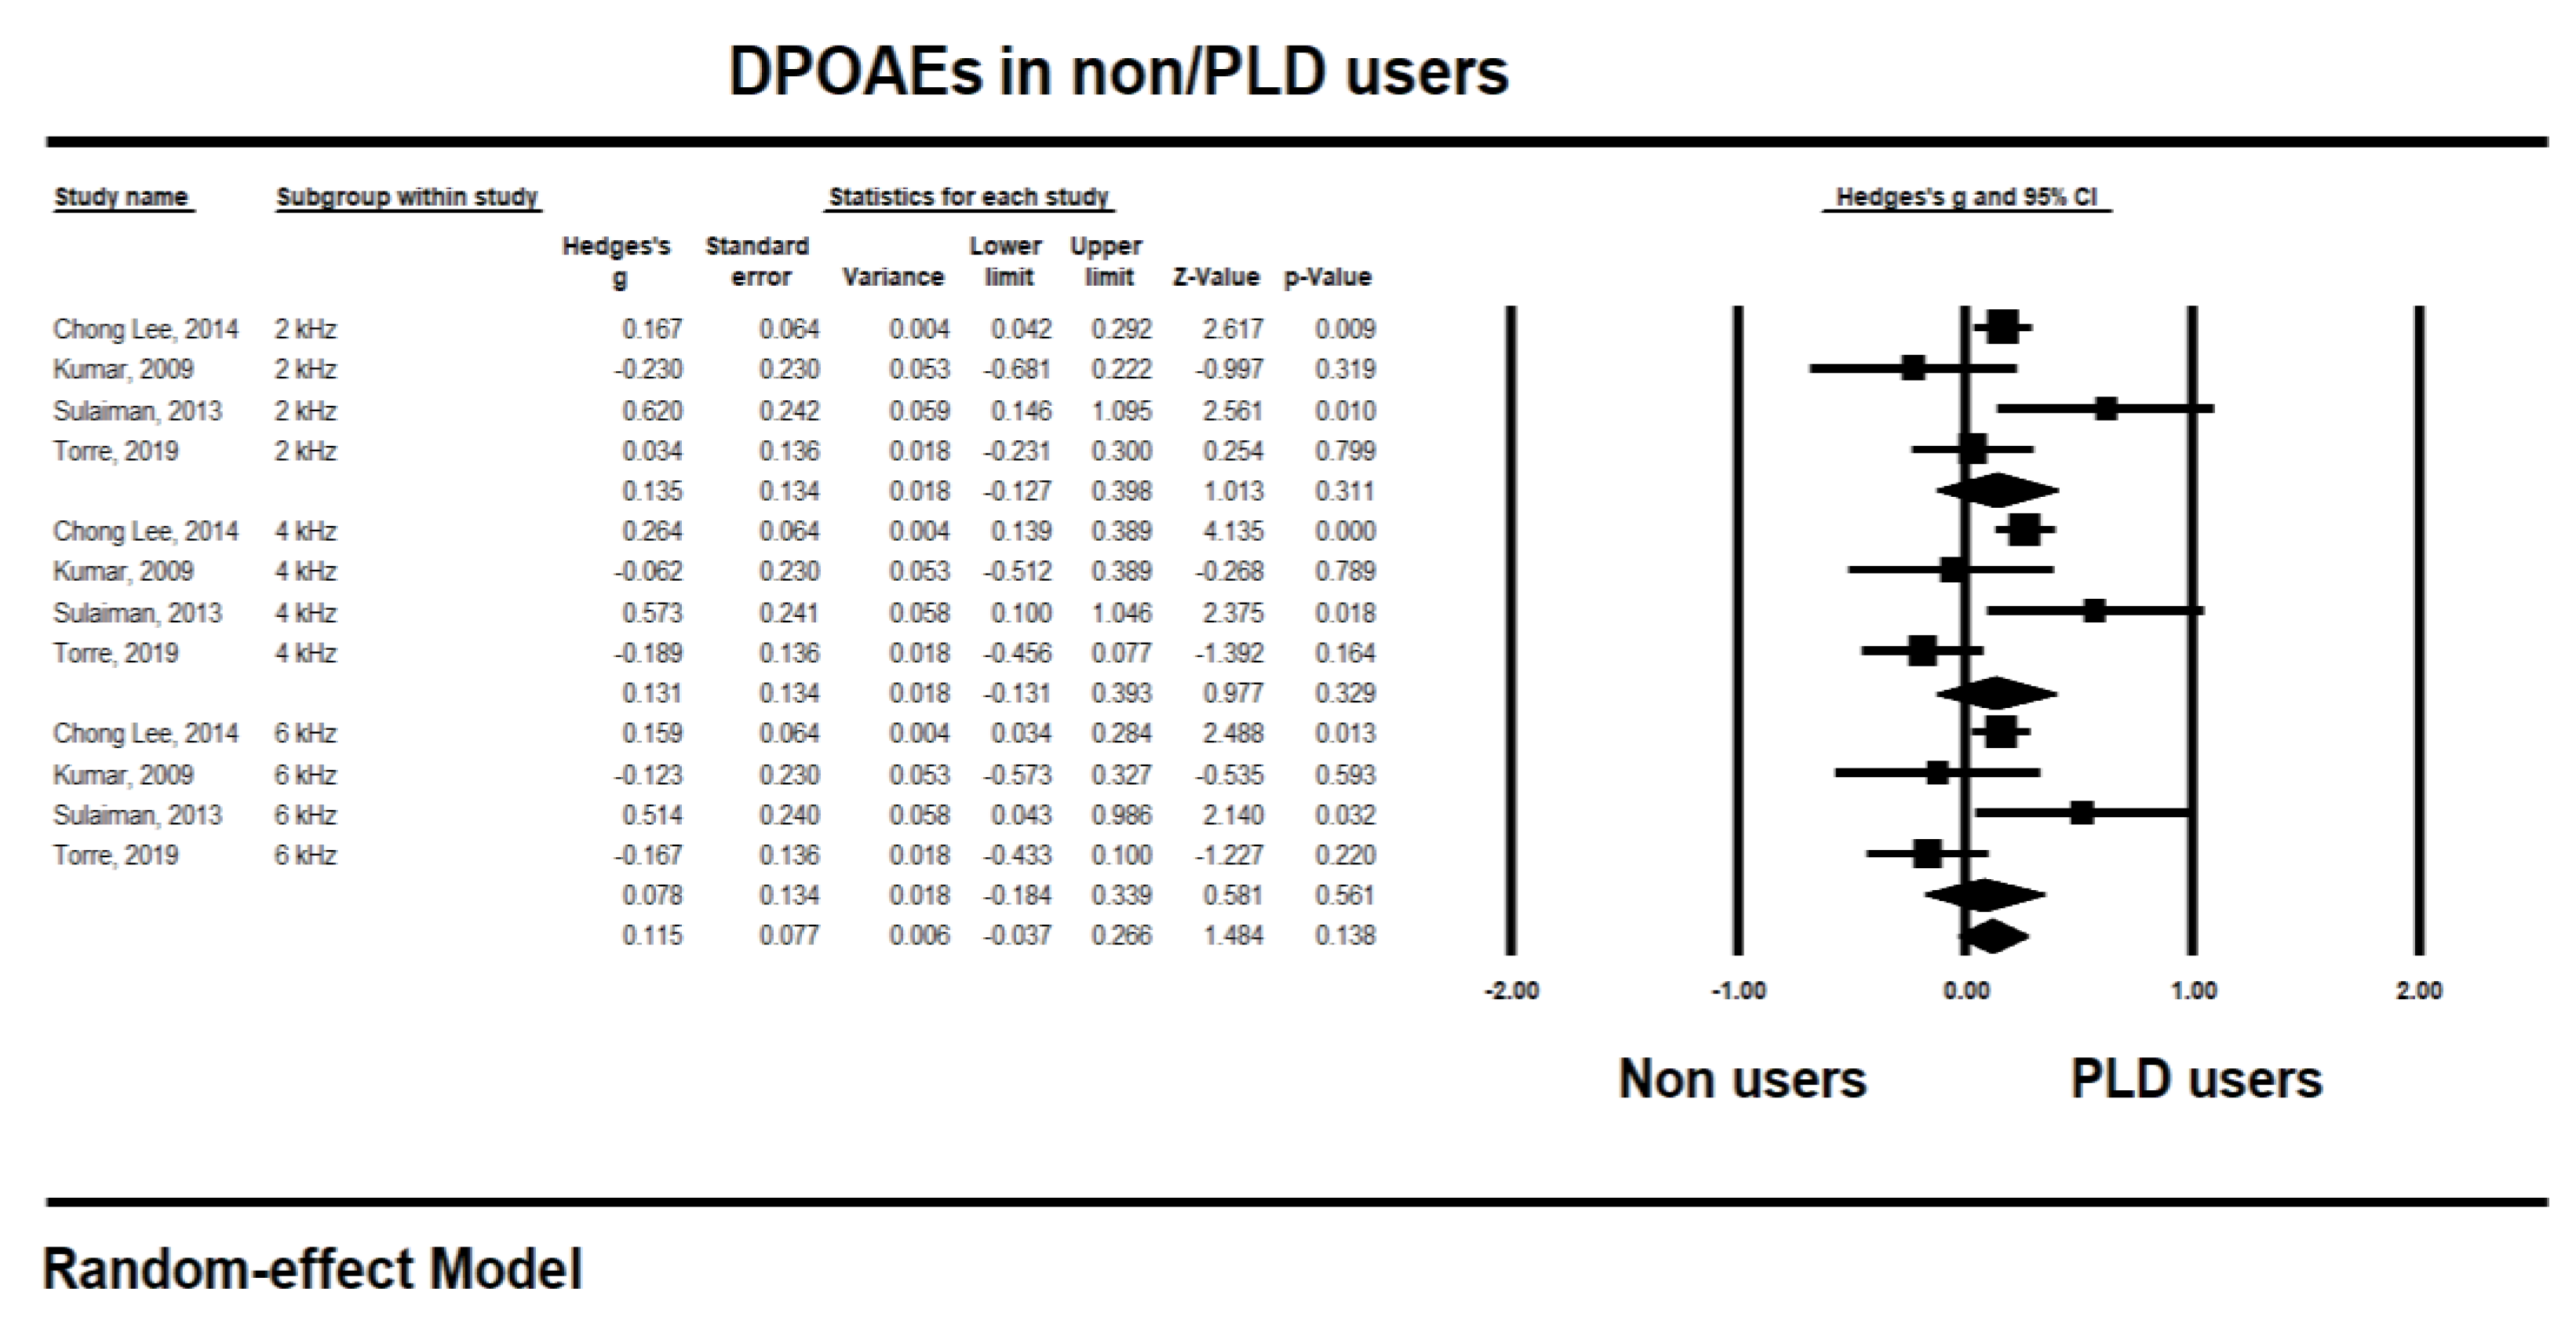
3.3. Meta-Analysis of Music Exposure Effects with Subgroup Analysis

Sixteen high-quality studies that reported hearing thresholds of PTA (4, 6, and 8 kHz testing frequencies) and amplitudes of the DPOAEs (2, 4, and 6 center frequencies) were pooled for analysis. As mentioned earlier, the studies were divided into two groups to see short-term hearing changes (pre/post-exposure with 24 hours; n = 7) [20,23,25,27,28,29,32] and long-term hearing changes (PLDs users/non-users; n = 9) [9,21,22,24,26,30,31,33,34].
For short-term hearing changes within 24 h after music exposure [20,23,25,27,28,29,32], the studies pooled for analysis showed PTA 4, 6, and 8 kHz changes at pre- and post-music exposure (see Figure 2). The thresholds for PTA at 4 kHz showed the highest effect size (−0.344, 95% CI −0.727 to 0.038, p 0.078), while the distribution of the 4 kHz thresholds showed the highest heterogeneity (I2 74.90%). Interestingly, the thresholds at 6 and 8 kHz showed different aspects of effect size. The effect sizes of 6 and 8 kHz thresholds appeared relatively smaller; 6 kHz, −0.059, CI −0.438 to 0.320; p 0.760 and 8 kHz, −0.066, CI −0.436 to 0.303; p 0.725. Moreover, the 6 and 8 kHz thresholds showed low heterogeneity (less than 5% of I2). Regardless of the test frequencies, however, the overall effect size of the PTA thresholds showed –0.154 (CI −0.393 to 0.084; p 0.205) with medium heterogeneity (I2 42.92%). These results did not indicate any significant deterioration of the hearing thresholds after music exposure.
Similar to PTA outputs, the amplitude of DPOAEs showed the largest effect size also at 4 kHz (0.124, CI −0.047 to 0.296; p 0.155) (see Figure 3). The heterogeneity showed 0% of I2, regardless of the test frequencies. Although amplitude at 6 kHz showed a similar effect size with 4 kHz (0.106, CI -0.065 to 0.278; p 0.224), the amplitude at 2 kHz was relatively less affected (0.029, CI −0.154 to 0.212; p 0.755). The overall effect size of the DPOAEs was 0.089 (CI −0.012 to 0.190; p 0.080, I2 0%), indicating no significant amplitude change within 24 h after music exposure. In sum, the short-term result after music exposure did not show any meaningful changes for PTA thresholds or DPOAE amplitudes.
To identify the long-term hearing changes after music exposure [9,21,22,24,26,30,31,33,34], the pooled studies for analysis are shown in Figure 4 and Figure 5 for PTA and DPOAE, respectively, in the same frequencies along with the short-term hearing changes.
In the PTA testing, the highest effect size was at 6 kHz (−0.525, CI −0.897 to −0.154) and significant (p 0.006), although the data for 6 kHz showed the highest heterogeneity (I2 80.09%). The 8 kHz also had a –0.486 significant effect size (CI −0.819 to −0.152; p 0.004) with medium heterogeneity (I2 57.62%). Unlike the short-term hearing changes, however, the thresholds for 4 kHz showed the lowest effect sizes (−0.266, CI −0.598 to 0.066; p 0.116) and heterogeneity (I2 38.63%). Overall, the long-term hearing changes determined by PTA measurement showed a −0.419 effect size (CI −0.632 to −0.207) with significance (p 0.000), indicating that consistent PLD usage significantly and negatively affects the user’s hearing thresholds in the long term.
With the DPOAEs, the highest effect size was at 2 kHz (0.135, CI −0.127 to 0.398; p 0.311) and 4 kHz (0.131, CI −0.131 to 0.393; p 0.329) with medium (I2 58.77%), and high (I2 76.65%) heterogeneity, respectively. However, the long-term effects of music exposure on DPOAEs showed an overall 0.115 effect size (CI 0.037 to 0.266) with no significance (p 0.138). In short, analysis of the long-term changes showed a significant negative effect for the user’s hearing thresholds, especially at 6 and 8 kHz of PTA, but no remarkable effect to the amplitude of DPOAEs.
In addition, the four funnel plots that related to the results of PTA thresholds and DPOAEs amplitude showed no publication bias (see Figure 6) with no significant Egger’s regression (p > 0.05).

4. Discussion

The present review focused on: (1) exploring the existing evidence for a comparison between the short-term and long-term hearing change that occurs from the music exposure, and (2) characterizing these aspects of changed hearing status for early identification and intervention. Thus, the present study examined PLD users’ hearing status via the most sensitive clinical tests, such as PTA and DPOAE, and elucidated a possible association with the exposure to music.
Similar to the present study, the World Health Organization (WHO) reported guidelines for leisure noise with regulation of the exposure intensity and time, health outcomes, and interventions [36]. In its assessment of the evidence on hearing loss, the WHO determined that: (1) the effect of regular music exposure cannot be quantified, (2) the effect of the specific threshold analysis is limited, and (3) analysis of the pooled effect size is limited due to lack of data from previous studies. Although the present study cannot resolve all the limitations in the guidelines, it can present insight into behavioral and objective hearing outcomes at a specific frequency based on a meta-analysis.

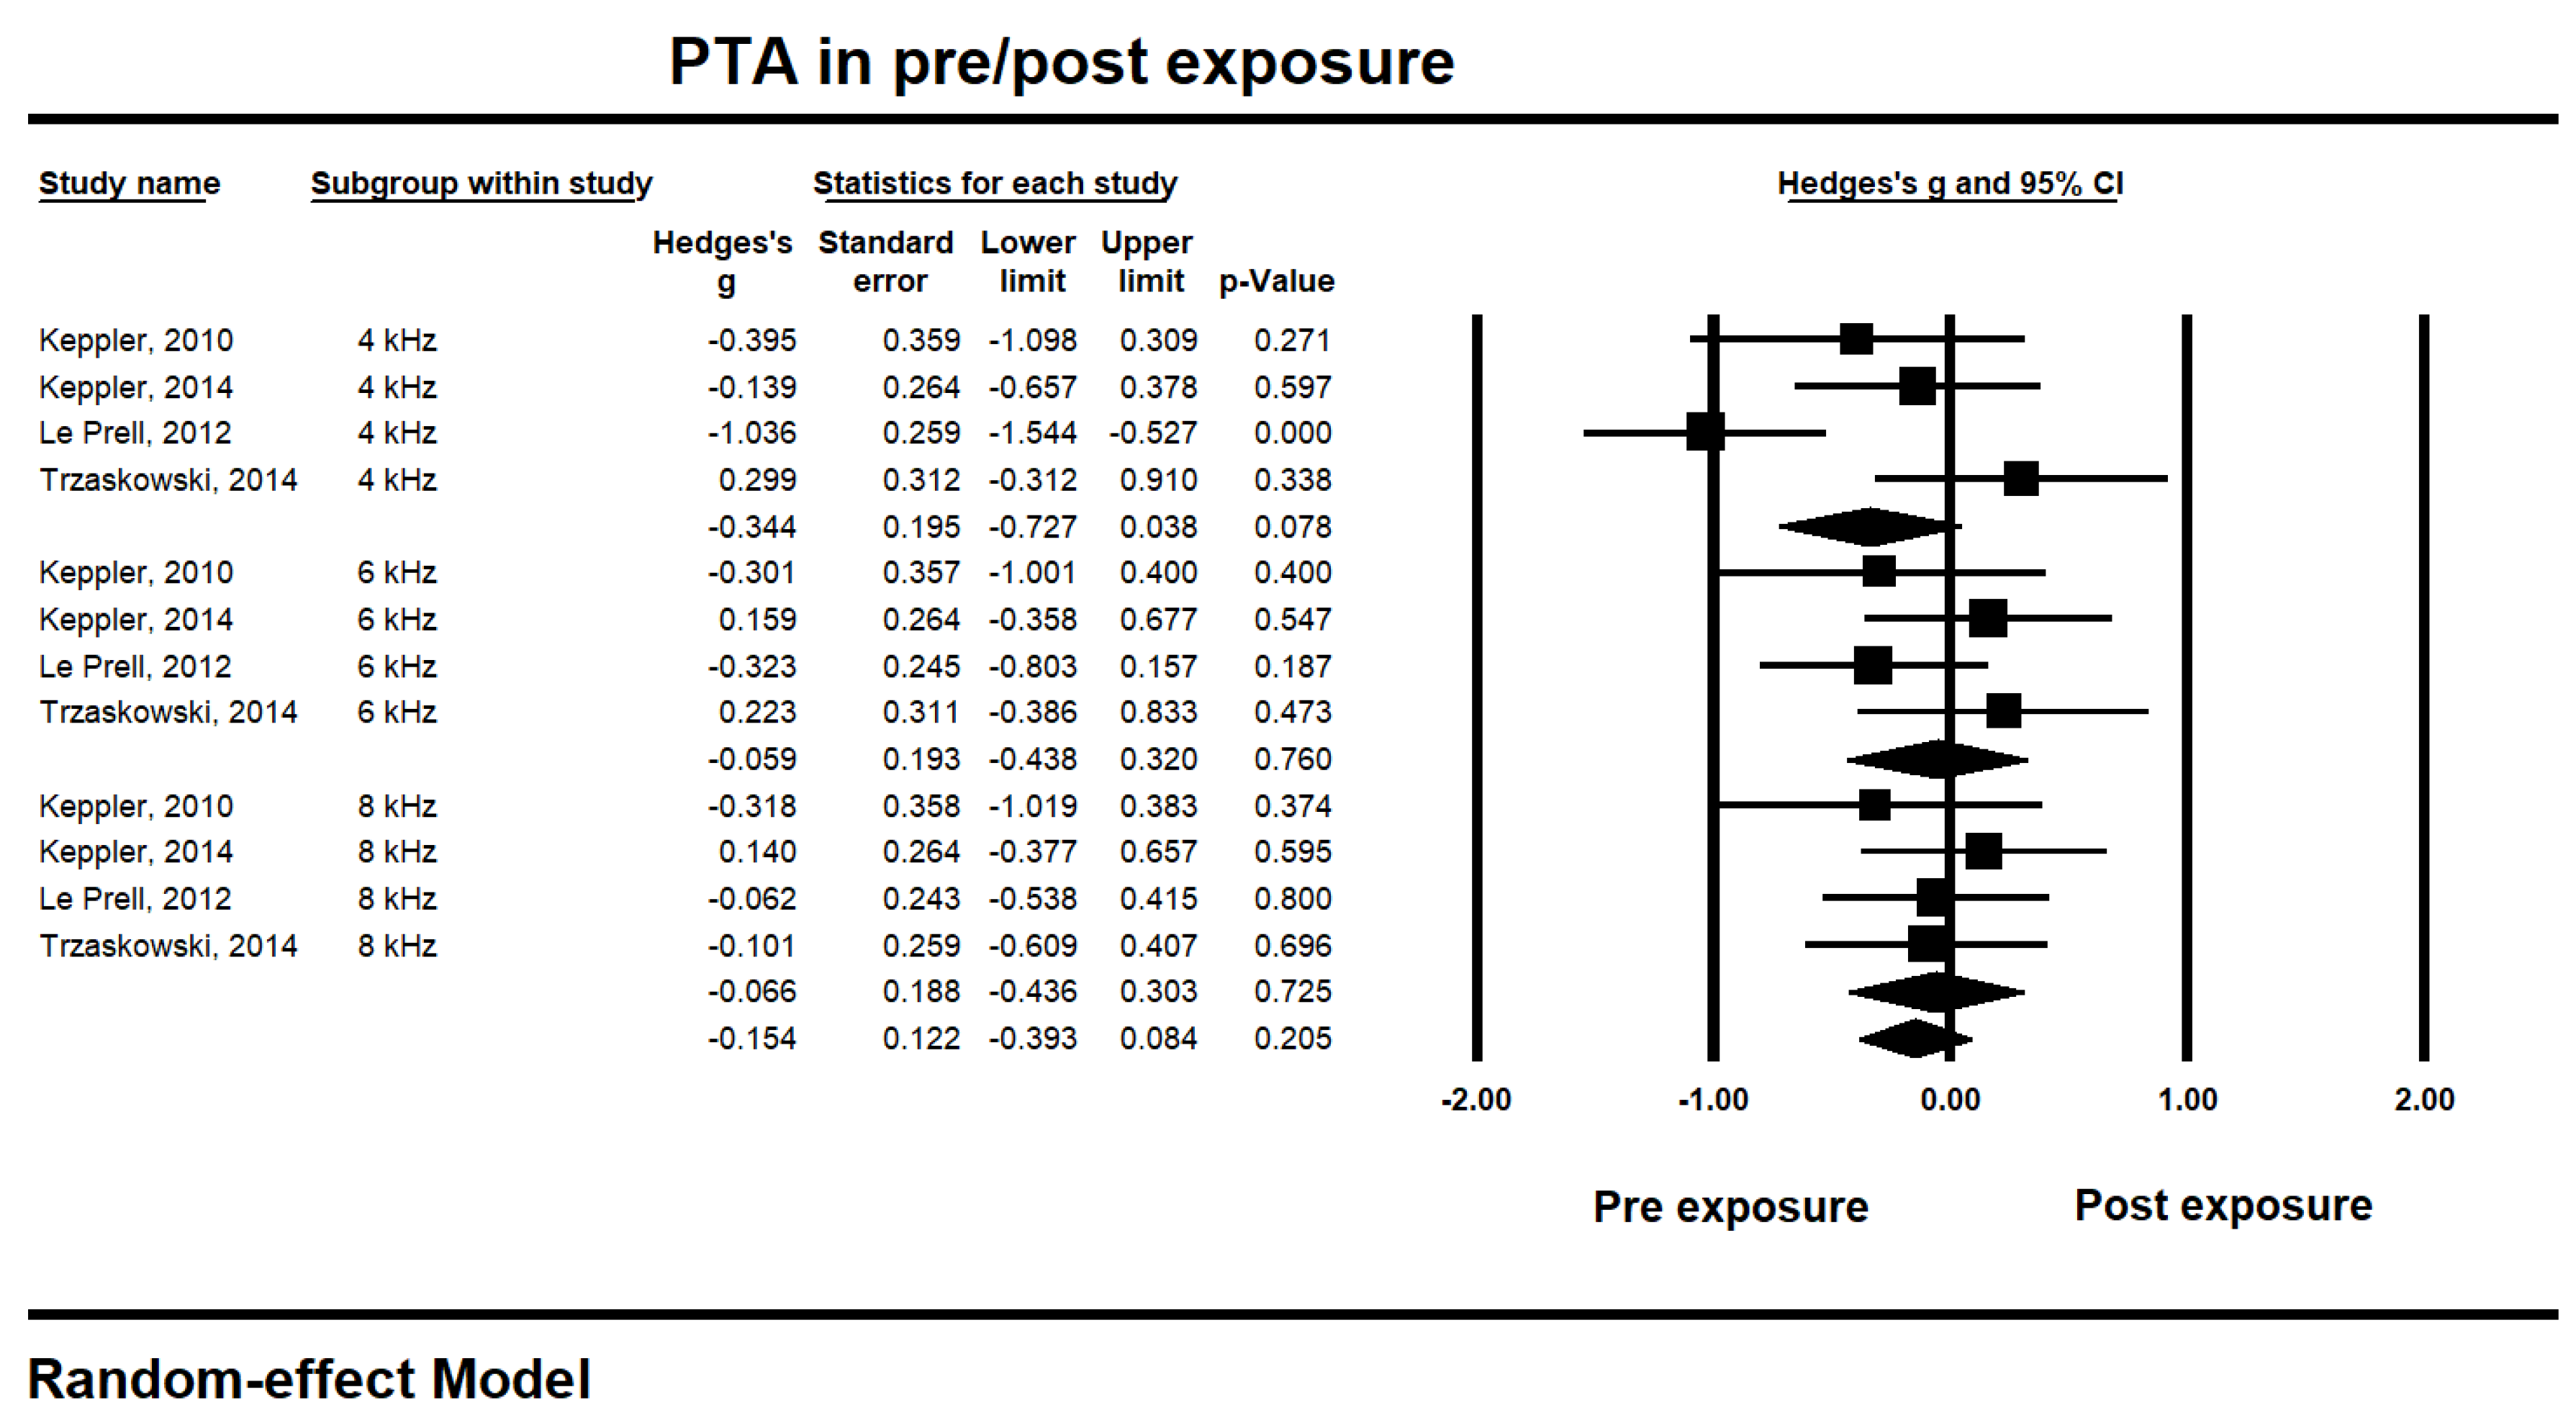
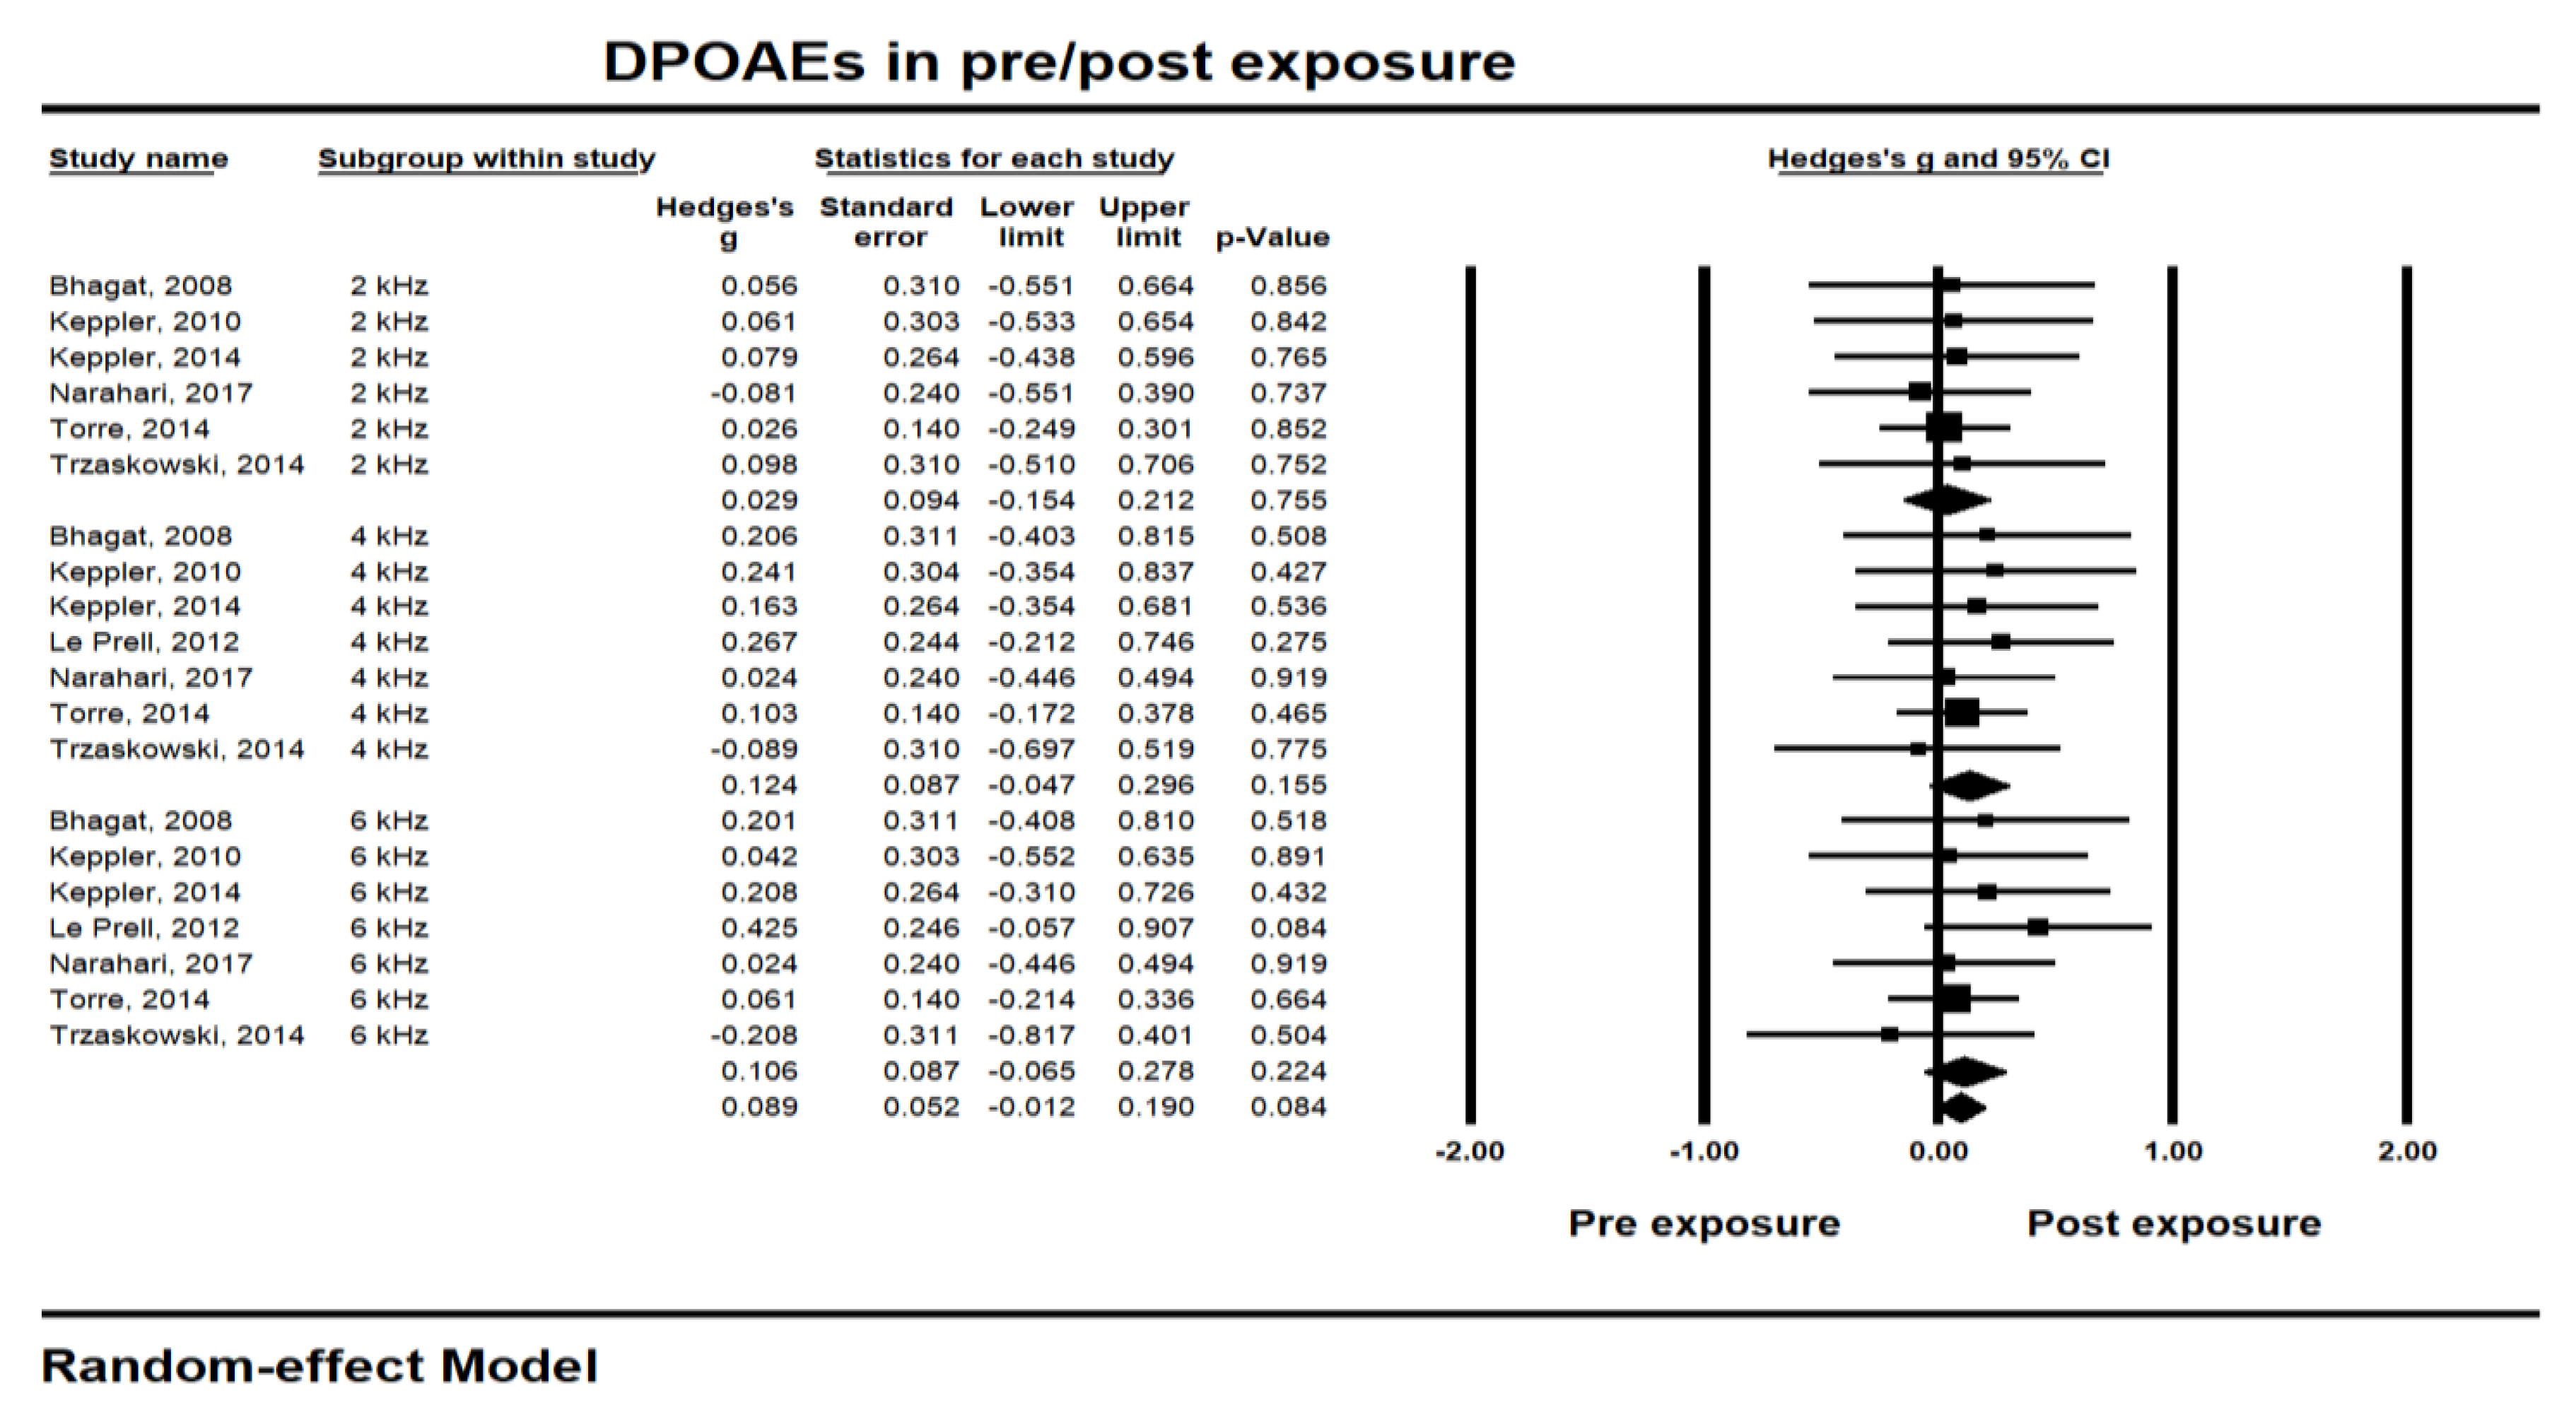
4.1. Short-term Hearing Changes Due to Music Exposure

Seven articles indicating pre- and post-experimental study were categorized as short-term hearing changes [20,23,25,27,28,29,32]; thresholds and amplitude data from 300 young adults (ages 17 to 38; 20 to 132 participants per study) were measured by PTA [20,22,24,27,29] and DPOAE [20,23,25,27,28,29] before and after their music exposure through PLDs with earphones, while also analyzing their exposure intensity and exposure time.
In terms of PTA thresholds, three of the five studies reported no statistically significant change in hearing thresholds after the music exposure [23,25,29], whereas two reported a small but reliable, temporary threshold shift [24]. These users had a significantly reduced hearing threshold after music exposure [25]. However, a significant variation in audiological results, exposure intensity, and exposure time among the studies also existed. With some variation, four of the seven studies reported that the change was very limited and not significant in the DPOAE amplitude after the music exposure [25,27,28,29], whereas the other three reported significant changes in the same DPOAEs amplitude [20,23,32].
When focusing on exposure intensity and time, in four studies [20,23,25,32] participants were exposed to a high intensity of 85 dB (C) to 100.3 dB(A) with a long exposure duration of 30 min to 4 h. However, the measured units were different, and this limited generalization. On the other hand, the studies that reported no significant changes were exposed to music levels from 50.8 to 98.7 dBA for 30 min to 1 h, which perhaps was not a sufficiently strong music level or a long enough time to cause significant threshold changes in healthy young adults [27,28]. Although limited to a direct comparison to WHO’s regulation [36] due to heterogeneity, such as the difference in units and time, only two studies were comparable [25,27]. Based on LAeq,1h, Keppler, and Bockstael reported 92.41 dB LAeq,1h at 1 h [25], and Keppler et al. reported 86% of subjects exposed at greater than 92.25 dB LAeq,1h at 1 h [27]. Considering the hazardous exposure intensity and time in the regulation (95 dB LAeq, 1 h) [7,10], these results indicated no significant change in PTA or DPOAE and were consistent with the regulations.

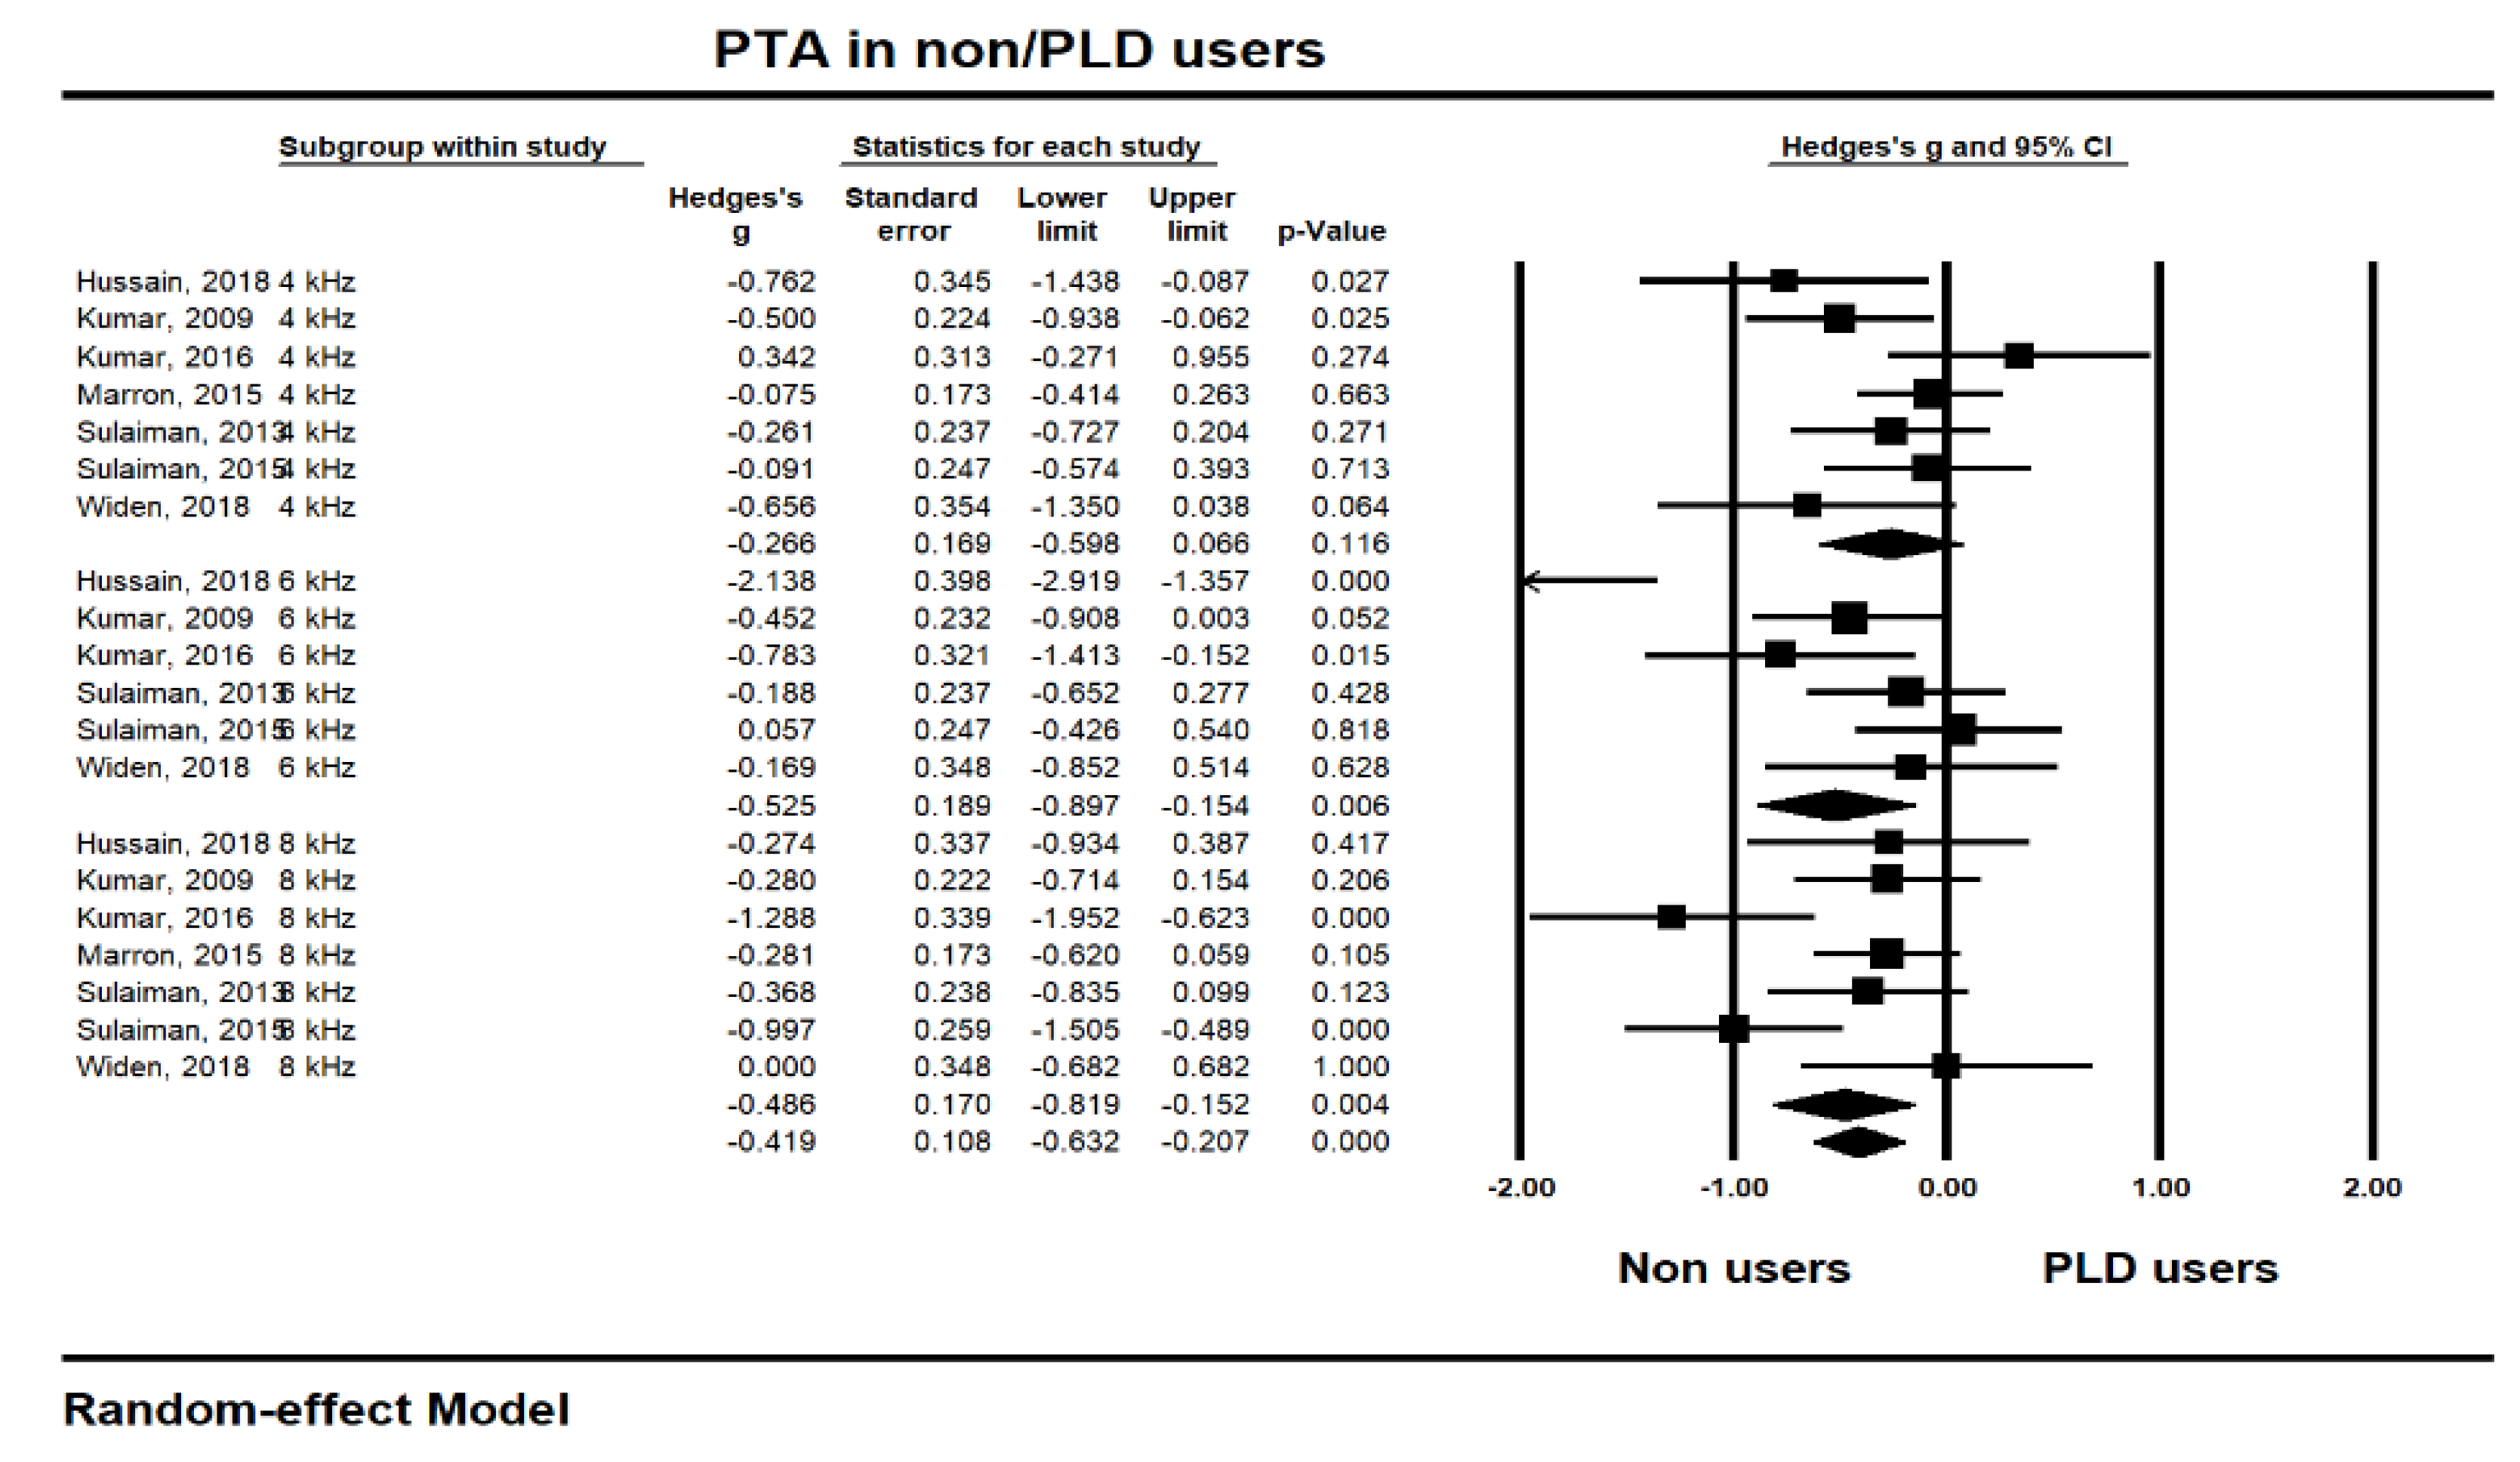
4.2. Long-term Hearing Changes Due to Music Exposure

In the analysis of long-term hearing changes, nine studies using either a case-control study or a cross-sectional study were grouped [9,21,22,24,26,30,31,33,34]. The participants in these studies were assigned according to their PLD user group (or high-risk group) and non-PLD group based on the results of the questionnaires, interviews, and participants’ usual listening levels. Then, their PTA thresholds [9,21,26,30,31,33,34] (three studies were also tested for an extended testing frequency up to 16 kHz) [9,26,31], and DPOAE amplitudes [9,21,25,35] were compared for music exposure intensity and use period for the PLDs. The variation in the long-term hearing changes was smaller than the short-term effects.
Based on the PTA thresholds [9,24,26,30,31,33,34], four of the seven studies reported that the hearing thresholds of PLD users were significantly higher than those of non-PLD users at the conventional testing frequencies of 0.25 to 8 kHz [26,30,33,34]. Of the other three studies, two reported that PLD users had significantly poorer hearing thresholds at the extended testing frequencies of 9 to 16 kHz compared to the thresholds for the non-users [9,31]. Thus, six studies concluded that significant changes in the hearing thresholds were caused by PLD usage [9,26,30,31,33,34]. Fortunately, four studies additionally investigated subjective hearing symptoms, such as tinnitus, difficulty with communication, and ear pain after music exposure. For example, Sulaiman et al. [9] reported that immediately after music exposure, 37.1% to 51.5% of the PLD users experienced, in order of appearance, ear pain, tinnitus, and difficulty hearing others. Moreover, these hearing symptoms became more frequent when the listening intensity was higher [26]. Widen et al. [34] also reported that 7% to 8% of their subjects experienced hearing symptoms like tinnitus, sound sensitivity, and sound fatigue. Torre and Reed [22] supported this finding in that 12.9% to 24.8% of their respondents also experienced tinnitus or difficulty in communication.
Regardless, the current results of the DPOAE meta-analysis did not clearly support the studies mentioned above; two of the four studies reported no significant differences at DPOAE amplitude [23,24], while the other two showed a significantly decreased amplitude [9,21] although still having some variation. As one possibility to explain these contradictory findings, the studies have differences in intensity and time. For example, Kumar et al. [25] had a similar intensity to Sulaiman et al. [9] at 76 dBA LAeq,8h, but they showed no significant differences. The other study that reported no significant difference showed relatively low intensity (73.0 dBA LAeq) with a short use period (1 h/day) [22]. The studies that reported significant differences in DPOAEs showed relatively high intensity (81.3 dBA, 8h 76.2 dBA LAeq [9], and 95.5 dBA [21]) with a long use period (2.7 h/day [8] and 2.9 h/day [21]). We have an important message in that changes can be caused in a relatively short use period (1.5 h/day). Similar to the investigations of the short-term effect, only three studies were compared against the WHO regulation [36]. In terms of PTA, based on LAeq, Kumar and Deepashree reported 87.97 dB LAeq at 2 h/day [31], and Hussain et al. reported 83 dB LAeq at 1.99 h/day [33]. This is in comparison to the regulation (74 dB LAeq, 2 h/day). These results exceed the regulation and are consistent with the significant poor PTA results. Furthermore, Torre and Reed reported 73.0 dBA LAeq at 1 h/day, which did not exceed the regulation, with no significant DPOAE amplitude [22].

4.3. Limitation of the Study

The present study had limitations in terms of inconsistency in units. The intensity data of the pooled studies which we selected in this systematic review could not be synthesized because of the heterogeneity of outcome measurement (specifically the measurement unit), and the measurement methods varied depending on the study. More specifically, the intensity results in various studies (e.g., dB SPL, dBA, dBC, LAeq) could not be easily integrated due to the different weights and temporal averaging according to frequency when first measured. However, it might be interesting to integrate the different measured intensity units for each study to use meta-analysis, so further investigation should be considered.

5. Conclusions

This review and analysis showed that PLD users experience a few temporary hearing changes at 4 kHz, but their hearing is restored. However, if these musical exposures are repetitive and cumulative, then these users will experience permanent hearing changes or loss, especially if exposure is at high frequencies; of further concern is that young users and/or the general public do not yet recognize the specific standards that can prevent nonoccupational noise-induced hearing loss. Therefore, it is desirable to campaign on and communicate to the public the hazards of music exposure and its negative effects on hearing in terms of public health when using PLDs, as the analysis in our study supports. In addition, health professionals have a clear opportunity to influence the public’s hearing behavior by providing appropriate education on hearing loss prevention regarding the ongoing recreational noise exposure to music via PLDs at all levels of society.

Author Contributions

Conceptualization, S.Y. and W.H; methodology, S.Y. and T.H.K.; formal analysis, S.Y. and T.H.K.; data curation, T.H.K.; writing-original draft preparation, S.Y.; writing-review and editing, W.H.; supervision, W.H. All authors have read and agreed to the published version of the manuscript.

Funding

This research was completed with support from the National Research Foundation of Korea (NRF-2017R1A1A1A05001299).

Conflicts of Interest

The authors declare no conflict of interest.

Appendix A. Search Strategy in Keywords

(“Personal listening device*” OR “personal music player” OR “MP3 player” OR “tape recorder*” OR “compact disk” OR “CD player” OR “audio device*” OR “music device” OR “Walkman” OR “cassette player” OR “iPod” OR “mobile phone*” OR “smartphone*” OR “earphone*” OR “earbud*” OR “headphone*”) AND (“prefered* listening level*” OR “listening duration*” OR “listening time*” OR “listening intensit*” OR “volume level*” OR “listening habit*” OR “music exposure” OR “Recreational noise” OR “higher volume” OR “background noise” OR “noisy condition*” OR “noisy setting*” OR “double noise” OR “cumulated noise” OR “quiet condition*” OR “quiet setting*”) AND (“hearing symptom*” OR “hearing loss” OR “noise induced hearing loss” OR “music induced hearing loss” OR “music hearing loss” OR “recreational hearing loss” OR “high frequenc*” OR “pure tone audiometry” OR “otoacoustic emission*” OR “expended high frequenc*” OR “hypersensitive*” OR “hyperacusis” OR “speech understanding” OR “tinnitus” OR “ear* pain” OR “temporary threshold* shift*” OR “permanent threshold* shift*” OR “muffled” OR “mumbled” OR “recruitment*” OR “distortion*” OR “pitch perception*”) AND (“adolescent*” OR “adolescence*” OR “youth*” OR “puberty” OR “pubescent” OR “high school” OR “university student*” OR “college student*” OR “young adult*” OR “twent*” OR “teen*”)
Note: AND, Include Two search terms; OR, Broaden search with multiple terms; *, Searches for word variations.

References

  1. Scientific Committee on Emerging and Newly Identified Health Risks (2008) Potential Health Risks of Exposure to Noise From Personal Music Players and Mobile Phones Including A Music Playing Function -Preliminary Report. Available online: https://ec.europa.eu/health/ph_risk/committees/04_scenihr/docs/scenihr_o_017.pdf (accessed on 3 January 2020).
  2. Meyer-Bisch, C. Epidemiological evaluation of hearing damage related to strongly amplified music (personal cassette players, discotheques, rock concerts)-high-definition audiometric survey on 1364 subjects. Audiology 1996, 35, 121–142. [Google Scholar] [CrossRef]
  3. Serra, M.R.; Biassoni, E.C.; Richter, U.; Minoldo, G.; Franco, G.; Abraham, S.A.; Joeks, S.; Yacci, M.R. Recreational noise exposure and its effects on the hearing of adolescents. Part I: An interdisciplinary long-term study Exposición a ruido recreativo y sus efectos en la audición de los adolescentes. Parte I: un estudio interdisciplinario a largo plazo. Int. J. Audiol. 2005, 44, 65–73. [Google Scholar]
  4. Danhauer, J.L.; Johnson, C.E.; Byrd, A.; DeGood, L.; Meuel, C.; Pecile, A.; Koch, L.L. Survey of college students on iPod use and hearing health. J. Am. Adm. Audiol. 2009, 20, 5–27. [Google Scholar]
  5. Sulaiman, A.H.; Seluakumaran, K.; Husain, R. Hearing risk associated with the usage of personal listening devices among urban high school students in Malaysia. Public Health 2013, 127, 710–715. [Google Scholar]
  6. Punch, J.L.; Elfenbein, J.L.; James, R.R. Targeting hearing health messages for users of personal listening devices. Am. J. Audiol. 2011, 20, 69–82. [Google Scholar] [CrossRef]
  7. Ralli, M.; Greco, A.; de Vincentiis, M. Hearing Loss Following Unsafe Listening Practices in Children, Teenagers and Young Adults: An Underestimated Public Health Threat. Int. J. High Risk Behav. Addict. 2018, 7, 1–2. [Google Scholar] [CrossRef] [Green Version]
  8. Breinbauer, H.A.; Anabalón, J.L.; Gutierrez, D.; Cárcamo, R.; Olivares, C.; Caro, J. Output capabilities of personal music players and assessment of preferred listening levels of test subjects: Outlining recommendations for preventing music-induced hearing loss. The Laryngoscope 2012, 122, 2549–2556. [Google Scholar]
  9. Sulaiman, A.H.; Husain, R.; Seluakumaran, K. Evaluation of early hearing damage in personal listening device users using extended high-frequency audiometry and otoacoustic emissions. Eur. Arch. Oto-Rhino-L. 2013, 271, 1463–1470. [Google Scholar] [CrossRef]
  10. Serra, M.R.; Biassoni, E.C.; Hinalaf, M.; Abraham, M.; Pavlik, M.; Villalobo, J.P.; Curet, C.; Joeks, S.; Yacci, R.M.; Righetti, A. Hearing and loud music exposure in 14–15 years old adolescents. Noise Health 2014, 16, 320–330. [Google Scholar] [CrossRef]
  11. Jiang, W.; Zhao, F.; Guderley, N.; Manchaiah, V. Daily music exposure dose and hearing problems using personal listening devices in adolescents and young adults: A systematic review. Int. J. Audiol. 2016, 55, 197–205. [Google Scholar] [CrossRef] [Green Version]
  12. Le Clercq, C.M.; Van Ingen, G.; Ruytjens, L.; van der Schroeff, M.P. Music-induced hearing loss in children, adolescents, and young adults: a systematic review and meta-analysis. Otolog.Neurotol. 2016, 37, 1208–1216. [Google Scholar] [CrossRef] [PubMed]
  13. Zhao, F.; Manchaiah, V.K.; French, D.; Price, S.M. Music exposure and hearing disorders: An overview. Inte. J. Autol. 2010, 49, 54–64. [Google Scholar] [CrossRef] [PubMed]
  14. Figueiredo, R.R.; de Azevedo, A.A.; de Oliveira, P.M.; Amorim, S.P.V.; Rios, A.G.; Baptista, V. Incidence of tinnitus in mp3 player users. Braz. J. Otorhinolaryngol. 2011, 77, 293–298. [Google Scholar] [CrossRef] [Green Version]
  15. Kujawa, S.G.; Liberman, M.C. Acceleration of age-related hearing loss by early noise exposure: Evidence of a misspent youth. J. Neurosci. 2016, 26, 2115–2123. [Google Scholar] [CrossRef]
  16. Moher, D.; Liberati, A.; Tetzlaff, J.; Altman, D.G. Preferred reporting items for systematic reviews and meta-analyses: The PRISMA statement. Ann. Intern. Med. 2009, 151, 264–269. [Google Scholar] [CrossRef] [Green Version]
  17. Davies, S. The importance of PROSPERO to the National Institute for Health Research. Syst. Rev. 2012, 1. [Google Scholar] [CrossRef] [Green Version]
  18. Henshaw, H.; Ferguson, M.A. Efficacy of individual computer-based auditory training for people with hearing loss: A systematic review of the evidence. PloS one 2013, 8, e62836. [Google Scholar] [CrossRef] [Green Version]
  19. Stang, A. Critical evaluation of the Newcastle-Ottawa scale for the assessment of the quality of nonrandomized studies in meta-analyses. Eur. J. Epidemiol. 2010, 25, 603–605. [Google Scholar] [CrossRef] [Green Version]
  20. Le Prell, C.G.; Dell, S.; Hensley, B.; Hall, J.W., III; Campbell, K.C.; Antonelli, P.J.; Green, G.E.; Miller, M.J.; Guire, K. Digital music exposure reliably induces temporary threshold shift (TTS) in normal hearing human subjects. Ear and hearing 2012, 33, e44–e58. [Google Scholar] [CrossRef] [Green Version]
  21. Lee, G.J.C.; Lim, M.Y.; Kuan, A.Y.W.; Teo, J.H.W.; Tan, H.G.; Low, W.K. Relationship between leisure noise exposure and otoacoustic emissions in a young Asian population. Int. J.Audiol. 2014, 53, 462–468. [Google Scholar] [CrossRef]
  22. Torre, P.; Reed, M.B. Risk Factors for Distortion Product Otoacoustic Emissions in Young Adults. Appl. Sci. 2019, 9, 1608. [Google Scholar] [CrossRef] [Green Version]
  23. Bhagat, S.P.; Davis, A.M. Modification of otoacoustic emissions following ear-level exposure to MP3 player music. Int. J. Audiol. 2008, 47, 751–760. [Google Scholar] [CrossRef]
  24. Kumar, A.; Mathew, K.; Alexander, S.A.; Kiran, C. Output sound pressure levels of personal music systems and their effect on hearing. Noise Health 2009, 11, 132–140. [Google Scholar] [CrossRef] [PubMed]
  25. Keppler, H.; Dhooge, I.; Maes, L.; D’haenens, W.; Bockstael, A.; Philips, B.; Swinnen, F.; Vinck, B. Short-term auditory effects of listening to an MP3 player. Arch. Otolaryngol. Head Neck Surg. 2010, 136, 538–548. [Google Scholar] [CrossRef] [PubMed] [Green Version]
  26. Sulaiman, A.H.; Husain, H.; Seluakumaran, K. Hearing Risk among Young Personal Listening Device Users: Effects at High-Frequency and Extended High-Frequency Audiogram Thresholds. J. Int. Adv. Otol. 2015, 11, 104–109. [Google Scholar] [CrossRef]
  27. Keppler, H.; Dhooge, I.; Maes, L.; Bockstael, A.; Philips, B.; Swinnen, F.; Vinck, B. Evaluation of the olivocochlear efferent reflex strength in the susceptibility to temporary hearing deterioration after music exposure in young adults. Noise health 2014, 16, 108–115. [Google Scholar]
  28. Torre, P.; Grace, J. Changes in distortion product otoacoustic emission components after music exposure. J. Am. Acad. Audiol. 2014, 25, 804–813. [Google Scholar] [CrossRef]
  29. Trzaskowski, B.; Jędrzejczak, W.W.; Piłka, E.; Cieślicka, M.; Skarżyński, H. Otoacoustic Emissions before and after Listening to Music on a Personal Player. Med. Sci. Monit. 2014, 20, 1426–1431. [Google Scholar]
  30. Hutchinson Marron, K.; Marchiondo, K.; Stephenson, S.; Wagner, S.; Cramer, I.; Wharton, T.; Hughes, M.; Sproat, B.; Alessio, H. College students’ personal listening device usage and knowledge. Int. J. Audiol. 2015, 54, 384–390. [Google Scholar] [CrossRef]
  31. Kumar, U.A.; Deepashree, S.R. Personal music systems and hearing. J. Laryngol Otol. 2016, 130, 717–729. [Google Scholar] [CrossRef]
  32. Narahari, P.G.; Bhat, J.; Nambi, A.; Arora, A. Impact of usage of personal music systems on oto-acoustic emissions among medical students. Noise Health 2017, 19, 222–226. [Google Scholar] [CrossRef] [PubMed]
  33. Hussain, T.; Chou, C.; Zettner, E.; Torre, P.; Hans, S.; Gauer, J.; Markgraf, M.; Nquyen, Q.T. Early Indication of Noise-Induced Hearing Loss in Young Adult Users of Personal Listening Devices. Ann.Rhino. Laryngol. 2018, 127, 703–709. [Google Scholar] [CrossRef] [PubMed]
  34. Widén, S.E.; Möller, C.; Kähäri, K. Headphone listening habits, hearing thresholds and listening levels in Swedish adolescents with severe to profound HL and adolescents with normal hearing. Int. J. Audiol. 2018, 57, 730–736. [Google Scholar] [CrossRef] [PubMed]
  35. McNeill, K.; Keith, S.E.; Feder, K.; Konkle, A.T.; Michaud, D.S. MP3 player listening habits of 17 to 23 year old university students. J. Acoust. Soc. Am. 2010, 128, 646–653. [Google Scholar] [CrossRef]
  36. World Health Organization. Environmental Noise Guidelines for the European Region. 2018. Available online: https://apps.who.int/iris/bitstream/handle/10665/279952/9789289053563eng.pdf?sequence=1&isAllowed=y (accessed on 10 February 2020).
Figure 1. Article selection process using the inclusion and exclusion criteria for the present study. Notes: PICOS, participants, intervention, control, outcomes, and study design.PLD: personal listening device.
Ijerph 17 02091 g001
Figure 2. Short-term hearing changes for the pure tone audiometry (PTA) thresholds at 4, 6, and 8 kHz within 24-h after music exposure.
Ijerph 17 02091 g002
Figure 3. Short-term hearing changes in distortion product otoacoustic emissions (DPOAEs) amplitude at 2, 4, and 6 kHz center frequencies within 24 h after music exposure.
Ijerph 17 02091 g003
Figure 4. Long-term hearing changes of pure tone audiometry (PTA) thresholds at 4, 6, and 8 kHz after music exposure.
Ijerph 17 02091 g004
Figure 5. Long-term hearing changes for the distortion product otoacoustic emissions (DPOAEs) amplitude at 4, 6, and 8 kHz center frequencies after music exposure.
Ijerph 17 02091 g005
Figure 6. Funnel plotting of the results for short-term and long-term hearing changes to PTA or DPOAEs when using PLDs; (A) PTA in short-term effect, (B) DPOAEs in short-term effect, (C) PTA in long-term effect, and (D) DPOAEs in long-term effect.
Ijerph 17 02091 g006
Table 1. Inclusion criteria based on PICOS strategy.
PICOSContent Category
ParticipantsYoung adults using PLDs
InterventionDevice exposure intensity and/or time
ControlComparison to a control group or repeated measures (pre- and post-PLDs exposure comparison).
Outcomes1+ audiometry outcomes (PTA, OAEs, and EHF) and/or hearing symptoms
Study DesignsCohort studies, cross-sectional studies, and repeated measures
Notes: PICOS, participants, intervention, control, outcomes, and study design; PLD, personal listening device; PTA, pure-tone audiometry; OAE, otoacoustic emission; EHF, expanded high frequency.
Table 2. Scientific study validity criteria based on the Newcastle–Ottawa scale used for cohort studies.
AuthorsQuality Assessment per the Newcastle–Ottawa Scale
SelectionComparabilityOutcomeTotal
Bhagat, 2008 [23]213Fair (6)
Kumar, 2009 [24]312Fair (6)
Keppler, 2010 [22]312Fair (6)
McNeill, 2010 [23]111Poor (3)
Le Prell, 2012 [20]313Good (7)
Lee, 2014 [21]422Good (8)
Sulaiman, 2013 [9]412Good (7)
Sulaiman, 2015 [26]312Fair (6)
Keppler, 2014 [27]312Fair (6)
Torre, 2014 [28]312Fair (6)
Trzaskowski, 2014 [29]213Fair (6)
Marron, 2015 [30]312Fair (6)
Kumar, 2016 [31]312Fair (6)
Narahari, 2017 [32]312Fair (6)
Hussain, 2018 [33]312Fair (6)
Widén, 2018 [34]311Fair (5)
Torre, 2019 [22]322Good (7)
Note: The overall quality of the study evaluation was arbitrarily defined as “poor” (score, 0–3), “fair” (4–6), or “good” (7–9).
Table 3. Summary of studies showing short-term hearing changes and included in the meta-analysis.
Authors (Publication Date)Subjects (Ages)MethodMain Outcomes
Study DesignExposureIntensityExposure Time (min)
Bhagat and Davis (2008) [23]20 young adults (18–38 y)Hearing statuses were measured pre, post (30 min), and recovery (48 h) from time of music exposure
PTA
OAEs (DPOAEs, SOAEs)
85 dBC ± 3 dB30Although the hearing thresholds did not change, the changes in DPOAEs and SSOAEs were early warning signs of the harmful effects of high levels of music exposure on cochlear functioning.
Keppler and Bockstael (2010) [25]Noise exposure group
15 young adults (19–28 y),
Control group
28 young adults (19–28 y)
Audiometric results of both groups were compared
PTA
OAEs (DPOAEs, TEOAEs)
LAeq,1h 92.41 dBA
LAeq,8h 83.38 dBA
60In the noise exposure group, the PTA and TEOAE amplitudes changed significantly between pre- and post-exposure. However, these patterns were not found for the DPOAE amplitudes.
Le Prell et al. (2012) [20]33 young adults (18–27 y)Hearing status was measured pre, post (15min, 75min, 135min, 195min), and recovery (following 1 day and 1 week) after music exposure
PTA
OAEs (DPOAEs)
94.5 dBA (n = 10)
99.6 dBA (n = 11)
100.3 dBA (n =12)
240Changes in hearing thresholds showed a notched configuration, largest at 4 kHz.
After music exposure, small, but reliable, temporary threshold shifts were found, but these threshold shifts quickly recovered during the first 3 h after music exposure.
Keppler et al., (2014) [27]28 young adults (19–30 y)Hearing status was measured pre- and post- (immediately, 30 min) exposure
PTA
OAEs (DPOAEs, TEOAEs)
Based on LAeq,1h
82.52 dBA (n = 2)
87.46 dBA (n = 2)
92.25 dBA (n =12)
98.70 dBA (n = 12)
60The authors reported that no clear relationship exists between temporary hearing deterioration and the amount of efferent suppression.
Torre and Grace (2014) [28]Noise exposure group
101 young adults (18–30 y),
Control group
21 young adults
Audiometric results for both groups were compared for pre- and post- (immediate) exposure
DPOAE absolute levels and generator and characteristic frequency component levels were noted
50.8 dBA (n = 7)
56.6 dBA (n = 56)
58.8 dBA (n = 14)
62.3 dBA (n = 24)
60Based on the lower listening levels, DPOAEs showed very little or indeed no significant change after music exposure.
Trzaskowski et al. (2014) [29]20 young adults (22–27 y)Audiological tests were conducted pre-, post (immediately), and recovery (24 h) after music exposure
PTA
OAEs (DPOAEs, TEOAEs)
86.6 dBA30No statistically significant changes were found in OAE and PTA following 30min of music exposure.
Narahari et al. (2017) [32]34 young adults (17–21 y)DPOAEs at pre- and post- (2 h) music exposure were analyzed98.29 dBSPL120The DPOAEs were affected immediately post music exposure, especially at 8 kHz or higher.
Note: y, years old; PTA, pure tone audiometry; OAEs, otoacoustic emissions; DPOAEs, distortion product otoacoustic emissions; SOAEs, spontaneous otoacoustic emissions; TEOAEs, transient-evoked otoacoustic emissions.
Table 4. Summary of studies showing long-term hearing changes included in the meta-analyses.
Authors (Publication Date)Subjects (Ages)MethodMain Results
Study DesignExposure IntensityUseTimeUsePeriod (yr)
Kumar el al. (2009) [24]PLD user group
 70 young adults (17–24 y)
 Non-PLD group (control)
 30 young adults
After dividing into two groups based on the questionnaire, the audiological results of both groups were compared.
PLL in quiet and noisy conditions
PTA
OAEs (DPOAEs)
76 dBA LAeq,8h 1.5 h/day>2 yrNo significant differences were found at PTA and DPOAE for either group.
In terms of a correlation analysis, a positive correlation exists between PTA and PLLs, and a negative correlation exists between DPOAEs and PLLs.
Sulaiman et al. (2013) [9]PLD user group
 35 young adults (18–30 y)
Non-PLD group (control)
 35 young adults
After dividing into two groups based on the interviews, hearing status was compared.
Interviews (hearing symptoms)
PLLs in blinded volume setting
PTA, EHFs
OAEs (DPOAEs, TEOAEs)
81.3 dBA
(76.2 dBA LAeq,8h)
2.7 h/day3.2 yrIn EHFs, the mean hearing thresholds of PLD users were significantly higher, while conventional PTA users did not have typical characteristics of NIHL.
OAE (DPOAE, TEOAE) amplitudes in PLD users were reduced compared to those in the non-PLD group.
Lee et al. (2014) [21]High-risk group
 DPOAEs (n = 279)
 TEOAEs (n = 325)
 Others group (ear)
D POAEs (n = 2097)
 TEOAEs (n = 2462)
A listening habit survey was conducted, and the subjects were assigned to each group. Based on the group, the OAE results were compared between the two groups.
Listening habit survey
PLLs
OAEs (DPOAEs, TEOAEs)
95.5 dBA2.9 h/day5.5 yr• OAE (DPOAE, TEOAE) levels in high-risk group were significantly depressed.
Specifically, TEOAE levels were lower at 4 kHz, and DPOAE levels decreased at 1, 2, 3, and 4 kHz.
Marron et al. (2015) [30]180 young adults (17–25 y)Based on three questionnaires, PLL and PTA results of the subjects were analyzed.
3 questionnaires
PTA
PLLs
73 dBA9.51 h/week10–12 yrListeners who use their PLDs for more than 7.5 h a week exhibited a statistically significantly worse hearing threshold.
Sulaiman e al. (2015) [26]PLD user group
228 young adults (18–30 y)
Non-PLD group (the control)
54 young adults
Audiological results were compared by group, PLL, and hearing symptoms.
Interview (habits, symptoms)
PTA, EHFs
PLLs
70.1 dBA
(62.4 dBA LAeq,8h)
2.2 h/day3.15 yrIn the PLD user group, 20.1% had >75 dBA (LAeq,8h), while 4.4% had >85 dBA, which can cause hearing damage.
The subjects who listened to their devices at more than 75 dBA showed a significantly higher hearing threshold and incidence of hearing symptoms.
Kumar and Deepashree (2016) [31]PLD user group
 30 young adults (15–30 y)
 Non-PLD group
 30 young adults
When comparing the two groups, the effects of PLD use on hearing were evaluated.
Questionnaire for group assignment
PLLs
PTA, EHFs
OAEs (TEOAEs)
87.97 dBA LAeq 2 h/day> 2 yrSubjects who listened to PLDs at higher than 80 dBA (LAeq) showed poorer EHF thresholds and decreased TEOAE amplitude.
Hussain et al. (2018) [33]50 young adults (19–39 y)
High-risk group (subgroup)
11 young adults who listened to their devices at over 91 dBA
Based on the questionnaire, hearing status and listening preferences were compared.
Questionnaire
PLLs in quiet and noisy condition
PTA
85.5 dBA (All subjects), 96.2 dBA (High-risk subgroup)2 h/day6.1 yrPLL and hearing thresholds were significantly correlated.
In addition, the high-risk subgroup of subjects revealed poorer hearing thresholds at 4khz and 6 kHz.
Widén et al. (2018) [34]279 young adults (17 y)Based on the questionnaire, output levels and hearing statuses were compared.QuestionnairePLLsPTA83 dBA LAeq 1.99 h/day3.7 yr• Subjects who listened at more than 85 dBA showed higher hearing thresholds.
Torre and Reed (2019) [22]216 young adults (college-aged, mean age, 20.95)As measured for questionnaire-related PLDs and objective and subjective outcomes, the effects of DPOAEs were analyzed.
Questionnaire (listening habits)
OAEs (DPOAEs)
73.0 dBA LAeq 1 h/day-• In a subjective volume setting, 35% of subjects reported loud or very loud, but the measured PLLs were not considered hazardous.
•There was no association between PLLs and DPOAEs, regardless of gender.
Note: y, years old; PLD, personal listening device; OAEs, otoacoustic emissions; NIHL, noise-induced hearing loss; DPOAEs, distortion product otoacoustic emissions; TEOAEs, transient-evoked otoacoustic emissions.

