Qualitative Field Observation of Pedestrian Injury Hotspots: A Mixed-Methods Approach for Developing Built- and Socioeconomic-Environmental Risk Signatures

 ,
,  , ,
, , 
Abstract
1. Introduction
1.1. Pedestrian Injury
1.2. Objectives
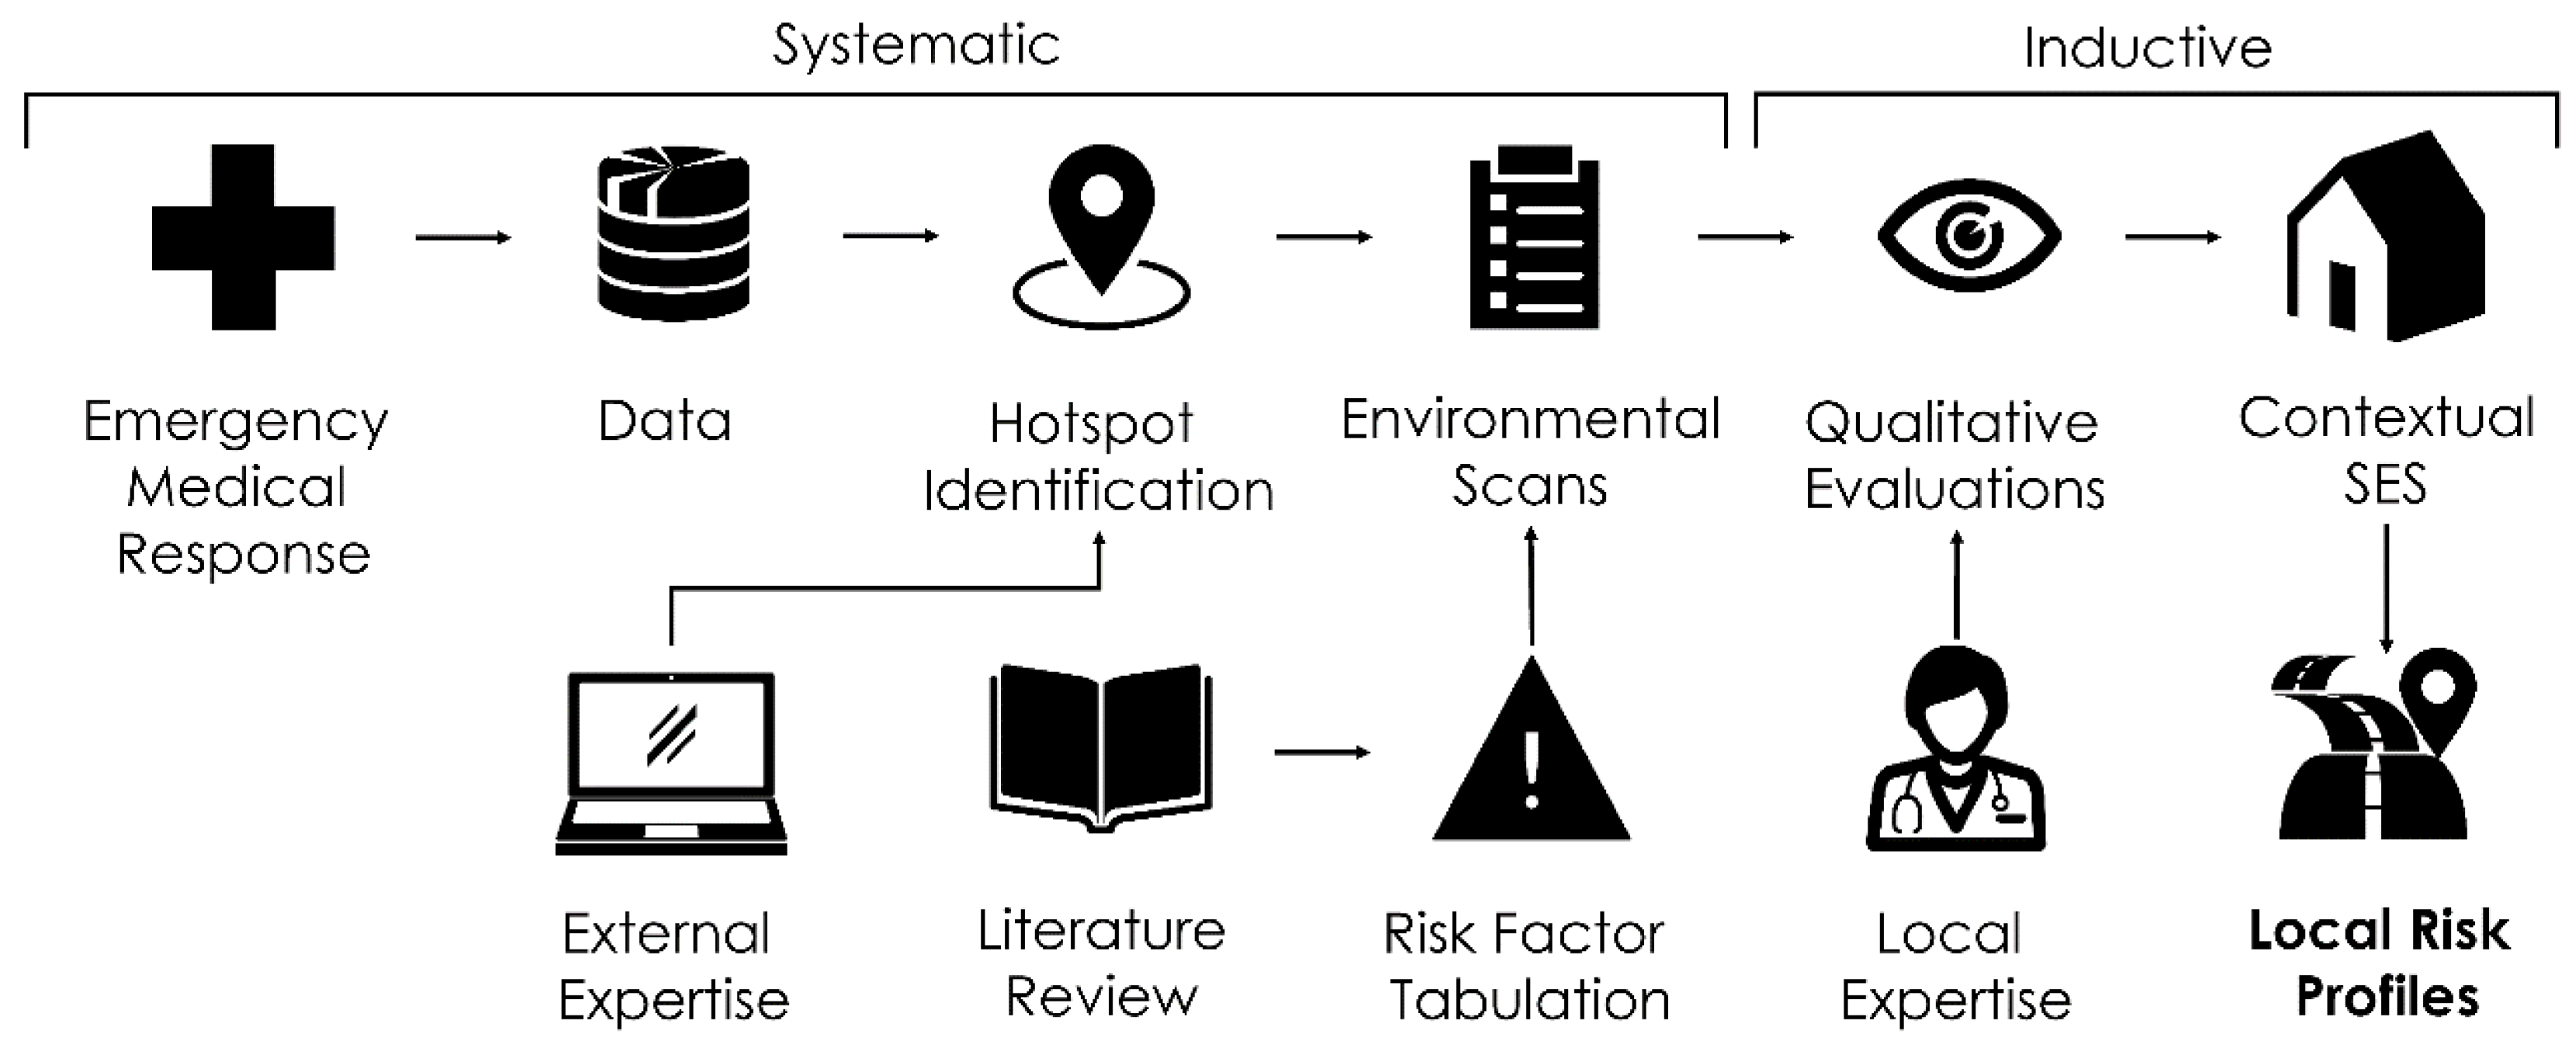
1.3. Mixed Methods
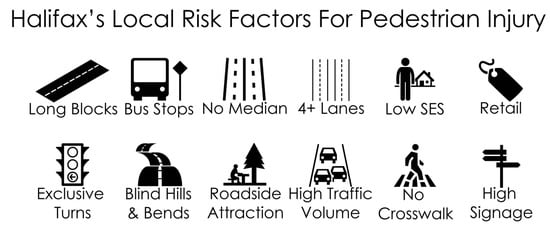
1.4. Risk Factors
2. Materials and Methods
2.1. Data
2.2. Geographical Analysis
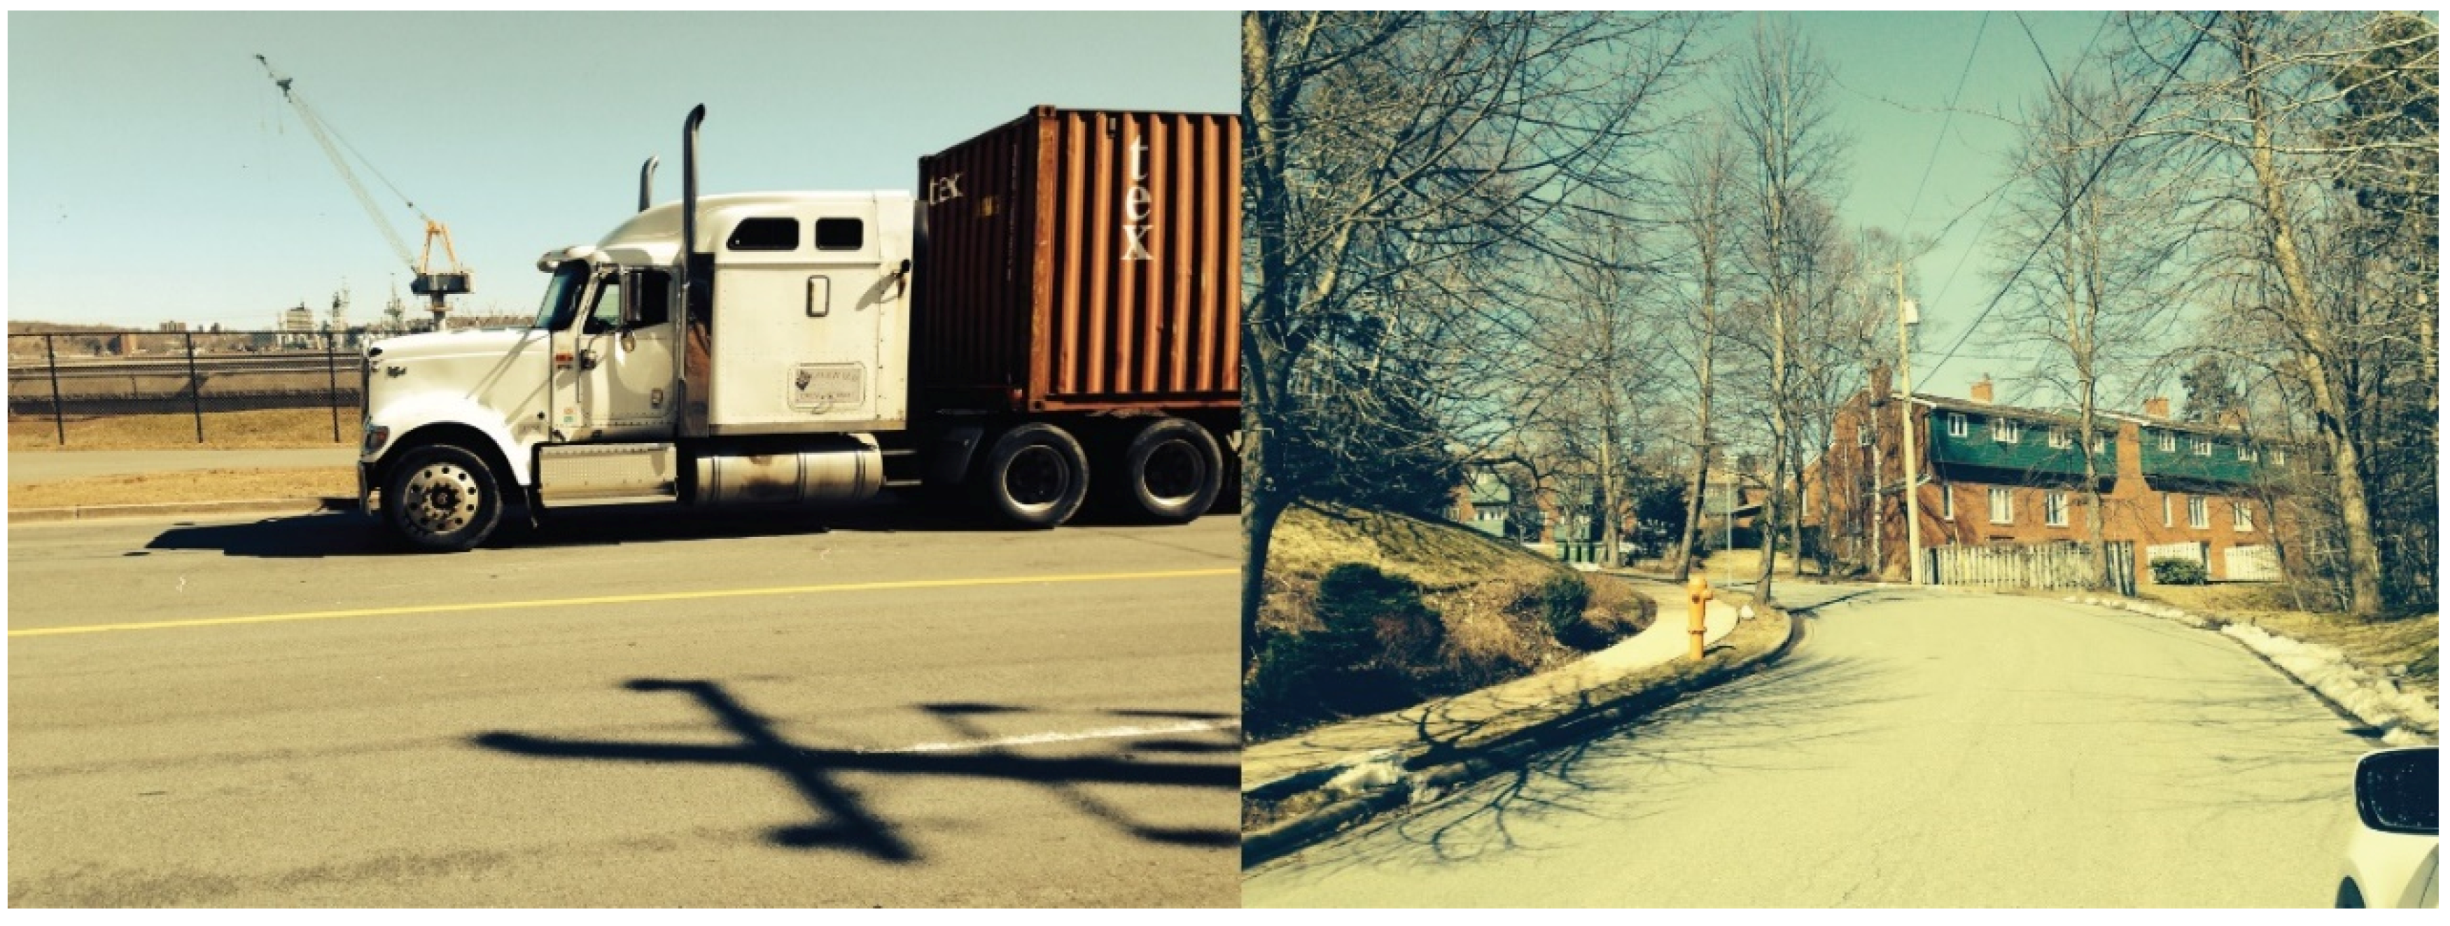
2.3. Environmental Scans
3. Results
4. Discussion
5. Conclusions
Author Contributions
Funding
Acknowledgments
Conflicts of Interest
References
- Haagsma, J.A.; Graetz, N.; Bolliger, I.; Naghavi, M.; Higashi, H.; Mullany, E.C.; Abera, S.F.; Abraham, J.P.; Adofo, K.; Alsharif, U.; et al. The global burden of injury: Incidence, mortality, disability-adjusted life years and time trends from the Global Burden of Disease study 2013. Inj. Prev. 2015, 22, 3–18. [Google Scholar] [CrossRef]
- World Health Organization YLL Estimates, 2000–2012. Available online: http://www.who.int/healthinfo/global_burden_disease/estimates/en/ (accessed on 12 December 2016).
- World Health Organization Road Traffic Injuries. Available online: https://www.who.int/news-room/fact-sheets/detail/road-traffic-injuries (accessed on 10 February 2020).
- Schuurman, N.; Cinnamon, J.; Crooks, V.A.; Hameed, S.M. Pedestrian injury and the built environment: An environmental scan of hotspots. BMC Public Health 2009, 9, 233. [Google Scholar] [CrossRef]
- Cinnamon, J.; Schuurman, N.; Hameed, S.M. Pedestrian injury and human behaviour: Observing road-rule violations at high-incident intersections. PLoS ONE 2011, 6, e21063. [Google Scholar] [CrossRef]
- Tang, J.; Liang, J.; Han, C.; Li, Z.; Huang, H. Crash injury severity analysis using a two-layer Stacking framework. Accid. Anal. Prev. 2019, 122, 226–238. [Google Scholar] [CrossRef] [PubMed]
- Tang, J.; Zheng, L.; Han, C.; Yin, W.; Zhang, Y.; Zou, Y.; Huang, H. Statistical and machine-learning methods for clearance time prediction of road incidents: A methodology review. Anal. Methods Accid. Res. 2020. [CrossRef]
- Yan, Y.; Dai, Y.; Li, X.; Tang, J.; Guo, Z. Driving risk assessment using driving behavior data under continuous tunnel environment. Traffic Inj. Prev. 2019, 20, 807–812. [Google Scholar] [CrossRef] [PubMed]
- Amram, O.; Walker, B.B.; Schuurman, N.; Pike, I.; Yanchar, N. Disparities in Paediatric Injury Mortality between Aboriginal and Non-Aboriginal Populations in British Columbia, 2001–2009. Int. J. Environ. Res. Public Health 2016, 13, 651. [Google Scholar] [CrossRef] [PubMed]
- Amrhein, V.; Greenland, S.; McShane, B. Retire statistical significance. Nature 2019, 567, 305–307. [Google Scholar] [CrossRef]
- Mixed Methods Research for Nursing and the Health Sciences; Andrew, S., Halcomb, E., Eds.; Wiley-Blackwell Pub: Chichester, UK, 2009; ISBN 978-1-4051-6777-2. [Google Scholar]
- Creswell, J. Mapping the Developing Landscape of Mixed Methods Research. In SAGE Handbook of Mixed Methods in Social & Behavioral Research; Tashakkori, A., Teddlie, C., Eds.; SAGE Publications, Inc.: Thousand Oaks, CA, USA, 2010; ISBN 978-1-4129-7266-6. [Google Scholar]
- Crooks, V.A.; Schuurman, N.; Cinnamon, J.; Castleden, H.; Johnston, R. Refining a Location Analysis Model Using a Mixed Methods Approach: Community Readiness as a Key Factor in Siting Rural Palliative Care Services. J. Mix. Methods Res. 2011, 5, 77–95. [Google Scholar] [CrossRef]
- Song, M.K.; Sandelowski, M.; Happ, M.B. Current Practices and Emerging Trends in Conducting Mixed Methods Intervention Studies in the Health Sciences. In SAGE Handbook of Mixed Methods in Social & Behavioral Research; Tashakkori, A., Teddlie, C., Eds.; SAGE Publications, Inc.: Thousand Oaks, CA, USA, 2010; ISBN 978-1-4129-7266-6. [Google Scholar]
- Ukkusuri, S.; Miranda-Moreno, L.F.; Ramadurai, G.; Isa-Tavarez, J. The role of built environment on pedestrian crash frequency. Saf. Sci. 2012, 50, 1141–1151. [Google Scholar] [CrossRef]
- LaScala, E.A.; Gerber, D.; Gruenewald, P.J. Demographic and environmental correlates of pedestrian injury collisions: A spatial analysis. Accid. Anal. Prev. 2000, 32, 651–658. [Google Scholar] [CrossRef]
- Mohamed, M.G.; Saunier, N.; Miranda-Moreno, L.F.; Ukkusuri, S.V. A clustering regression approach: A comprehensive injury severity analysis of pedestrian–vehicle crashes in New York, US and Montreal, Canada. Saf. Sci. 2013, 54, 27–37. [Google Scholar] [CrossRef]
- Quistberg, D.A.; Howard, E.J.; Ebel, B.E.; Moudon, A.V.; Saelens, B.E.; Hurvitz, P.M.; Curtin, J.E.; Rivara, F.P. Multilevel models for evaluating the risk of pedestrian–motor vehicle collisions at intersections and mid-blocks. Accid. Anal. Prev. 2015, 84, 99–111. [Google Scholar] [CrossRef] [PubMed]
- Strauss, J.; Miranda-Moreno, L.F.; Morency, P. Multimodal injury risk analysis of road users at signalized and non-signalized intersections. Accid. Anal. Prev. 2014, 71, 201–209. [Google Scholar] [CrossRef] [PubMed]
- Wier, M.; Weintraub, J.; Humphreys, E.H.; Seto, E.; Bhatia, R. An area-level model of vehicle-pedestrian injury collisions with implications for land use and transportation planning. Accid. Anal. Prev. 2009, 41, 137–145. [Google Scholar] [CrossRef]
- Bennet, S.A.; Yiannakoulias, N. Motor-vehicle collisions involving child pedestrians at intersection and mid-block locations. Accid. Anal. Prev. 2015, 78, 94–103. [Google Scholar] [CrossRef]
- Lee, C.; Abdel-Aty, M. Comprehensive analysis of vehicle-pedestrian crashes at intersections in Florida. Accid. Anal. Prev. 2005, 37, 775–786. [Google Scholar] [CrossRef]
- Zajac, S.S.; Ivan, J.N. Factors influencing injury severity of motor vehicle-crossing pedestrian crashes in rural Connecticut. Accid. Anal. Prev. 2003, 35, 369–379. [Google Scholar] [CrossRef]
- Godley, S.T.; Triggs, T.J.; Fildes, B.N. Perceptual lane width, wide perceptual road centre markings and driving speeds. Ergonomics 2004, 47, 237–256. [Google Scholar] [CrossRef]
- Noland, R.B.; Oh, L. The effect of infrastructure and demographic change on traffic-related fatalities and crashes: A case study of Illinois county-level data. Accid. Anal. Prev. 2004, 36, 525–532. [Google Scholar] [CrossRef]
- Swift, P.; Painter, D.; Goldstein, M. Residential Street Typology and Injury Accident Frequency; Longmont Planning Department: Longmont, CO, USA, 2006. [Google Scholar]
- Ewing, R.; Dumbaugh, E. The Built Environment and Traffic Safety: A Review of Empirical Evidence. J. Plan. Lit. 2009, 23, 347–367. [Google Scholar] [CrossRef]
- Morency, P.; Archambault, J.; Cloutier, M.-S.; Tremblay, M.; Plante, C. Major urban road characteristics and injured pedestrians: A representative survey of intersections in Montréal, Quebec. Can. J. Public Health 2015, 106, E388–E394. [Google Scholar] [CrossRef]
- Morency, P.; Gauvin, L.; Plante, C.; Fournier, M.; Morency, C. Neighborhood social inequalities in road traffic injuries: The influence of traffic volume and road design. Am. J. Public Health 2012, 102, 1112–1119. [Google Scholar] [CrossRef]
- Pulugurtha, S.S.; Sambhara, V.R. Pedestrian crash estimation models for signalized intersections. Accid. Anal. Prev. 2011, 43, 439–446. [Google Scholar] [CrossRef]
- Clifton, K.J.; Burnier, C.V.; Akar, G. Severity of injury resulting from pedestrian-vehicle crashes: What can we learn from examining the built environment? Transp. Res. Part Transp. Environ. 2009, 14, 425–436. [Google Scholar] [CrossRef]
- Moudon, A.V.; Lin, L.; Jiao, J.; Hurvitz, P.; Reeves, P. The risk of pedestrian injury and fatality in collisions with motor vehicles, a social ecological study of state routes and city streets in King County, Washington. Accid. Anal. Prev. 2011, 43, 11–24. [Google Scholar] [CrossRef] [PubMed]
- Dommes, A.; Granié, M.; Cloutier, M.; Coquelet, C.; Huguenin-richard, F. Red light violations by adult pedestrians and other safety-related behaviors at signalized crosswalks. Accid. Anal. Prev. 2015, 80, 67–75. [Google Scholar] [CrossRef]
- Yannis, G.; Papadimitriou, E.; Theofilatos, A. Pedestrian gap acceptance for mid-block street crossing. Transp. Plan. Technol. 2013, 36, 450–462. [Google Scholar] [CrossRef]
- Ponicki, W.R.; Gruenewald, P.J.; Remer, L.G. Spatial panel analyses of alcohol outlets and motor vehicle crashes in California: 1999–2008. Accid. Anal. Prev. 2013, 55, 135–143. [Google Scholar] [CrossRef] [PubMed]
- Sebert Kuhlmann, A.K.; Brett, J.; Thomas, D.; Sain, S. Environmental Characteristics Associated with Pedestrian–Motor Vehicle Collisions in Denver, Colorado. Am. J. Public Health 2009, 99, 1632–1637. [Google Scholar] [CrossRef]
- Dultz, L.A.; Frangos, S.G. The impact of alcohol in pedestrian trauma. Trauma 2013, 15, 75. [Google Scholar] [CrossRef]
- Prijon, T.; Ermenc, B. Influence of alcohol intoxication of pedestrians on injuries in fatal road accidents. Forensic Sci. Int. Suppl. Ser. 2009, 1, 33–34. [Google Scholar] [CrossRef]
- Clifton, K.J.; Kreamer-Fults, K. An examination of the environmental attributes associated with pedestrian-vehicular crashes near public schools. Accid. Anal. Prev. 2007, 39, 708–715. [Google Scholar] [CrossRef] [PubMed]
- Islam, S.; Jones, S.L. Pedestrian at-fault crashes on rural and urban roadways in Alabama. Accid. Anal. Prev. 2014, 72, 267–276. [Google Scholar] [CrossRef]
- Hess, P.M.; Moudon, A.V.; Matlick, J.M. Pedestrian safety and transit corridors. J. Public Transp. 2004, 7, 5. [Google Scholar] [CrossRef]
- Chakravarthy, B.; Anderson, C.L.; Ludlow, J.; Lotfipour, S.; Vaca, F.E. The relationship of pedestrian injuries to socioeconomic characteristics in a large Southern California County. Traffic Inj. Prev. 2010, 11, 508–513. [Google Scholar] [CrossRef]
- Noland, R.B.; Klein, N.J.; Tulach, N.K. Do lower income areas have more pedestrian casualties? Accid. Anal. Prev. 2013, 59, 337–345. [Google Scholar] [CrossRef]
- Dai, D. Identifying clusters and risk factors of injuries in pedestrian–vehicle crashes in a GIS environment. J. Transp. Geogr. 2012, 24, 206–214. [Google Scholar] [CrossRef]
- Wang, W.; Guo, H.; Gao, Z.; Bubb, H. Individual differences of pedestrian behaviour in midblock crosswalk and intersection. Int. J. Crashworthiness 2011, 16, 1–9. [Google Scholar] [CrossRef]
- Liu, Y.C.; Tung, Y.C. Risk analysis of pedestrians’ road-crossing decisions: Effects of age, time gap, time of day, and vehicle speed. Saf. Sci. 2014, 63, 77–82. [Google Scholar] [CrossRef]
- Dommes, A.; Cavallo, V.; Oxley, J. Functional declines as predictors of risky street-crossing decisions in older pedestrians. Accid. Anal. Prev. 2013, 59, 135–143. [Google Scholar] [CrossRef] [PubMed]
- Walker, B.B.; Schuurman, N.; Hameed, S.M. A GIS-based spatiotemporal analysis of violent trauma hotspots in Vancouver, Canada: Identification, contextualisation and intervention. BMJ Open 2014, 4, e003642. [Google Scholar] [CrossRef] [PubMed]
- Schuurman, N.; Cinnamon, J.; Walker, B.B.; Fawcett, V.; Nicol, A.; Hameed, S.M.; Matzopoulos, R. Intentional injury and violence in Cape Town, South Africa: An epidemiological analysis of trauma admissions data. Glob. Health Action 2015, 8, 27016. [Google Scholar] [CrossRef]
- Schuurman, N.; Grund, D.; Hayes, M.; Dragicevic, S. Spatial/temporal mismatch: A conflation protocol for Canada census spatial files. Can. Geogr. 2006, 50, 74–84. [Google Scholar] [CrossRef]
- Bell, N.; Schuurman, N.; Oliver, L.; Hayes, M.V. Towards the construction of place-specific measures of deprivation: A case study from the Vancouver metropolitan area. Can. Geogr. Géographe Can. 2007, 51, 444–461. [Google Scholar] [CrossRef]
- Bell, N.; Schuurman, N.; Hayes, M.V. Using GIS-based methods of multicriteria analysis to construct socio-economic deprivation indices. Int. J. Health Geogr. 2007, 6, 17. [Google Scholar] [CrossRef]
- Teschke, K.; Dennis, J.; Reynolds, C.C.O.; Winters, M.; Harris, M.A. Bicycling crashes on streetcar (tram) or train tracks: Mixed methods to identify prevention measures. BMC Public Health 2016, 16, 617. [Google Scholar] [CrossRef]
- Chesebro, J.W.; Borisoff, D.J. What Makes Qualitative Research Qualitative? Qual. Res. Rep. Commun. 2007, 8, 3–14. [Google Scholar] [CrossRef]
- Ryen, A. Introduction to the Special Issue: What qualitative research makes us see. J. Comp. Soc. Work 2013, 8, 135–140. [Google Scholar] [CrossRef]
- Crossman, A. An Overview of Qualitative Research Methods. Available online: https://www.thoughtco.com/qualitative-research-methods-3026555 (accessed on 10 February 2020).
- O’Reilly, K. Ethnographic Returning, Qualitative Longitudinal Research and the Reflexive Analysis of Social Practice. Sociol. Rev. 2012, 60, 518–536. [Google Scholar] [CrossRef]
- Morse, J.M. Introducing the First Global Congress for Qualitative Health Research: What Are We? What Will We Do—And Why? Qual. Health Res. 2012, 22, 147–156. [Google Scholar] [CrossRef]
- Trainor, A.A.; Graue, E. Evaluating Rigor in Qualitative Methodology and Research Dissemination. Remedial Spec. Educ. 2014, 35, 267–274. [Google Scholar] [CrossRef]
- Chatfield, S.L. Considerations in Qualitative Research Reporting: A Guide for Authors Preparing Articles for Sex Roles. Sex Roles 2018, 79, 125–135. [Google Scholar] [CrossRef]
- Walker, B.B.; Schuurman, N. The Pen or the Sword: A Situated Spatial Analysis of Graffiti and Violent Injury in Vancouver, British Columbia. Prof. Geogr. 2015, 67, 608–619. [Google Scholar] [CrossRef]


| Risk Factor | Injury Count | Injury Percent |
|---|---|---|
| Age | ||
| 0–10 | 13 | 7.39% |
| 11–20 | 41 | 23.30% |
| 21–30 | 41 | 23.30% |
| 31–40 | 11 | 6.25% |
| 41–50 | 15 | 8.52% |
| 51–60 | 21 | 11.93% |
| 61–70 | 14 | 7.95% |
| 71–80 | 10 | 5.68% |
| 81–90 | 10 | 5.68% |
| Sex | ||
| Male | 95 | 53.98% |
| Female | 81 | 46.02% |
| VANDIX SES Ranking Relative to the HRM (Quintiles) | ||
| Q1 (Least Deprived) | 41 | 23.30% |
| Q2 | 27 | 15.34% |
| Q3 | 33 | 18.75% |
| Q4 | 28 | 15.91% |
| Q5 (Most Deprived) | 47 | 26.70% |
| Risk Factor | Hotspot Prevalence |
|---|---|
| Long Blocks | 7/10 |
| Bus Stops | 6/10 |
| Curb Parking | 3/10 |
| Cross Walk | 6/10 |
| Obstruction | 3/10 |
| Exclusive Turn | 8/10 |
| Turn Ban | 5/10 |
| Bars | 2/10 |
| Retail | 5/10 |
| School | 5/10 |
| Calming | 1/10 |
| Median | 2/10 |
| Number of Lanes | Mean: 8.8 |
| Signage | High: 5/10 |
| Medium: 3/10 | |
| Low: 2/10 |
© 2020 by the authors. Licensee MDPI, Basel, Switzerland. This article is an open access article distributed under the terms and conditions of the Creative Commons Attribution (CC BY) license (http://creativecommons.org/licenses/by/4.0/).
Share and Cite
Schuurman, N.; Walker, B.B.; Swanlund, D.; Amram, O.; Yanchar, N.L. Qualitative Field Observation of Pedestrian Injury Hotspots: A Mixed-Methods Approach for Developing Built- and Socioeconomic-Environmental Risk Signatures. Int. J. Environ. Res. Public Health 2020, 17, 2066. https://doi.org/10.3390/ijerph17062066
Schuurman N, Walker BB, Swanlund D, Amram O, Yanchar NL. Qualitative Field Observation of Pedestrian Injury Hotspots: A Mixed-Methods Approach for Developing Built- and Socioeconomic-Environmental Risk Signatures. International Journal of Environmental Research and Public Health. 2020; 17(6):2066. https://doi.org/10.3390/ijerph17062066
Chicago/Turabian StyleSchuurman, Nadine, Blake Byron Walker, David Swanlund, Ofer Amram, and Natalie L. Yanchar. 2020. "Qualitative Field Observation of Pedestrian Injury Hotspots: A Mixed-Methods Approach for Developing Built- and Socioeconomic-Environmental Risk Signatures" International Journal of Environmental Research and Public Health 17, no. 6: 2066. https://doi.org/10.3390/ijerph17062066
APA StyleSchuurman, N., Walker, B. B., Swanlund, D., Amram, O., & Yanchar, N. L. (2020). Qualitative Field Observation of Pedestrian Injury Hotspots: A Mixed-Methods Approach for Developing Built- and Socioeconomic-Environmental Risk Signatures. International Journal of Environmental Research and Public Health, 17(6), 2066. https://doi.org/10.3390/ijerph17062066