Benchmarking Community Disaster Resilience in Nepal


Abstract
1. Introduction
- How does community resilience manifest itself across Nepal?
- Do clusters of higher and lower community resilience exist across Nepal?
2. Concept of Resilience and Its Measurement
2.1. Defining Resilience
2.2. Measuring Disaster Resilience
3. Materials and Methods
3.1. Study Area
3.2. Selection of Variables
3.3. Methods
4. Results
4.1. Components of CDRI
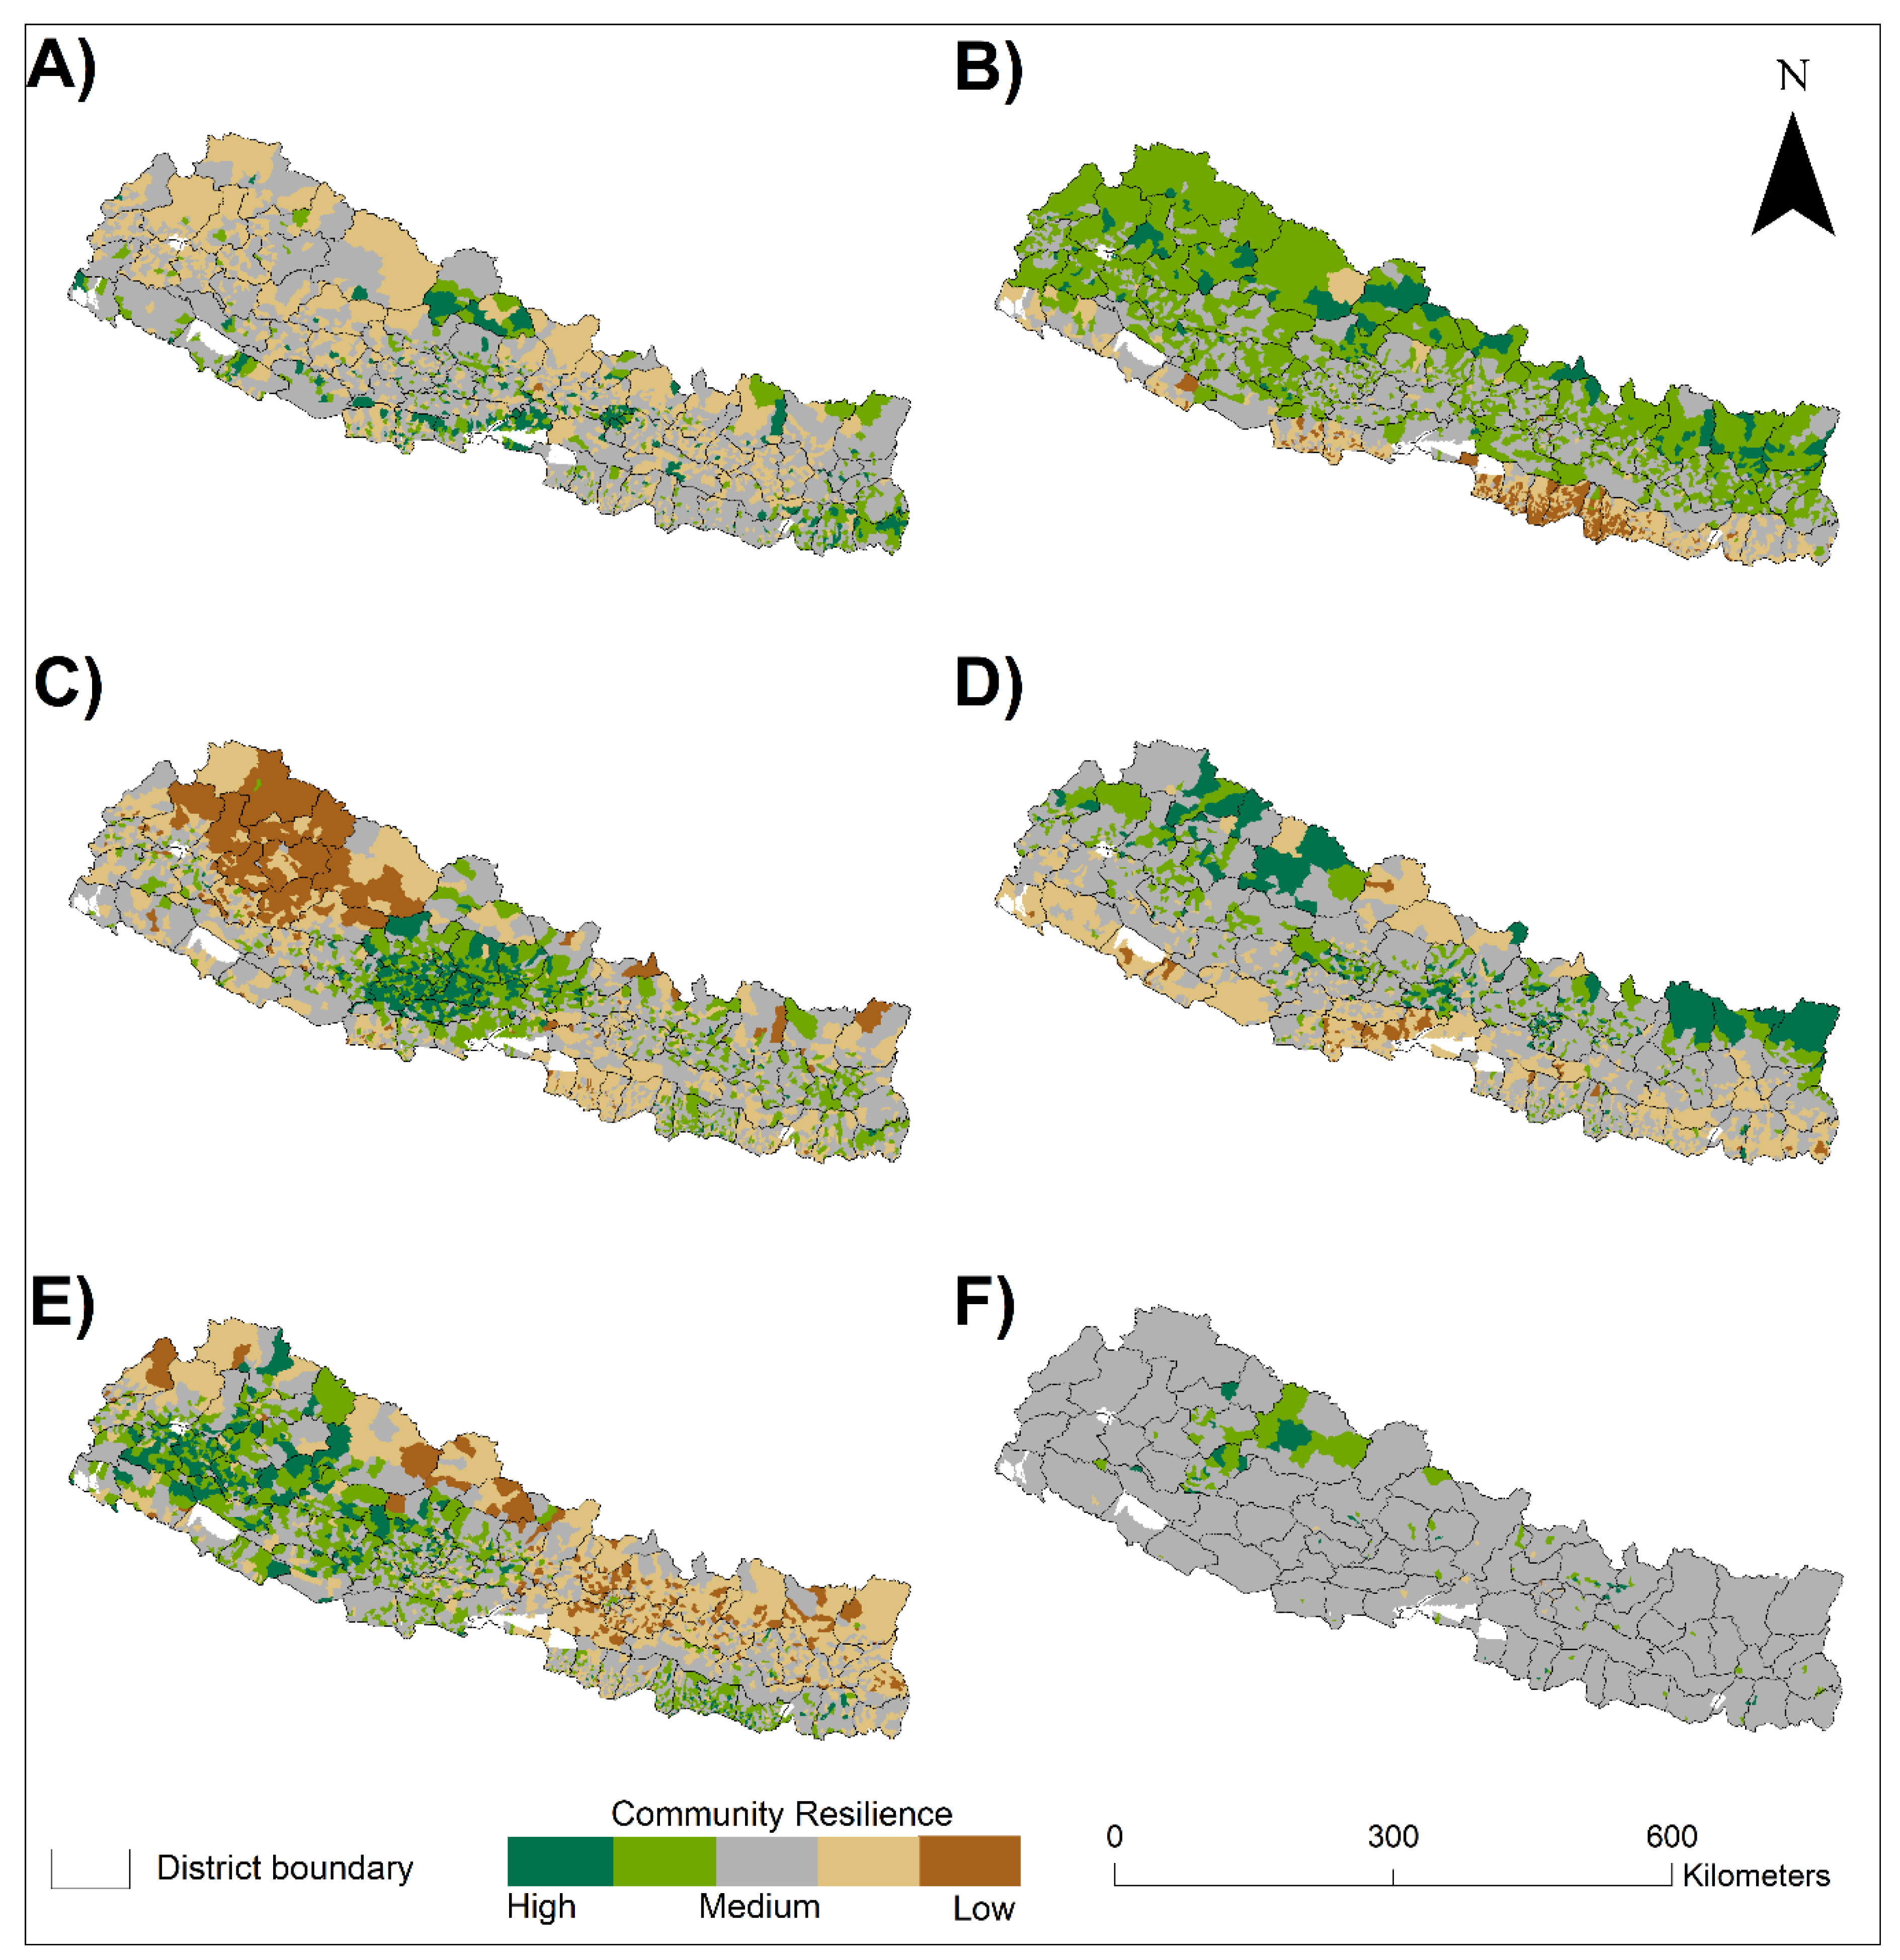
4.2. Geographic Distribution of CDRI Components
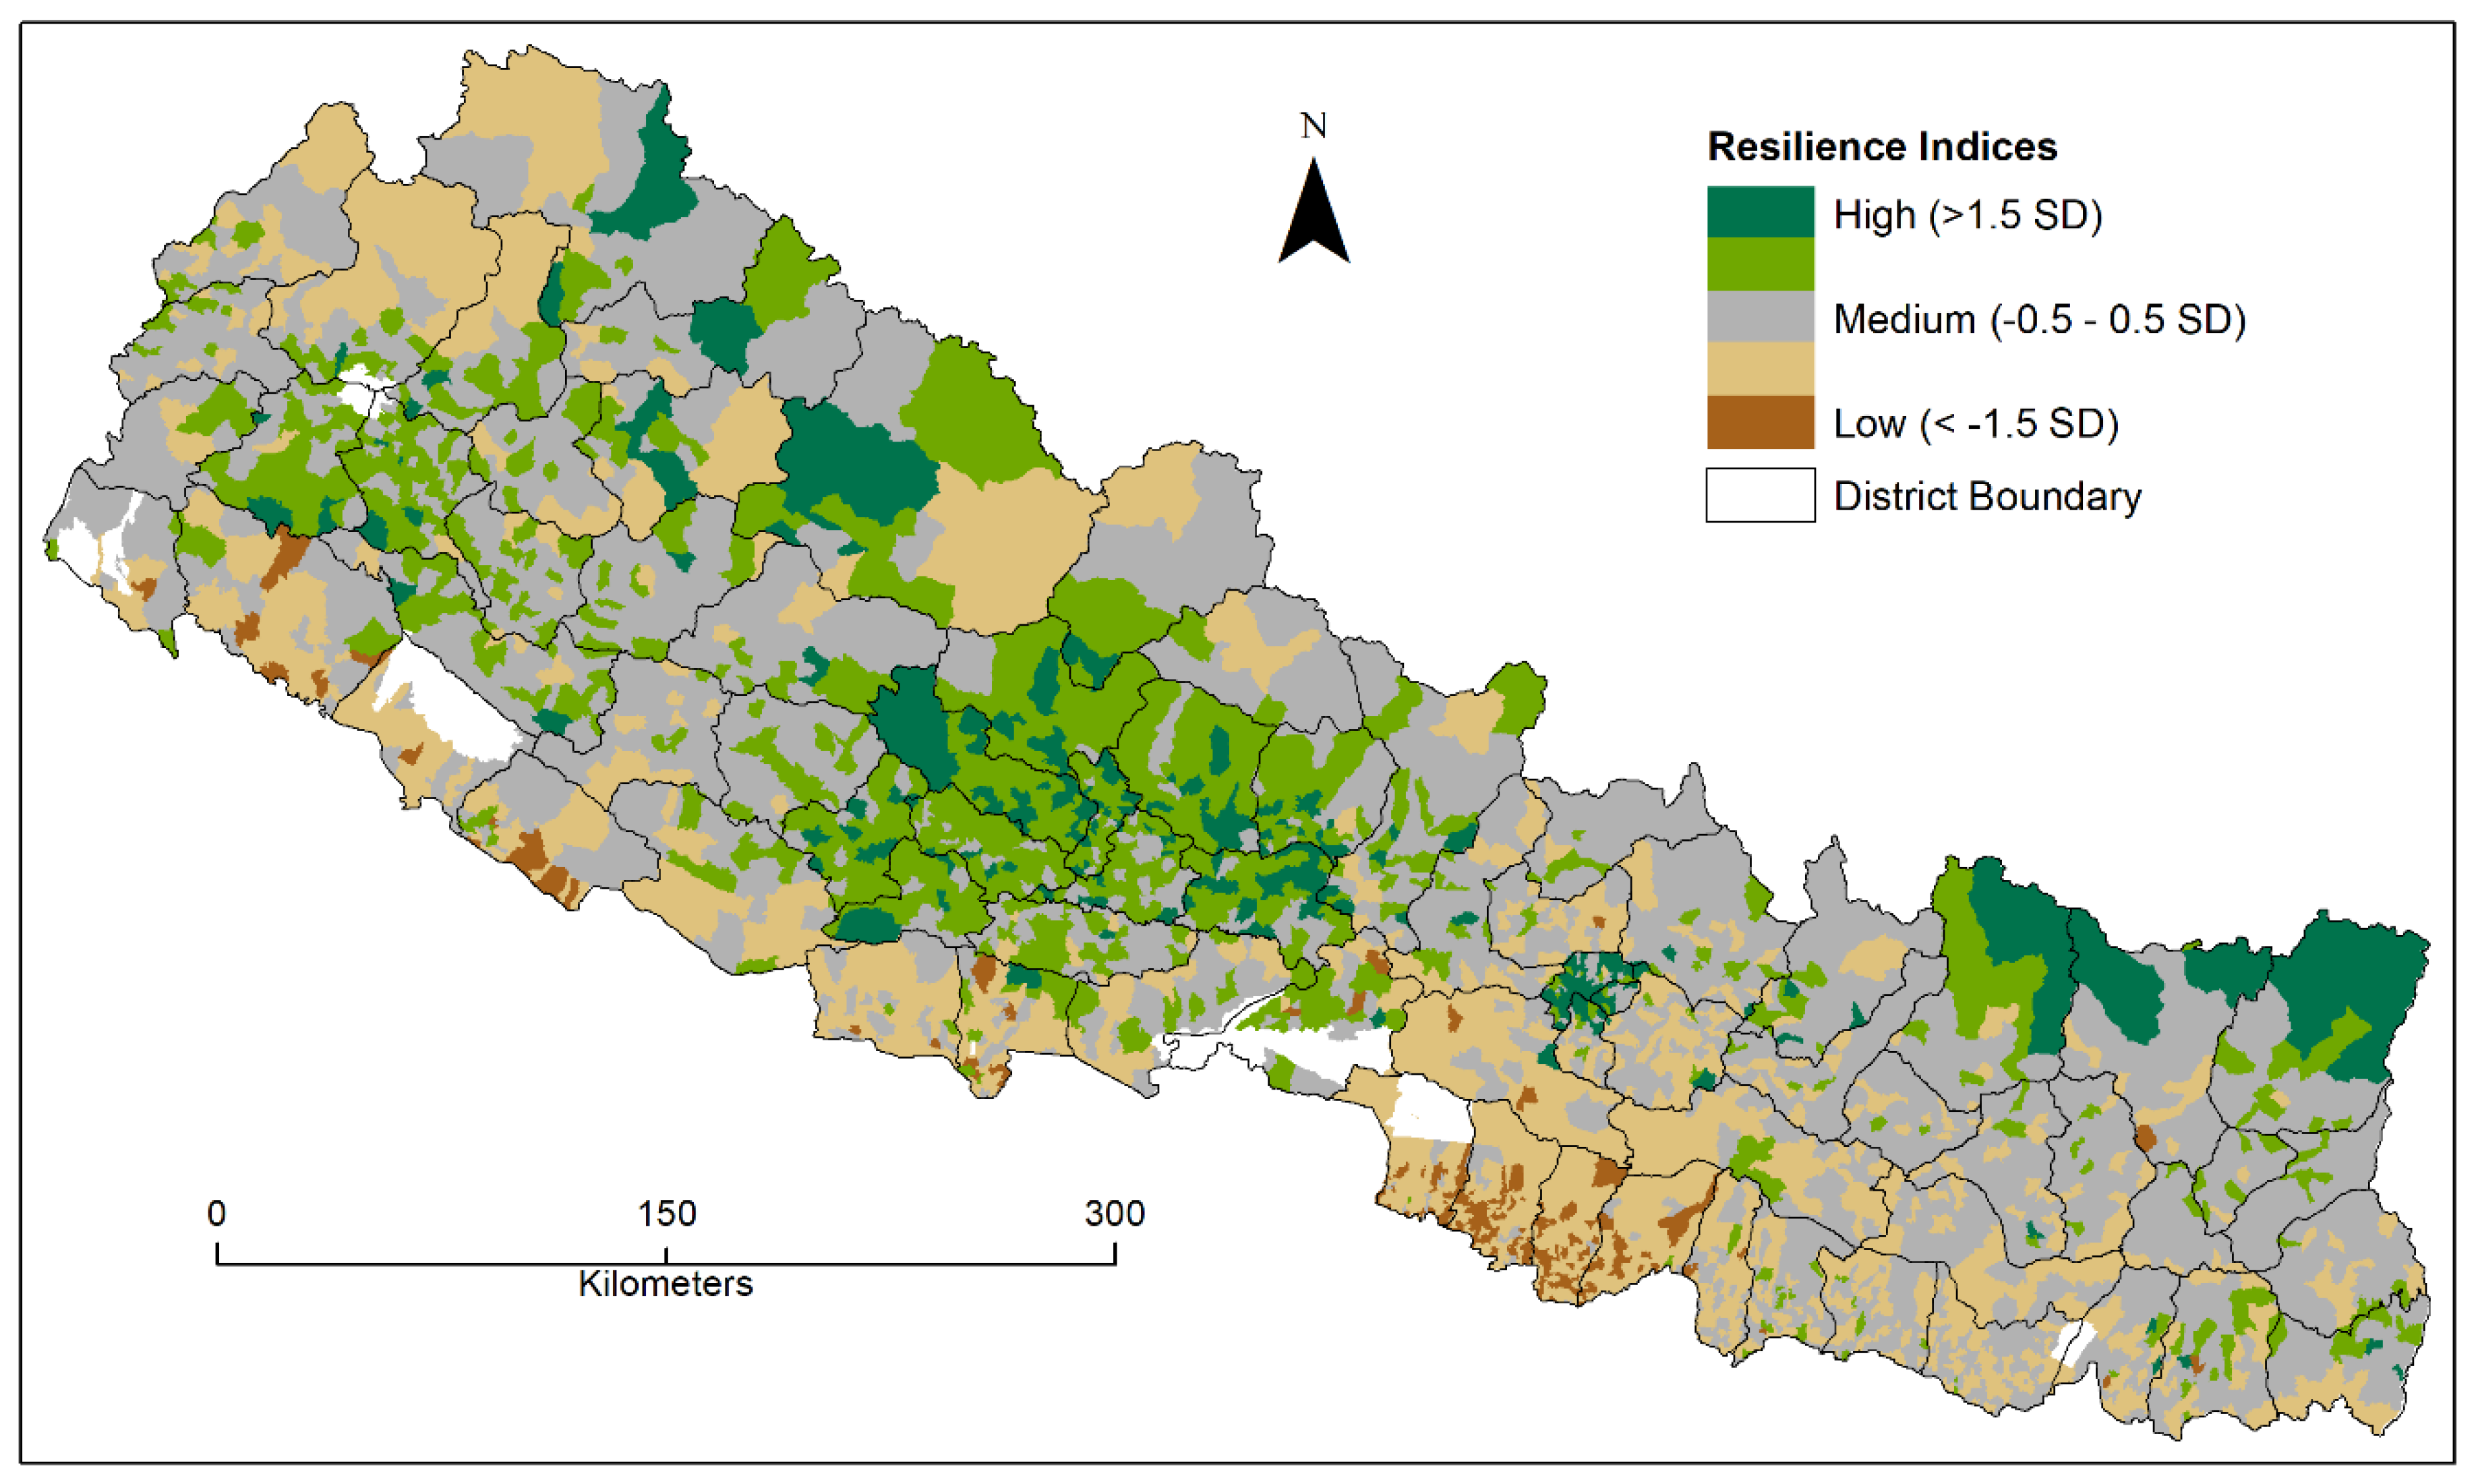
4.3. Spatial Distribution of CDRI Scores
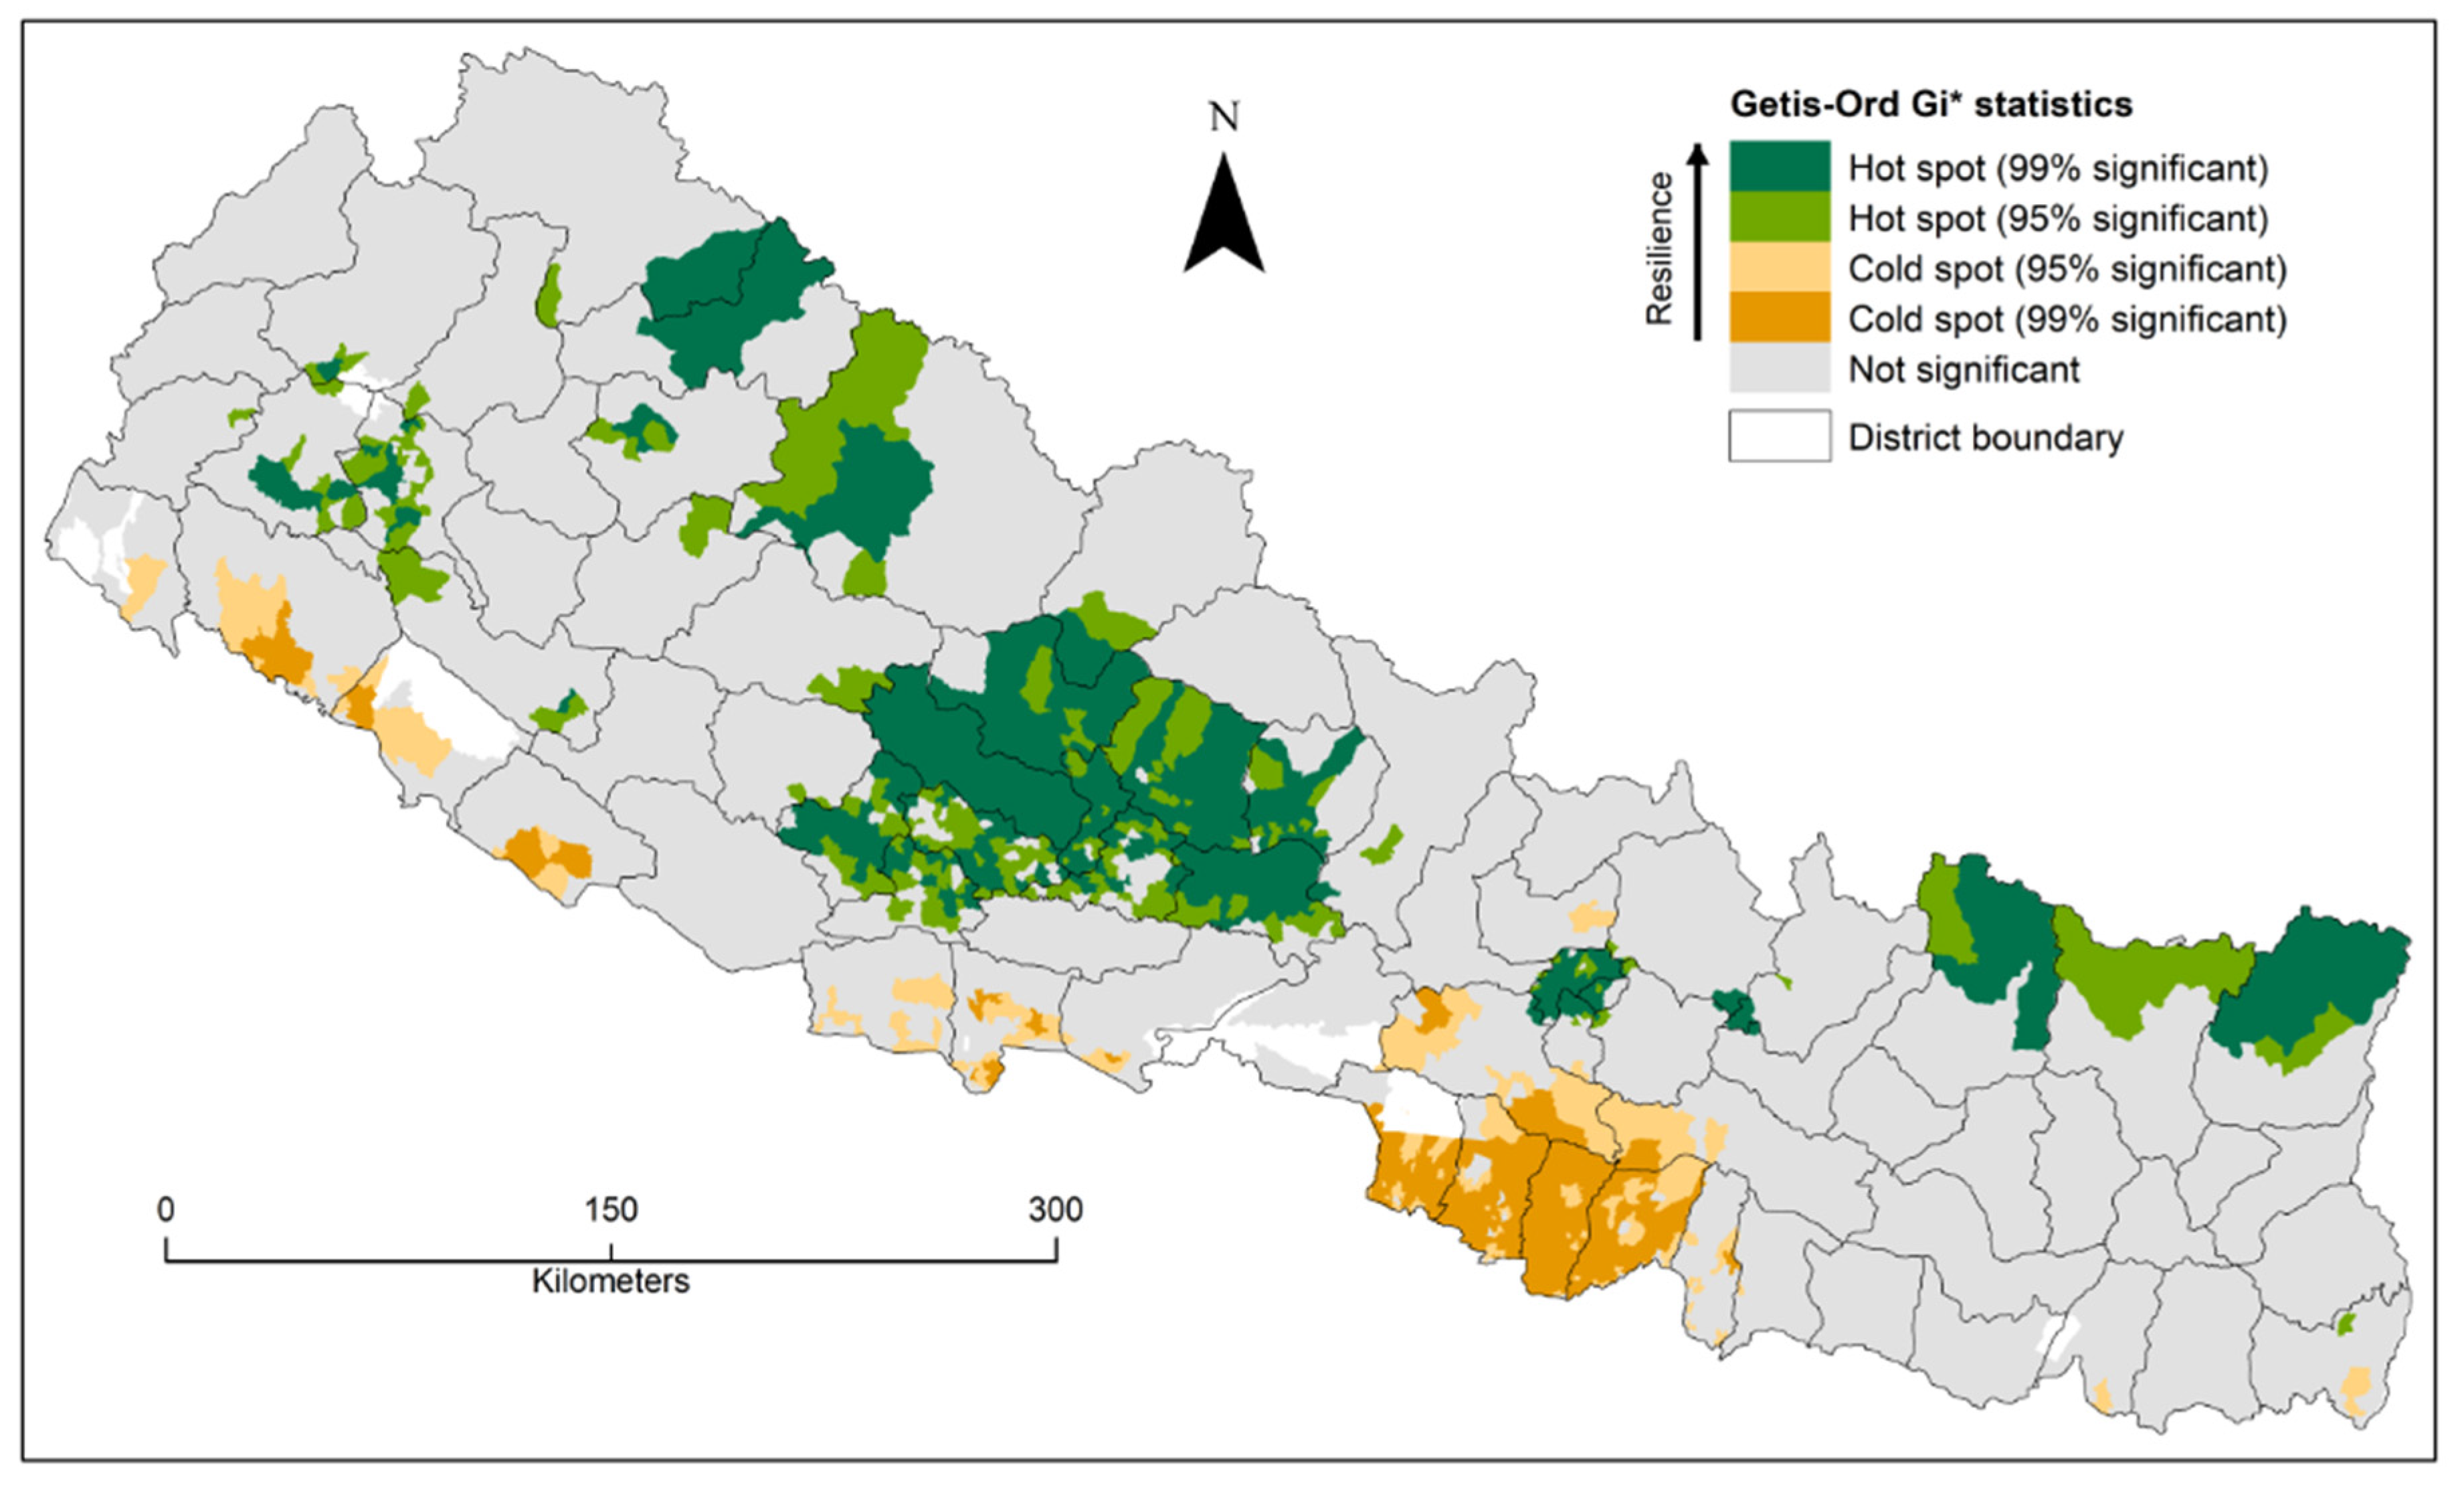
4.4. Spatial Agglomeration of CDRI Scores
5. Discussion
6. Conclusions
Author Contributions
Funding
Conflicts of Interest
References
- Wallemacq, P.; House, R.; McClean, D.; Below, R. Economic Losses, Poverty, and Disasters 1998–2017; Centre for Research on the Epidemiology of Disasters (CRED) and United Nations Office for Disaster Risk Reduction (UNISDR): Brussels, Belgium, 2018. [Google Scholar]
- de Haen, H.; Hemrich, G. The economics of natural disasters: Implications and challenges for food security. Agric. Econ-Blackwell 2007, 31, 31–45. [Google Scholar] [CrossRef]
- Dilley, M.; Chen, R.S.; Deichmann, U.; Lerner-Lam, A.L.; Arnold, M. Natural Disaster Hotspots: A Global Risk Analysis; The World Bank: Washington, DC, USA, 2005. [Google Scholar]
- Cutter, S.L. Resilience to what? Resilience for whom? Geogr. J. 2016, 182, 110–113. [Google Scholar] [CrossRef]
- Emrich, C.T.; Tobin, G.A. Resilience: An Introduction. In Vulnerability and Resilience to Natural Hazards; Fuchs, S., Thaler, T., Eds.; Cambridge University Press: Cambridge, UK, 2018; pp. 124–144. [Google Scholar]
- Siebeneck, L.; Arlikatti, S.; Andrew, S.A. Using provincial baseline indicators to model geographic variations of disaster resilience in Thailand. Nat. Hazards 2015, 79, 955–975. [Google Scholar] [CrossRef]
- Cutter, S.L.; Ash, K.D.; Emrich, C.T. The geographies of community disaster resilience. Glob. Environ. Chang. 2014, 29, 2965–2977. [Google Scholar] [CrossRef]
- UNISDR. Sendai Framework for Disaster Risk Reduction 2015–2030; United Nations International Strategy for Disaster Reduction (UNISDR): Geneva, Switzerland, 2015. [Google Scholar]
- Cutter, S.L. The landscape of disaster resilience indicators in the USA. Nat. Hazards 2016, 80, 741–758. [Google Scholar] [CrossRef]
- Mavhura, E.; Manyena, B. Spatial quantification of community resilience in contexts where quantitative data are scarce: The case of Muzarabani district in Zimbabwe. Geo: Geogr. Environ. 2018, 5, e00065. [Google Scholar] [CrossRef]
- Singh-Peterson, L.; Salmon, P.; Goode, N.; Gallina, J. Translation and evaluation of the baseline resilience indicators for communities on the Sunshine Coast, Queensland Australia. Int. J. Disaster Risk Reduct. 2014, 10116–10126. [Google Scholar] [CrossRef]
- Aksha, S.K.; Resler, L.M.; Juran, L.; Carstensen, L.W., Jr. A geospatial analysis of multi-hazard risk in Dharan, Nepal. Geomat. Nat. Hazards Risk 2020, 11, 88–111. [Google Scholar] [CrossRef]
- NPC. Nepal Earthquake 2015: Post Disaster Needs Assessment. In Kathmandu: Government of Nepal; National Planning Commission (NPC): Kathmandu, Nepal, 2015. [Google Scholar]
- NPC. Nepal Flood 2017: Post Flood Recovery Needs Assessment. In Kathmandu: Government of Nepal; National Planning Commission (NPC): Kathmandu, Nepal, 2017. [Google Scholar]
- Gaire, S.; Delgado, R.C.; González, P.A. Disaster risk profile and existing legal framework of Nepal: Floods and landslides. Risk Manag. Healthc. Policy 2015, 8, 139–149. [Google Scholar] [CrossRef]
- Ministry of Home Affairs (MoHA) GoN. Nepal disaster report 2009: The Hazardscape and Vulnerability. In Kathmandu: Government of Nepal; National Planning Commission (NPC): Kathmandu, Nepal, 2009. [Google Scholar]
- Davoudi, S. Resilience: A bridging concept or a dead end? Plan. Theory Pract. 2012, 13, 299–333. [Google Scholar] [CrossRef]
- Alexander, D.E. Resilience and disaster risk reduction: An etymological journey. Nat. Hazard Earth Syst. 2013, 13, 2707–2716. [Google Scholar] [CrossRef]
- Holling, C.S. Resilience and stability of ecological systems. Annu. Rev. Ecol. Syst. 1973, 4, 1–23. [Google Scholar] [CrossRef]
- National Research Council. Disaster Resilience: A National Imperative; The National Academies Press: Washington, DC, USA, 2012. [Google Scholar]
- Weichselgartner, J.; Kelman, I. Geographies of resilience: Challenges and opportunities of a descriptive concept. Prog. Hum. Geogr. 2015, 39, 249–267. [Google Scholar] [CrossRef]
- Sudmeier-Rieux, K.I. Resilience–an emerging paradigm of danger or of hope? Disaster Prev. Manag. 2014, 23, 67–80. [Google Scholar] [CrossRef]
- Klein, R.J.; Nicholls, R.J.; Thomalla, F. Resilience to natural hazards: How useful is this concept? Glob. Environ. Chang. Part B Environ. Hazards 2003, 5, 35–45. [Google Scholar] [CrossRef]
- Manyena, S.B. Disaster resilience: A question of multiple faces and multiple spaces? Int. J. Disaster Risk Reduct. 2014, 8, 81–89. [Google Scholar] [CrossRef]
- Yoon, D.K.; Kang, J.E.; Brody, S.D. A measurement of community disaster resilience in Korea. J. Environ. Plan. Manag. 2016, 59, 436–460. [Google Scholar] [CrossRef]
- Cutter, S.L.; Burton, C.G.; Emrich, C.T. Disaster resilience indicators for benchmarking baseline conditions. J. Homel. Secur. Emerg. Manag. 2010, 7, 1–22. [Google Scholar] [CrossRef]
- Kafle, S.K. Measuring disaster-resilient communities: A case study of coastal communities in Indonesia. J. Bus. Contin. Emerg. Plan. 2012, 5, 316–326. [Google Scholar]
- Scherzer, S.; Lujala, P.; Rød, J.K. A community resilience index for Norway: An adaptation of the Baseline Resilience Indicators for Communities (BRIC). Int. J. Disaster Risk Reduct. 2019, 36, 101107. [Google Scholar] [CrossRef]
- Bollettino, V.; Alcayna, T.; Dy, P.; Vinck, P. Introduction to Socio-Ecological Resilience; Oxford University Press: Oxford, UK, 2017. [Google Scholar]
- Davies, T.; Beaven, S.; Conradson, D.; Densmore, A.; Gaillard, J.; Johnston, D.; Milledge, D.G.; Oven, K.J.; Petley, D.N.; Rigg, J.; et al. Towards disaster resilience: A scenario-based approach to co-producing and integrating hazard and risk knowledge. Int. J. Disaster Risk Reduct. 2015, 13, 242–247. [Google Scholar] [CrossRef]
- Asadzadeh, A.; Kötter, T.; Salehi, P.; Birkmann, J. Operationalizing a concept: The systematic review of composite indicator building for measuring community disaster resilience. Int. J. Disaster Risk Reduct. 2017, 25, 147–162. [Google Scholar] [CrossRef]
- Patel, S.S.; Rogers, M.B.; Amlôt, R.; Rubin, G.J. What do we mean by community resilience? A systematic literature review of how it is defined in the literature. PLoS Curr. 2017, 9. [Google Scholar] [CrossRef]
- Shaw, R.; Team, I. Climate disaster resilience: Focus on coastal urban cities in Asia. Asian J. Environ. Disaster Manag. 2009, 1, 101–116. [Google Scholar]
- Courtney, C.A.; Ahmed, A.K.; Jackson, R.; McKinnie, D.; Rubinoff, P.; Stein, A.; Tighe, S.; White, A. Coastal Community Resilience in the Indian Ocean Region: A Unifying Framework, Assessment, and Lessons Learned. In Solutions to Coastal Disasters; ASCE: Reston, VA, USA, 2008; pp. 990–1001. [Google Scholar]
- Sempier, T.; Swann, D.; Emmer, R.; Sempier, S.; Schneider, M. Coastal Community Resilience Index: A Community Self-Assessment. MASGP-08-014, Mississippi-Alabama; Sea Grant Consortium: Highlands, NJ, USA, 2010. [Google Scholar]
- Pfefferbaum, R.L.; Pfefferbaum, B.; Van Horn, R.L.; Klomp, R.W.; Norris, F.H.; Reissman, D.B. The communities advancing resilience toolkit (CART): An intervention to build community resilience to disasters. J. Public Health Manag. Pract. 2013, 19, 250–258. [Google Scholar] [CrossRef]
- Mayunga, J.S. Understanding and applying the concept of community disaster resilience: A capital-based approach. Summer Acad. Soc. Vulnerabil. Resil. Build. 2007, 1, 1–16. [Google Scholar]
- UNDP. Understanding Community Resilience: Findings from Community-Based Resilience Analysis (CoBRA) Assessments; UNDP Drylands Development Centre: Nairobi, Kenya, 2014. [Google Scholar]
- Cohen, O.; Leykin, D.; Lahad, M.; Goldberg, A.; Aharonson-Daniel, L. The conjoint community resiliency assessment measure as a baseline for profiling and predicting community resilience for emergencies. Technol. Forecast. Soc. Chang. 2013, 80, 1732–1741. [Google Scholar] [CrossRef]
- Renschler, C.S.; Fraizer, A.E.; Arendt, L.A.; Cimellaro, G.-P.; Reinhorn, A.M.; Bruneau, M. A Framework for Defining and Measuring Resilience at the Community Scale: The PEOPLES Resilience Framework; NIST: Gaithersburg, MD, USA, 2010. [Google Scholar]
- Cox, R.S.; Hamlen, M. Community disaster resilience and the rural resilience index. Am. Behav. Sci. 2015, 59, 220–237. [Google Scholar] [CrossRef]
- Cutter, S.L.; Barnes, L.; Berry, M.; Burton, C.; Evans, E.; Tate, E.; Webb, J. A place-based model for understanding community resilience to natural disasters. Glob. Environ. Chang. 2008, 18, 598–606. [Google Scholar] [CrossRef]
- Mercy Corps. Pahal Program—Strategic Resilience Assessment (STRESS) Report; Mercy Corps: Portland, OR, USA, 2016. [Google Scholar]
- Ruszczyk, H.A. The Everyday and Events: Understanding Risk Perceptions and Resilience in Urban Nepal. Ph.D. Thesis, Durham University, Durham, UK, 2017. [Google Scholar]
- Ray, B. Response of a Resilient Community to Natural Disasters: The Gorkha Earthquake in Nepal, 2015. Prof. Geogr. 2017, 69, 644–654. [Google Scholar] [CrossRef]
- Mishra, A.; Ghate, R.; Maharjan, A.; Gurung, J.; Pathak, G.; Upraity, A.N. Building ex ante resilience of disaster-exposed mountain communities: Drawing insights from the Nepal earthquake recovery. Int. J. Disaster Risk Reduct. 2017, 22, 167–178. [Google Scholar] [CrossRef]
- Khazai, B.; Anhorn, J.; Burton, C.G. Resilience Performance Scorecard: Measuring urban disaster resilience at multiple levels of geography with case study application to Lalitpur, Nepal. Int. J. Disaster Risk Reduct. 2018, 31, 604–616. [Google Scholar] [CrossRef]
- Liu, W.; Dugar, S.; McCallum, I.; Thapa, G.; See, L.; Khadka, P.; Budhathoki, N.; Brown, S.; Mechler, R.; Fritz, S. Integrated participatory and collaborative risk mapping for enhancing disaster resilience. ISPRS Int. J. Geo-Inf. 2018, 7, 68. [Google Scholar] [CrossRef]
- Sudmeier, K.I.; Jaboyedoff, M.; Jaquet, S. Operationalizing resilience for disaster risk reduction in mountainous Nepal. Disaster Prev. Manag. 2013, 22, 366–377. [Google Scholar] [CrossRef]
- CBS. National Population and Housing Census 2011; Central Bureau of Statistics (CBS) and National Planning Commission: Kathmandu, Nepal, 2012. [Google Scholar]
- Aksha, S.K.; Juran, L.; Resler, L.M. Spatial and temporal analysis of natural hazard mortality in Nepal. Environ. Hazards 2018, 17, 163–179. [Google Scholar] [CrossRef]
- Aksha, S.K.; Juran, L.; Resler, L.M.; Zhang, Y. An Analysis of Social Vulnerability to Natural Hazards in Nepal Using a Modified Social Vulnerability Index. Int. J. Disaster Risk Sci. 2019, 10, 103–116. [Google Scholar] [CrossRef]
- Dahal, D.R.; Gurung, Y.B.; Acharya, B.; Hemchuri, K.; Swarnakar, D. Situation Analysis of Dalits in Nepal. In CARE Nepal; Save the Children US in Nepal, Contract No.: Part, I; Action-Aid Nepal: Kathmandu, Nepal, 2002. [Google Scholar]
- Maharjan, A.; de Campos, R.S.; Singh, C.; Das, S.; Srinivas, A.; Bhuiyan, M.R.A.; Ishaq, S.; Umar, M.A.; Dilshad, T.; Shrestha, K.; et al. Migration and Household Adaptation in Climate-Sensitive Hotspots in South Asia. Curr. Clim. Chang. Rep. 2020, 6, 1–16. [Google Scholar] [CrossRef]
- Vaidya, R.A.; Shrestha, M.S.; Nasab, N.; Gurung, D.R.; Kozo, N.; Pradhan, N.S.; Wasson, R.J. Disaster risk reduction and building resilience in the Hindu Kush Himalaya. In The Hindu Kush Himalaya Assessment; Springer: Berlin, Germany, 2019; pp. 389–419. [Google Scholar]
- Karki, R.; Schickhoff, U.; Scholten, T.; Böhner, J. Rising precipitation extremes across Nepal. Climate 2017, 5, 4. [Google Scholar] [CrossRef]
- Spss, I. IBM Corp. Released 2017. In IBM SPSS Statistics for Windows, Version 25.0; IBM Corp.: Armonk, NY, USA, 2017. [Google Scholar]
- Cutter, S.L.; Boruff, B.J.; Shirley, W.L. Social vulnerability to environmental hazards. Soc. Sci. Q. 2003, 84, 242–261. [Google Scholar] [CrossRef]
- Qin, W.; Lin, A.; Fang, J.; Wang, L.; Li, M. Spatial and temporal evolution of community resilience to natural hazards in the coastal areas of China. Nat. Hazards 2017, 89, 331–349. [Google Scholar] [CrossRef]
- Kaiser, H.F. An index of factorial simplicity. Psychometrika 1974, 39, 31–36. [Google Scholar] [CrossRef]
- Government of Nepal. Nepal Disaster Report 2017: The Road to Sendai; Government of Nepal, Ministry of Home Affairs: Kathmandu, Nepal, 2017.
- Government of Nepal. Nepal Disaster Report 2019; Government of Nepal, Ministry of Home Affairs: Kathmandu, Nepal, 2019.
- Sharma, P.; Guha-Khasnobis, B.; Khanal, D.R. Nepal Human Development Report 2014; National Planning Commission, Government of Nepal and United Nations Development Programme: Kathmandu, Nepal, 2014. [Google Scholar]
- Raj, K.G.C.; Ranganathan, S.; Hall, R.P. Does Rural Water System Design Matter? A Study of Productive Use of Water in Rural Nepal. Water 2019, 11, 1978. [Google Scholar]
- Baniya, R.; Shrestha, U.; Karn, M. Local and Community Well-Being through Community Based Tourism—A Study of Transformative Effect. J. Tour. Hosp. Educ. 2018, 8, 77–96. [Google Scholar] [CrossRef]
- Paudyal, R.; Thapa, B.; Neupane, S.S.; Kc, B. Factors Associated with Conservation Participation by Local Communities in Gaurishankar Conservation Area Project, Nepal. Sustainability 2018, 10, 3488. [Google Scholar] [CrossRef]
- Ruszczyk, H.A. Ambivalence towards discourse of disaster resilience. Disasters 2019, 43, 818–839. [Google Scholar] [CrossRef] [PubMed]
- Aksha, S.K. Assessing Vulnerability and Multi-Hazard Risk in the Nepal Himalaya. PhD Thesis, Virginia Tech, Blacksburg, VA, USA, 2018. [Google Scholar]
- Lockwood, M.; Raymond, C.; Oczkowski, E.; Morrison, M. Measuring the dimensions of adaptive capacity: A psychometric approach. Ecol. Soc. 2015, 20, 37. [Google Scholar] [CrossRef]


| Dates | Disaster Type | Death (Missing) | Injured | Estimated Damages (NPR Million) | Impacted Districts | |
|---|---|---|---|---|---|---|
| 1 | 2019-03-31 | Windstorm | 27 | 1122 | 90 | Bara, Parsa |
| 2 | 2017-08-14 | Flood | 134 | 22 | 60,716.6 * | 35 districts, 18 Tarai districts severely affected |
| 3 | 2016-07-26 | Landslide | 25 (1) | 7 | - | Pyuthan |
| 4 | 2015-07-30 | Landslide | 27 (1) | 3 | - | Kaski |
| 5 | 2015-06-12 | Landslide | 39 | 8 | - | Taplejung |
| 6 | 2015-04-25 | Earthquake | 8970 | 22,302 | 706,461 ** | 31 (out of 77) districts |
| 7 | 2014-10-14 | Snowstorm | 48 | - | - | Mustang (impact of HudHud cyclone) |
| 8 | 2014-08-14 | Flood | 34 (91) | 26 | 10,052 | Surkhet |
| 9 | 2014-08-14 | Flood | 14 (4) | 2 | 511.84 | Dang |
| 10 | 2014-08-13 | Flood | 33 (15) | 2 | 3775.4 | Bardiya |
| 11 | 2014-08-13 | Flood | 15 (5) | 2 | 480 | Banke |
| 12 | 2014-08-02 | Landslide | 33 (123) | 47 | 130.4 *** | Sindhupalchowk |
| 13 | 2014-04-18 | Avalanche | 13 (3) | 7 | - | Solukhumbu |
| 14 | 2012-09-30 | Landslide | 10 (4) | - | - | Ilam |
| 15 | 2012-09-23 | Avalanche | 9 (3) | 13 | - | Gorkha |
| 16 | 2012-05-05 | Flash Flood | 40 (32) | 5 | 11 | Kaski |
| 17 | 2011-09-18 | Earthquake | 6 | 30 | - | Eastern districts |
| 18 | 2008-08-18 | Flood | 55 | 2,350 | 3,773.6 **** | Sunsari (Koshi embankment breach) |
| Index/Model (Authors) | Type | Methodological Approach | Geographic Focus (Country, Study Area) | Domains & Number of Indicators | |
|---|---|---|---|---|---|
| 1 | Baseline Resilience Index for Communities (BRIC) (Cutter et al. 2010) [26] | Index | Disaster Resilience of Place (DROP) | United States, FEMA Region IV | Social (7), Economic (7), Institutional (8), Infrastructural (7), Community Capital (7) |
| 2 | Climate Disaster Resilience Index (CDRI) (Shaw & IDEM 2009) [33] | Index | Qualitative approach | Indonesia, Banda Aceh; Thailand, Bangkok; Sri Lanka, Colombo; Vietnam, Danang & Hue; Philippines, Iloilo & City of San Fernando; India, Mumbai; and Japan, Yokohama | Natural (2), Physical (8), Social (3), Economics (6), Institutional (4) |
| 3 | Coastal community resilience (CCR) (Courtney et al. 2008) [34] | Tool | Participatory process | Thailand, Sri Lanka, Indonesia, India, and the Maldives (Indian Ocean region) | Governance (4), Society and Economy (4), Coastal Resource Management (4), Land Use and Structural Design (4), Risk Knowledge (4), Warning and Evacuation (4), Emergency Response (4), Disaster Recovery (4) |
| 4 | Coastal Resilience Index (Sempier et al. 2010) [35] | Score card | - | USA, Gulf Coast | Community Capacities: Critical Infrastructure & Facilities, Transportation Issues, Community Plans & Agreements, Mitigation Measures, Business Plans, Social Systems |
| 5 | Communities Advancing Resilience Toolkit (CART) (Pfefferbaum et al. 2013) [36] | Tool | Qualitative, participatory approach | Individual Communities (not specified) | Connection and Caring (8), Resources (6), Transformative potential (1), Disaster Management (4) |
| 6 | Community Disaster Resilience Index (CDRI) (Yoon et al. 2015) [25] | Index | Statistical approach, factor analysis | South Korea, 229 local municipalities | Human (5), Social (3), Economic (3), Institutional (5), Physical (4), Environmental (4) |
| 7 | Community Disaster Resilience Index (Mayunga 2007) [37] | Index | Theoretical Framework Matrix | USA, Texas | Social Capital (3), Economic Capital (3), Human Capital (4), Physical Capital (3), Natural Capital (3) |
| 8 | Community Resilience Index (Kafle 2012) [27] | Index | Statistical approach | Indonesia, Aceh | Process (10), Outcome (25) |
| 9 | Community-Based Resilience Analysis (CoBRA) (UNDP 2014) [38] | Tool | Participatory qualitative approaches | Kenya and Uganda | Community Characteristics |
| 10 | Conjoint Community Resilience Assessment Measurement (CCRAM) (Cohen et al. 2013) [39] | Tool | Literature reviews and DELPHI | Israel, 9 towns | Community Capacities: Leadership, collective efficacy, preparedness, place attachment, social trust, social relationship |
| 11 | Modified BRIC (Siebeneck et al. 2015) [6] | Index | Statistical approach, factor analysis | Thailand, 76 provinces | Social (6), Economic (3), Institutional (11), Community (5) |
| 12 | PEOPLES (Reneschier et al. 2010) [40] | Tool | MCEER | USA, New York | Population and Demographics (3), Environmental/Ecosystem (6), Organized Governmental Services (3), Physical Infrastructure (2), Lifestyle & Community Competence (3), Economic Development (3), Social-Cultural Capital (7) |
| 13 | Rural Resilience Index (RRI) (Cox & Halmen 2015) [41] | Index | Participatory action research | Canada, British Columbia | Social Fabric, Community Resources, Disaster Management |
| Resilience Concept (VARIABLE NAME) | Variable Description | Data Source | Impact on Resilience |
|---|---|---|---|
| Social resilience | |||
| Pre-retirement age (PAGE65) | % pop below 65 years of age | Census 2011 | Positive |
| Transportation (PVEHICLE) | % households with at least one vehicle | Census 2011 | Positive |
| Communication capacity (PPHONE) | % households with telephone service available | Census 2011 | Positive |
| Information access (PRADIO) | % of household with access to a radio | Census 2011 | Positive |
| Language competency (PNEPALI) | % pop proficient Nepali speakers | Census 2011 | Positive |
| Non-special needs (PNODIS) | % pop without sensor, physical, or mental disability | Census 2011 | Positive |
| Education (PBSLC) | % pop without school degree (School leaving certificate (SLC) education) | Census 2011 | Negative |
| Female-headed households (PFEMHH) | % female-headed households | Census 2011 | Negative |
| Caste (PDALIT) | % Dalit population | Census 2011 | Negative |
| Economic resilience | |||
| Homeownership (POWNHH) | % owner-occupied housing units | Census 2011 | Positive |
| Employment rate (PEMPLOY) | % labor force employed | Census 2011 | Positive |
| Non-dependence on primary sectors (PNOAGRI) | % pop not employed in farming, fishing, forestry, and extractive industries | Census 2011 | Positive |
| Employment (PFEMEMPLOY) | % female labor force participation | Census 2011 | Negative |
| Community Capital | |||
| Place attachment (PSAMEDIS) | % pop born in the same place | Census 2011 | Positive |
| 5-yr migration (PMIGRATED) | % pop who migrated within previous 5 years | Census 2011 | Negative |
| Absentee population (PABSENTPOP) | % pop who are working outside of the country | Census 2011 | Negative |
| Infrastructure Resilience | |||
| Sturdier housing types (PRCC) | % housing units with reinforced cement concrete (RCC) foundation | Census 2011 | Positive |
| Internet Infrastructure (PINTERNET) | % of households with internet access | Census 2011 | Positive |
| Cooking capabilities (PHHGASELEC) | % of households with gas and/or electric cooking capabilities | Census 2011 | Positive |
| Environmental resilience | |||
| Rainy days (PRAINYDAY) | Average no. of rainy days | Karki, Schickhoff [56] | Negative |
| Elevation (AVGELEV) | Average elevation | ASTER GDEM | Negative |
| Pervious surfaces (PPERVIOUS) | Average % perviousness | ICIMOD 2011 | Positive |
| Component | Loaded Variables | Factor Loadings | Component Theme | % of Variance |
|---|---|---|---|---|
| 1 | PRCC | 0.840 | Infrastructure | 26.05 |
| PINTERNET | 0.837 | |||
| PNOAGRI | 0.703 | |||
| PPHONE | 0.539 | |||
| PBSLC | -0.704 | |||
| PSAMEDIS | -0.752 | |||
| POWNHH | -0.817 | |||
| 2 | PFEMEMPLOY | 0.840 | Economic-Social | 18.72 |
| PEMPLOY | 0.796 | |||
| PNEPALI | 0.655 | |||
| AVGRAINY | 0.633 | |||
| AVGELEV | 0.591 | |||
| PRADIO | 0.506 | |||
| PNODIS | -0.568 | |||
| PVEHICLE | -0.748 | |||
| 3 | PABSENTPOP | 0.805 | Community Capital | 8.94 |
| PFEMHH | 0.767 | |||
| PPHONE | 0.552 | |||
| PAGE65 | -0.639 | |||
| 4 | AVGELEV | 0.664 | Environmental | 5.56 |
| PPERVIOUS | -0.789 | |||
| 5 | PDALIT | 0.842 | Caste | 5.01 |
| 6 | PMIGRATED | 0.989 | Migration | 4.77 |
| Total | 69.05 | |||
| Eco-Region | Total Number of Districts | Total Number of VDCs | Number (and %) of VDCs in Each CDRI Categories | ||||
|---|---|---|---|---|---|---|---|
| High | High-Medium | Medium | Medium-Low | Low | |||
| Mountain | 16 | 544 | 31 (5.7%) | 114 (20.9%) | 319 (58.6%) | 79 (14.5%%) | 1 (0.2%) |
| Hill | 39 | 2033 | 200 (9.8%) | 603 (29.7%) | 937 (46.1%) | 290 (14.3%) | 3 (0.1%) |
| Tarai | 20 | 1394 | 7 (0.5%) | 87 (6.2%) | 459 (32.9%) | 703 (50.4%) | 138 (9.9%) |
| District | Total VDCs | % of VDCs in each category of DRI | Total Population Census 2011 | % population in each category of DRI | |||||||||
|---|---|---|---|---|---|---|---|---|---|---|---|---|---|
| High | High-Medium | Medium | Medium-Low | Low | High | High-Medium | Medium | Medium-Low | Low | ||||
| 1 | Taplejung | 50 | 6.00% | 24.00% | 68.00% | 2.00% | - | 126,448 | 2.51% | 35.14% | 60.74% | 1.61% | - |
| 2 | Panchthar | 41 | - | 9.76% | 90.24% | - | - | 190,491 | - | 16.30% | 83.70% | - | - |
| 3 | Ilam | 49 | - | 4.08% | 77.55% | 18.37% | - | 287,932 | - | 7.73% | 74.74% | 17.53% | - |
| 4 | Jhapa | 50 | 4.00% | 14.00% | 50.00% | 32.00% | - | 807,934 | 7.53% | 28.25% | 47.09% | 17.12% | - |
| 5 | Morang | 66 | 1.52% | 12.12% | 46.97% | 37.88% | 1.52% | 959,568 | 0.59% | 15.53% | 59.05% | 23.98% | 0.85% |
| 6 | Sunsari | 52 | 3.85% | 3.85% | 50.00% | 40.38% | 1.92% | 753,244 | 18.80% | 13.67% | 41.37% | 24.96% | 1.20% |
| 7 | Dhankuta | 36 | - | 5.56% | 83.33% | 11.11% | - | 161,398 | - | 19.36% | 67.95% | 12.69% | - |
| 8 | Terhathum | 32 | - | 21.88% | 71.88% | 6.25% | - | 100,833 | - | 24.68% | 70.12% | 5.19% | - |
| 9 | Sankhuwasabha | 34 | 5.88% | 2.94% | 70.59% | 17.65% | 2.94% | 158,222 | 7.05% | 16.62% | 64.38% | 11.72% | 0.23% |
| 10 | Bhojpur | 63 | - | 6.35% | 74.60% | 19.05% | - | 181,225 | - | 9.30% | 72.13% | 18.57% | - |
| 11 | Solukhumbu | 34 | 5.88% | 23.53% | 58.82% | 11.76% | - | 105,119 | 5.35% | 21.56% | 58.68% | 14.41% | - |
| 12 | Khotang | 76 | 1.32% | 6.58% | 75.00% | 17.11% | - | 205,225 | 0.81% | 4.65% | 77.70% | 16.84% | - |
| 13 | Okhaldhunga | 56 | - | 3.57% | 76.79% | 19.64% | - | 146,824 | - | 5.22% | 75.33% | 19.44% | - |
| 14 | Udayapur | 45 | - | - | 55.56% | 44.44% | - | 315,429 | - | - | 76.84% | 23.16% | - |
| 15 | Saptari | 115 | - | 0.87% | 53.04% | 46.09% | - | 637,844 | - | 0.96% | 56.47% | 42.57% | - |
| 16 | Siraha | 108 | - | 4.63% | 57.41% | 37.96% | - | 635,627 | - | 6.61% | 58.73% | 34.66% | - |
| 17 | Dhanusa | 102 | - | 9.80% | 54.90% | 34.31% | 0.98% | 753,682 | - | 21.39% | 47.93% | 29.75% | 0.93% |
| 18 | Mahottari | 77 | - | 1.30% | 35.06% | 61.04% | 2.60% | 625,207 | - | 1.07% | 35.23% | 61.45% | 2.25% |
| 19 | Sarlahi | 100 | - | 1.00% | 5.00% | 72.00% | 22.00% | 769,330 | - | 1.33% | 7.73% | 73.99% | 16.95% |
| 20 | Sindhuli | 54 | - | 1.85% | 42.59% | 55.56% | - | 293,173 | - | 13.44% | 37.11% | 49.45% | - |
| 21 | Ramechhap | 55 | - | 5.45% | 76.36% | 18.18% | - | 201,423 | - | 7.67% | 72.67% | 19.66% | - |
| 22 | Dolakha | 52 | 5.77% | 15.38% | 71.15% | 7.69% | - | 185,099 | 5.45% | 23.39% | 65.70% | 5.46% | - |
| 23 | Sindhupalchok | 79 | 2.53% | 11.39% | 69.62% | 16.46% | - | 285,770 | 3.45% | 13.96% | 66.30% | 16.29% | - |
| 24 | Kavrepalanchok | 90 | 1.11% | 3.33% | 45.56% | 50.00% | - | 375,221 | 6.60% | 5.98% | 46.39% | 41.03% | - |
| 25 | Lalitpur | 42 | 23.81% | 16.67% | 35.71% | 23.81% | - | 457,606 | 72.04% | 13.19% | 10.35% | 4.42% | - |
| 26 | Bhaktapur | 18 | 44.44% | 16.67% | 38.89% | 0.00% | - | 298,704 | 77.82% | 7.01% | 15.17% | - | - |
| 27 | Kathmandu | 59 | 54.24% | 16.95% | 27.12% | 1.69% | - | 1,699,289 | 92.52% | 3.45% | 3.77% | 0.27% | - |
| 28 | Nuwakot | 62 | - | 4.84% | 43.55% | 50.00% | 1.61% | 275,775 | - | 11.75% | 42.33% | 45.02% | 0.90% |
| 29 | Rasuwa | 18 | - | 22.22% | 72.22% | 5.56% | - | 42,133 | - | 17.42% | 77.43% | 5.15% | - |
| 30 | Dhading | 50 | 2.00% | 12.00% | 64.00% | 22.00% | - | 334,292 | 6.04% | 11.07% | 61.15% | 21.75% | - |
| 31 | Makwanpur | 44 | 2.27% | - | 25.00% | 68.18% | 4.55% | 415,601 | 20.37% | - | 27.77% | 49.56% | 2.29% |
| 32 | Rautahat | 97 | - | - | 2.06% | 62.89% | 35.05% | 686,059 | - | - | 0.58% | 68.95% | 30.47% |
| 33 | Bara | 99 | - | - | 7.07% | 60.61% | 32.32% | 685,831 | - | - | 8.14% | 65.55% | 26.30% |
| 34 | Parsa | 83 | - | 1.20% | 7.23% | 68.67% | 22.89% | 597,769 | - | 0.58% | 26.87% | 55.08% | 17.47% |
| 35 | Chitawan | 38 | 2.63% | 39.47% | 36.84% | 13.16% | 7.89% | 569,732 | 25.25% | 38.75% | 27.92% | 5.55% | 2.53% |
| 36 | Gorkha | 67 | 8.96% | 31.34% | 47.76% | 11.94% | - | 268,942 | 19.63% | 28.50% | 45.76% | 6.10% | - |
| 37 | Lamjung | 61 | 24.59% | 50.82% | 21.31% | 3.28% | - | 166,150 | 36.90% | 43.65% | 17.12% | 2.33% | - |
| 38 | Manang | 13 | - | 15.38% | 61.54% | 15.38% | - | 5,553 | - | 27.12% | 65.08% | 7.80% | - |
| 39 | Kaski | 45 | 26.67% | 64.44% | 8.89% | - | - | 480,952 | 74.60% | 23.48% | 1.92% | - | - |
| 40 | Tanahu | 47 | 34.04% | 48.94% | 17.02% | - | - | 320,547 | 45.50% | 42.99% | 11.51% | - | - |
| 41 | Syangja | 62 | 12.90% | 59.68% | 27.42% | - | - | 288,100 | 16.96% | 61.62% | 21.42% | - | - |
| 42 | Parbat | 55 | 25.45% | 63.64% | 10.91% | - | - | 145,667 | 32.26% | 59.60% | 8.14% | - | - |
| 43 | Baglung | 60 | 50.00% | 50.00% | - | - | - | 266,630 | 53.56% | 46.44% | - | - | - |
| 44 | Myagdi | 41 | 34.15% | 58.54% | 4.88% | - | - | 109,606 | 43.02% | 54.64% | 2.34% | - | - |
| 45 | Mustang | 16 | 12.50% | 37.50% | 31.25% | 18.75% | - | 11,593 | 12.40% | 52.34% | 19.54% | 15.72% | - |
| 46 | Palpa | 66 | 1.52% | 37.88% | 53.03% | 7.58% | - | 258,893 | 11.24% | 37.62% | 44.01% | 7.13% | - |
| 47 | Nawalparasi | 74 | - | 14.86% | 43.24% | 41.89% | - | 638,954 | - | 25.72% | 45.52% | 28.75% | - |
| 48 | Rupandehi | 71 | 1.41% | 11.27% | 16.90% | 61.97% | 8.45% | 874,566 | 13.55% | 24.08% | 15.82% | 39.63% | 6.93% |
| 49 | Kapilbastu | 78 | - | 2.56% | 26.92% | 67.95% | 2.56% | 569,834 | - | 3.54% | 32.91% | 61.42% | 2.12% |
| 50 | Arghakhanchi | 42 | 9.52% | 73.81% | 16.67% | - | - | 196,895 | 13.29% | 66.20% | 20.51% | - | - |
| 51 | Gulmi | 79 | 5.06% | 81.01% | 13.92% | - | - | 279,005 | 8.14% | 78.43% | 13.43% | - | - |
| 52 | Rukum | 43 | 4.65% | 20.93% | 69.77% | 4.65% | - | 207,290 | 2.19% | 20.95% | 73.62% | 3.24% | - |
| 53 | Salyan | 47 | - | 6.38% | 74.47% | 19.15% | - | 241,716 | - | 7.30% | 73.55% | 19.15% | - |
| 54 | Rolpa | 51 | - | 29.41% | 68.63% | 1.96% | - | 221,177 | - | 28.71% | 69.26% | 2.02% | - |
| 55 | Pyuthan | 49 | 18.37% | 67.35% | 14.29% | - | - | 226,796 | 20.86% | 67.06% | 12.08% | - | - |
| 56 | Dang | 41 | - | 17.07% | 48.78% | 34.15% | - | 548,141 | - | 25.38% | 42.19% | 32.42% | - |
| 57 | Banke | 47 | - | 8.51% | 29.79% | 44.68% | 17.02% | 485,164 | - | 21.17% | 35.72% | 30.42% | 12.69% |
| 58 | Bardiya | 32 | - | - | 28.13% | 68.75% | 3.13% | 423,611 | - | - | 28.79% | 69.20% | 2.01% |
| 59 | Surkhet | 51 | 5.88% | 37.25% | 47.06% | 9.80% | - | 343,318 | 7.57% | 42.73% | 45.49% | 4.21% | - |
| 60 | Jajarkot | 30 | 3.33% | 30.00% | 60.00% | 6.67% | - | 170,106 | 1.43% | 24.58% | 69.79% | 4.21% | - |
| 61 | Dailekh | 56 | - | 32.14% | 62.50% | 5.36% | - | 260,855 | - | 31.12% | 64.54% | 4.35% | - |
| 62 | Dolpa | 23 | 21.74% | 43.48% | 17.39% | 17.39% | - | 36,128 | 20.03% | 52.18% | 14.09% | 13.70% | - |
| 63 | Jumla | 30 | 13.33% | 30.00% | 36.67% | 20.00% | - | 107,495 | 9.92% | 36.33% | 35.06% | 18.69% | - |
| 64 | Kalikot | 30 | - | 23.33% | 66.67% | 10.00% | - | 136,587 | - | 26.12% | 66.49% | 7.39% | - |
| 65 | Mugu | 24 | 8.33% | 12.50% | 58.33% | 20.83% | - | 54,832 | 4.48% | 14.81% | 69.40% | 11.32% | - |
| 66 | Humla | 27 | 7.41% | 18.52% | 55.56% | 18.52% | - | 49,933 | 11.83% | 24.19% | 50.00% | 13.99% | - |
| 67 | Bajhang | 47 | 4.26% | 27.66% | 48.94% | 19.15% | - | 194,701 | 3.54% | 25.83% | 47.54% | 23.08% | - |
| 68 | Bajura | 27 | 7.41% | 40.74% | 44.44% | 7.41% | - | 134,154 | 9.43% | 40.66% | 44.57% | 5.34% | - |
| 69 | Achham | 75 | 5.33% | 60.00% | 33.33% | 1.33% | - | 256,188 | 2.84% | 61.90% | 33.44% | 1.82% | - |
| 70 | Doti | 51 | 5.88% | 50.98% | 41.18% | 1.96% | - | 207,070 | 6.81% | 54.35% | 37.37% | 1.47% | - |
| 71 | Kailali | 44 | - | 4.55% | 38.64% | 45.45% | 11.36% | 766,659 | - | 7.44% | 54.05% | 32.10% | 6.41% |
| 72 | Kanchanpur | 20 | - | 10.00% | 60.00% | 25.00% | 5.00% | 448,503 | - | 7.61% | 73.72% | 17.06% | 1.62% |
| 73 | Dadeldhura | 21 | - | 33.33% | 57.14% | 9.52% | - | 141,004 | - | 32.29% | 60.83% | 6.88% | - |
| 74 | Baitadi | 63 | - | 11.11% | 73.02% | 15.87% | - | 250,225 | - | 15.63% | 66.68% | 17.70% | - |
| 75 | Darchula | 41 | - | 14.63% | 58.54% | 26.83% | - | 132,484 | - | 17.63% | 55.41% | 26.96% | - |
© 2020 by the authors. Licensee MDPI, Basel, Switzerland. This article is an open access article distributed under the terms and conditions of the Creative Commons Attribution (CC BY) license (http://creativecommons.org/licenses/by/4.0/).
Share and Cite
Aksha, S.K.; Emrich, C.T. Benchmarking Community Disaster Resilience in Nepal. Int. J. Environ. Res. Public Health 2020, 17, 1985. https://doi.org/10.3390/ijerph17061985
Aksha SK, Emrich CT. Benchmarking Community Disaster Resilience in Nepal. International Journal of Environmental Research and Public Health. 2020; 17(6):1985. https://doi.org/10.3390/ijerph17061985
Chicago/Turabian StyleAksha, Sanam K., and Christopher T. Emrich. 2020. "Benchmarking Community Disaster Resilience in Nepal" International Journal of Environmental Research and Public Health 17, no. 6: 1985. https://doi.org/10.3390/ijerph17061985
APA StyleAksha, S. K., & Emrich, C. T. (2020). Benchmarking Community Disaster Resilience in Nepal. International Journal of Environmental Research and Public Health, 17(6), 1985. https://doi.org/10.3390/ijerph17061985