Georeferencing of Personal Exposure to Radiofrequency Electromagnetic Fields from Wi-Fi in a University Area

 ,
,  , , , and
Abstract
1. Introduction
2. Methods
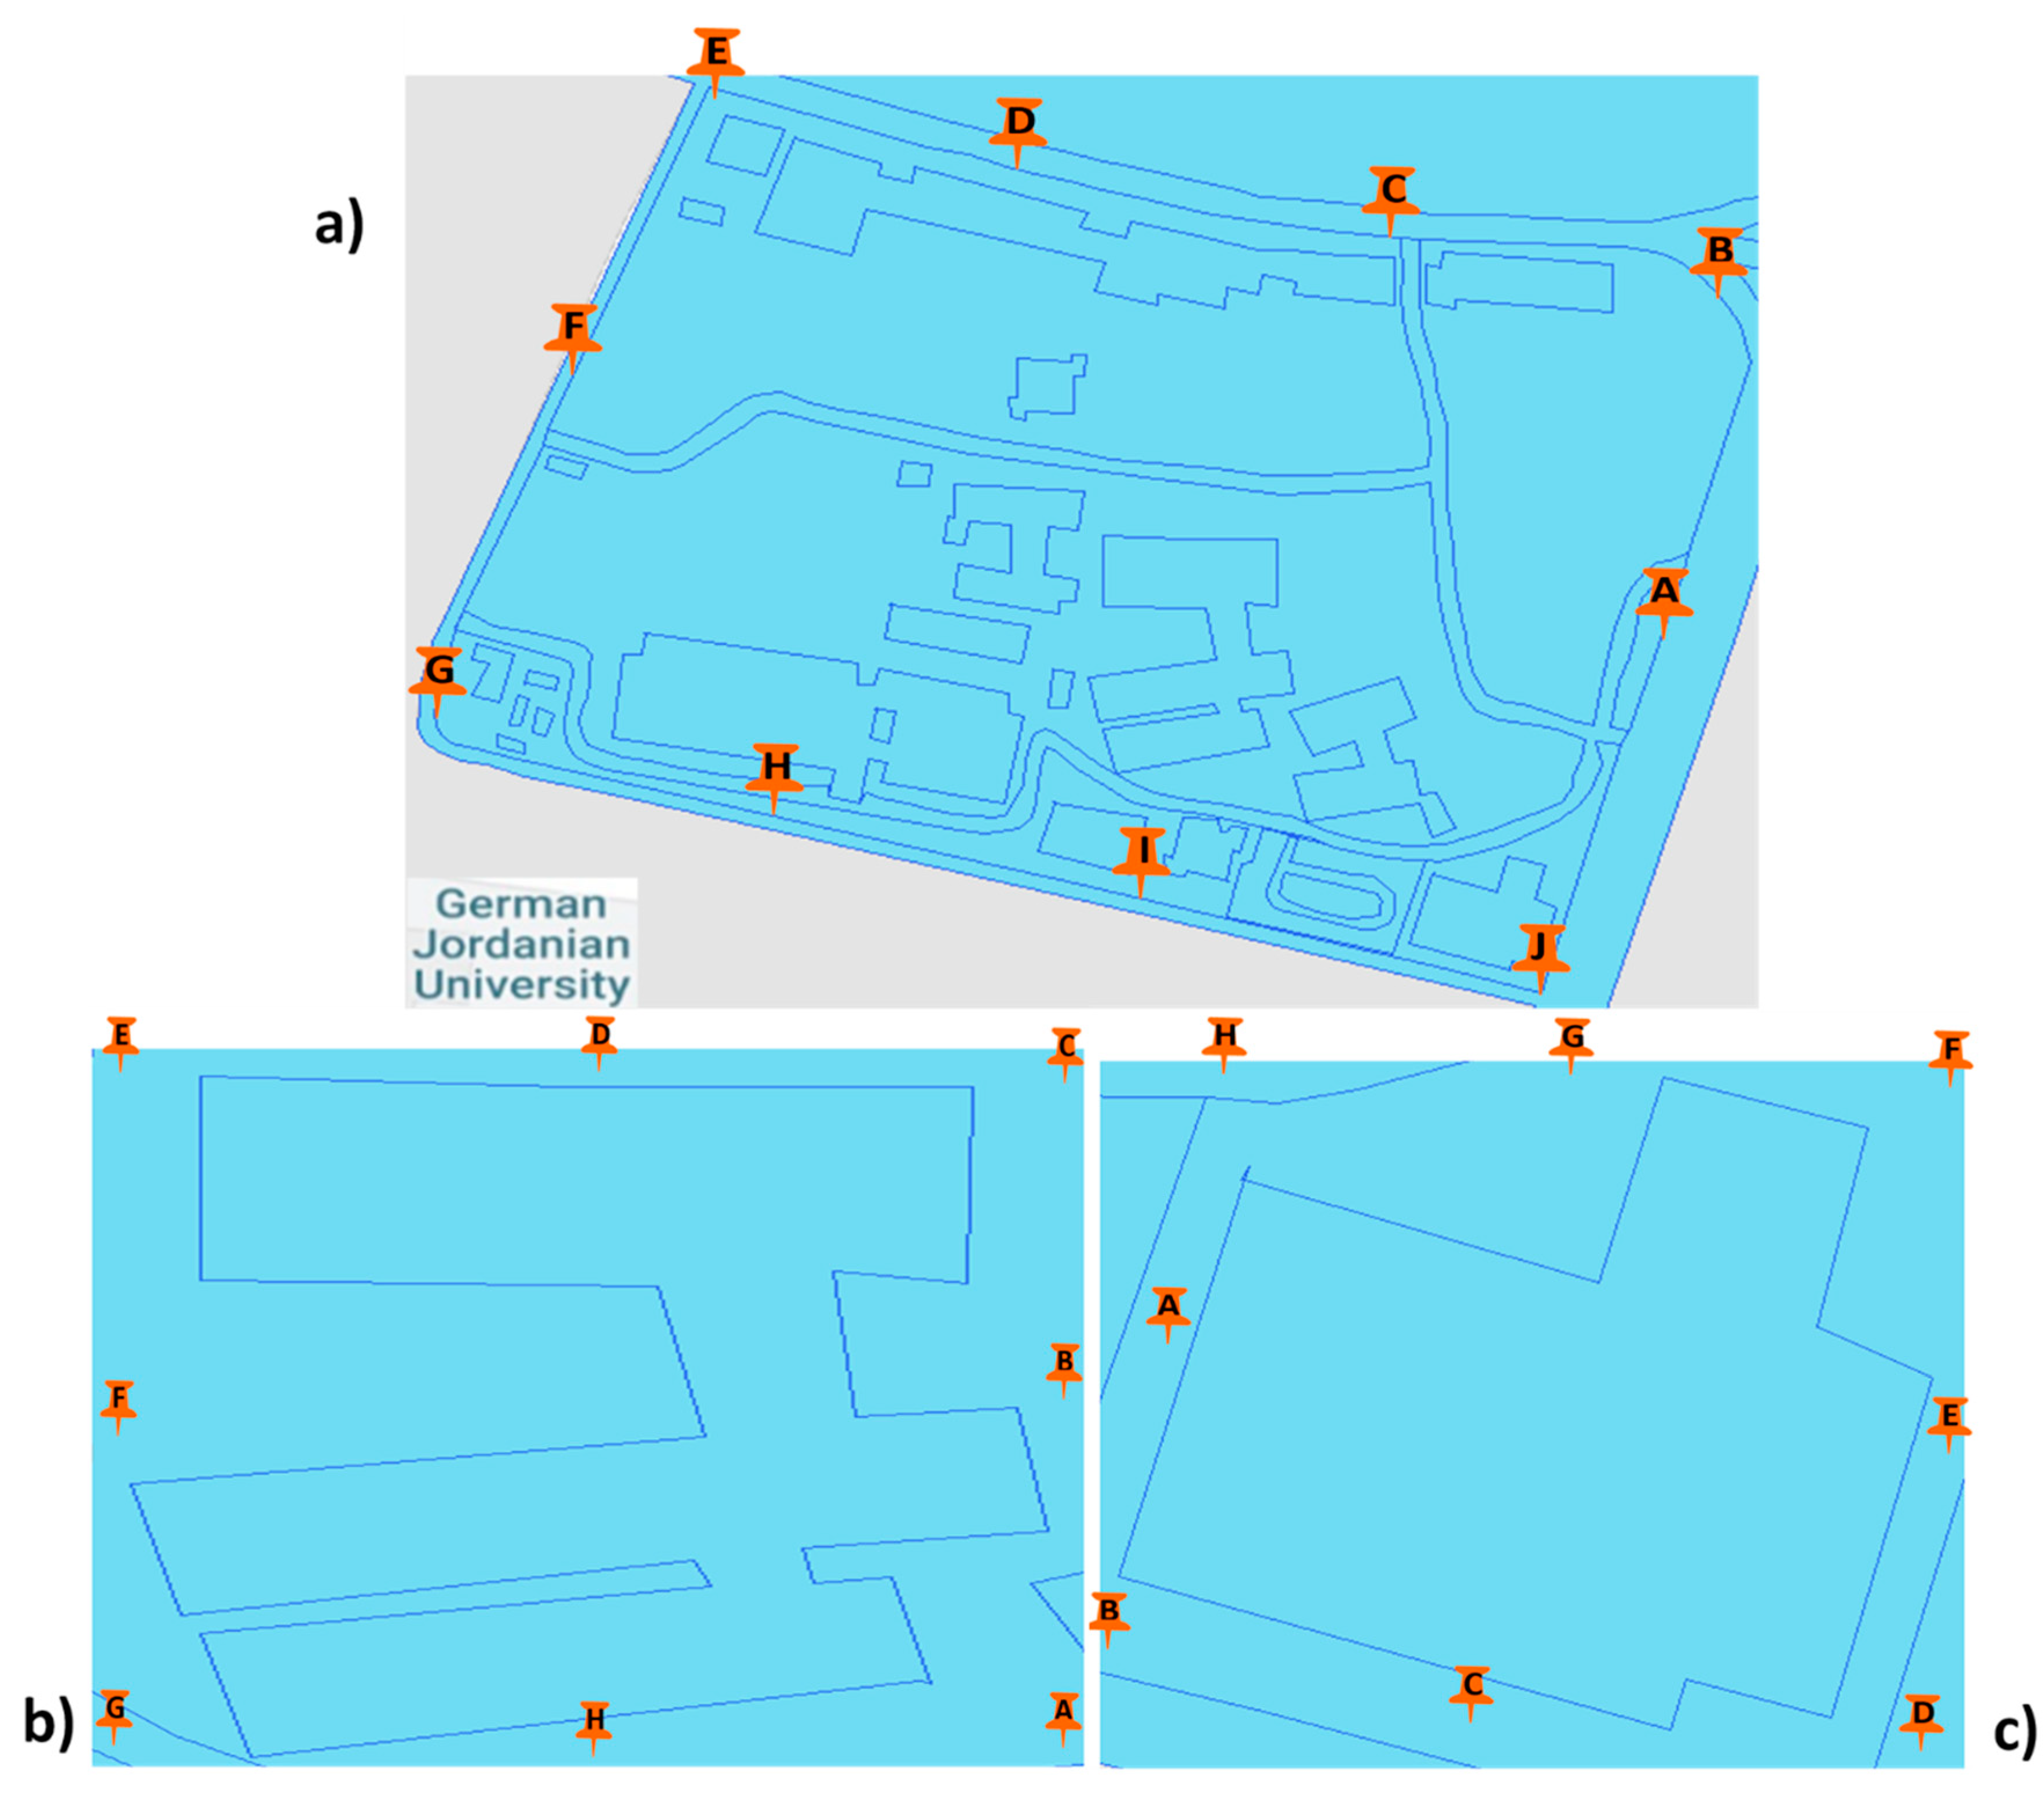
2.1. Study Area
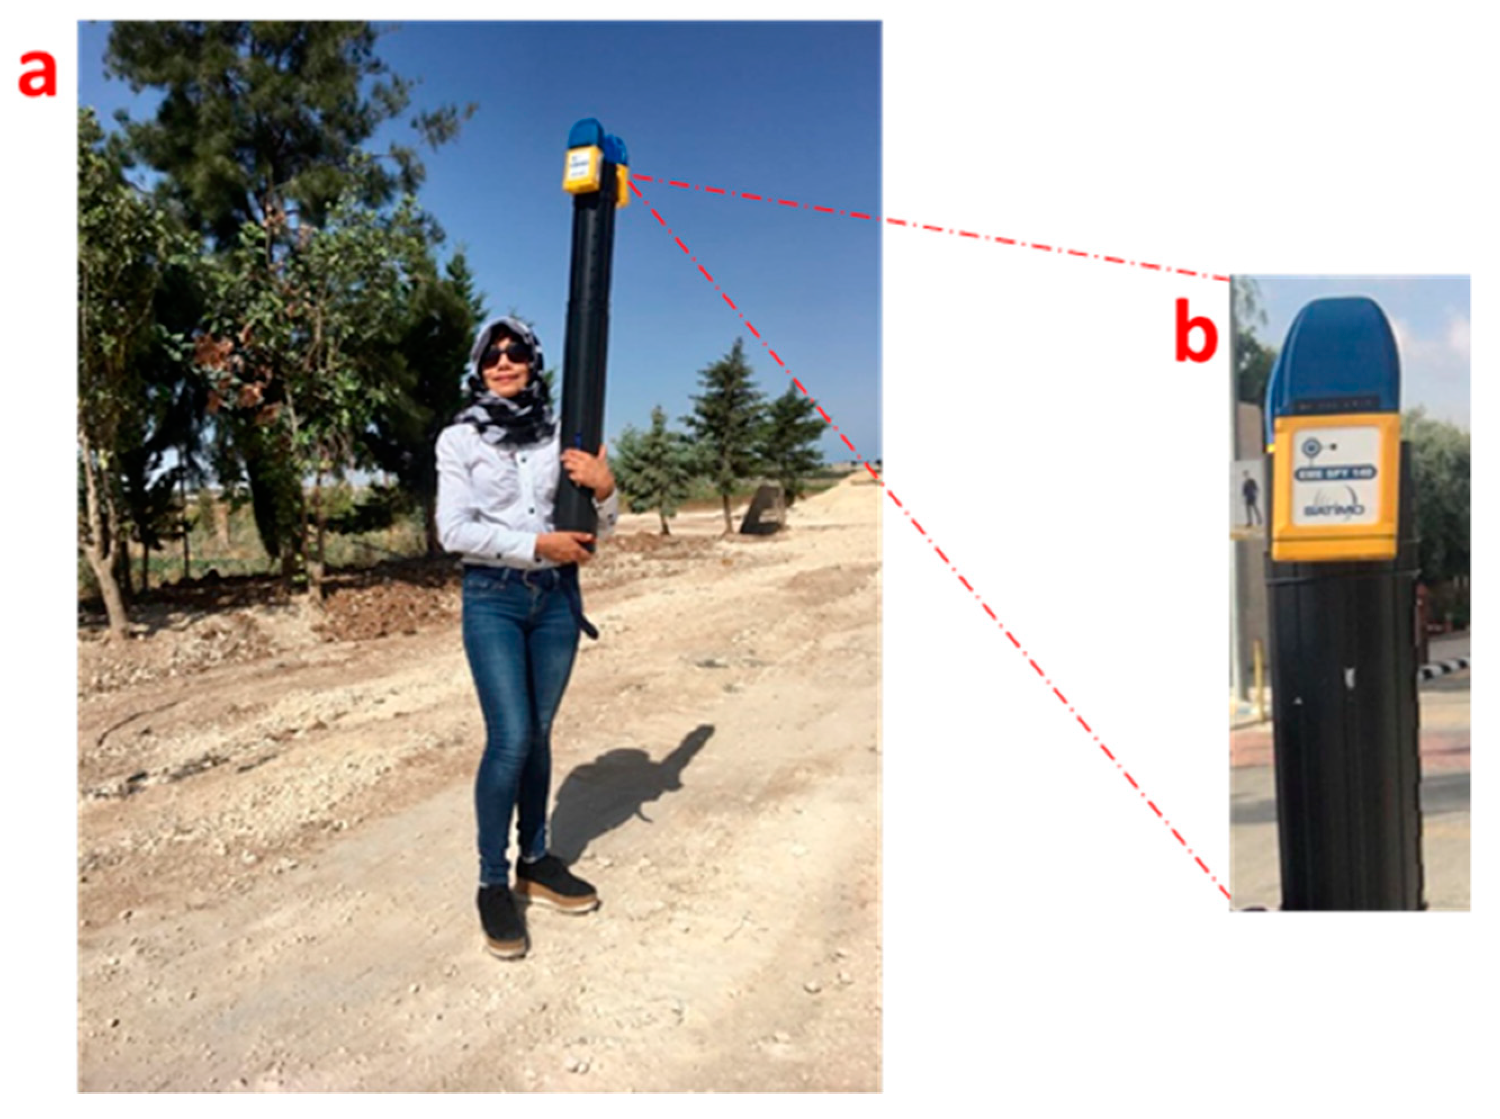
2.2. Exposimeter Measurements
2.3. Measurements Protocol
2.4. Analysis of the Measurements and Exposure Maps
3. Results
3.1. Measurements
3.2. Temporal Measurement of Personal Exposure to RF-EMF
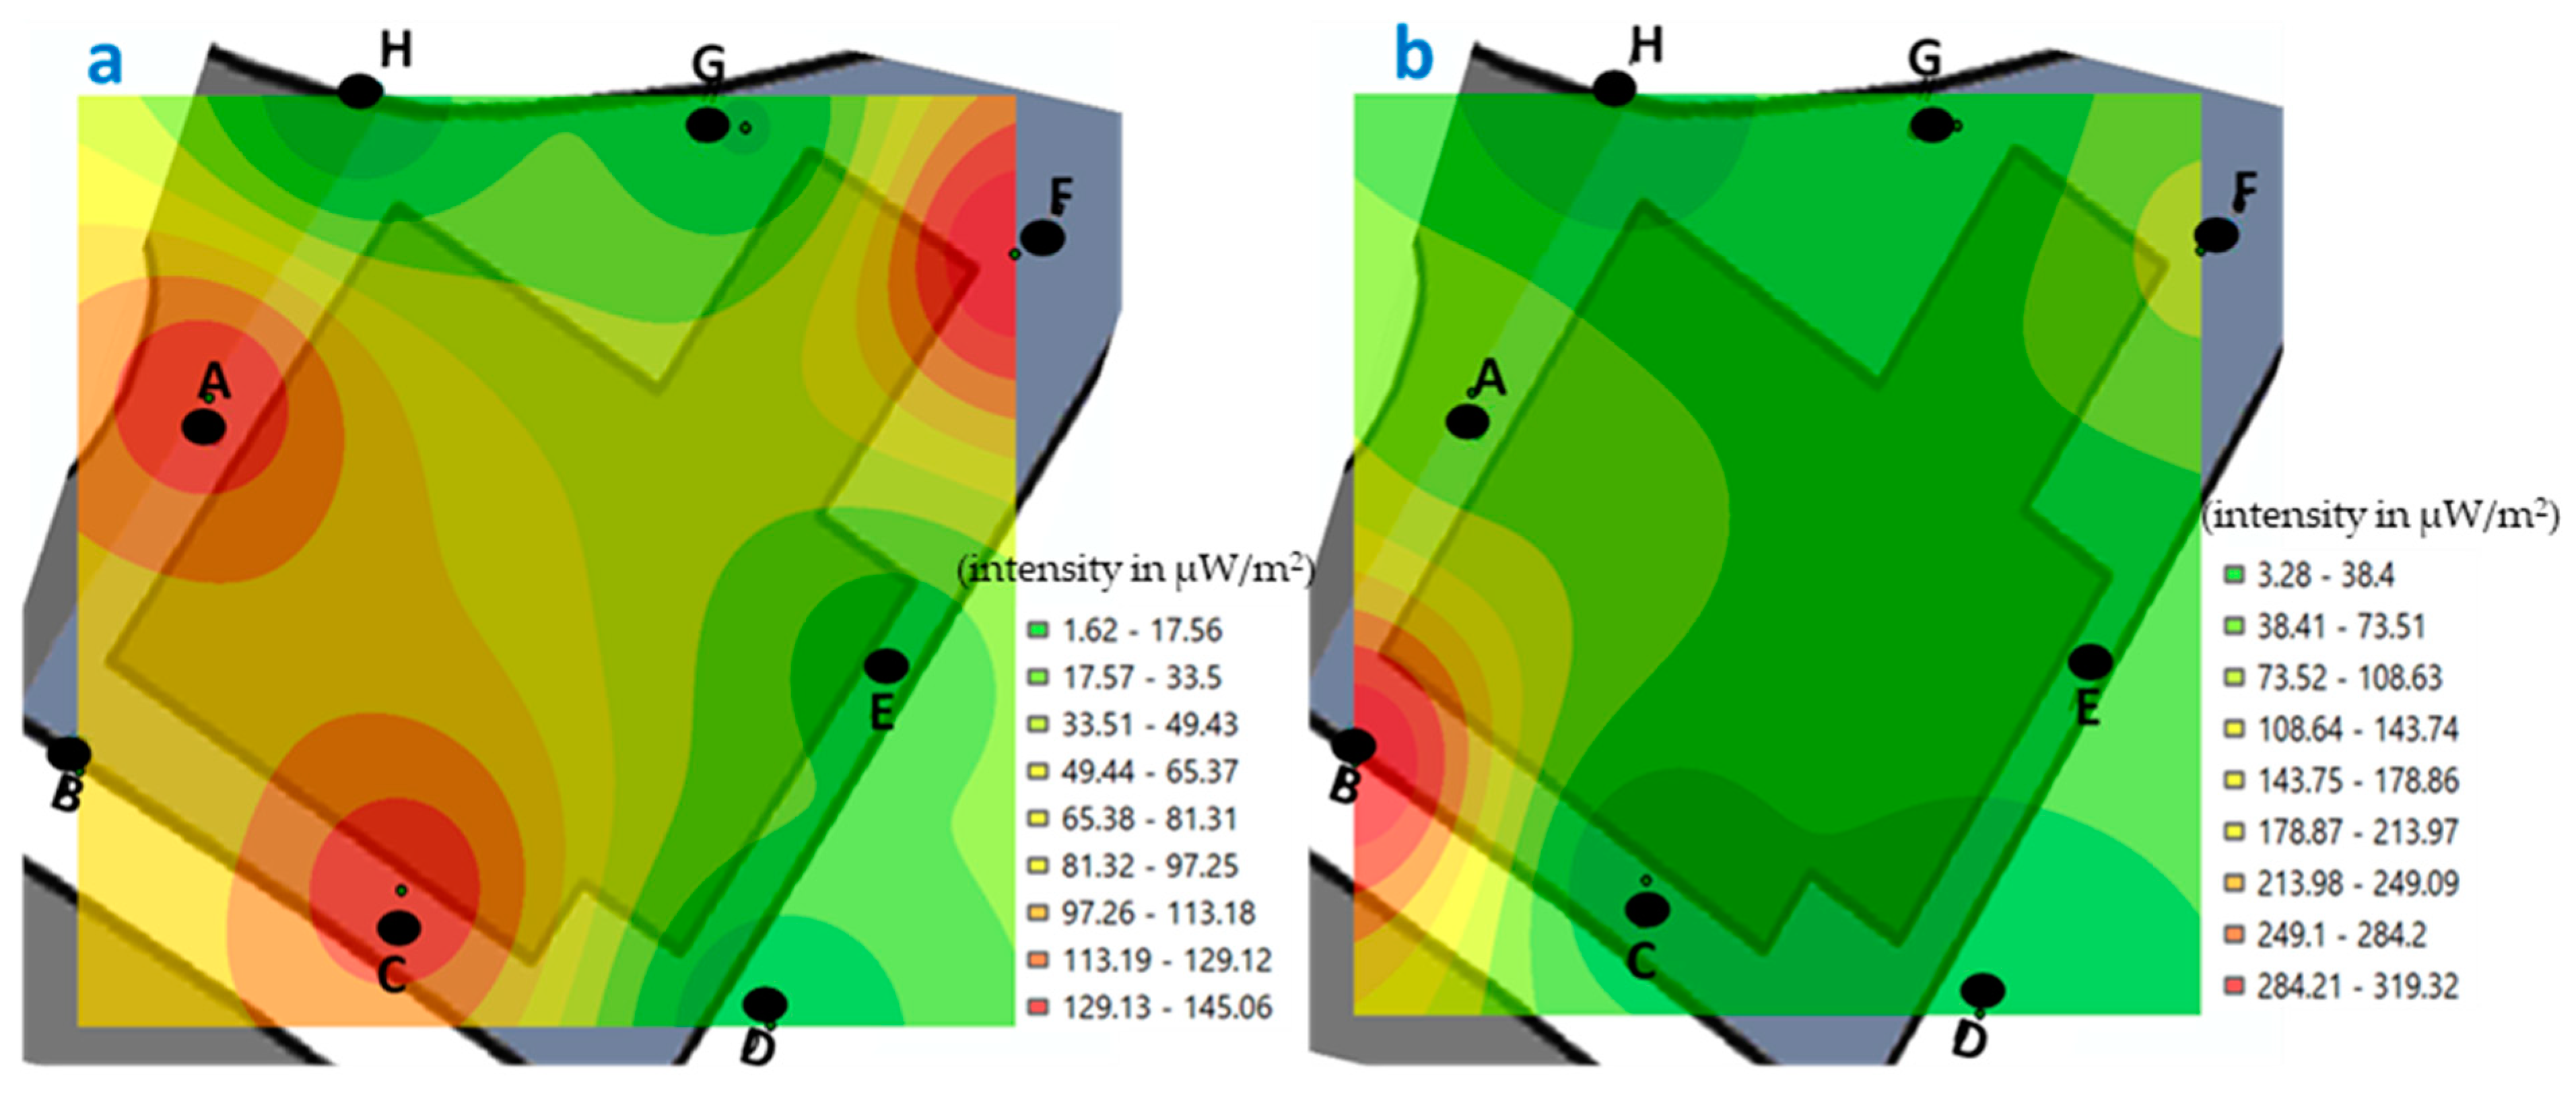
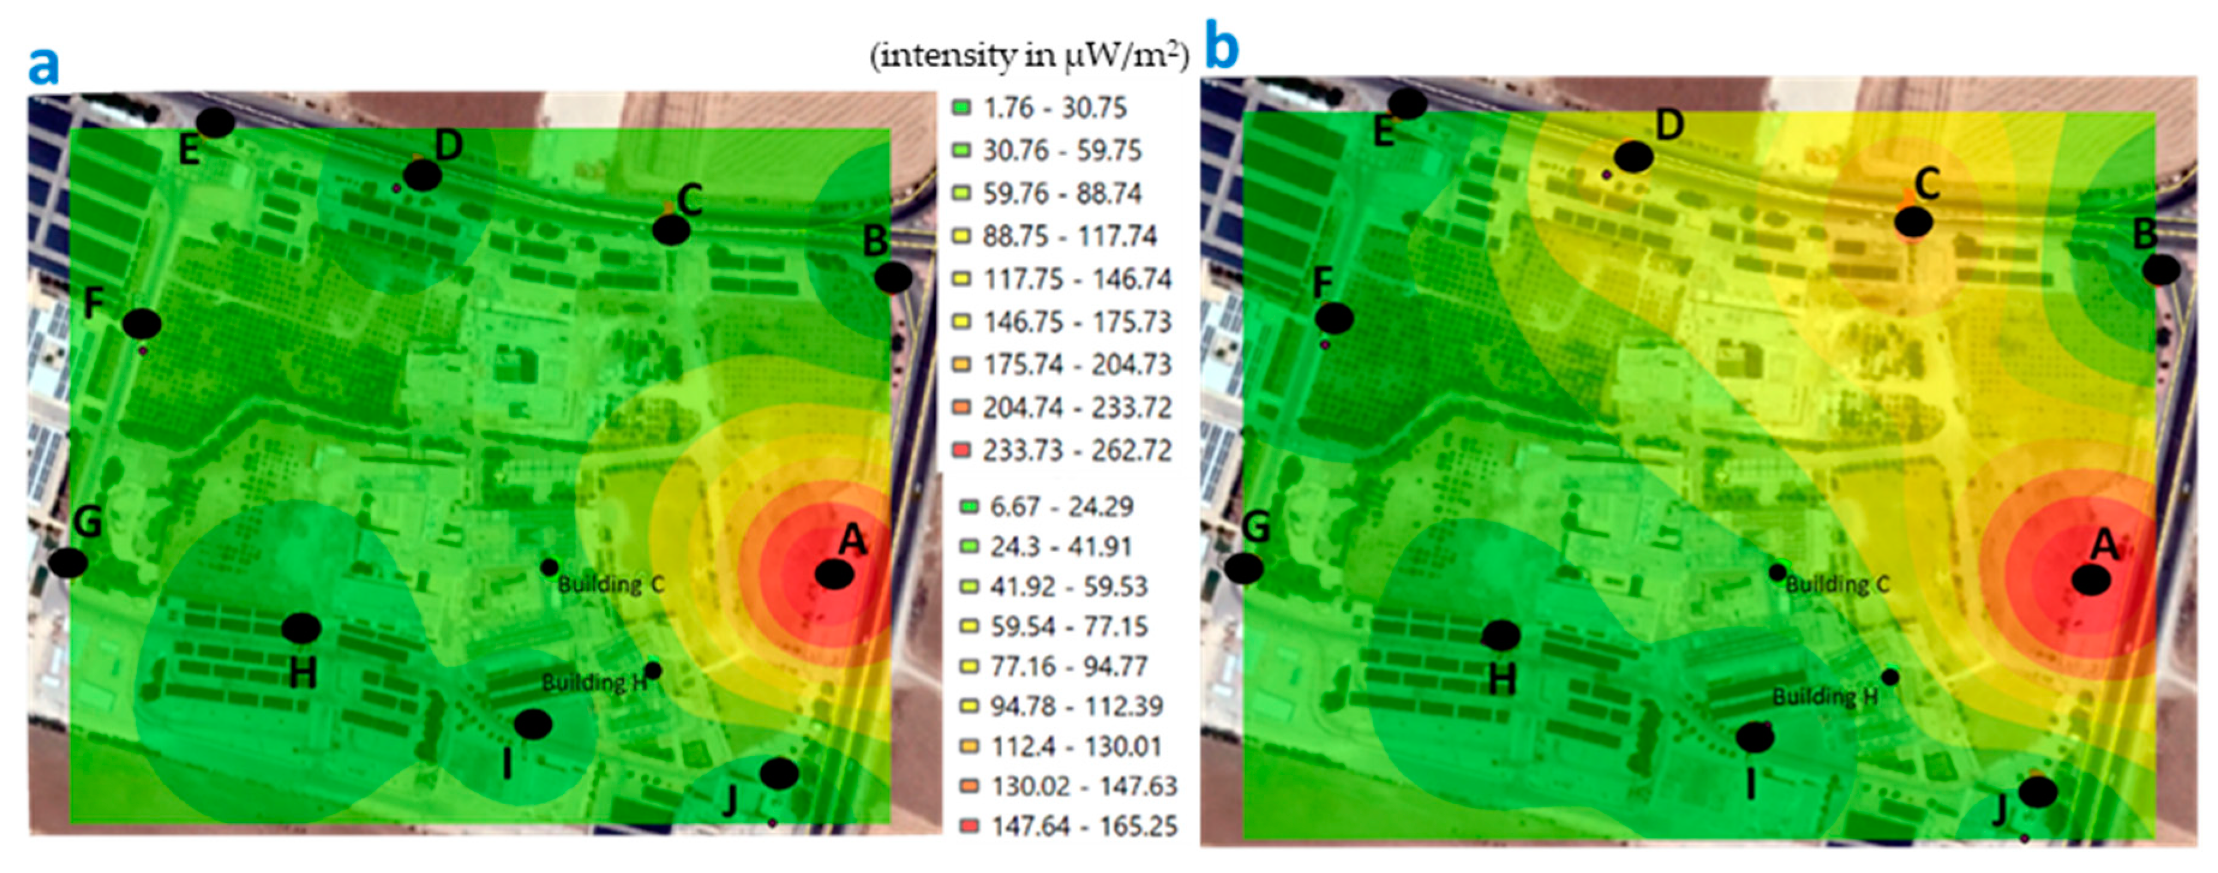
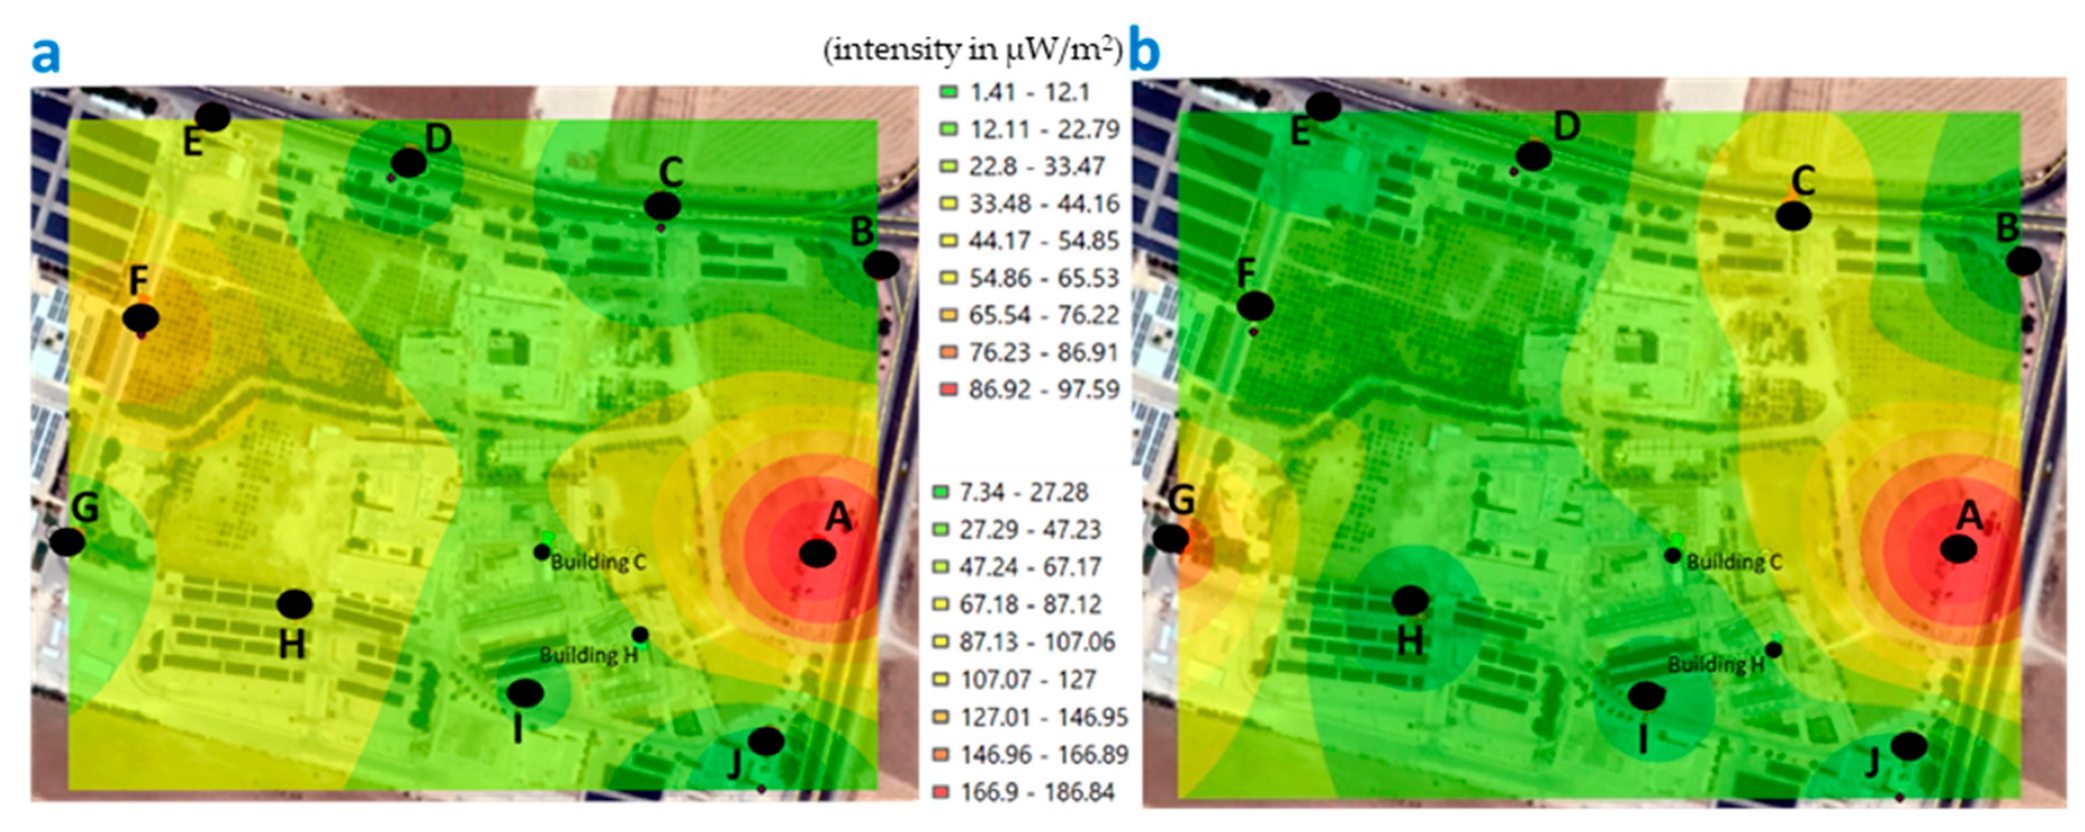
3.3. Spatial Measurement of Personal Exposure to RF-EMF
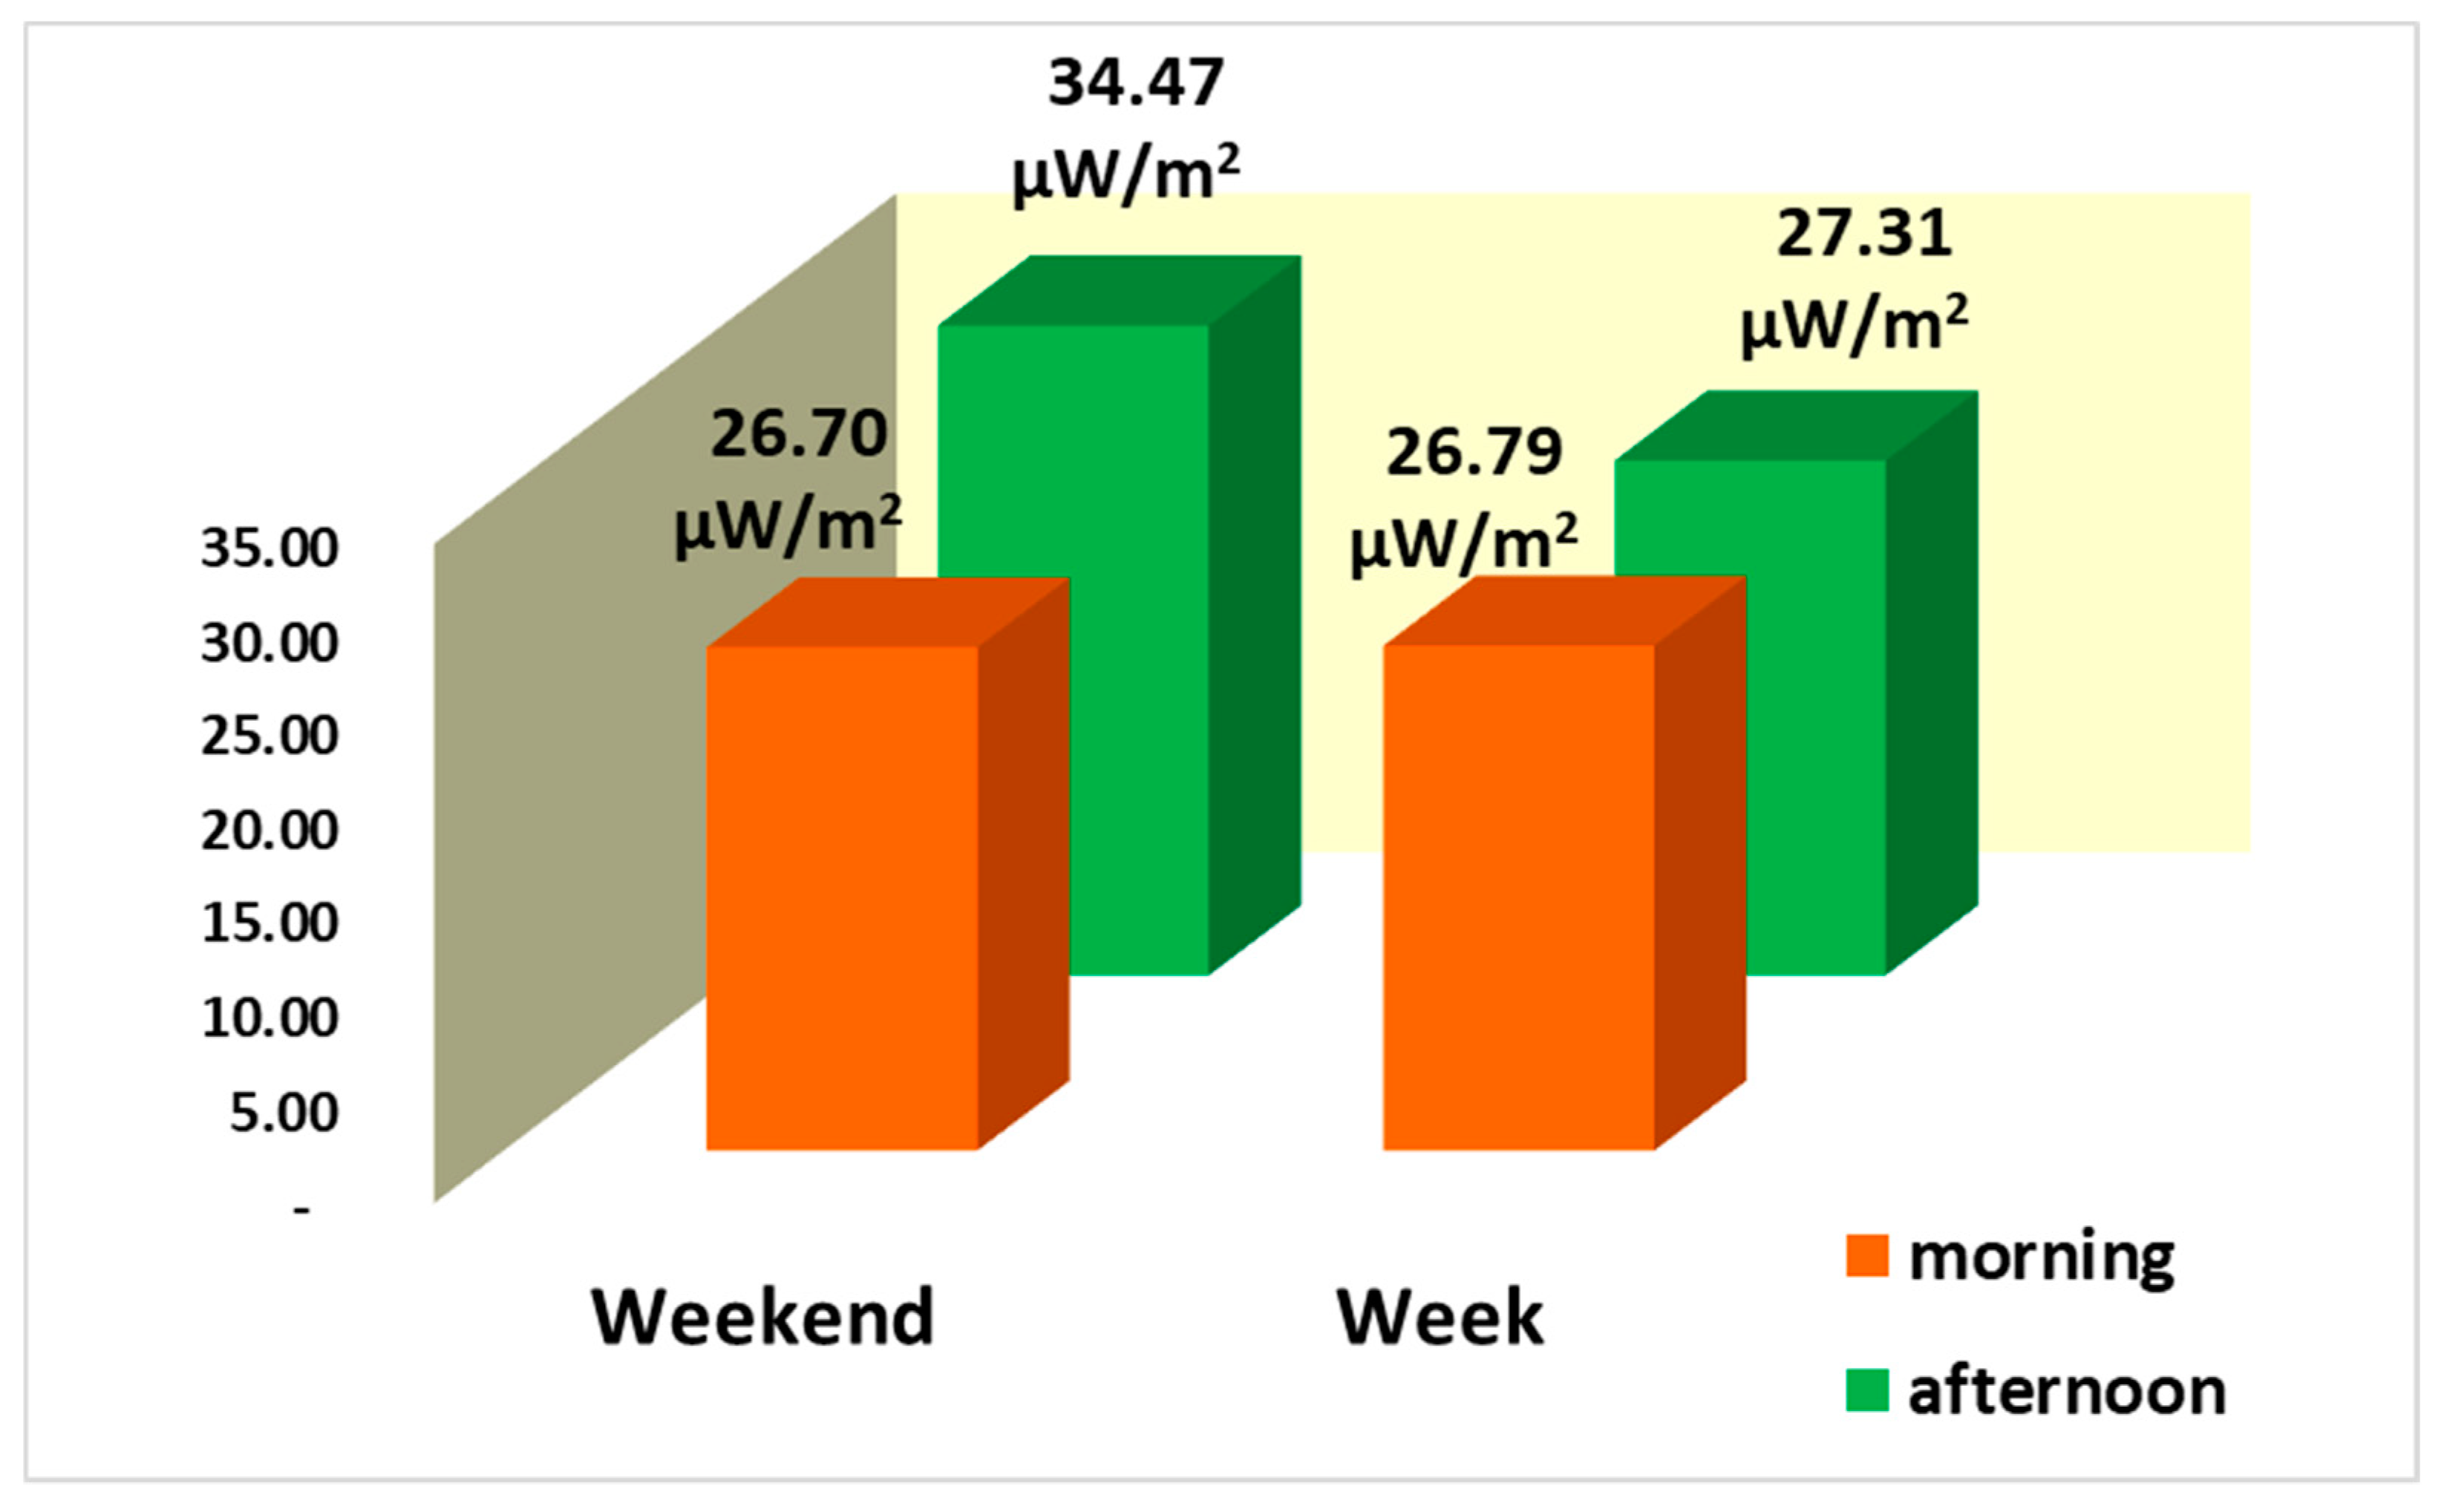
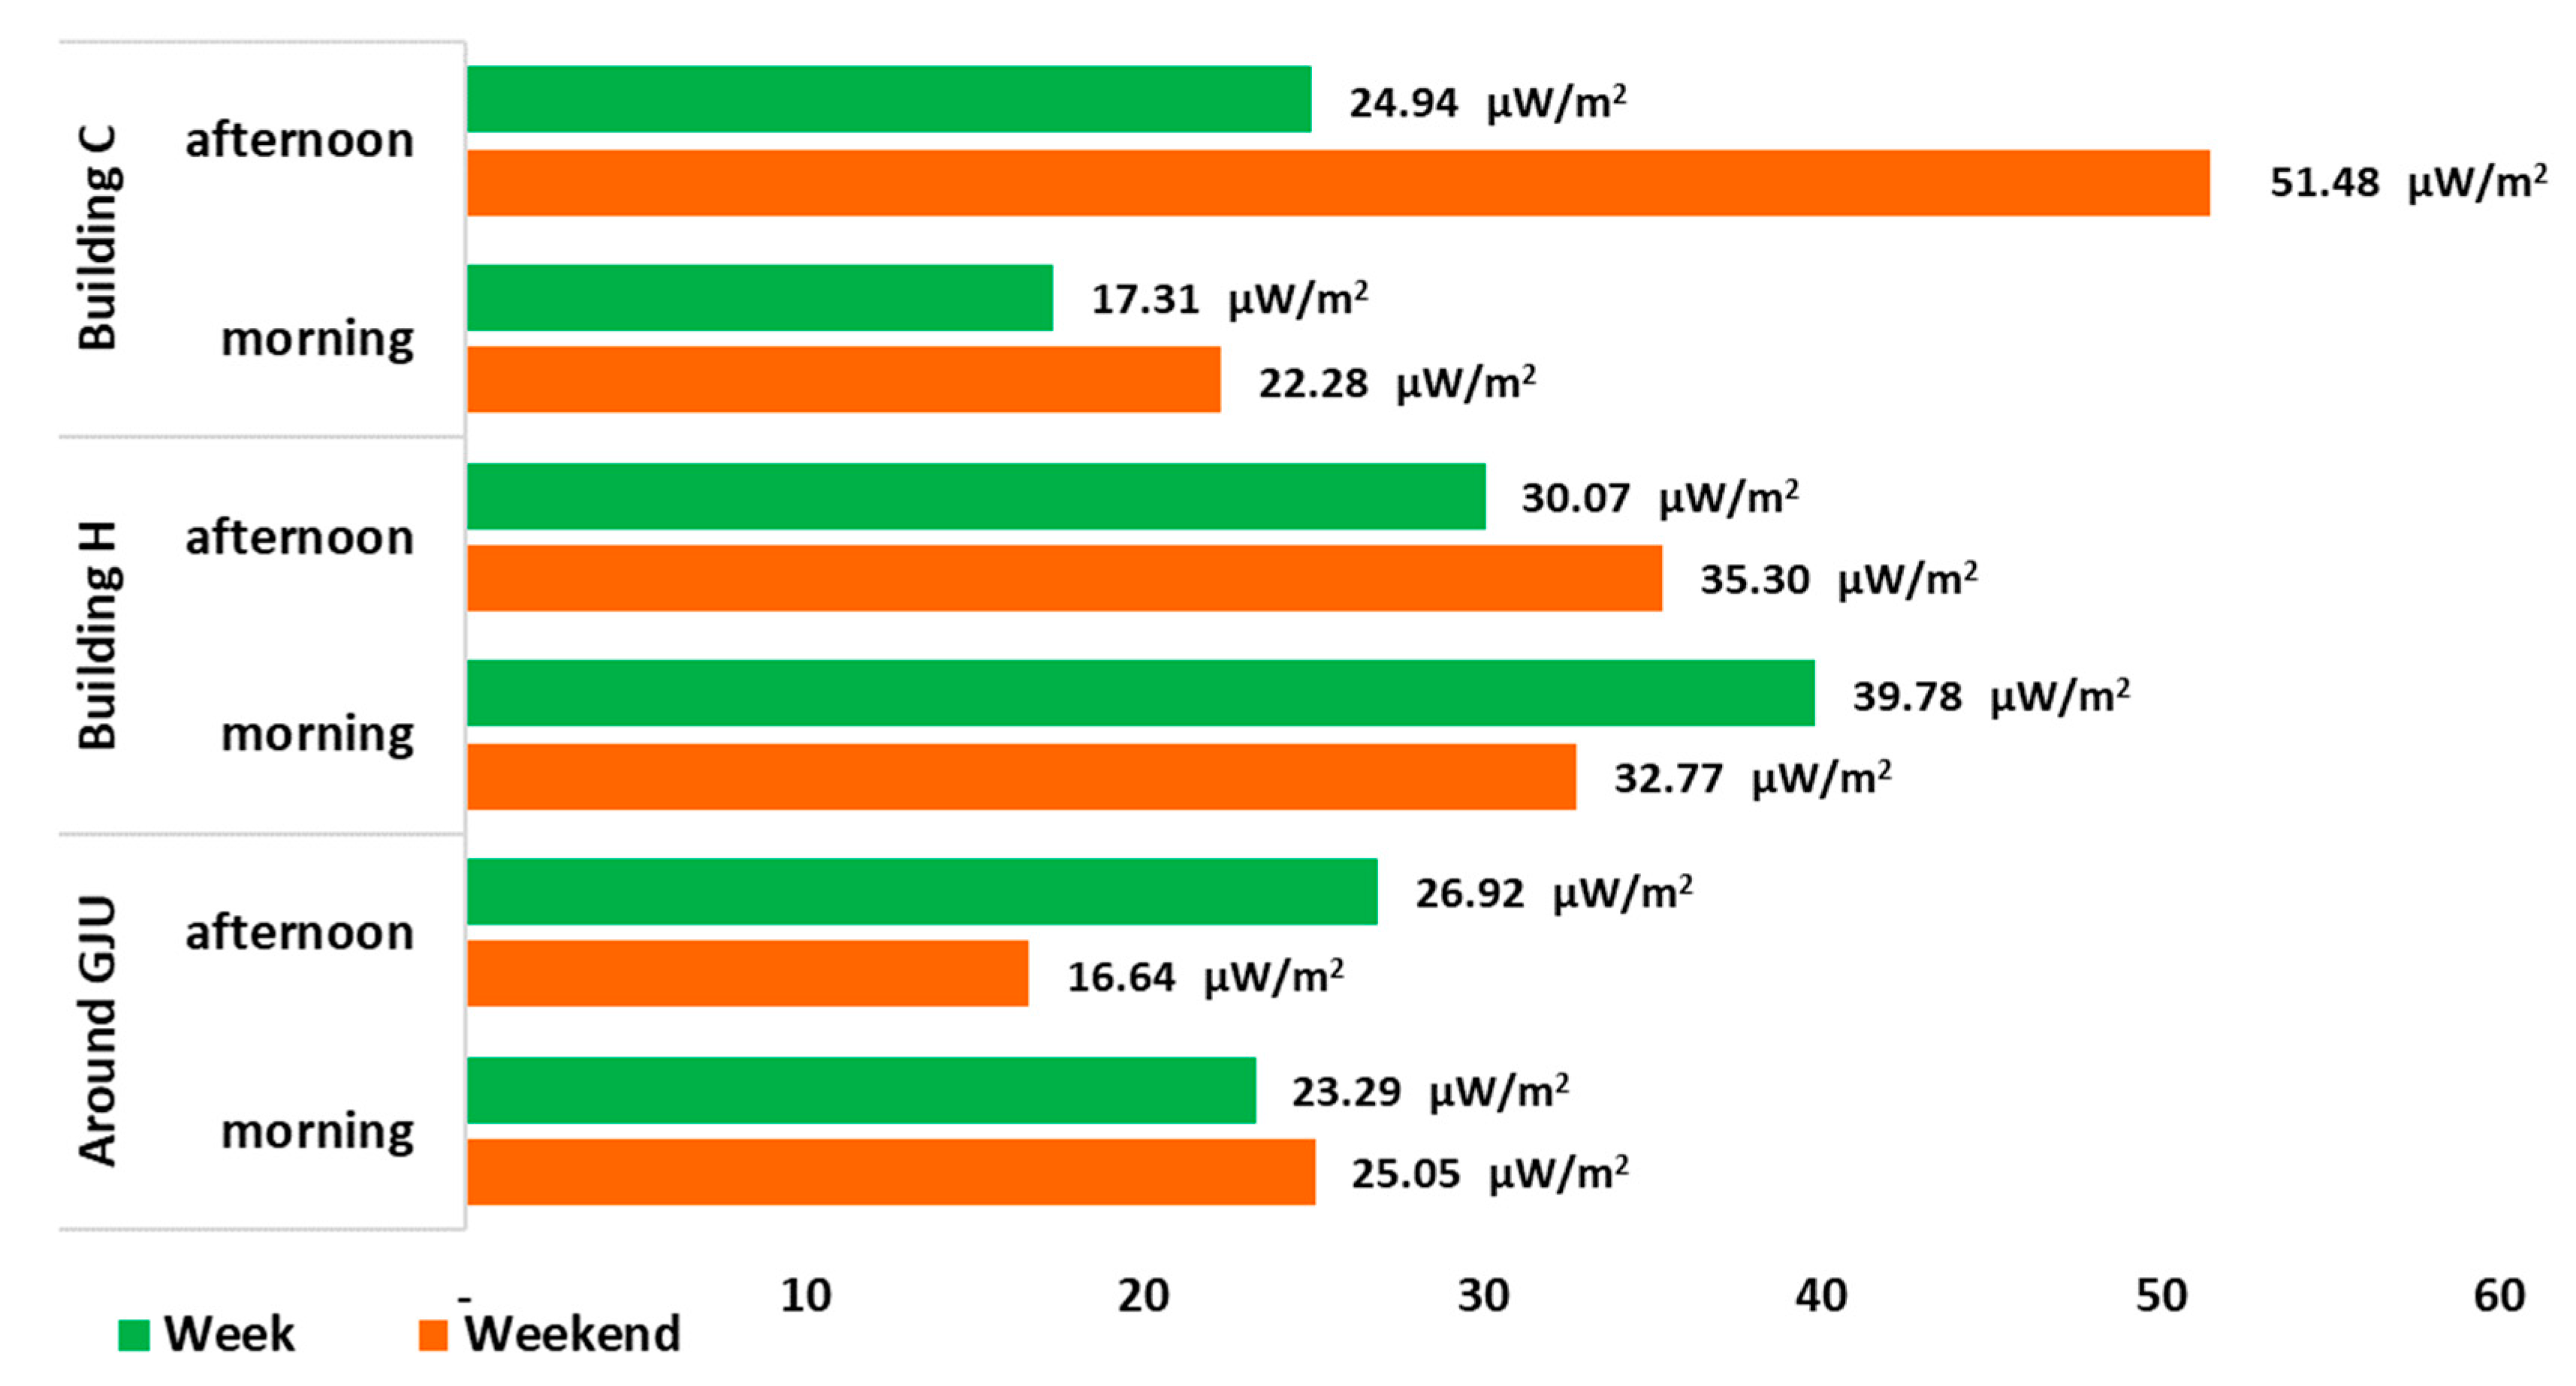
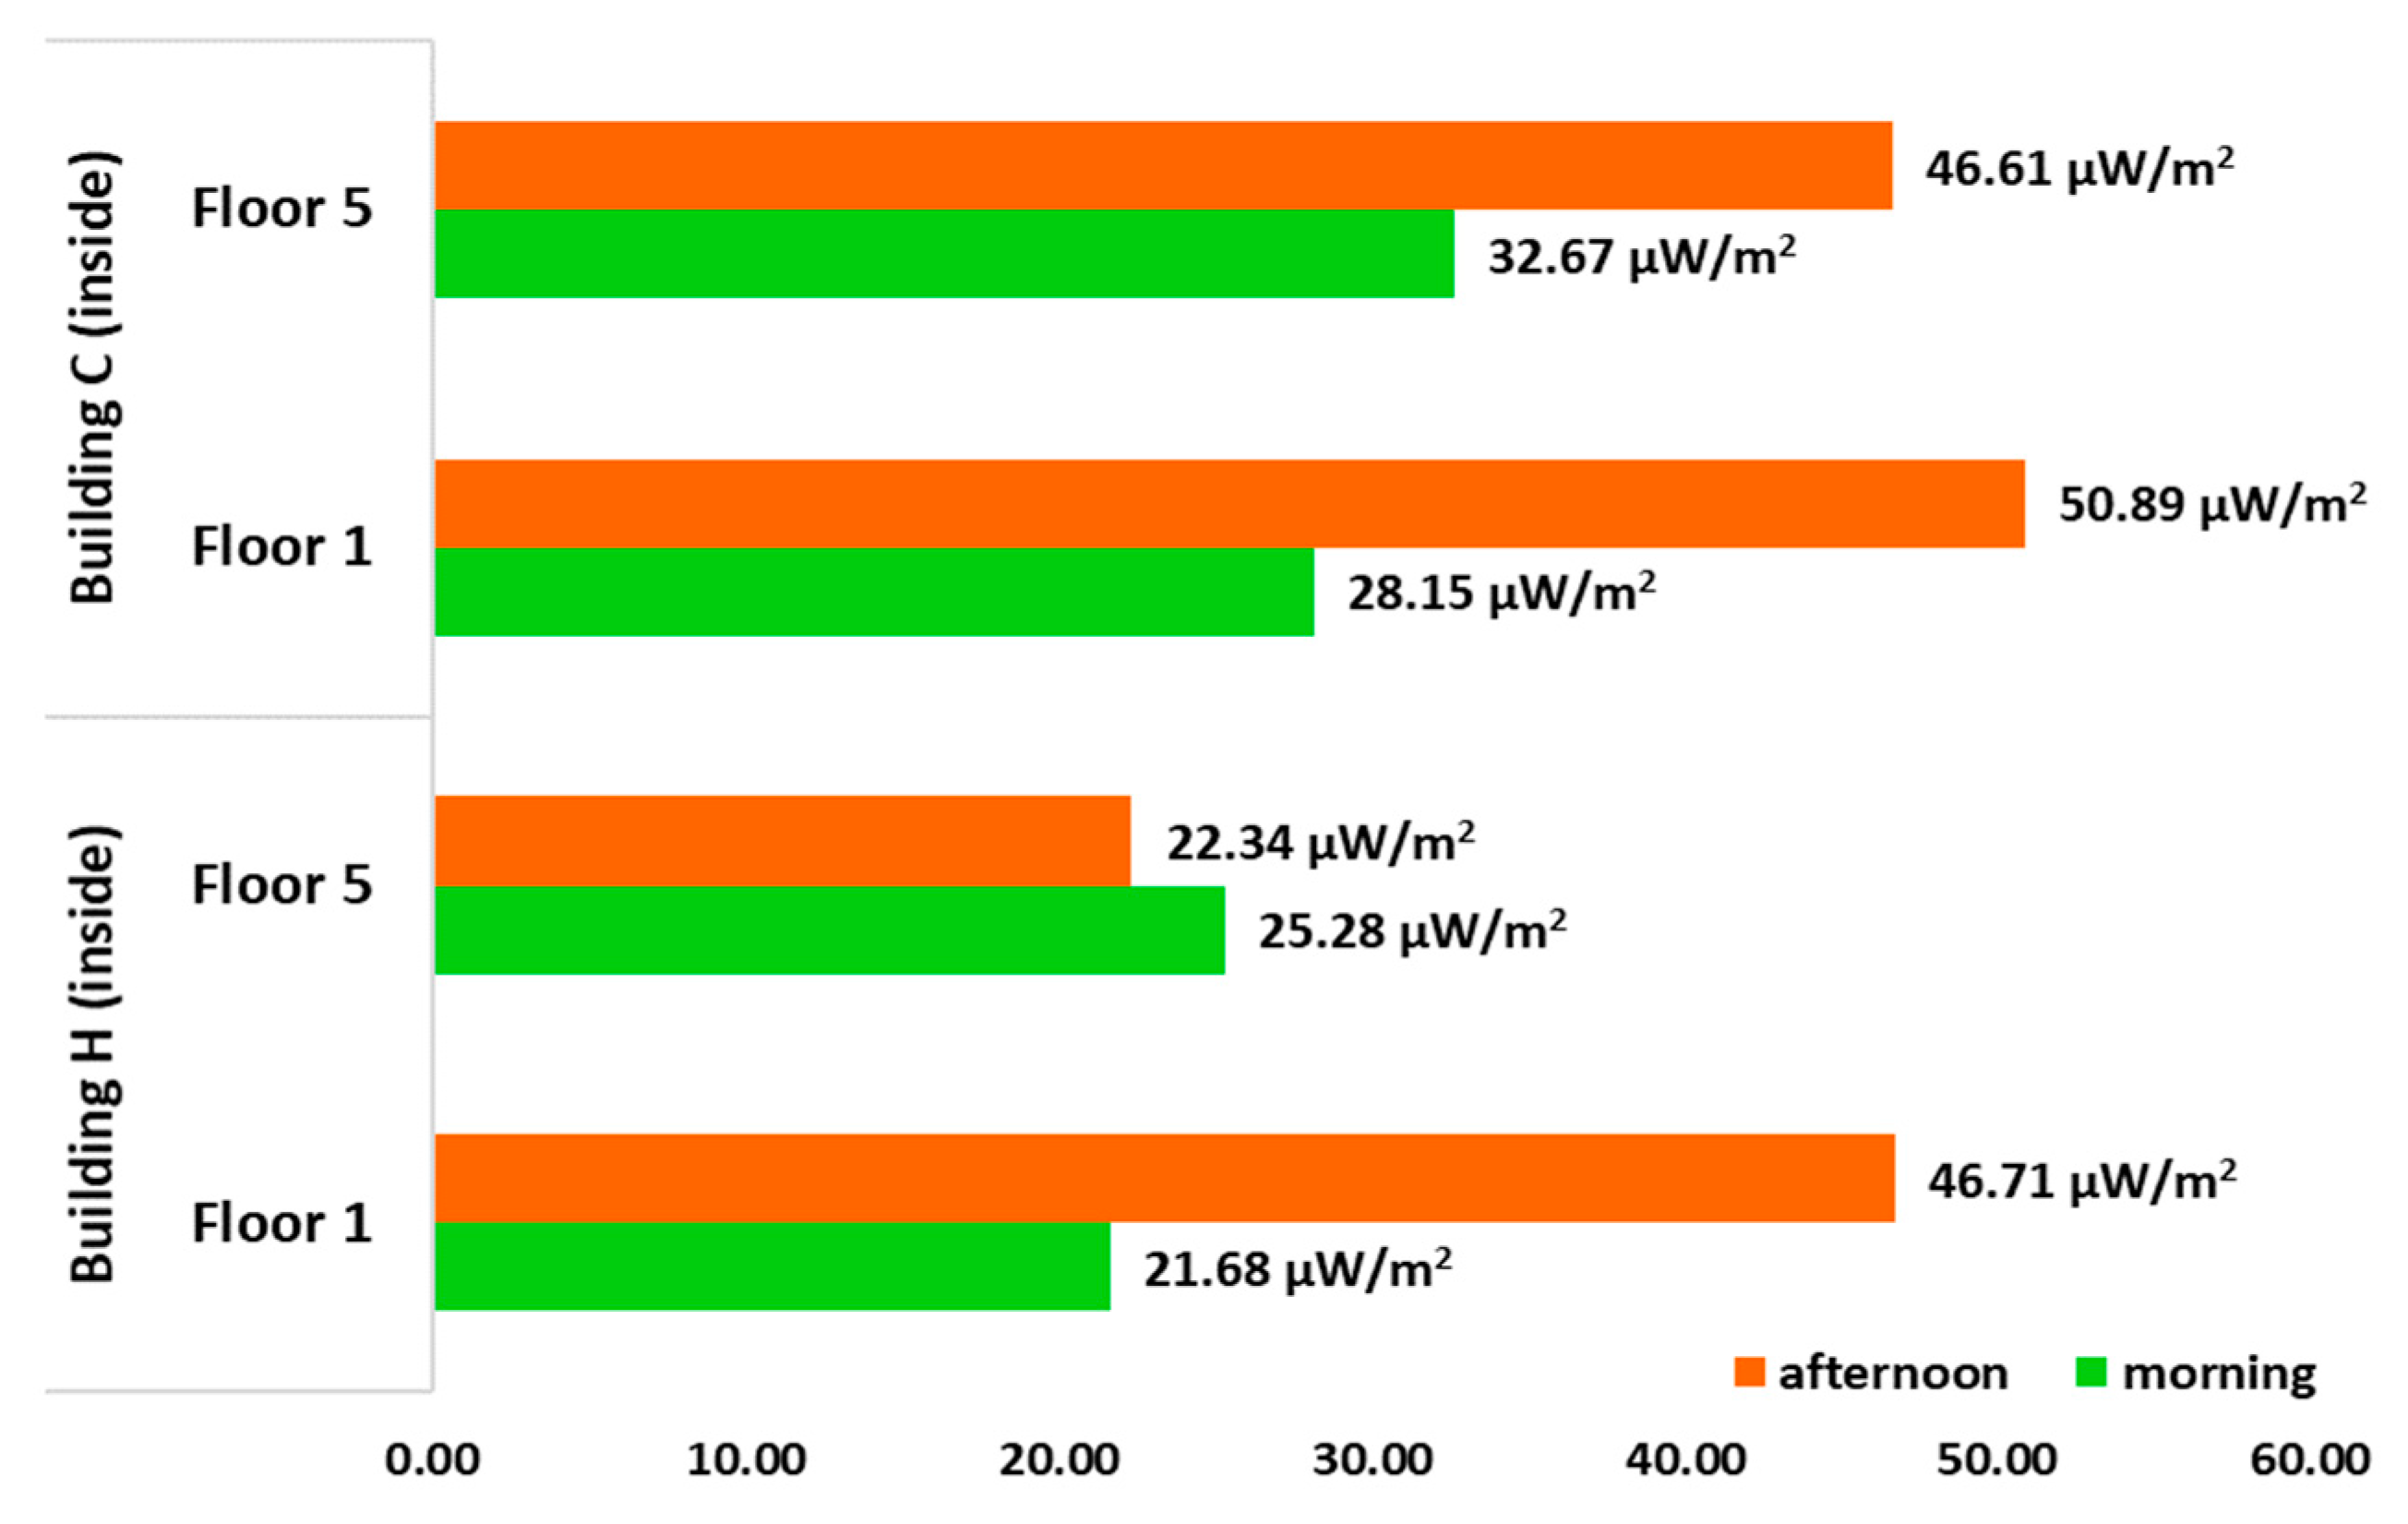
3.4. Spatial Measurement of Personal Exposure to RF-EMF: Week and Weekend, and Morning and Afternoon.
4. Discussion
5. Conclusions
Author Contributions
Funding
Acknowledgments
Conflicts of Interest
References
- Birks, L.E.; Struchen, B.; Eeftens, M.; van Wel, L.; Huss, A.; Gajsek, P.; Kheifets, L.; Gallastegi, M.; Dalmau-Bueno, A.; Estarlich, M.; et al. Spatial and temporal variability of personal environmental exposure to radio frequency electromagnetic fields in children in Europe. Environ. Int. 2018, 117, 204–214. [Google Scholar] [CrossRef] [PubMed]
- Gonzalez-Rubio, J.; Arribas, E.; Ramirez-Vazquez, R.; Najera, A. Radiofrequency electromagnetic fields and some cancers of unknown etiology: An ecological study. Sci. Total Environ. 2017, 599, 834–843. [Google Scholar] [CrossRef] [PubMed]
- Röösli, M.; Frei, P.; Mohler, E.; Hug, K. Systematic review on the health effects of exposure to radiofrequency electromagnetic fields from mobile phone base stations. Bull. World Health Organ. 2010, 88, 887–896. [Google Scholar] [CrossRef] [PubMed]
- Sagar, S.; Dongus, S.; Schoeni, A.; Roser, K.; Eeftens, M.; Struchen, B.; Foerster, M.; Meier, N.; Adem, S.; Roosli, M. Radiofrequency electromagnetic field exposure in everyday microenvironments in Europe: A systematic literature review. J. Expo. Sci. Environ. Epidemiol. 2017, 28, 147–160. [Google Scholar] [CrossRef] [PubMed]
- Zeleke, B.M.; Brzozek, C.; Bhatt, C.R.; Abramson, M.J.; Croft, R.J.; Freudenstein, F.; Wiedemann, P.; Benke, G. Personal Exposure to Radio Frequency Electromagnetic Fields among Australian Adults. Int. J. Environ. Res. Public. Health 2018, 15, 2234. [Google Scholar] [CrossRef]
- Röösli, M.; Frei, P.; Bolte, J.; Neubauer, G.; Cardis, E.; Feychting, M.; Gajsek, P.; Heinrich, S.; Joseph, W.; Mann, S.; et al. Conduct of a personal radiofrequency electromagnetic field measurement study: Proposed study protocol. Environ. Health 2010, 9, 23–37. [Google Scholar] [CrossRef]
- ICNIRP The International Commission on Non-ionizing Radiation Protection. Guidelines for Limiting Exposure to Time-Varying Electric, Magnetic, and Electromagnetic Fields (up to 300 GHz). Health Phys. Available online: http://www.icnirp.org/cms/upload/publications/ICNIRPemfgdl.pdf (accessed on 22 January 2017).
- Markov, M.S. Electromagnetic Fields in Biology and Medicine, 1st ed.; CRC Press. Taylor & Francis Group: Boca Raton, FL, USA, 2017; ISBN 978-1-138-74903-0. [Google Scholar]
- Markov, M.S. Mobile Communications and Public Health, 1st ed.; CRC Press. Taylor & Francis Group: Boca Raton, FL, USA, 2018; ISBN 978-1-351-33937-7. [Google Scholar]
- Bolte, J.F.B.; Pruppers, M.J.M.; Kamer, J.; Van der Zande, G.; Schipper, C.M.A.; Fleurke, S.R.; Kluwer, T.; Van Kamp, I.; Kromhout, J. The Dutch Exposimeter Study: Developing an Activity Exposure Matrix. Epidemiology 2008, 19, S78–S79. [Google Scholar]
- Eeftens, M.; Struchen, B.; Ellen Birks, L.; Cardis, E.; Estarlich, M.; Fernandez, M.F.; Gajsek, P.; Gallastegi, M.; Huss, A.; Kheifets, L.; et al. Personal exposure to radio-frequency electromagnetic fields in Europe: Is there a generation gap? Environ. Int. 2018, 121, 216–226. [Google Scholar] [CrossRef]
- Iyare, R.N.; Volskiy, V.; Vandenbosch, G.A.E. Study of the correlation between outdoor and indoor electromagnetic exposure near cellular base stations in Leuven, Belgium. Environ. Res. 2019, 168, 428–438. [Google Scholar] [CrossRef]
- Aerts, S.; Wiart, J.; Martens, L.; Joseph, W. Assessment of long-term spatio-temporal radiofrequency electromagnetic field exposure. Environ. Res. 2018, 161, 136–143. [Google Scholar] [CrossRef]
- Guxens, M.; Vermeulen, R.; Steenkamer, I.; Beekhuizen, J.; Vrijkotte, T.G.M.; Kromhout, H.; Huss, A. Radiofrequency electromagnetic fields, screen time, and emotional and behavioural problems in 5-year-old children. Int. J. Hyg. Environ. Health 2019, 222, 188–194. [Google Scholar] [CrossRef] [PubMed]
- Bhatt, C.R.; Thielens, A.; Redmayne, M.; Abramson, M.J.; Billah, B.; Sim, M.R.; Vermeulen, R.; Martens, L.; Joseph, W.; Benke, G. Measuring personal exposure from 900 MHz mobile phone base stations in Australia and Belgium using a novel personal distributed exposimeter. Environ. Int. 2016, 92–93, 388–397. [Google Scholar] [CrossRef] [PubMed]
- Frei, P.; Mohler, E.; Neubauer, G.; Theis, G.; Bürgi, A.; Fröhlich, J.; Braun-Fahrländer, C.; Bolte, J.; Egger, M.; Röösli, M. Temporal and spatial variability of personal exposure to radio frequency electromagnetic fields. Environ. Res. 2009, 109, 779–785. [Google Scholar] [CrossRef] [PubMed]
- Gallastegi, M.; Huss, A.; Santa-Marina, L.; Aurrekoetxea, J.J.; Guxens, M.; Ellen Birks, L.; Ibarluzea, J.; Guerra, D.; Roeoesli, M.; Jimenez-Zabala, A. Children’s exposure assessment of radiofrequency fields: Comparison between spot and personal measurements. Environ. Int. 2018, 118, 60–69. [Google Scholar] [CrossRef] [PubMed]
- Röösli, M. Radiofrequency electromagnetic field exposure and non-specific symptoms of ill health: A systematic review. Environ. Res. 2008, 107, 277–287. [Google Scholar] [CrossRef]
- Choi, J.; Hwang, J.-H.; Lim, H.; Joo, H.; Yang, H.-S.; Lee, Y.-H.; Eeftens, M.; Struchen, B.; Roosli, M.; Lee, A.-K.; et al. Assessment of radiofrequency electromagnetic field exposure from personal measurements considering the body shadowing effect in Korean children and parents. Sci. Total Environ. 2018, 627, 1544–1551. [Google Scholar] [CrossRef]
- Ramirez-Vazquez, R.; Gonzalez-Rubio, J.; Arribas, E.; Najera, A. Characterisation of personal exposure to environmental radiofrequency electromagnetic fields in Albacete (Spain) and assessment of risk perception. Environ. Res. 2019, 172, 109–116. [Google Scholar] [CrossRef]
- Sagar, S.; Adem, S.M.; Struchen, B.; Loughran, S.P.; Brunjes, M.E.; Arangua, L.; Dalvie, M.A.; Croft, R.J.; Jerrett, M.; Moskowitz, J.M.; et al. Comparison of radiofrequency electromagnetic field exposure levels in different everyday microenvironments in an international context. Environ. Int. 2018, 114, 297–306. [Google Scholar] [CrossRef]
- Sagar, S.; Struchen, B.; Finta, V.; Eeftens, M.; Roosli, M. Use of portable exposimeters to monitor radiofrequency electromagnetic field exposure in the everyday environment. Environ. Res. 2016, 150, 289–298. [Google Scholar] [CrossRef]
- Gonzalez-Rubio, J.; Arribas, E.; Ramirez-Vazquez, R.; Najera, A. Response to the comments on “Radiofrequency electromagnetic fields and some cancers of unknown etiology: An ecological study” by J. Gonzalez-Rubio, E.; Arribas, R. Ramirez-Vazquez and A. Najera. Science of the Total Environment 599–600 (2017) 834–843. Sci. Total Environ. 2018, 612, 368–369. [Google Scholar] [CrossRef]
- Gonzalez-Rubio, J.; Najera, A.; Arribas, E. Comprehensive personal RF-EMF exposure map and its potential use in epidemiological studies. Environ. Res. 2016, 149, 105–112. [Google Scholar] [CrossRef] [PubMed]
- Ramirez-Vazquez, R.; Gonzalez-Rubio, J.; Arribas, E.; Najera, A. Personal RF-EMF exposure from mobile phone base stations during temporary events. Environ. Res. 2019, 175, 266–273. [Google Scholar] [CrossRef] [PubMed]
- Verloock, L.; Joseph, W.; Goeminne, F.; Martens, L.; Verlaek, M.; Constandt, K. Assessment of radio frequency exposures in schools, homes, and public places in Belgium. Health Phys. 2014, 107, 503–513. [Google Scholar] [CrossRef] [PubMed]
- Chiaraviglio, L.; Cacciapuoti, A.S.; Di Martino, G.; Fiore, M.; Montesano, M.; Trucchi, D.; Melazzi, N.B. Planning 5G Networks Under EMF Constraints: State of the Art and Vision. IEEE Access 2018, 6, 51021–51037. [Google Scholar] [CrossRef]
- Foster, K.R.; Moulder, J.E. Wi-Fi and Health: Review of Current Status of Research. Health Phys. 2013, 105, 561–575. [Google Scholar] [CrossRef]
- Arribas, E.; Ramirez-Vazquez, R.; Escobar, I. Comment on “Wi-Fi is an important threat to human health”. Environ. Res. 2018, 167, 639. [Google Scholar] [CrossRef]
- Pall, M.L. Wi-Fi is an important threat to human health. Environ. Res. 2018, 164, 405–416. [Google Scholar] [CrossRef]
- Khalid, M.; Mee, T.; Peyman, A.; Addison, D.; Calderon, C.; Maslanyj, M.; Mann, S. Exposure to radio frequency electromagnetic fields from wireless computer networks: Duty factors of Wi-Fi devices operating in schools. Prog. Biophys. Mol. Biol. 2011, 107, 412–420. [Google Scholar] [CrossRef]
- ICNIRP Guidelines on limits of exposure to static magnetic fields. Health Phys. 2009, 96, 504–514. [CrossRef]
- De Miguel-Bilbao, S.; Blas, J.; Ramos, V. Effective Analysis of Human Exposure Conditions with Body-worn Dosimeters in the 2.4 GHz Band. JOVE J. Vis. Exp. 2018, 135, e56525. [Google Scholar] [CrossRef]
- Joseph, W.; Vermeeren, G.; Verloock, L.; Martens, L. Estimation of Whole-Body SAR from Electromagnetic Fields Using Personal Exposure Meters. Bioelectromagnetics 2010, 31, 286–295. [Google Scholar] [CrossRef] [PubMed]
- Njera Lopez, A.; Gonzalez-Rubio, J.; Villalba Montoya, J.M.; Arribas, E. Using multiple exposimeters to evaluate the influence of the body when measuring personal exposition to radio frequency electromagnetic fields. Compel Int. J. Comput. Math. Electr. Electron. Eng. 2015, 34, 1063–1069. [Google Scholar] [CrossRef]
- Bolte, J.F.B. Lessons learnt on biases and uncertainties in personal exposure measurement surveys of radiofrequency electromagnetic fields with exposimeters. Environ. Int. 2016, 94, 724–735. [Google Scholar] [CrossRef] [PubMed]
- Eeftens, M.; Struchen, B.; Roser, K.; Zahner, M.; Frohlich, J.; Roosli, M. Dealing with crosstalk in electromagnetic field measurements of portable devices. Bioelectromagnetics 2018, 39, 529–538. [Google Scholar] [CrossRef] [PubMed]
- Gajsek, P.; Ravazzani, P.; Wiart, J.; Grellier, J.; Samaras, T.; Thuroczy, G. Electromagnetic field exposure assessment in Europe radiofrequency fields (10 MHz-6 GHz). J. Expo. Sci. Environ. Epidemiol. 2015, 25, 37–44. [Google Scholar] [CrossRef]
- Röösli, M.; Frei, P.; Mohler, E.; Braun-Fahrländer, C.; Bürgi, A.; Fröhlich, J.; Neubauer, G.; Theis, G.; Egger, M. Statistical analysis of personal radiofrequency electromagnetic field measurements with nondetects. Bioelectromagnetics 2008, 29, 471–478. [Google Scholar] [CrossRef]
- Najera, A.; Ramirez-Vazquez, R.; Arribas, E.; Gonzalez-Rubio, J. Comparison of statistic methods for censored personal exposure to RF-EMF data. Environ. Monit. Assess. 2020, 192, 77. [Google Scholar] [CrossRef]
- EME SPY 200 EME SPY 200 | RF-Safety | MVG. Available online: http://www.mvg-world.com/es/products/field_product_family/rf-safety-3/eme-spy-200 (accessed on 22 January 2017).
- Microwave Vision Group (MVG) EME Spy Evolution | RF-Safety | MVG. Available online: https://www.mvg-world.com/en/products/field_product_family/rf-safety-3/eme-spy-evolution (accessed on 31 January 2019).
- Aminzadeh, R.; Thielens, A.; Bamba, A.; Kone, L.; Gaillot, D.P.; Lienard, M.; Martens, L.; Joseph, W. On-body calibration and measurements using personal radiofrequency exposimeters in indoor diffuse and specular environments. Bioelectromagnetics 2016, 37, 298–309. [Google Scholar] [CrossRef]
- Markakis, I.; Samaras, T. Radiofrequency Exposure in Greek Indoor Environments. Health Phys. 2013, 104, 293–301. [Google Scholar] [CrossRef]
- Urbinello, D.; Joseph, W.; Huss, A.; Verloock, L.; Beekhuizen, J.; Vermeulen, R.; Martens, L.; Röösli, M. Radio-frequency electromagnetic field (RF-EMF) exposure levels in different European outdoor urban environments in comparison with regulatory limits. Environ. Int. 2014, 68, 49–54. [Google Scholar] [CrossRef]
- Vermeeren, G.; Markakis, I.; Goeminne, F.; Samaras, T.; Martens, L.; Joseph, W. Spatial and temporal RF electromagnetic field exposure of children and adults in indoor microenvironments in Belgium and Greece. Prog. Biophys. Mol. Biol. 2013, 113, 254–263. [Google Scholar] [CrossRef]
- Aerts, S.; Deschrijver, D.; Joseph, W.; Verloock, L.; Goeminne, F.; Martens, L.; Dhaene, T. Exposure assessment of mobile phone base station radiation in an outdoor environment using sequential surrogate modeling. Bioelectromagnetics 2013, 34, 300–311. [Google Scholar] [CrossRef]
- Aguirre, E.; Arpon, J.; Azpilicueta, L.; Lopez, P.; De Miguel, S.; Ramos, V.; Falcone, F. Estimation of Electromagnetic Dosimetric Values from Non-Ionizing Radiofrequency Fields in an Indoor Commercial Airplane Environment. Electromagn. Biol. Med. 2014, 33, 252–263. [Google Scholar] [CrossRef]
- Beekhuizen, J.; Vermeulen, R.; van Eijsden, M.; van Strien, R.; Bürgi, A.; Loomans, E.; Guxens, M.; Kromhout, H.; Huss, A. Modelling indoor electromagnetic fields (EMF) from mobile phone base stations for epidemiological studies. Environ. Int. 2014, 67, 22–26. [Google Scholar] [CrossRef] [PubMed]
- Beekhuizen, J.; Vermeulen, R.; Kromhout, H.; Buergi, A.; Huss, A. Geospatial modelling of electromagnetic fields from mobile phone base stations. Sci. Total Environ. 2013, 445, 202–209. [Google Scholar] [CrossRef] [PubMed]
- Frei, P.; Mohler, E.; Buergi, A.; Froehlich, J.; Neubauer, G.; Braun-Fahrlaender, C.; Roosli, M. Classification of personal exposure to radio frequency electromagnetic fields (RF-EMF) for epidemiological research: Evaluation of different exposure assessment methods. Environ. Int. 2010, 36, 714–720. [Google Scholar] [CrossRef] [PubMed]
- Frei, P.; Mohler, E.; Buergi, A.; Froehlich, J.; Neubauer, G.; Braun-Fahrlaender, C.; Roosli, M. A prediction model for personal radio frequency electromagnetic field exposure. Sci. Total Environ. 2009, 408, 102–108. [Google Scholar] [CrossRef] [PubMed]
- Bogers, R.P.; van Gils, A.; Clahsen, S.C.S.; Vercruijsse, W.; van Kamp, I.; Baliatsas, C.; Rosmalen, J.G.M.; Bolte, J.F.B. Individual variation in temporal relationships between exposure to radiofrequency electromagnetic fields and non-specific physical symptoms: A new approach in studying ‘electrosensitivity. ’ Environ. Int. 2018, 121, 297–307. [Google Scholar] [CrossRef]
- Di Ciaula, A. Towards 5G communication systems: Are there health implications? Int. J. Hyg. Environ. Health 2018, 221, 367–375. [Google Scholar] [CrossRef]
- Kurnaz, C.; Engiz, B.K.; Kose, U. An Empirical Study: The Impact of the Number of Users on Electric Field Strength of Wireless Communications. Radiat. Prot. Dosimetry 2018, 182, 494–501. [Google Scholar] [CrossRef]
- De Miguel-Bilbao, S.; Blas, J.; Karpowicz, J.; Ramos, V. Study of Body Position Dependence on Human Exposure in the 2.4 GHz Band. In Proceedings of the 2019 International Symposium on Electromagnetic Compatibility—EMC EUROPE, Barcelona, Spain, 2–6 September 2019; pp. 1112–1115. [Google Scholar]
- Jalilian, H.; Eeftens, M.; Ziaei, M.; Roosli, M. Public exposure to radiofrequency electromagnetic fields in everyday microenvironments: An updated systematic review for Europe. Environ. Res. 2019, 176, 108517. [Google Scholar] [CrossRef] [PubMed]
- Roser, K.; Schoeni, A.; Struchen, B.; Zahner, M.; Eeftens, M.; Frohlich, J.; Roosli, M. Personal radiofrequency electromagnetic field exposure measurements in Swiss adolescents. Environ. Int. 2017, 99, 303–314. [Google Scholar] [CrossRef] [PubMed]
- Valic, B.; Kos, B.; Gajsek, P. Typical exposure of children to EMF: Exposimetry and dosimetry. Radiat. Prot. Dosimetry 2015, 163, 70–80. [Google Scholar] [CrossRef] [PubMed]
- Massardier-Pilonchery, A.; Nerriere, E.; Croidieu, S.; Ndagijimana, F.; Gaudaire, F.; Martinsons, C.; Noe, N.; Hours, M. Assessment of Personal Occupational Exposure to Radiofrequency Electromagnetic Fields in Libraries and Media Libraries, Using Calibrated On-Body Exposimeters. Int. J. Environ. Res. Public. Health 2019, 16, 2087. [Google Scholar] [CrossRef]
- Hardell, L.; Carlberg, M.; Koppel, T.; Hedendahl, L. High radiofrequency radiation at Stockholm Old Town: An exposimeter study including the Royal Castle, Supreme Court, three major squares and the Swedish Parliament. Mol. Clin. Oncol. 2017, 6, 462–476. [Google Scholar] [CrossRef]
- Hedendahl, L.K.; Carlberg, M.; Koppel, T.; Hardell, L. Measurements of Radiofrequency Radiation with a Body-Borne Exposimeter in Swedish Schools with Wi-Fi. Front. Public Health 2017, 5, 279. [Google Scholar] [CrossRef]


| Wi-Fi Bands | Total of 14 Bands |
|---|---|
| 28.82 μW/m2 | 1598.8 μW/m2 |
| Bands | Frequency (MHz) | Intensity in μW/m2 |
|---|---|---|
| DCS DL (Digital Communications System) | 1805–1880 | 568.25 |
| GSM DL (Global System for Mobile Communications) | 925–960 | 556.52 |
| UMTS DL (Universal Mobile TelecommunicationsSystem) | 2110–2170 | 263.20 |
| Point | Morning | Afternoon | ||
|---|---|---|---|---|
| Weekend | Week | Weekend | Week | |
| A | 13.41 | 22.17 | 23.16 | 9.80 |
| B | 130.75 | 87.34 | 150.48 | 62.38 |
| C | 6.00 | 13.06 | 137.21 | 69.02 |
| D | 44.20 | 28.97 | 384.86 | 176.44 |
| E | 37.92 | 10.82 | 93.23 | 15.08 |
| F | 21.95 | 43.83 | 5.17 | 29.67 |
| G | 94.82 | 14.08 | 19.59 | 12.82 |
| H | 7.48 | 56.72 | 10.05 | 23.80 |
| Point | Morning | Afternoon | ||
|---|---|---|---|---|
| Weekend | Week | Weekend | Week | |
| A | 126.08 | 92.70 | 328.14 | 146.33 |
| B | 82.56 | 319.33 | 69.85 | 75.58 |
| C | 125.19 | 7.62 | 6.04 | 112.21 |
| D | 1.62 | 3.35 | 4.69 | 5.78 |
| E | 24.41 | 41.74 | 13.97 | 49.13 |
| F | 145.06 | 119.36 | 94.74 | 72.54 |
| G | 16.17 | 49.11 | 44.75 | 14.52 |
| H | 3.17 | 3.28 | 2.56 | 5.01 |
| Point | Morning | Afternoon | ||
|---|---|---|---|---|
| Weekend | Week | Weekend | Week | |
| A | 262.74 | 165.26 | 97.60 | 186.85 |
| B | 11.08 | 15.92 | 7.76 | 12.98 |
| C | 39.62 | 113.30 | 14.02 | 84.52 |
| D | 18.21 | 80.55 | 19.66 | 32.39 |
| E | 50.17 | 6.67 | 36.73 | 7.34 |
| F | 48.66 | 11.11 | 65.67 | 35.40 |
| G | 33.07 | 36.67 | 26.02 | 134.96 |
| H | 12.79 | 11.88 | 42.29 | 15.22 |
| I | 22.96 | 7.99 | 21.56 | 20.91 |
| J | 1.75 | 16.48 | 1.41 | 7.82 |
| Author | Countries | Mean (μW/m2) |
|---|---|---|
| Birks et al., 2018 [1] | Denmark (all environments) | 1.19 |
| Netherlands (all environments) | 1.19 | |
| Slovenia (all environments) | 0.53 | |
| Switzerland (all environments) | 0.53 | |
| Spain (all environments) | 6.50 | |
| Roser et al., 2017 [58] | Switzerland (all environments) | 1.19 |
| Valic et al., 2015), 2015 [59] | Slovenia (all environments) | 4.77 |
| Röösli et al., 2010 [6] | France (all environments) | 1.92 |
| Massardier-Pilonchery et al., 2019 [60] | France (all environments) | 0.15 |
| Hardell et al., 2017 [61] | Sweden (School) | 3.32 |
| Roser et al., 2017 [58] | Switzerland (school) | 1.19 |
| Hedendahl et al., 2017 [62] | Swedish (outdoor, old town) | 0.13 |
| Gonzalez-Rubio et al., 2016 [24] | Spain (outdoor) | 0.53 |
| Aminzadeh et al., 2016 [43] | Belgium (office indoor, urban) | 38.33 |
| Our measurements | Jordan (university area) | 28.82 |
© 2020 by the authors. Licensee MDPI, Basel, Switzerland. This article is an open access article distributed under the terms and conditions of the Creative Commons Attribution (CC BY) license (http://creativecommons.org/licenses/by/4.0/).
Share and Cite
Ramirez-Vazquez, R.; Arabasi, S.; Al-Taani, H.; Sbeih, S.; Gonzalez-Rubio, J.; Escobar, I.; Arribas, E. Georeferencing of Personal Exposure to Radiofrequency Electromagnetic Fields from Wi-Fi in a University Area. Int. J. Environ. Res. Public Health 2020, 17, 1898. https://doi.org/10.3390/ijerph17061898
Ramirez-Vazquez R, Arabasi S, Al-Taani H, Sbeih S, Gonzalez-Rubio J, Escobar I, Arribas E. Georeferencing of Personal Exposure to Radiofrequency Electromagnetic Fields from Wi-Fi in a University Area. International Journal of Environmental Research and Public Health. 2020; 17(6):1898. https://doi.org/10.3390/ijerph17061898
Chicago/Turabian StyleRamirez-Vazquez, Raquel, Sameer Arabasi, Hussein Al-Taani, Suhad Sbeih, Jesus Gonzalez-Rubio, Isabel Escobar, and Enrique Arribas. 2020. "Georeferencing of Personal Exposure to Radiofrequency Electromagnetic Fields from Wi-Fi in a University Area" International Journal of Environmental Research and Public Health 17, no. 6: 1898. https://doi.org/10.3390/ijerph17061898
APA StyleRamirez-Vazquez, R., Arabasi, S., Al-Taani, H., Sbeih, S., Gonzalez-Rubio, J., Escobar, I., & Arribas, E. (2020). Georeferencing of Personal Exposure to Radiofrequency Electromagnetic Fields from Wi-Fi in a University Area. International Journal of Environmental Research and Public Health, 17(6), 1898. https://doi.org/10.3390/ijerph17061898