Space-Time Clustering Characteristics of Tuberculosis in Khyber Pakhtunkhwa Province, Pakistan, 2015–2019

 , , ,
, , ,
Abstract
1. Introduction
2. Materials and Methods
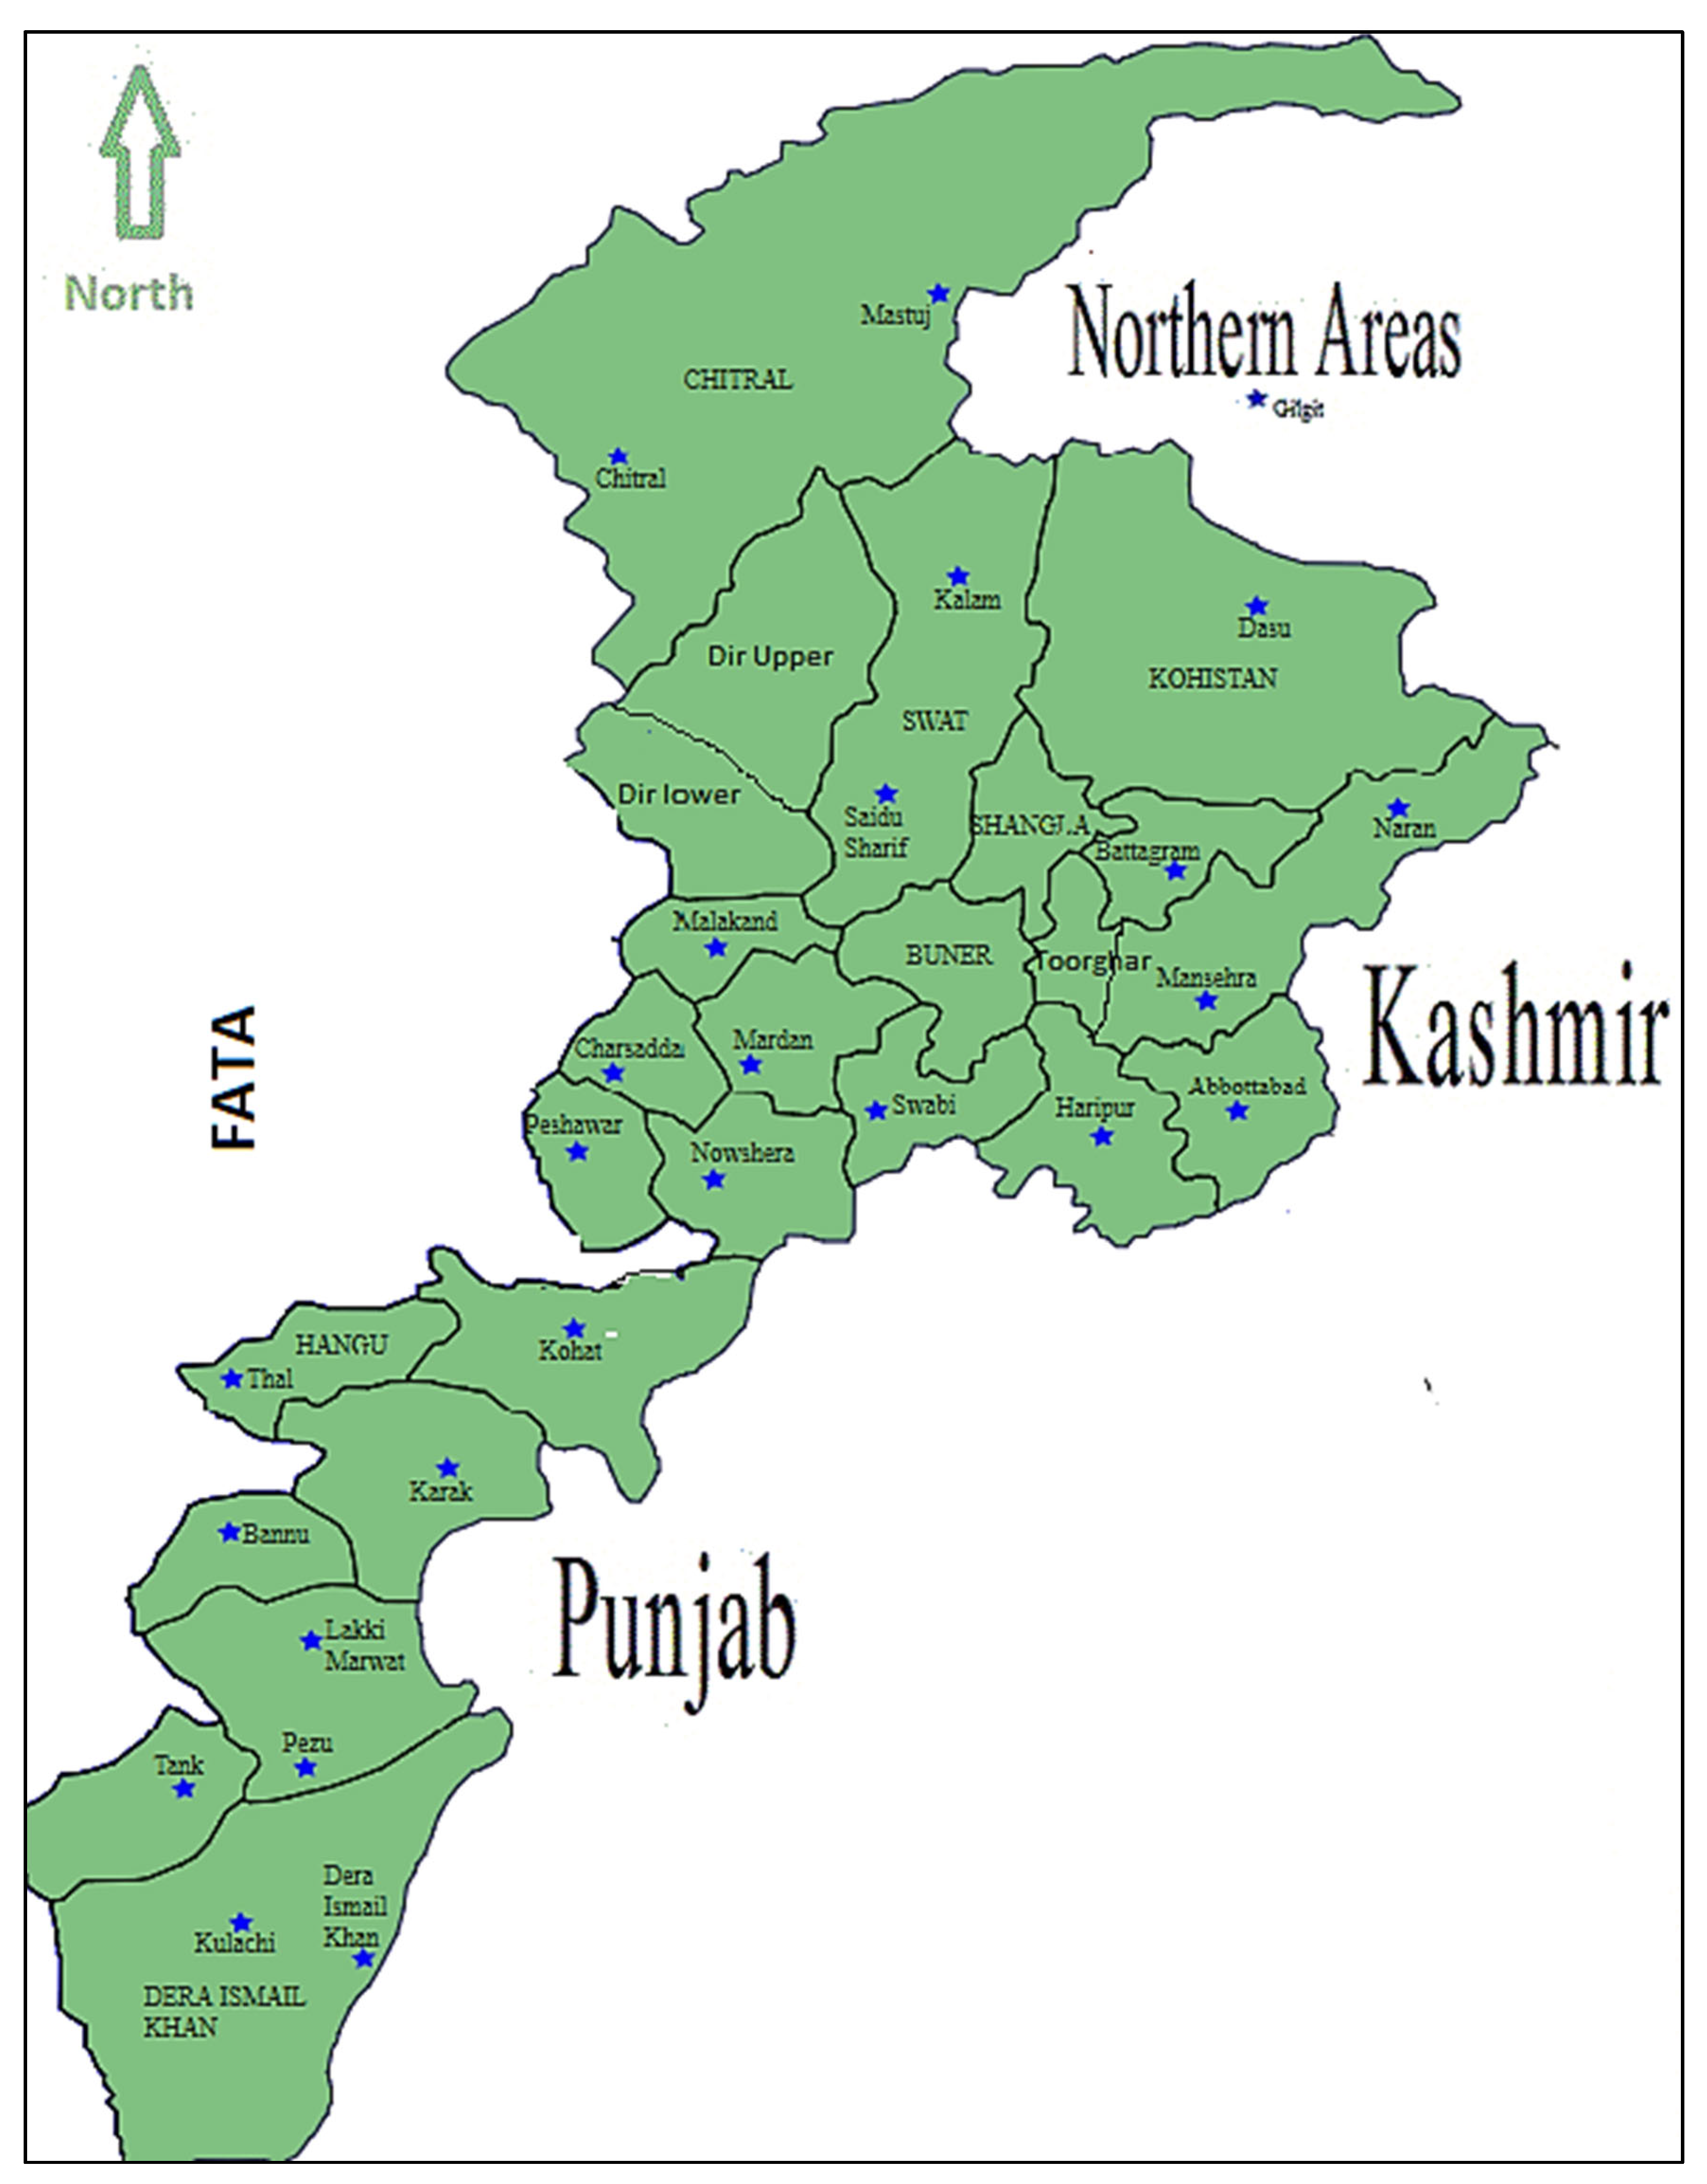
2.1. Study Area
2.2. Data Collection
2.3. Clusters Detection
3. Results and Discussion
4. Conclusions
Supplementary Materials
Author Contributions
Funding
Acknowledgments
Conflicts of Interest
References
- World Health Organization. Global Tuberculosis Report. 2019. Available online: https://www.who.int/tb/publications/global_report/en/ (accessed on 13 January 2020).
- World Health Organization Media Centre 2019. Tuberculosis: Key Facts. 2019. Available online: https://www.who.int/news-room/fact-sheets/detail/tuberculosis (accessed on 13 January 2020).
- World Health Organization Media Centre. 2018. Available online: https://www.who.int/en/news-room/fact-sheets/detail/tuberculosis (accessed on 5 October 2019).
- World Health Organization. Tuberculosis Country Profles. 2018. Available online: https//www.who.int/tb/country/data/profiles/en/ (accessed on 11 October 2019).
- NTP. National TB Control Program-Pakistan. 2019. Available online: http://ntp.gov.pk/national_data.php (accessed on 1 September 2019).
- Pakistan Bureau of Statistics. Pakistan’s 6th Census: Population of Major Cities Census. Available online: http://www.pbscensusgov.pk/ (accessed on 7 September 2019).
- World Health Organization. WHO Country Cooperation Strategy at a Glance: Pakistan. 2018. Available online: https://apps.who.int/iris/bitstream/10665/136607/1/ccsbrief_pak_en.pdf (accessed on 7 September 2019).
- National TB Control Program Pakistan (NTP). Available online: http://www.ntp.gov.pk/webdatabase.php (accessed on 7 September 2019).
- Falahuddin, S.; Khan, L.; Iqbal, M.; Salahuddin, N. Statistical analysis of various risk factors of tuberculosis in district Mardan, Pakistan. J. Biostat. Epidemiol. 2016, 2, 47–51. [Google Scholar]
- Khattak, I.; Mushtaq, M.H.; Ahmad, M.U.D.; Khan, M.S.; Haider, J. Zoonotic tuberculosis in occupationally exposed groups in Pakistan. Occup. Med. 2016, 66, 371–376. [Google Scholar] [CrossRef] [PubMed]
- Ahmad, H.; Ali, I.; Ahmad, T.; Tufail, M.; Ahmad, K.; Murtaza, B.N. Prevalence of Brucellosis in Human Population of District Swat, Pakistan. Pak. J. Zool. 2017, 49, 371–376. [Google Scholar] [CrossRef]
- Akhtar, N.; Saeed, K.; Khan, S.; Rafiq, N. Prevalence of Tuberculosis in District Buner Khyber Pakhtunkhwa, Pakistan. World J. Med. Sci. 2015, 12, 292–296. [Google Scholar]
- Ahmad, T.; Jadoon, M.A. Cross Sectional Study of Pulmonary Tuberculosis at Civil Hospital Thana, District Malakand Khyber Pakhtunkhwa Pakistan. World J. Zool. 2015, 10, 161–167. [Google Scholar]
- Ahmad, T.; Jadoon, M.A.; Khattak, M.N.K. Prevalence of sputum smear positive pulmonary tuberculosis at Dargai, District Malakand, Pakistan: A four year retrospective study. Egypt. J. Chest Dis. Tuberc. 2016, 65, 461–464. [Google Scholar] [CrossRef]
- Noorrahim, M.S.K.; Shahid, M.; Shah, A.; Shah, M.; Rafiullah, H.A. Prevalence of Tuberculosis in Livestock Population of District Charsadda by Tuberculin Skin Test (TST); Akinik Publications: Delhi, India, 2015. [Google Scholar]
- Basit, A.; Hussain, M.; Shahid, M.; Ayaz, S.; Rahim, K.; Ahmad, I.; Rehman, A.U.; Hassan, M.F.; Ali, T.; Au, R.; et al. Occurrence and risk factors associated with Mycobacterium tuberculosis and Mycobacterium bovis in milk samples from North East of Pakistan. Pak. Vet. J. 2018, 38, 199–203. [Google Scholar] [CrossRef]
- Ahmad, T.; Ahmad, S.; Haroon, M.Z.; Khan, A.; Salman, S.; Khan, N.; Gul, G. Epidemiological study of tuberculosis. Eur. Acad. Res. 2013, 1, 1855–1858. [Google Scholar]
- Ullah, S.; Daud, H.; Dass, S.C.; Fanaee-T, H.; Khalil, A. An Eigenspace approach for detecting multiple space-time disease clusters: Application to measles hotspots detection in Khyber-Pakhtunkhwa, Pakistan. PLoS ONE 2018, 13, e0199176. [Google Scholar] [CrossRef]
- Kulldorff, M.; Hjalmars, U. The Knox method and other tests for space-time interaction. Biometrics 1999, 55, 544–552. [Google Scholar] [CrossRef]
- Mantel, N. The detection of disease clustering and a generalized regression approach. Cancer Res. 1967, 27, 209–220. [Google Scholar] [PubMed]
- Roza, D.L.; Caccia-Bava, M.C.G.; Martinez, E.Z. Spatio-temporal patterns of tuberculosis incidence in Ribeirao Preto, state of Sao Paulo, southeast Brazil, and their relationship with social vulnerability: A Bayesian analysis. Rev. Soc. Bras. Med. Trop. 2012, 45, 607–615. [Google Scholar] [CrossRef] [PubMed]
- Liu, Y.; Li, X.; Wang, W.; Li, Z.; Hou, M.; He, Y.; Wu, W.; Wang, H.; Liang, H.; Guo, X. Investigation of space-time clusters and geospatial hot spots for the occurrence of tuberculosis in Beijing. Int. J. Tuberc. Lung Dis. 2012, 16, 486–491. [Google Scholar] [CrossRef] [PubMed]
- Kulldorff, M.; Athas, W.F.; Feuer, E.J.; Miller, B.A.; Key, C.R. Evaluating cluster alarms: A space-time scan statistic and brain cancer in Los Alamos, New Mexico. Am. J. Public Health 1998, 88, 1377–1380. [Google Scholar] [CrossRef]
- Kulldorff, M. Prospective time periodic geographical disease surveillance using a scan statistic. J. R. Stat. Soc. Ser. A-Stat. Soc. 2001, 164, 61–72. [Google Scholar] [CrossRef]
- Kulldorff, M.; Heffernan, R.; Hartman, J.; Assunção, R.; Mostashari, F. A space-time permutation scan statistic for disease outbreak detection. PLoS Med. 2005, 2, 0216–0224. [Google Scholar] [CrossRef]
- Fanaee-T, H.; Gama, J. An eigenvector-based hotspot detection. arXiv 2014, arXiv:1406.3191. Available online: https://arxiv.org/abs/1406.3191 (accessed on 7 September 2019).
- Xie, Z.; Yan, J. Kernel density estimation of traffic accidents in a network space. Comput. Environ. Urban Syst. 2008, 32, 396–406. [Google Scholar] [CrossRef]
- Birant, D.; Kut, A. ST-DBSCAN: An algorithm for clustering spatial–temporal data. Data Knowl. Eng. 2007, 60, 208–221. [Google Scholar] [CrossRef]
- Levine, N. Crime mapping and the Crimestat program. Geogr. Anal. 2006, 38, 41–56. [Google Scholar] [CrossRef]
- Wu, S.; Wu, F.; Hong, R.; He, J. Incidence analyses and space-time cluster detection of hepatitis C in Fujian province of China from 2006 to 2010. PLoS ONE 2012, 7, e40872. [Google Scholar] [CrossRef] [PubMed][Green Version]
- Zhu, B.; Liu, J.; Fu, Y.; Zhang, B.; Mao, Y. Spatio-temporal epidemiology of viral hepatitis in China (2003–2015): Implications for prevention and control policies. Int. J. Environ. Res. Public Health 2018, 15, 661. [Google Scholar] [CrossRef] [PubMed]
- Tadesse, S.; Enqueselassie, F.; Hagos, S. Spatial and space-time clustering of tuberculosis in Gurage Zone, Southern Ethiopia. PLoS ONE 2018, 13, e0198353. [Google Scholar] [CrossRef] [PubMed]
- Qi, L.; Tang, W.; Zhao, H.; Ling, H.; Su, K.; Zhao, H.; Li, Q.; Shen, T. Epidemiological characteristics and spatial-temporal distribution of hand, foot, and mouth disease in Chongqing, China, 2009–2016. Int. J. Environ. Res. Public Health 2018, 15, 270. [Google Scholar] [CrossRef] [PubMed]
- Desjardins, M.R.; Whiteman, A.; Casas, I.; Delmelle, E. Space-time clusters and co-occurrence of chikungunya and dengue fever in Colombia from 2015 to 2016. Acta Trop. 2018, 185, 77–85. [Google Scholar] [CrossRef] [PubMed]
- Low, G.K.; Papapreponis, P.; Isa, R.M.; Gan, S.C.; Chee, H.Y.; Te, K.K.; Hatta, N.M. Geographical distribution and spatio-temporal patterns of hospitalization due to dengue infection at a leading specialist hospital in Malaysia. Geospat. Health 2018, 13, 642. [Google Scholar] [CrossRef] [PubMed]
- Umer, M.F.; Zofeen, S.; Majeed, A.; Hu, W.; Qi, X.; Zhuang, G. Spatiotemporal Clustering Analysis of Malaria Infection in Pakistan. Int. J. Environ. Res. Public Health 2018, 15, 1202. [Google Scholar] [CrossRef]
- Zhao, F.; Cheng, S.; He, G.; Huang, F.; Zhang, H.; Xu, B.; Murimwa, T.C.; Cheng, J.; Hu, N.; Wang, L. Space-time clustering characteristics of tuberculosis in China, 2005–2011. PLoS ONE 2013, 8, e83605. [Google Scholar] [CrossRef]
- Kulldorff, M. A spatial scan statistic. Commun. Stat.-Theory Methods 1997, 26, 1481–1496. [Google Scholar] [CrossRef]
- District heath Information System. Quarter Reports. Available online: http://www.dhiskp.gov.pk/reports.php (accessed on 7 September 2019).
- District Health Information Khyber Pakhtunkhwa, Pakistan. Available online: http://www.dhiskp.gov.pk (accessed on 1 September 2019).
- SaTScan v9.6 March 2018. Available online: https://www.satscan.org (accessed on 1 September 2019).
- Kulldorff, M. SaTScan User Guid. 2018. Available online: https://www.satscan.org/techdoc.html (accessed on 1 September 2019).
- Kulldorff, M.; Nagarwalla, N. Spatial disease clusters: Detection and inference. Stat. Med. 1995, 14, 799–810. [Google Scholar] [CrossRef]
- BOS Khyber Pakhtunwa. Development Statistics of Khyber Pakhtunkhwa. 2019. Available online: https://kpbos.gov.pk/allpublication/1 (accessed on 1 September 2019).
- Malik, M.S.; Afzal, M.; Farid, A.; Khan, F.U.; Mirza, B.; Waheed, M.T. Disease Status of Afghan Refugees and Migrants in Pakistan. Front. Public Health 2019, 7, 185. [Google Scholar] [CrossRef] [PubMed]
- Smeda.org. Districts Profiles Khyber Pakhtunkhwa. Available online: https://smeda.org/index.php?option=com_phocadownload&view=category&id=1:district-profiles (accessed on 13 January 2020).
- Khan, J.A.; Irfan, M.; Zaki, A.; Beg, M.; Hussain, S.F.; Rizvi, N. Knowledge, attitude and misconceptions regarding tuberculosis in Pakistani patients. J. Pak. Med. Assoc. 2006, 56, 211. [Google Scholar] [PubMed]


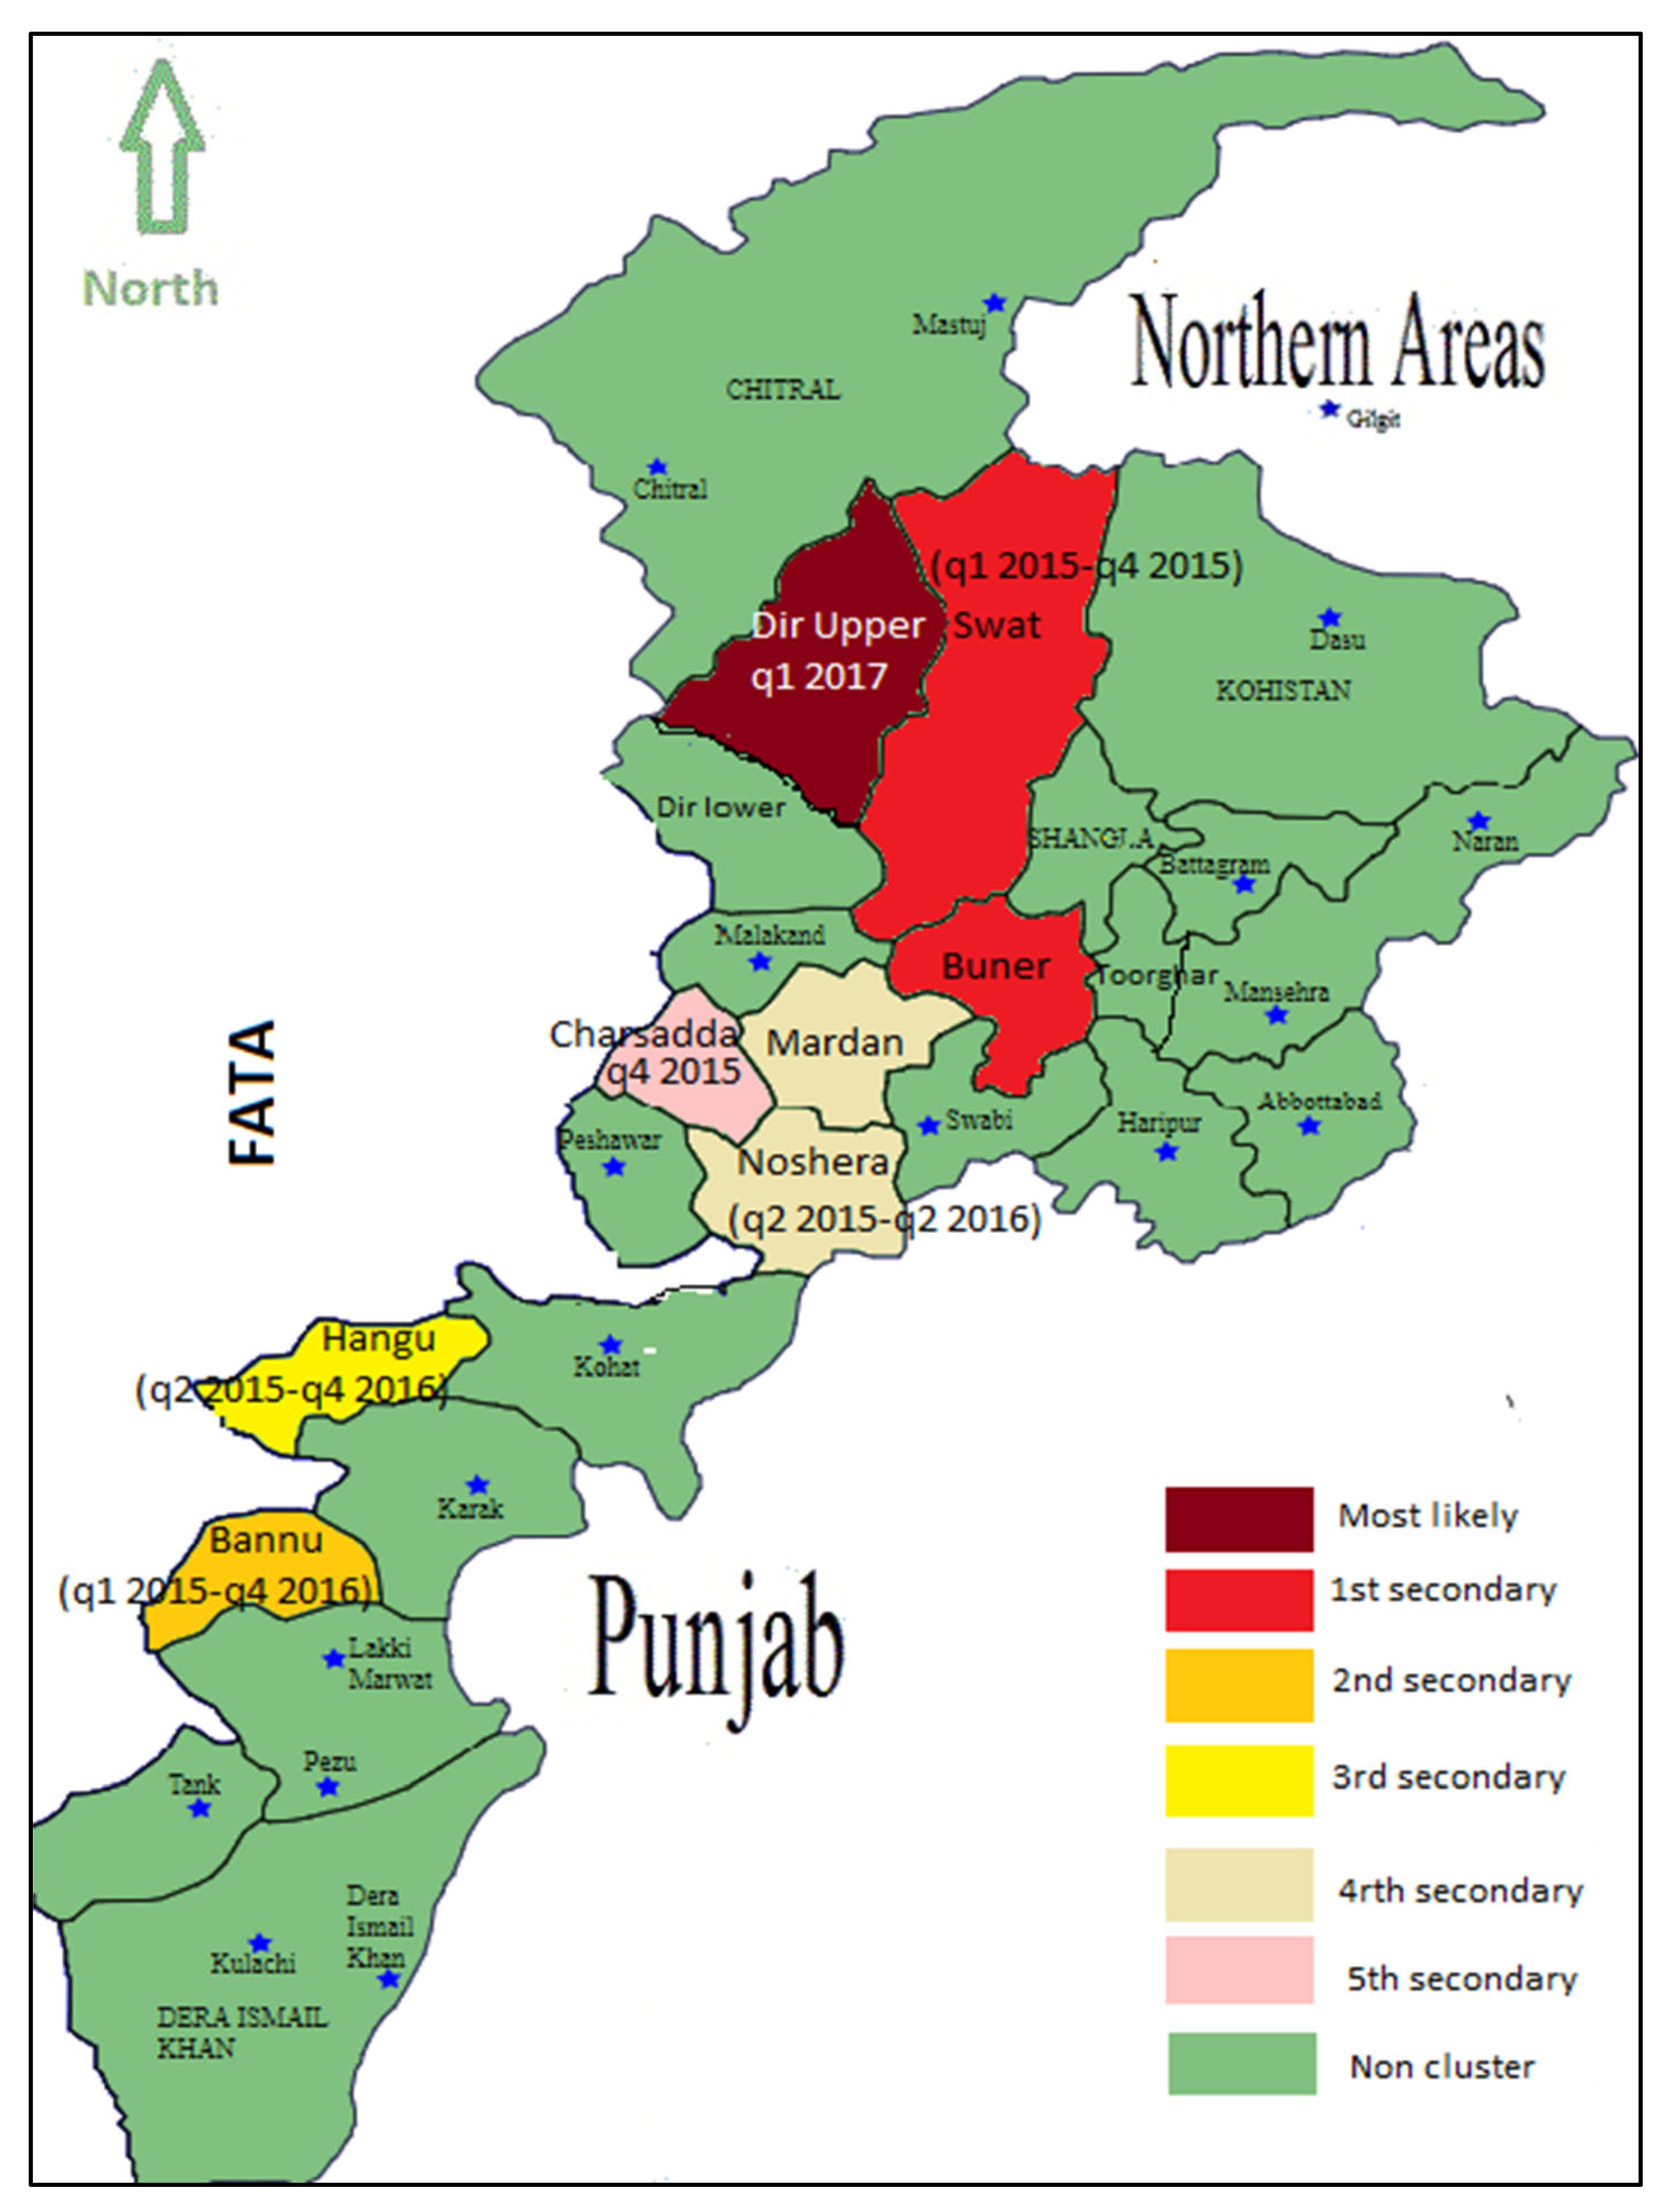
| Cluster Type | Districts | Number of Districts | Time-Frame | Observed Counts | Expected Counts | LLR | P-value |
|---|---|---|---|---|---|---|---|
| Most Likely | Dir Upper | 1 | 1st quarter 2017 | 10686 | 219.37 | 31541.8 | <0.001 |
| 1st secondary | Buner, Swat | 2 | 1st quarter 2015 to 4th quarter 2015 | 13019 | 2599.46 | 11044.8 | <0.001 |
| 2nd secondary | Bannu | 1 | 1st quarter 2015 to 4th quarter 2016 | 4495 | 2001.46 | 1170.532 | <0.001 |
| 3rd secondary | Hangu | 1 | 2nd quarter 2015 to 4th quarter 2016 | 2216 | 822.69 | 810.864 | <0.001 |
| 4th secondary | Noshera, Mardan | 2 | 2nd quarter2015 to 2nd quarter 2016 | 6356 | 4203.86 | 496.057 | <0.001 |
| 5th secondary | Charsadda | 1 | 4th quarter 2015 | 505 | 365.45 | 23.865 | <0.001 |
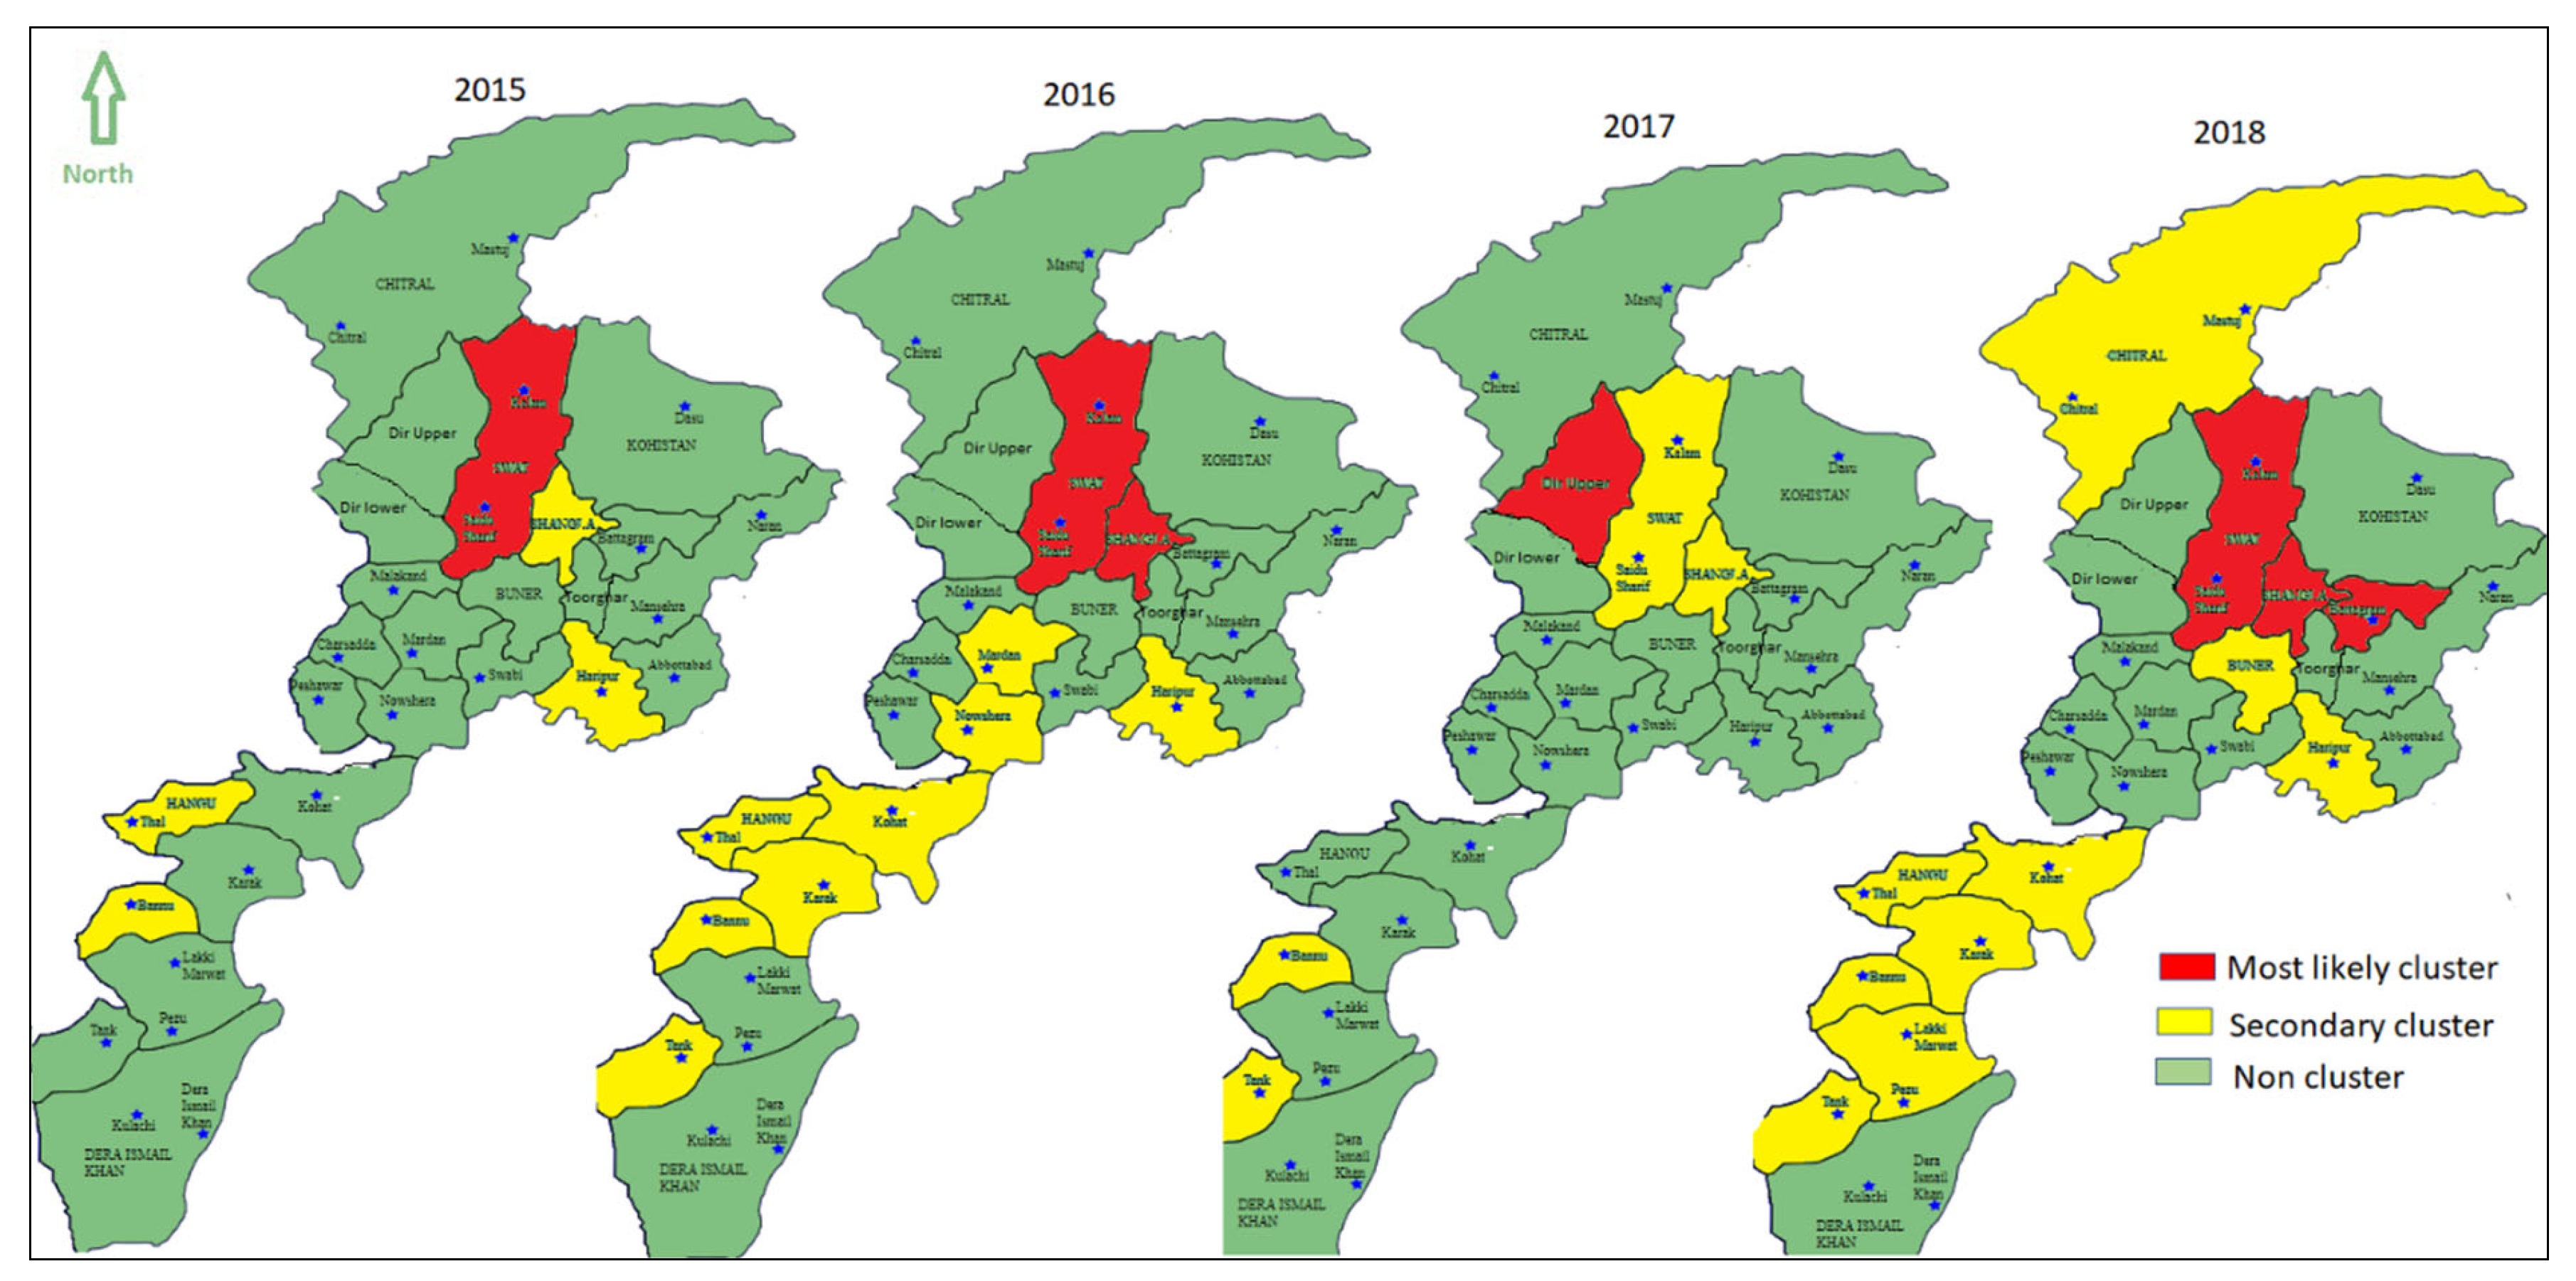
| Year | Cluster Type | Districts | Number of Districts | Observed Counts | Expected Counts | LLR | P-value |
|---|---|---|---|---|---|---|---|
| 2015 | Most likely | Swat | 1 | 12406 | 2500.81 | 11728.029 | <0.001 |
| 1st secondary | Bannu | 1 | 2435 | 1292.42 | 20.132 | <0.001 | |
| 2nd secondary | Hangu | 1 | 1022 | 616.25 | 113.73 | <0.001 | |
| 3rd secondary | Shangla | 1 | 1102 | 852.78 | 34.255 | <0.001 | |
| 4th secondary | Haripur | 1 | 1381 | 1181.37 | 16.602 | <0.001 | |
| 2016 | Most likely | Shangla, Swat | 2 | 4794 | 2363.25 | 1097.165 | <0.001 |
| 1st secondary | Karak, Hangu, Bannu, Kohat | 4 | 4814 | 2770.32 | 714.454 | <0.001 | |
| 2nd secondary | Noshera | 1 | 1891 | 1221.14 | 166.741 | <0.001 | |
| 3rd secondary | Mansehra | 1 | 1872 | 1350.35 | 95.685 | <0.001 | |
| 4th secondary | Tank | 1 | 568 | 332.69 | 69.656 | <0.001 | |
| 5th secondary | Mardan | 1 | 2371 | 2039.16 | 28.081 | <0.001 | |
| 6th secondary | Haripur | 1 | 1133 | 966.76 | 14.12 | <0.001 | |
| 7th secondary | Dir Lower | 1 | 1040 | 1002.26 | 0.731 | 0.997 | |
| 2017 | Most likely | Upper Dir | 1 | 11025 | 957.11 | 18802.163 | <0.001 |
| 1st secondary | Bannu | 1 | 2030 | 1181.08 | 262.797 | <0.001 | |
| 2nd secondary | Swat | 1 | 3053 | 2335.65 | 109.45 | <0.001 | |
| 3rd secondary | Tank | 1 | 573 | 396.31 | 35.082 | <0.001 | |
| 4th secondary | Shangla | 1 | 979 | 766.37 | 27.848 | <0.001 | |
| 5th secondary | Hangu | 1 | 599 | 524.66 | 5.125 | 0.065 | |
| 6th secondary | Haripur | 1 | 1069 | 1014.36 | 1.496 | 0.859 | |
| 2018 | Most likely | Shangla, Swat, Battagram | 3 | 7997 | 2672.79 | 4206.852 | <0.001 |
| 1st secondary | Bannu, Lakki Marwat, Karak, Hangu, Tank, Kohat | 7 | 5796 | 3510.64 | 759.992 | <0.001 | |
| 2nd secondary | Chitral | 1 | 605 | 337.39 | 87.288 | <0.001 | |
| 3rd secondary | Haripur | 1 | 946 | 756.46 | 22.787 | <0.001 | |
| 4th secondary | Mansehra | 1 | 1266 | 1173.85 | 3.72 | 0.183 | |
| 5th secondary | Dir Lower | 1 | 1153 | 1082.93 | 2.331263 | 0.570 |
© 2020 by the authors. Licensee MDPI, Basel, Switzerland. This article is an open access article distributed under the terms and conditions of the Creative Commons Attribution (CC BY) license (http://creativecommons.org/licenses/by/4.0/).
Share and Cite
Ullah, S.; Daud, H.; Dass, S.C.; Fanaee-T, H.; Kausarian, H.; Alamgir. Space-Time Clustering Characteristics of Tuberculosis in Khyber Pakhtunkhwa Province, Pakistan, 2015–2019. Int. J. Environ. Res. Public Health 2020, 17, 1413. https://doi.org/10.3390/ijerph17041413
Ullah S, Daud H, Dass SC, Fanaee-T H, Kausarian H, Alamgir. Space-Time Clustering Characteristics of Tuberculosis in Khyber Pakhtunkhwa Province, Pakistan, 2015–2019. International Journal of Environmental Research and Public Health. 2020; 17(4):1413. https://doi.org/10.3390/ijerph17041413
Chicago/Turabian StyleUllah, Sami, Hanita Daud, Sarat C. Dass, Hadi Fanaee-T, Husnul Kausarian, and Alamgir. 2020. "Space-Time Clustering Characteristics of Tuberculosis in Khyber Pakhtunkhwa Province, Pakistan, 2015–2019" International Journal of Environmental Research and Public Health 17, no. 4: 1413. https://doi.org/10.3390/ijerph17041413
APA StyleUllah, S., Daud, H., Dass, S. C., Fanaee-T, H., Kausarian, H., & Alamgir. (2020). Space-Time Clustering Characteristics of Tuberculosis in Khyber Pakhtunkhwa Province, Pakistan, 2015–2019. International Journal of Environmental Research and Public Health, 17(4), 1413. https://doi.org/10.3390/ijerph17041413