Serum Sclerostin But Not DKK-1 Correlated with Central Arterial Stiffness in End Stage Renal Disease Patients

 , , ,
, , , 

Abstract
1. Introduction
2. Results
3. Discussion
4. Conclusions
5. Materials and Methods
5.1. Patients
5.2. Anthropometric Analysis
5.3. Biochemical Investigations
5.4. Carotid-Femoral Pulse Wave Velocity Measurements
5.5. Statistical Analysis
Author Contributions
Funding
Acknowledgments
Conflicts of Interest
References
- Stevens, P.E.; Levin, A. Kidney Disease: Improving Global Outcomes Chronic Kidney Disease Guideline Development Work Group, M. Evaluation and management of chronic kidney disease: Synopsis of the kidney disease: Improving global outcomes 2012 clinical practice guideline. Ann. Intern. Med. 2013, 158, 825–830. [Google Scholar] [CrossRef] [PubMed]
- Foley, R.N.; Collins, A.J. The USRDS: What you need to know about what it can and can’t tell us about ESRD. CJASN 2013, 8, 845–851. [Google Scholar] [CrossRef] [PubMed]
- Hwang, S.J.; Lin, M.Y.; Chen, H.C.; Hwang, S.C.; Yang, W.C.; Hsu, C.C.; Chiu, H.C.; Mau, L.W. Increased risk of mortality in the elderly population with late-stage chronic kidney disease: A cohort study in Taiwan. Nephrol. Dial. Transplant. 2008, 23, 3192–3198. [Google Scholar] [CrossRef] [PubMed]
- Jono, S.; McKee, M.D.; Murry, C.E.; Shioi, A.; Nishizawa, Y.; Mori, K.; Morii, H.; Giachelli, C.M. Phosphate regulation of vascular smooth muscle cell calcification. Circ. Res. 2000, 87, E10–E17. [Google Scholar] [CrossRef] [PubMed]
- Vlachopoulos, C.; Aznaouridis, K.; Stefanadis, C. Prediction of cardiovascular events and all-cause mortality with arterial stiffness: A systematic review and meta-analysis. J. Am. Coll. Cardiol. 2010, 55, 1318–1327. [Google Scholar] [CrossRef] [PubMed]
- Blacher, J.; Guerin, A.P.; Pannier, B.; Marchais, S.J.; Safar, M.E.; London, G.M. Impact of aortic stiffness on survival in end-stage renal disease. Circulation 1999, 99, 2434–2439. [Google Scholar] [CrossRef]
- Moe, S.M.; Chen, N.X. Mechanisms of vascular calcification in chronic kidney disease. JASN 2008, 19, 213–216. [Google Scholar] [CrossRef]
- Morena, M.; Jaussent, I.; Dupuy, A.M.; Bargnoux, A.S.; Kuster, N.; Chenine, L.; Leray-Moragues, H.; Klouche, K.; Vernhet, H.; Canaud, B.; et al. Osteoprotegerin and sclerostin in chronic kidney disease prior to dialysis: Potential partners in vascular calcifications. Nephrol. Dial. Transplant. 2015, 30, 1345–1356. [Google Scholar] [CrossRef]
- Wang, J.H.; Lee, C.J.; Chen, M.L.; Yang, C.F.; Chen, Y.C.; Hsu, B.G. Association of serum osteoprotegerin levels with carotid-femoral pulse wave velocity in hypertensive patients. J. Clin. Hypertens. 2014, 16, 301–308. [Google Scholar] [CrossRef]
- Balemans, W.; Ebeling, M.; Patel, N.; Van Hul, E.; Olson, P.; Dioszegi, M.; Lacza, C.; Wuyts, W.; Van Den Ende, J.; Willems, P.; et al. Increased bone density in sclerosteosis is due to the deficiency of a novel secreted protein (SOST). Hum. Mol. Genet. 2001, 10, 537–543. [Google Scholar] [CrossRef]
- Zhu, D.; Mackenzie, N.C.; Millan, J.L.; Farquharson, C.; MacRae, V.E. The appearance and modulation of osteocyte marker expression during calcification of vascular smooth muscle cells. PLoS ONE 2011, 6, e19595. [Google Scholar] [CrossRef] [PubMed]
- Morales-Santana, S.; Garcia-Fontana, B.; Garcia-Martin, A.; Rozas-Moreno, P.; Garcia-Salcedo, J.A.; Reyes-Garcia, R.; Munoz-Torres, M. Atherosclerotic disease in type 2 diabetes is associated with an increase in sclerostin levels. Diabetes Care 2013, 36, 1667–1674. [Google Scholar] [CrossRef] [PubMed]
- Lv, W.; Guan, L.; Zhang, Y.; Yu, S.; Cao, B.; Ji, Y. Sclerostin as a new key factor in vascular calcification in chronic kidney disease stages 3 and 4. Int. Urol. Nephrol. 2016, 48, 2043–2050. [Google Scholar] [CrossRef]
- Qureshi, A.R.; Olauson, H.; Witasp, A.; Haarhaus, M.; Brandenburg, V.; Wernerson, A.; Lindholm, B.; Soderberg, M.; Wennberg, L.; Nordfors, L.; et al. Increased circulating sclerostin levels in end-stage renal disease predict biopsy-verified vascular medial calcification and coronary artery calcification. Kidney Int. 2015, 88, 1356–1364. [Google Scholar] [CrossRef]
- Yang, C.Y.; Chang, Z.F.; Chau, Y.P.; Chen, A.; Yang, W.C.; Yang, A.H.; Lee, O.K. Circulating Wnt/beta-catenin signalling inhibitors and uraemic vascular calcifications. Nephrol. Dial. Transplant. 2015, 30, 1356–1363. [Google Scholar] [CrossRef]
- Jean, G.; Chazot, C.; Bresson, E.; Zaoui, E.; Cavalier, E. High Serum Sclerostin Levels Are Associated with a Better Outcome in Haemodialysis Patients. Nephron 2016, 132, 181–190. [Google Scholar] [CrossRef]
- Claes, K.J.; Viaene, L.; Heye, S.; Meijers, B.; d’Haese, P.; Evenepoel, P. Sclerostin: Another vascular calcification inhibitor? J. Clin. Endocrinol. Metab. 2013, 98, 3221–3228. [Google Scholar] [CrossRef]
- Szulc, P.; Schoppet, M.; Rachner, T.D.; Chapurlat, R.; Hofbauer, L.C. Severe abdominal aortic calcification in older men is negatively associated with DKK1 serum levels: The STRAMBO study. J. Clin. Endocrinol. Metab. 2014, 99, 617–624. [Google Scholar] [CrossRef]
- Krediet, R.T.; Balafa, O. Cardiovascular risk in the peritoneal dialysis patient. Nat. Rev. Nephrol. 2010, 6, 451–460. [Google Scholar] [CrossRef]
- Sipahioglu, M.H.; Kucuk, H.; Unal, A.; Kaya, M.G.; Oguz, F.; Tokgoz, B.; Oymak, O.; Utas, C. Impact of arterial stiffness on adverse cardiovascular outcomes and mortality in peritoneal dialysis patients. Perit. Dial. Int. 2012, 32, 73–80. [Google Scholar] [CrossRef]
- Szeto, C.C.; Kwan, B.C.; Chow, K.M.; Leung, C.B.; Law, M.C.; Li, P.K. Prognostic value of arterial pulse wave velocity in peritoneal dialysis patients. Am. J. Nephrol. 2012, 35, 127–133. [Google Scholar] [CrossRef] [PubMed]
- London, G.M.; Safar, M.E.; Pannier, B. Aortic Aging in ESRD: Structural, Hemodynamic, and Mortality Implications. JASN 2016, 27, 1837–1846. [Google Scholar] [CrossRef] [PubMed]
- Chi, P.J.; Lin, Y.L.; Tasi, J.P.; Wang, C.H.; Hou, J.S.; Lee, C.J.; Hsu, B.G. Osteocalcin and carotid-femoral pulse wave velocity in patients on peritoneal dialysis. Tzu-Chi Med. J. 2019, 31, 23–28. [Google Scholar]
- Schram, M.T.; Henry, R.M.; van Dijk, R.A.; Kostense, P.J.; Dekker, J.M.; Nijpels, G.; Heine, R.J.; Bouter, L.M.; Westerhof, N.; Stehouwer, C.D. Increased central artery stiffness in impaired glucose metabolism and type 2 diabetes: The Hoorn Study. Hypertension 2004, 43, 176–181. [Google Scholar] [CrossRef] [PubMed]
- Kuang, D.W.; Li, C.L.; Kuok, U.I.; Cheung, K.; Lio, W.I.; Xin, J. Risk factors associated with brachial-ankle pulse wave velocity among peritoneal dialysis patients in Macao. BMC Nephrol. 2012, 13, 143. [Google Scholar] [CrossRef] [PubMed]
- Moester, M.J.; Papapoulos, S.E.; Lowik, C.W.; van Bezooijen, R.L. Sclerostin: Current knowledge and future perspectives. Calcif. Tissue Int. 2010, 87, 99–107. [Google Scholar] [CrossRef]
- Baron, R.; Kneissel, M. WNT signaling in bone homeostasis and disease: From human mutations to treatments. Nat. Med. 2013, 19, 179–192. [Google Scholar] [CrossRef]
- Pelletier, S.; Dubourg, L.; Carlier, M.C.; Hadj-Aissa, A.; Fouque, D. The relation between renal function and serum sclerostin in adult patients with CKD. CJASN 2013, 8, 819–823. [Google Scholar] [CrossRef]
- Cejka, D.; Jager-Lansky, A.; Kieweg, H.; Weber, M.; Bieglmayer, C.; Haider, D.G.; Diarra, D.; Patsch, J.M.; Kainberger, F.; Bohle, B.; et al. Sclerostin serum levels correlate positively with bone mineral density and microarchitecture in haemodialysis patients. Nephrol. Dial. Transplant. 2012, 27, 226–230. [Google Scholar] [CrossRef]
- Bonani, M.; Rodriguez, D.; Fehr, T.; Mohebbi, N.; Brockmann, J.; Blum, M.; Graf, N.; Frey, D.; Wuthrich, R.P. Sclerostin blood levels before and after kidney transplantation. Kidney Blood Press. Res. 2014, 39, 230–239. [Google Scholar] [CrossRef]
- Thambiah, S.; Roplekar, R.; Manghat, P.; Fogelman, I.; Fraser, W.D.; Goldsmith, D.; Hampson, G. Circulating sclerostin and Dickkopf-1 (DKK1) in predialysis chronic kidney disease (CKD): Relationship with bone density and arterial stiffness. Calcif. Tissue Int. 2012, 90, 473–480. [Google Scholar] [CrossRef] [PubMed]
- Kuo, T.H.; Lin, W.H.; Chao, J.Y.; Wu, A.B.; Tseng, C.C.; Chang, Y.T.; Liou, H.H.; Wang, M.C. Serum sclerostin levels are positively related to bone mineral density in peritoneal dialysis patients: A cross-sectional study. BMC Nephrol. 2019, 20, 266. [Google Scholar] [CrossRef] [PubMed]
- Miyaoka, D.; Inaba, M.; Imanishi, Y.; Hayashi, N.; Ohara, M.; Nagata, Y.; Kurajoh, M.; Yamada, S.; Mori, K.; Emoto, M. Denosumab Improves Glomerular Filtration Rate in Osteoporotic Patients With Normal Kidney Function by Lowering Serum Phosphorus. J. Bone Miner. Res. 2019, 34, 2028–2035. [Google Scholar] [CrossRef] [PubMed]
- Desjardins, L.; Liabeuf, S.; Oliveira, R.B.; Louvet, L.; Kamel, S.; Lemke, H.D.; Vanholder, R.; Choukroun, G.; Massy, Z.A.; European Uremic Toxin Work, G. Uremic toxicity and sclerostin in chronic kidney disease patients. Nephrol. Ther. 2014, 10, 463–470. [Google Scholar] [CrossRef]
- Hsu, B.G.; Liou, H.H.; Lee, C.J.; Chen, Y.C.; Ho, G.J.; Lee, M.C. Serum Sclerostin as an Independent Marker of Peripheral Arterial Stiffness in Renal Transplantation Recipients: A Cross-Sectional Study. Medicine 2016, 95, e3300. [Google Scholar] [CrossRef]
- Martinez-Moreno, J.M.; Munoz-Castaneda, J.R.; Herencia, C.; Oca, A.M.; Estepa, J.C.; Canalejo, R.; Rodriguez-Ortiz, M.E.; Perez-Martinez, P.; Aguilera-Tejero, E.; Canalejo, A.; et al. In vascular smooth muscle cells paricalcitol prevents phosphate-induced Wnt/beta-catenin activation. Am. J. Physiol. Ren. Physiol. 2012, 303, F1136–F1144. [Google Scholar] [CrossRef]
- Lee, C.J.; Wang, J.H.; Chen, M.L.; Yang, C.F.; Chen, Y.C.; Hsu, B.G. Serum osteoprotegerin is associated with arterial stiffness assessed according to the cardio-ankle vascular index in hypertensive patients. J. Atheroscler. Thromb. 2015, 22, 304–312. [Google Scholar] [CrossRef][Green Version]
- Williams, B.; Mancia, G.; Spiering, W.; Agabiti Rosei, E.; Azizi, M.; Burnier, M.; Clement, D.L.; Coca, A.; de Simone, G.; Dominiczak, A.; et al. 2018 ESC/ESH Guidelines for the management of arterial hypertension. Eur. Heart J. 2018, 39, 3021–3104. [Google Scholar] [CrossRef] [PubMed]


| Characteristics | All (n = 194) | Control (n = 120) | High AS (n = 74) | p |
|---|---|---|---|---|
| Age (years) | 61 (52–71) | 58 (47.5–67.5) | 65 (59 –73) | 0.0001 |
| Female, n (%) | 101 (52.1) | 69 (57.5) | 32 (43.2) | 0.075 |
| Dialysis duration (mo) | 48.5 (22–96) | 42.5 (18.5–96.5) | 57 (28–90) | 0.077 |
| BMI (Kg/m2) | 24.91 ± 4.82 | 24.58 ± 4.83 | 25.45 ± 4.80 | 0.226 |
| SBP (mmHg) | 142.29 ± 24.94 | 138.09 ± 25.54 | 149.11 ± 22.46 | 0.003 * |
| DBP (mmHg) | 79.66 ± 15.74 | 78.81 ± 14.84 | 81.05 ± 17.12 | 0.336 |
| cfPWV (m/s) | 9.0 (7.5–11.7) | 7.7 (7.0–8.9) | 12.3 (11.4–14.3) | <0.001 * |
| BUN (mg/dL) | 60 (50–70) | 60.0 (49.5–67.5) | 61.0 (50.0–71.0) | 0.564 |
| Creatinine (mg/dL) | 9.91 ± 2.67 | 9.90 ± 2.83 | 9.95 ± 2.43 | 0.901 |
| Calcium (mg/dL) | 9.02 ± 0.76 | 8.96 ± 0.71 | 9.11± 0.84 | 0.197 |
| IP (mg/dL) | 4.92 ± 1.34 | 4.94 ± 1.37 | 4.90 ± 1.29 | 0.842 |
| Albumin (mg/dL) | 4.06 (3.7–4.2) | 4.01 (3.70–4.30) | 4.10 (3.70–4.20) | 0.644 |
| TCH (mg/dL) | 154.73 ± 39.13 | 157.55 ± 40.58 | 150.15 ± 36.47 | 0.202 |
| TG (mg/dL) | 125 (87–197) | 114.0 (87.5–199.0) | 133.0 (87.0–189.0) | 0.473 |
| Glucose (mg/dL) | 120 (100–149) | 114.5 (97.0–142.0) | 131.0 (110.0–182.0) | 0.001 |
| CRP (mg/dL) | 0.32 (0.09–0.90) | 0.195 (0.06–0.780) | 0.465 (0.25–1.05) | 0.0001 * |
| iPTH (pg/mL) | 230.15 (89.91–486.30) | 252.15 (123.07–503.86) | 167.25 (73.01–434.10) | 0.111 |
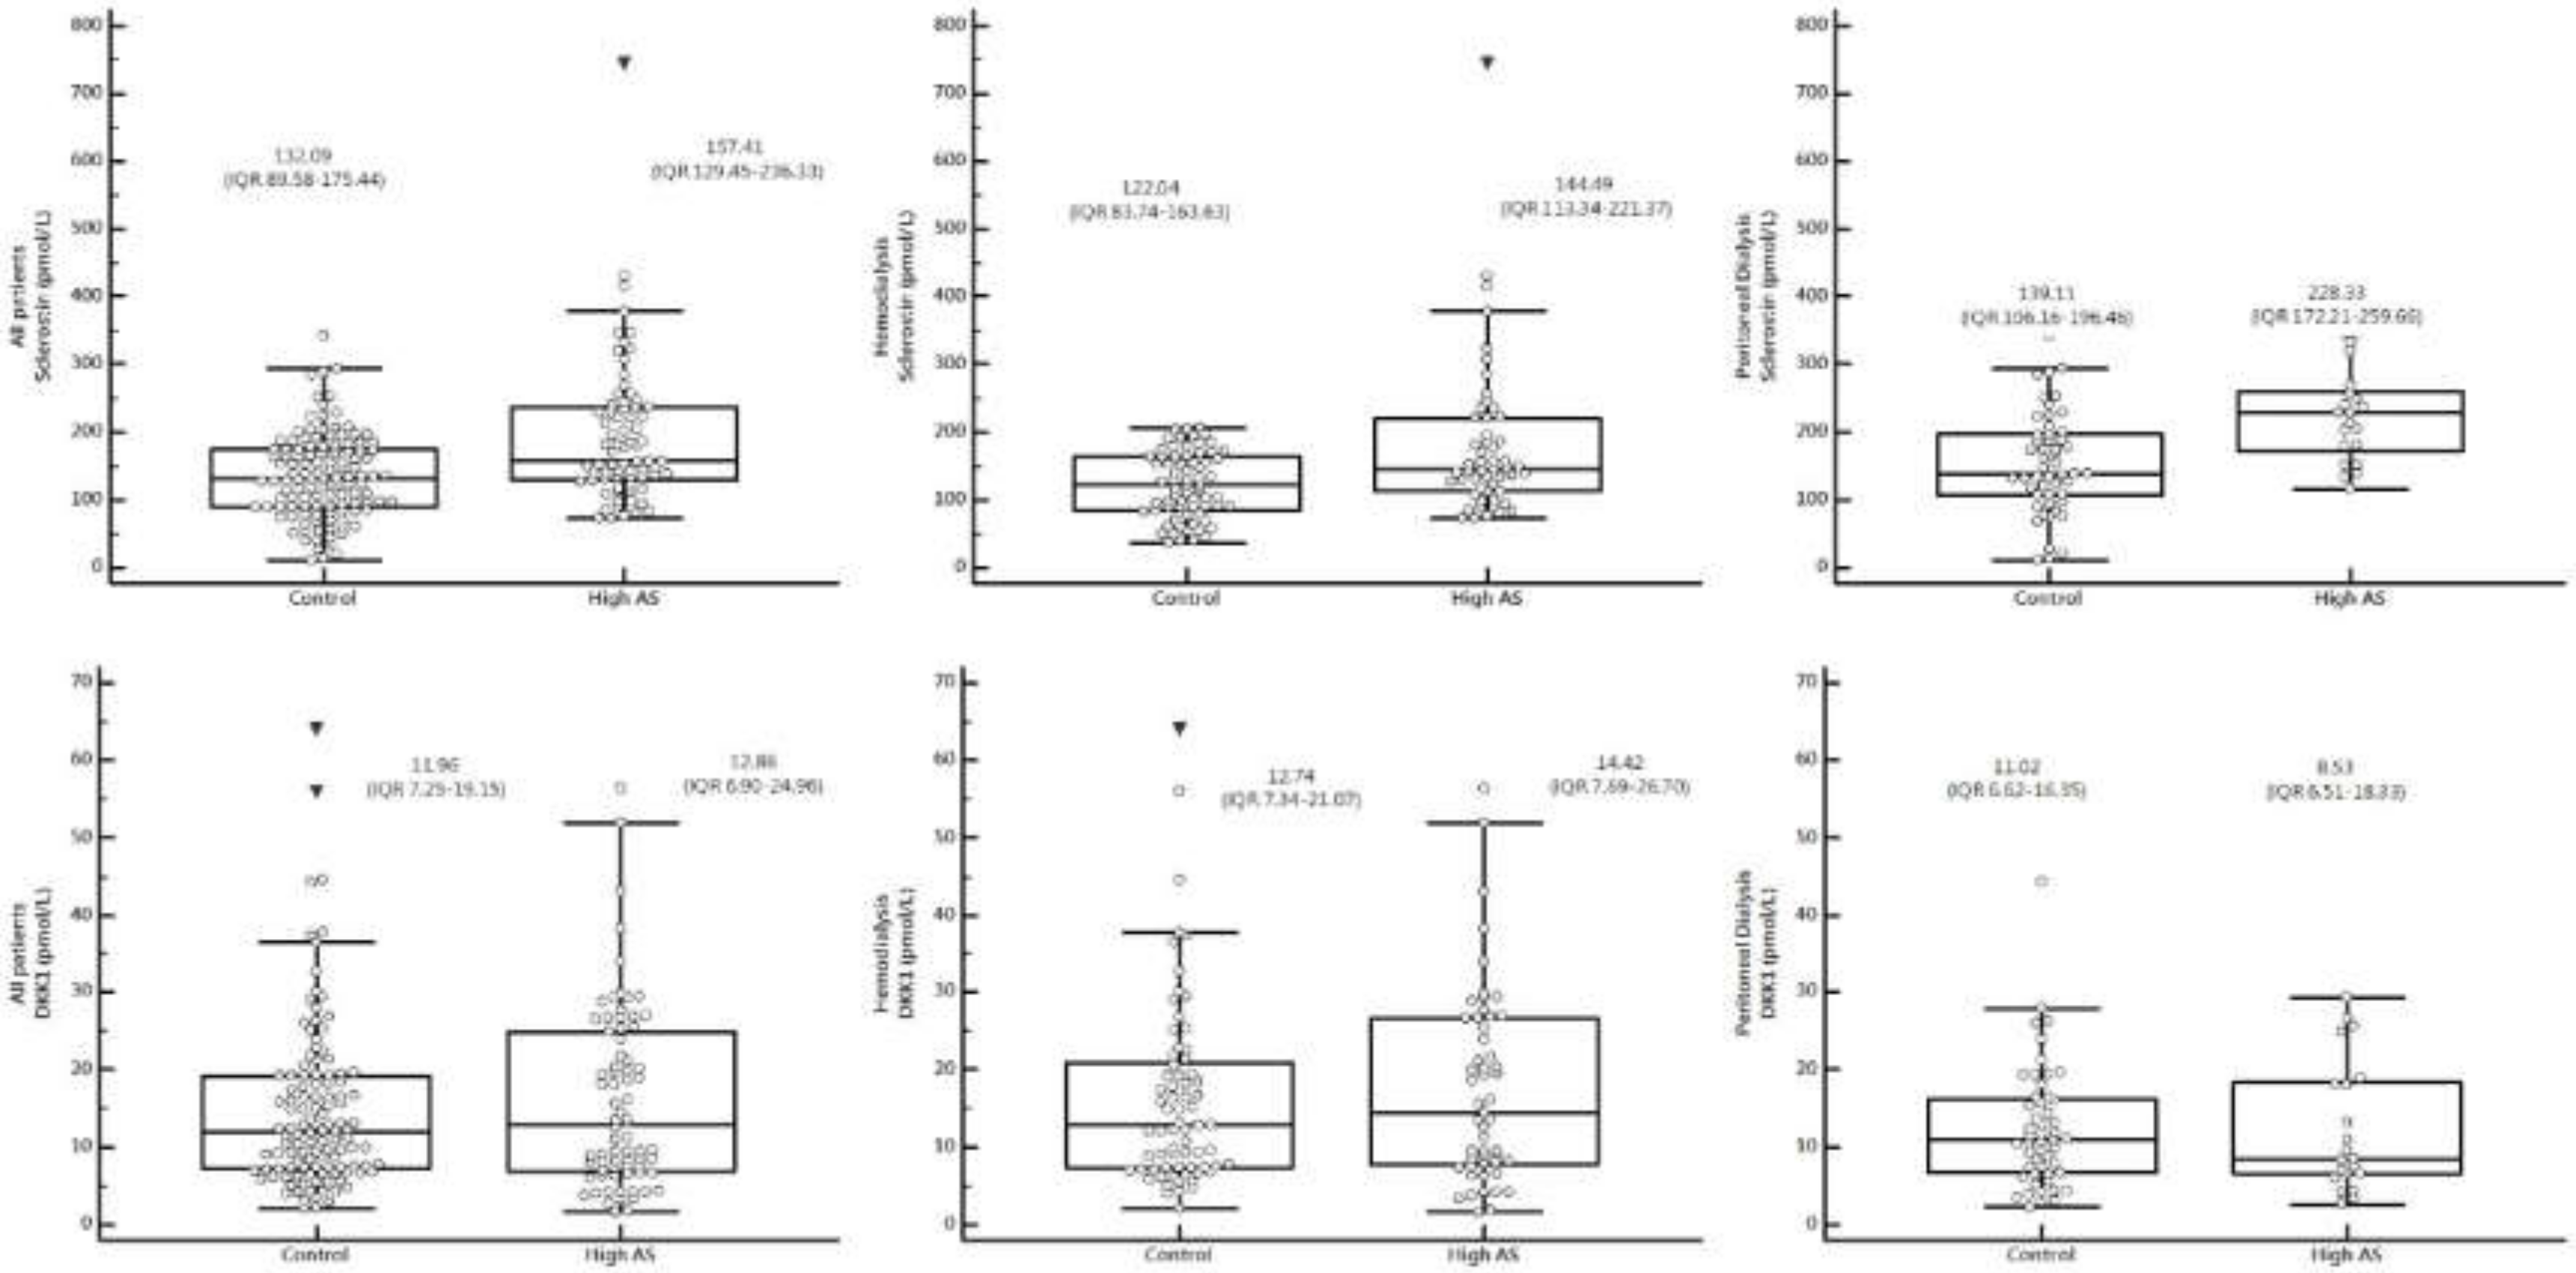
| Sclerostin (pmol/L) | 143.50 (97.21–191.7) | 132.09 (89.58–175.44) | 157.41 (129.45–236.33) | 0.0001 * |
| DKK-1 (pmol/L) | 12.08 (7.15–19.93) | 11.96 (7.25–19.15) | 12.86 (6.90–24.96) | 0.563 |
| Mode, n (%) | <0.001 | |||
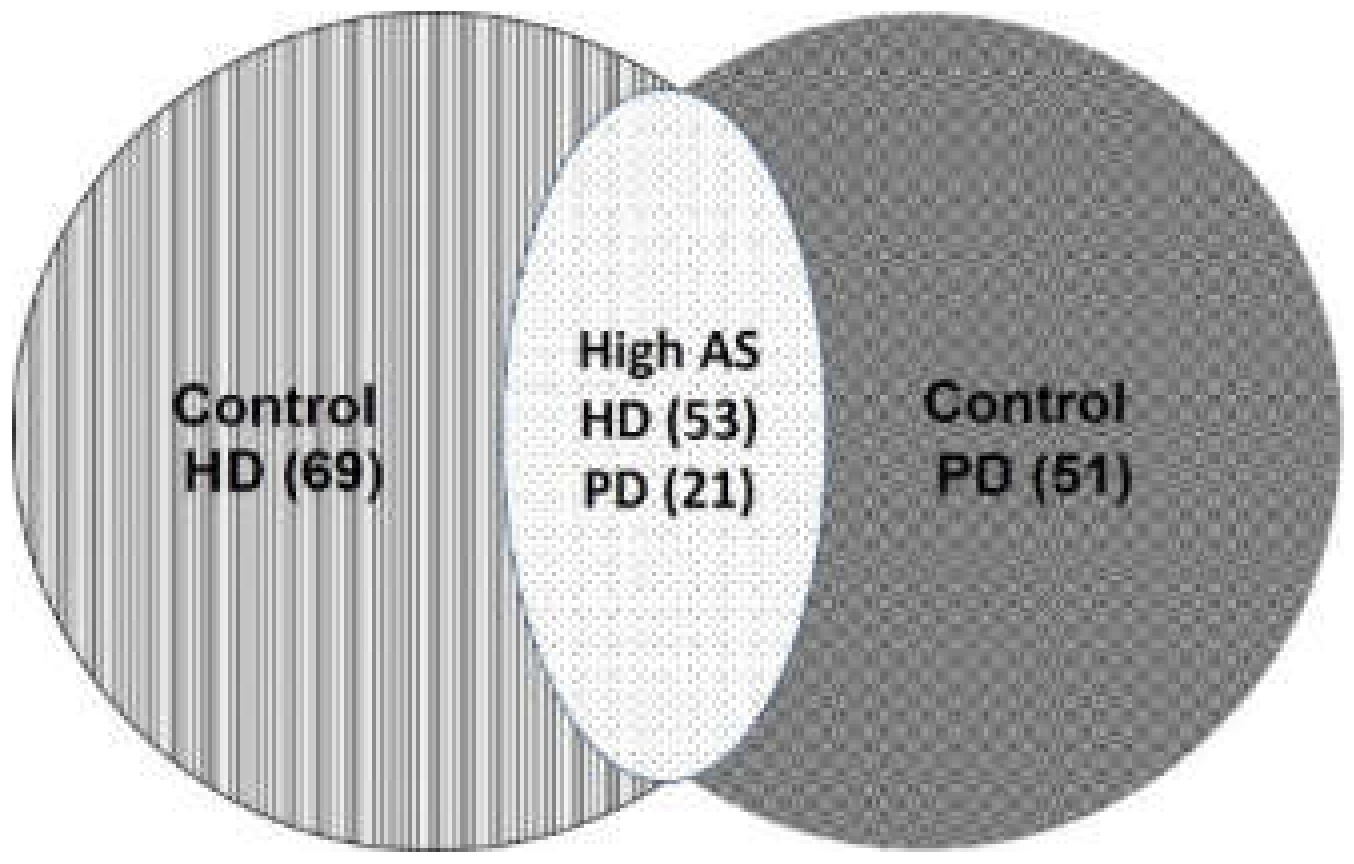
| PD | 72 (37.1) | 51 (70.8) | 21 (29.2) | |
| HD | 122 (62.9) | 69 (56.6) | 53 (43.4) | |
| Cormobidity n (%) | 0.003 | |||
| No | 48 (24.7) | 37 (30.8) | 11 (14.9) | |
| Diabetes mellitus | 64 (33.0) | 44 (36.7) | 20 (27.0) | |
| Hypertension | 25 (12.9) | 14 (11.7) | 11 (14.9) | |
| Both | 57 (29.4) | 25 (20.8) | 32 (43.2) | |
| ARB, n (%) | 66 (34.0) | 43 (35.8) | 27 (36.5) | 0.951 |
| β-blocker, n (%) | 63 (32.5) | 38 (31.7) | 25 (33.8) | 0.882 |
| CCB, n (%) | 82 (42.3) | 55 (45.8) | 27 (36.5) | 0.258 |
| Statin, n (%) | 40 (20.6) | 24 (20.0) | 16 (21.6) | 0.930 |
| Characteristics | All Patients (n = 122) | Control Group (n = 69) | High AS Group (n = 53) | p |
|---|---|---|---|---|
| Age (years) | 63.30 ± 12.14 | 60.58 ± 13.00 | 66.83 ± 9.98 | 0.004 * |
| Female, n (%) | 60 (49.2) | 37 (53.6) | 23 (43.4) | 0.263 |
| HD duration (mo) | 57.00 (25.53–119.34) | 58.20 (21.84–131.94) | 56.88 (26.70–104.82) | 0.857 |
| BMI (Kg/m2) | 24.92 ± 5.06 | 24.63 ± 5.28 | 25.29 ± 4.78 | 0.479 |
| DM, n (%) | 52 (42.6) | 19 (27.5) | 33 (62.3) | <0.001 * |
| HTN, n (%) | 59 (48.4) | 27 (39.1) | 32 (60.4) | 0.020 * |
| SBP (mmHg) | 142.47 ± 25.61 | 137.67 ± 26.59 | 148.72 ± 23.05 | 0.018 * |
| DBP (mmHg) | 76.74 ± 16.40 | 76.07 ± 15.63 | 77.60 ± 17.46 | 0.611 |
| cfPWV (m/s) | 10.07 ± 2.98 | 7.88 ± 1.17 | 12.92 ± 2.06 | <0.001 * |
| BUN (mg/dL) | 61.06 ± 15.61 | 60.77 ± 14.94 | 61.43 ± 16.58 | 0.816 |
| Creatinine (mg/dL) | 9.32 ± 2.07 | 9.36 ± 2.08 | 9.28 ± 2.09 | 0.836 |
| Calcium (mg/dL) | 9.00 ± 0.74 | 8.94 ± 0.71 | 9.07± 0.79 | 0.331 |
| IP (mg/dL) | 4.76 ± 1.26 | 4.75 ± 1.25 | 4.79 ± 1.29 | 0.862 |
| Albumin (mg/dL) | 4.17 ± 0.46 | 4.18 ± 0.47 | 4.16 ± 0.45 | 0.840 |
| TCH (mg/dL) | 144.65 ± 35.32 | 147.45 ± 39.38 | 141.00 ± 29.18 | 0.320 |
| TG (mg/dL) | 113.00 (85.50-187.00) | 106.00 (85.00–192.50) | 127.00 (85.00–184.00) | 0.437 |
| Glucose (mg/dL) | 130.50 (117.75–169.00) | 128.00 (106.50–153.50) | 137.00 (114.00–185.50) | 0.084 |
| CRP (mg/dL) | 0.41 (0.12–0.92) | 0.25 (0.08–0.79) | 0.59 (0.25–1.05) | 0.003 * |
| iPTH (pg/mL) | 204.05 (84.08–416.65) | 244.40 (121.90–445.05) | 157.60 (58.00–392.15) | 0.180 |
| Sclerostin (pmol/L) | 133.54 (90.52–175.17) | 122.04 (83.74–163.63) | 144.49 (113.34–221.37) | 0.002 * |
| DKK-1 (pmol/L) | 13.25 (7.40–22.61) | 12.74 (7.34–21.07) | 14.42 (7.69–26.70) | 0.586 |
| Urea reduction rate | 0.73 ± 0.04 | 0.74 ± 0.04 | 0.73 ± 0.04 | 0.689 |
| Kt/V (Gotch) | 1.34 ± 0.17 | 1.35 ± 0.17 | 1.33 ± 0.16 | 0.658 |
| ARB, n (%) | 36 (29.5) | 18 (26.1) | 18 (34.6) | 0.344 |
| β-blocker, n (%) | 38 (31.1) | 19 (27.5) | 19 (35.8) | 0.326 |
| CCB, n (%) | 47 (38.5) | 30 (43.5) | 17 (32.1) | 0.200 |
| Statin, n (%) | 20 (16.4) | 9 (13.0) | 11 (20.8) | 0.254 |
| Characteristic | All Participants (n = 72) | Control Group (n = 51) | High AS Group (n = 21) | p Value |
|---|---|---|---|---|
| Age (years) | 54.86 ± 16.11 | 51.61 ± 16.37 | 62.76 ± 12.59 | 0.007* |
| Female, n (%) | 41 (56.9) | 32 (62.7) | 9 (42.9) | 0.121 |
| PD vintage (months) | 46.07 ± 38.86 | 39.76 ± 38.66 | 61.38 ± 35.73 | 0.031 * |
| BMI (kg/m2) | 24.91 ± 4.43 | 24.52 ± 4.19 | 25.85 ± 4.92 | 0.249 |
| DM, n (%) | 30 (41.7) | 20 (39.2) | 10 (47.6) | 0.511 |
| HTN, n (%) | 62 (86.1) | 42 (82.4) | 20 (95.2) | 0.151 |
| CAPD, n (%) | 52 (72.2) | 36 (70.6) | 16 (76.2) | 0.630 |
| SBP (mmHg) | 142.00 ± 23.94 | 138.67 ± 24.31 | 150.10 ± 21.42 | 0.065 |
| DBP (mmHg) | 84.63 ± 13.25 | 82.51 ± 12.95 | 89.76 ± 12.87 | 0.034 * |
| cfPWV (m/s) | 9.08 ± 3.12 | 7.47 ± 1.69 | 12.98 ± 2.18 | < 0.001* |
| BUN (mg/dL) | 59.01 ± 18.65 | 58.57 ± 18.91 | 60.10 ± 18.39 | 0.755 |
| Creatinine (mg/dL) | 10.92 ± 3.24 | 10.62 ± 3.49 | 11.63 ± 2.45 | 0.235 |
| Calcium (mg/dL) | 9.04 ± 0.80 | 8.98 ± 0.73 | 9.18 ± 0.95 | 0.339 |
| IP (mg/dL) | 5.19 ± 1.43 | 5.20 ± 1.50 | 5.18 ± 1.28 | 0.964 |
| Albumin (mg/dL) | 3.74 ± 0.38 | 3.74 ± 0.42 | 3.73 ± 0.28 | 0.913 |
| TCH (mg/dL) | 171.81 ± 39.58 | 171.22 ± 38.46 | 173.24 ± 43.12 | 0.845 |
| TG (mg/dL) | 147.00 (91.50–212.75) | 139.00 (91.00–200.00) | 159.00 (108.00–232.50) | 0.511 |
| Glucose (mg/dL) | 105.00 (94.25–126.75) | 101.00 (91.00–120.00) | 117.00 (100.00–165.50) | 0.011 * |
| iPTH (pg/mL) | 250.05 (121.64–558.70) | 259.70 (120.20–585.90) | 229.20 (111.71–503.42) | 0.706 |
| CRP (mg/dL) | 0.26 (0.07–0.80) | 0.14 (0.06–0.69) | 0.32 (0.24–1.07) | 0.015 * |
| Sclerostin (pmol/L) | 173.91 (122.32–229.02) | 139.11 (106.16–196.46) | 228.33 (172.21–259.66) | <0.001 * |
| DKK-1 (pmol/L) | 10.55 (6.63–17.30) | 11.02 (6.62–16.35) | 8.53 (6.51–18.33) | 0.733 |
| Weekly Kt/V | 2.09 ± 0.43 | 2.15 ± 0.45 | 1.95 ± 0.33 | 0.070 |
| Peritoneal Kt/V | 1.74 ± 0.45 | 1.76 ± 0.46 | 1.71 ± 0.42 | 0.654 |
| Total CCr (l/week) | 59.66 ± 24.23 | 61.54 ± 25.66 | 55.09 ± 20.20 | 0.308 |
| Peritoneal CCr (l/week) | 42.33 ± 16.34 | 42.33 ± 16.88 | 42.35 ± 15.35 | 0.995 |
| ARB, n (%) | 30 (41.7) | 22 (43.1) | 8 (38.1) | 0.693 |
| β-blocker, n (%) | 25 (34.7) | 19 (37.3) | 6 (28.6) | 0.482 |
| CCB, n (%) | 35 (48.6) | 25 (49.0) | 10 (47.6) | 0.914 |
| Statin, n (%) | 20 (27.8) | 15 (29.4) | 5 (23.8) | 0.630 |
| Variables | OR | 95% CI | p | aOR | 95% CI | p |
|---|---|---|---|---|---|---|
| Age (years) | 1.052 | 1.025–1.079 | 0.0001 * | 1.064 | 1.032–1.098 | 0.0001 |
| Female | 0.563 | 0.314–1.011 | 0.055 | |||
| Dialysis duration | 1.002 | 0.997–1.007 | 0.448 | |||
| BMI | 1.038 | 0.977–1.102 | 0.226 | |||
| SBP (mmHg) | 1.019 | 1.006–1.031 | 0.003 | 1.017 | 1.003–1.032 | 0.018 |
| DBP (mmHg) | 1.009 | 0.991–1.028 | 0.335 | |||
| BUN (mg/dL) | 1.004 | 0.987–1.022 | 0.622 | |||
| Creatinine (mg/dL) | 1.007 | 0.904–1.122 | 0.900 | |||
| Calcium (mg/dL) | 1.286 | 0.877–1.885 | 0.198 | |||
| IP (mg/dL) | 0.978 | 0.787–1.215 | 0.841 | |||
| Albumin (mg/dL) | 1.228 | 0.669–2.257 | 0.508 | |||
| TCH (mg/dL) | 0.995 | 0.988–1.003 | 0.201 | |||
| TG (mg/dL) | 0.9996 | 0.997–1.002 | 0.764 | |||
| Glucose (mg/dL) | 1.010 | 1.004–1.016 | 0.001 | 1.008 | 1.002–1.015 | 0.016 |
| iPTH (pg/mL) | 0.9995 | 0.98–1.001 | 0.322 | |||
| CRP (mg/dL) | 1.915 | 1.248–2.937 | 0.003 | 2.109 | 1.196–3.717 | 0.001 |
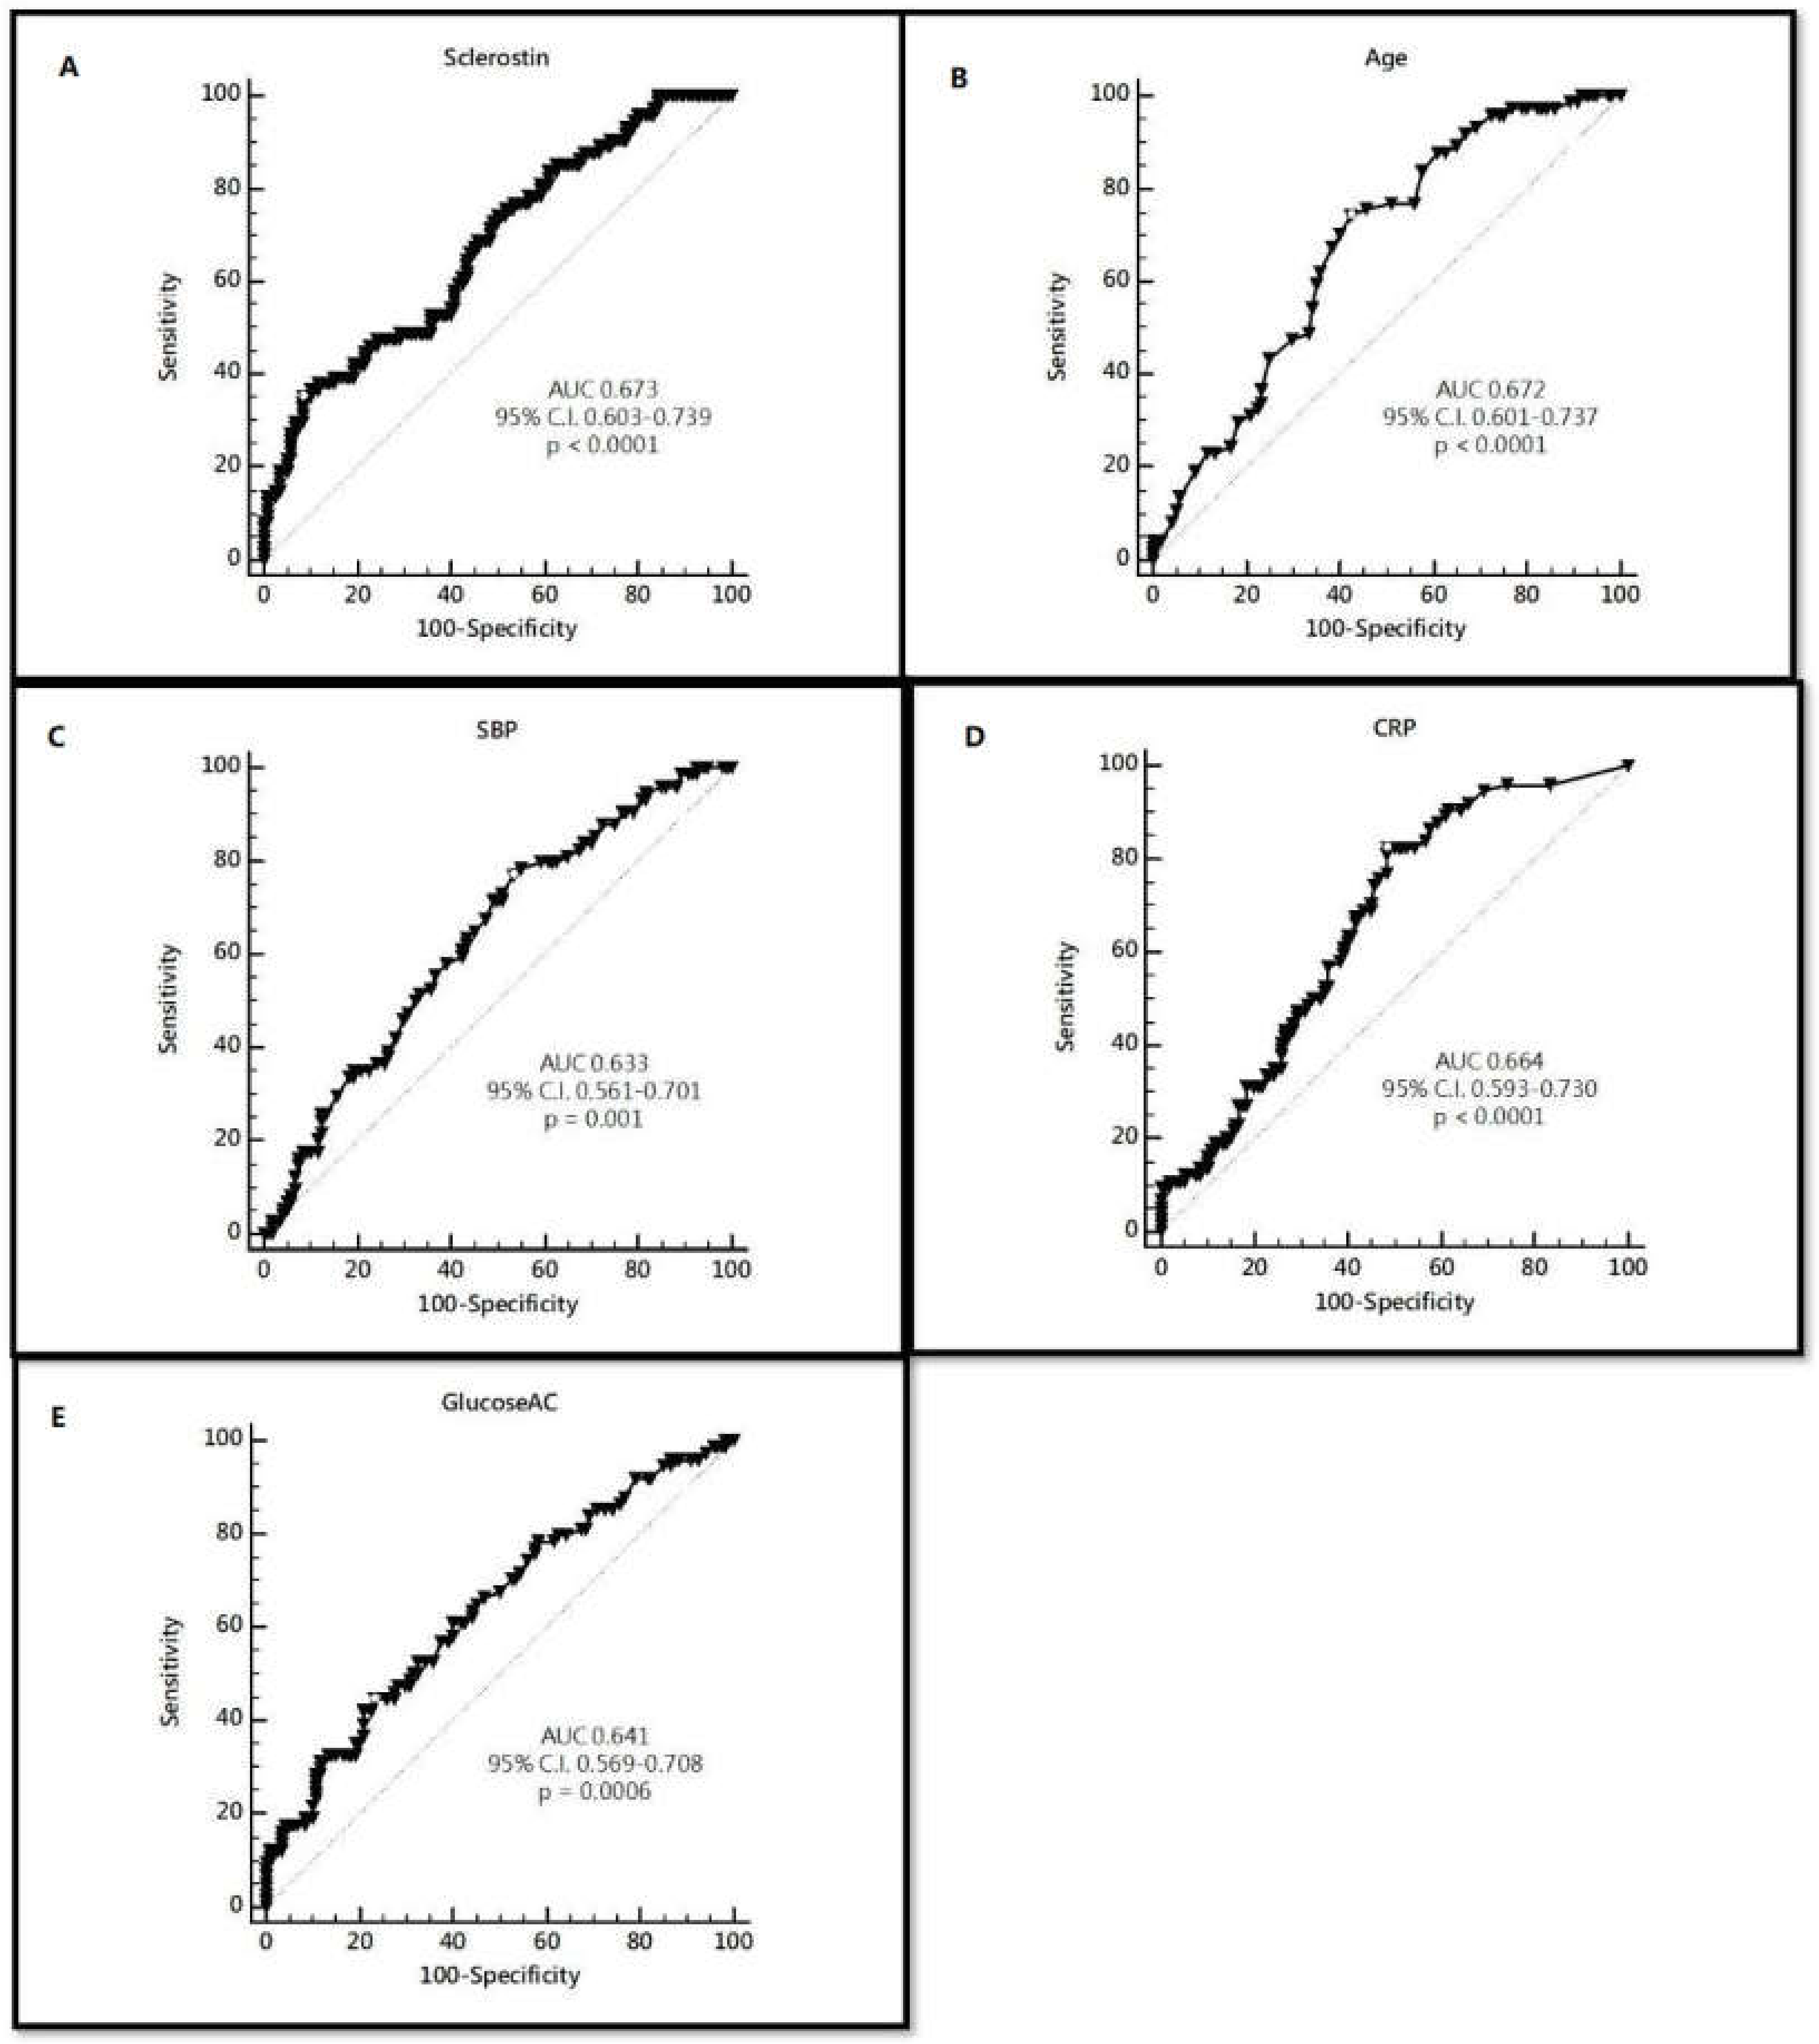
| Sclerostin (pmol/L) | 1.010 | 1.005–1.014 | <0.0001 | 1.012 | 1.006–1.017 | 0.0001 |
| DKK–1 (pmol/L) | 1.011 | 0.985–1.038 | 0.409 | |||
| Mode n (%) | ||||||
| PD | 1 | |||||
| HD | 1.865 | 1.002–3.473 | 0.049 | |||
| Comorbidity | ||||||
| No | 1 | |||||
| DM | 1.529 | 0.650–3.598 | 0.331 | |||
| HTN | 2.643 | 0.936–7.460 | 0.066 | |||
| Both | 4.306 | 1.836–10.099 | 0.0008 | |||
| ARB | 1.029 | 0.563–1880 | 0.927 | |||
| β-blocker | 1.101 | 0.594–2.039 | 0.760 | |||
| CCB | 0.679 | 0.374–1.230 | 0.201 | |||
| Statin | 1.103 | 0.542–2.248 | 0.786 | |||
| Variables | Criterion | Sensitivity | 95% CI | Specificity | 95% CI |
|---|---|---|---|---|---|
| Sclerostin | 208.64 | 35.14 | 24.4–47.1 | 91.67 | 85.2–95.9 |
| Age | 59 | 74.32 | 62.8–83.8 | 57.50 | 48.1–66.5 |
| SBP | 132 | 77.03 | 65.8–86.0 | 46.67 | 37.5–56.0 |
| CRP | 0.2 | 82.43 | 71.8–90.3 | 51.67 | 42.4–60.9 |
| Glucose | 142 | 44.59 | 33.0–56.6 | 76.67 | 68.1–83.9 |
© 2020 by the authors. Licensee MDPI, Basel, Switzerland. This article is an open access article distributed under the terms and conditions of the Creative Commons Attribution (CC BY) license (http://creativecommons.org/licenses/by/4.0/).
Share and Cite
Wu, C.-F.; Hou, J.-S.; Wang, C.-H.; Lin, Y.-L.; Lai, Y.-H.; Kuo, C.-H.; Liou, H.-H.; Tsai, J.-P.; Hsu, B.-G. Serum Sclerostin But Not DKK-1 Correlated with Central Arterial Stiffness in End Stage Renal Disease Patients. Int. J. Environ. Res. Public Health 2020, 17, 1230. https://doi.org/10.3390/ijerph17041230
Wu C-F, Hou J-S, Wang C-H, Lin Y-L, Lai Y-H, Kuo C-H, Liou H-H, Tsai J-P, Hsu B-G. Serum Sclerostin But Not DKK-1 Correlated with Central Arterial Stiffness in End Stage Renal Disease Patients. International Journal of Environmental Research and Public Health. 2020; 17(4):1230. https://doi.org/10.3390/ijerph17041230
Chicago/Turabian StyleWu, Chun-Feng, Jia-Sian Hou, Chih-Hsien Wang, Yu-Li Lin, Yu-Hsien Lai, Chiu-Huang Kuo, Hung-Hsiang Liou, Jen-Pi Tsai, and Bang-Gee Hsu. 2020. "Serum Sclerostin But Not DKK-1 Correlated with Central Arterial Stiffness in End Stage Renal Disease Patients" International Journal of Environmental Research and Public Health 17, no. 4: 1230. https://doi.org/10.3390/ijerph17041230
APA StyleWu, C.-F., Hou, J.-S., Wang, C.-H., Lin, Y.-L., Lai, Y.-H., Kuo, C.-H., Liou, H.-H., Tsai, J.-P., & Hsu, B.-G. (2020). Serum Sclerostin But Not DKK-1 Correlated with Central Arterial Stiffness in End Stage Renal Disease Patients. International Journal of Environmental Research and Public Health, 17(4), 1230. https://doi.org/10.3390/ijerph17041230