Abstract
The biological denitrification process is extensively discussed in scientific literature. The process requires anoxic conditions, but the influence of residual dissolved oxygen (DO) on the efficiency is not yet adequately documented. The present research aims to fill this gap by highlighting the effects of DO on the specific denitrification rate (SDNR) and consequently on the efficiency of the process. SDNR at a temperature of 20 °C (SDNR20°C) is the parameter normally used for the sizing of the denitrification reactor in biological-activated sludge processes. A sensitivity analysis of SNDR20°C to DO variations is developed. For this purpose, two of the main empirical models illustrated in the scientific literature are taken into consideration, with the addition of a deterministic third model proposed by the authors and validated by recent experimentations on several full-scale plants. In the first two models, SDNR20°C is expressed as a function of the only variable food:microrganism ratio in denitrification (F:MDEN), while in the third one, the dependence on DO is made explicit. The sensitivity analysis highlights all the significant dependence of SDNR20°C on DO characterized by a logarithmic decrease with a very pronounced gradient in correspondence with low DO concentrations. Moreover, the analysis demonstrates the relatively small influence of F:MDEN on the SDNR20°C and on the correlation between SDNR20°C and DO. The results confirm the great importance of minimizing DO and limiting, as much as possible, the transport of oxygen in the denitrification reactor through the incoming flows and mainly the mixed liquor recycle. Solutions to achieve this result in full-scale plants are reported.
1. Introduction
As is known, the nitrogen contained in wastewater can be removed with physicochemical or biological processes. The most known usage of physicochemical processes consists of the removal of ammonia from industrial wastewaters by stripping [1,2,3,4,5,6,7,8,9]. Most of the other physicochemical processes are essentially based on ammonia oxidation. Currently, they are mainly confined to the research area [5,10,11,12]. By contrast, biological processes (both suspended and attached biomasses) are largely used for nitrogen removal from sewage and several industrial wastewaters due to their greater cost-effectiveness.
Currently, biological pre-denitrification, in activated sludge processes, is the most widely used technology. As shown in Figure 1, it consists of an anoxic reactor (DEN) located upstream of the aerobic oxidizing–nitrifying reactor (OX-NIT) which is responsible for the removal of biochemical oxygen demand (BOD5) and for the nitrification of total Kjeldhal nitrogen (TKN) [13,14,15,16,17,18,19,20,21,22,23,24,25,26].
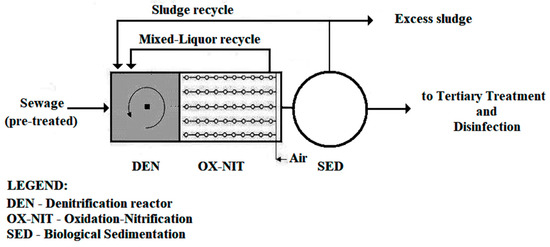
Figure 1.
Simplified layout of a biological treatment plant with pre-denitrification [18].
The pre-denitrification process is based on the activity of heterotrophic bacteria capable of reducing nitrates to nitrogen through the biochemical use of the biodegradable organic substrate present in the wastewater [18,19]. The process is very well known and is very reliable from the operational point of view. Research in this field is mainly aimed at the study of models for the optimal sizing of the denitrification reactor. Other important lines of research concern the study of the influence of various operational parameters on the process efficiency. Specifically, the most important parameters are temperature, sludge loading, residual dissolved oxygen (DO), hydrodynamic behavior of the reactor, the fluctuations of raw wastewater loads, and also the alternative organic matrices that can be used for the reduction of nitrates in case of particular industrial wastewaters.
In the past, the design of the biological pre-denitrification reactor was based on the knowledge of the denitrification rate at 20 °C, which was supposed to be characterized by a zero-order kinetics (for both nitrate and organic substrates). The denitrification rate at the real temperature T of the mixed liquor, (rDEN)T (gNO3-N h−1 kgMLVSS−1), was calculated by the Arrhenius equation [27]:
where:
- (rDEN)20°C is the denitrification rate at 20 °C, equal to 2.9 ÷ 3.0 gNO3-N h−1 kgMLVSS−1;
- θ is the temperature coefficient: θ = 1.026 (US-EPA, 2009); θ = 1.07 [28].
This criterion is still used nowadays, even if a more extended equation which also keeps in consideration the influence of both the substrates (NO3-N and BOD5) and the DO is preferred.
A more recent approach to the sizing of the denitrification reactor is based on the calculation of the specific denitrification rate (SDNR) defined as follows:
where:
- SDNRT is the specific denitrification rate at the temperature T (kgNO3-N·kgMLVSS−1·d−1);
- SDNR20°C is the specific denitrification rate at the temperature of 20 °C (kgNO3-N·kgMLVSS−1·d−1);
- Q·ΔN is the load of nitrogen removed in denitrification (kg·d−1);
- MLVSS is the mixed liquor volatile suspended solids in denitrification (kgVSS·m−3);
- T is the temperature of mixed liquor (°C).
Indeed, the SDNRT is the sum of two contributions: the dissimilative denitrification (biochemical reduction of nitrate to nitrogen) and assimilative denitrification (cell synthesis). Once the value of SDNR20°C is known, it is possible to calculate the volume of the denitrification reactor through the Equations (2) and (3).
Several models are proposed in the literature for the calculation of SDNR20°C, and most of them are empirical. These models express SDNR20°C as a function of variables and constants which theoretically should consider all the factors influencing the denitrification kinetics [29,30,31,32,33].
As is known, the biological denitrification process requires anoxic conditions. The influence of dissolved oxygen on the efficiency of the denitrification process has been reported by several studies. Already in 1972, Dawson and Murphy [34] had found a DO inhibition on denitrification at DO concentrations of 0.20 mg/L. Other studies have evidenced the effect of DO inhibition [35,36,37,38]. In particular, Oh and Silverstein [38] proved a significant inhibition effect at DO concentration as low as 0.09 mg/L with a correspondent 35% reduction of the denitrification rate. Moreover, the United States Environmental Protection Agency, EPA, has confirmed in its reports the denitrification rate with a dependency from DO [39,40]. Later, the strong influence of DO was demonstrated experimentally on pilot plants and full-scale plants [41,42]. Despite this specific scientific information, there is currently a need to have full knowledge of the influence of DO, at different concentrations, on the SDNR20 °C. The present research aims to fill this gap by highlighting the sensitivity of SDNR20°C toward DO in denitrification. For this purpose, three of the most effective calculation models proposed by the scientific literature have been used. Two of these models are empirical and still widely used in plant design today. The third model is more recent and noteworthy as, for the first time, it makes the dependence on DO explicit.
2. Materials and Methods
The three SDNR20°C models on which the sensitivity analysis is based are illustrated below:
- Model I: It is described in Tchobanoglous [28]. It is very simple and consists of an empirical correlation of SDNR20°C with only the sludge loading in DEN (F:MDEN). It was largely used for the sizing of denitrification reactors. This model does not make explicit the influence of residual DO in denitrification; as such, it does not consider the DO as a limiting factor of denitrification kinetic at the relatively small DO concentrations (about 0.25–0.40 mg L−1) that occur on well-designed and well-managed full-scale plants.
- Model II: The US EPA [39] proposed a very similar equation but applied a correction factor Fb to the F:MDEN in order to take into account the deviation of the active fraction of biomass in the mixed liquor from the reference value of 0.3.The correction factor Fb depends on the solid retention time (SRT).where:Fb = Active fraction of MLVSS;YH = Heterotrophic biomass synthesis yield, 0.47 g VSS/g BOD5;bT = Endogenous decay rate at temperature T of mixed liquor, g VSS/g VSS d;b20 = Endogenous decay rate at 20 °C = 0.10 g VSS/g VSS d;YI = Inert VSS fraction in the influent, g VSS inert/g BOD5.The influent inert fraction YI can greatly influence the active biomass fraction of the MLVSS. Values for YI generally fall in the range 0.10–0.30 for plants with primary treatment and 0.30–0.50 for plants without primary treatment [19].In plants with high efficiency for both nitrification and denitrification, the solid retention time can be assumed to be in the range of 18–20 days [43,44]. With SRT = 20, the factor is Fb = 0.35.
- Model III: This model was developed by the authors on a deterministic basis [41]. It is characterized by the explicit influence of DO as well as of the F:MDEN. The model was first validated by a pilot plant experimentation (sewage flow rate Q = 1.5–2.5 m3·h−1 variable along the experimentation) and subsequently by testing eight full-scale installations of different capacity (from 10,000 eq. inhab. to 320,000 eq. inhab.) [42]. Please refer to these last two citations for each research detail that led to the elaboration and validation of the model.where:
- K′O DO inhibition constant = 0.18 mgO2 L−1;
- ηBOD = 0.85–0.95 depending on the values assumed by F:MDEN.
The experimental results obtained on the full-scale plants experimentations demonstrated the ability of the model to calculate the SDNR20°C at any DO and F:MDEN values. At the same time, it is correct to note that the model has shown a modest reduction in its reliability for small capacity plants (indicatively of less than 30,000 eq. inhab.). This effect is probably determined by the greater fluctuations of the organic load fed to the plants, such as to determine a significant instability of the BOD5/NO3-N ratio in denitrification, compared to the optimal value of BOD5/NO3-N = 4. SDNR20°C proved a very strong sensitivity to DO, mainly in correspondence of low DO concentrations (e.g., less than 0.2 mg L−1).
The sensitivity analysis was conducted through the graphical representation of the correlation between and DO for the three models. The examination of Model III was then deepened by representing it for a wide range of DO values. Finally, the derivative δ/δ DO of this model was also checked, in order to have a direct observation of the response of to the variations of the variable DO.
3. Results and Discussion
Figure 2 shows the trend of SDNR20°C as a function of DO in the denitrification reactor, according to the three models under study. The F:MDEN is set to 0.3 kgBOD5·kgMLVSS−1·d−1, a typical operating value of many full-scale plants. As Models I and II are constructed independently from DO, they are represented by a horizontal straight line. Instead, Model III shows a typically logarithmic trend, with a very strong gradient especially at low DO values (DO < 0.2–0.3 mg L−1). Then, the gradient tends progressively to reduce as DO increases. The inhibition effect exerted by DO is strongly conditioned by the phenomenon of oxygen transport from the core of the mixed liquor toward the inside of the activated sludge flocs. In the presence of small concentrations of DO, this phenomenon of penetration is strongly slowed down, so as to favor the creation of anoxic macrozones where the activity of denitrifying heterotrophic bacteria develops. In this sense, the great variability of SDNR20°C at different concentrations of DO is partly explained.
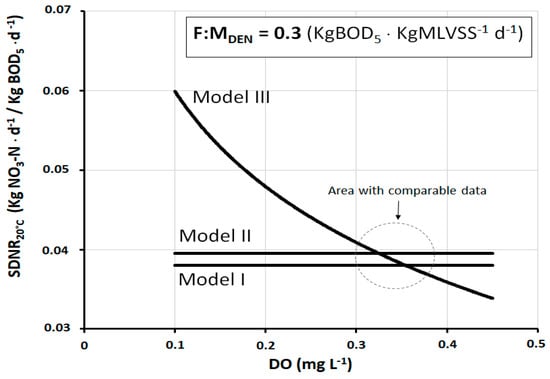
Figure 2.
SDNR20°C as a function of dissolved oxygen (DO), at F:MDEN = 0.3 kgBOD5·kgMLVSS−1·d−1, according to the three different calculation models.
As can be observed, the difference between the models is considerable, but in reality, there is a range of DO (about 0.3–0.4 mg L−1) within which the values of SDNR20°C are quite comparable. This range is better quantifiable in the graph of Figure 3 which shows the deviation of the SDNR20°C values of Model III from those of Models I and II.
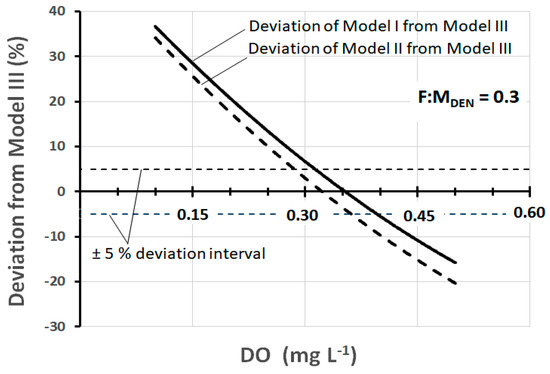
Figure 3.
Deviation of SDNR20°C of Models I and II from Model III, as a function of DO, at F:MDEN = 0.3 kgBOD5·kgMLVSS−1·d−1.
The deviation at any specific DO concentration is calculated as the percentage difference between SDNR20°C of Model III and that of Models I and II. The examination of the graph allows us to observe that the deviation of ±5% corresponds to the range DO = 0.28–0.36 mg L−1 for Model II and DO = 0.31–0.40 mg L−1 for Model I.
In fact, in pre-denitrification reactors of full-scale plants, DO concentrations between 0.3 mg and 0.4 mg L−1 are very frequently found. Thus, within this range, the practical result produced by the three models is, in a first approximation, fairly well comparable. At the same time, it should be noted that there are well-designed and well-operated plants in which the DO is maintained at values slightly below 0.3 mg L−1, and at the same time, there are plants in which the DO is found at values appreciably higher than 0.4 mg L−1. In both cases, Models I and II lose their representativeness, while the same is preserved by Model III. Figure 4 shows the trend of SDNR20°C as a function of DO, according to Models II and III (Model I is not shown for a better graphic representation) at three different values of F:MDEN. Figure 5 shows the corresponding deviation between these two models. Both graphs show that all deviation values within ±5% correspond to the range DO = 0.27–0.37 mg L−1. These data are further confirmation that the comparability of the three models exists, as a first approximation, within this specific range.
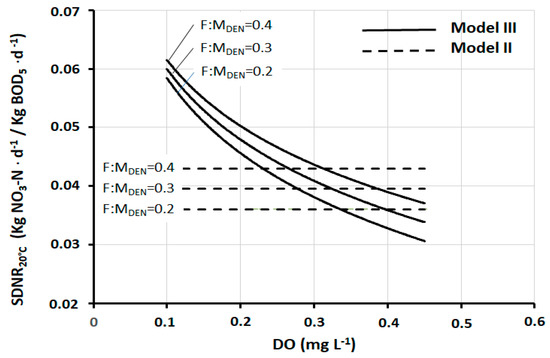
Figure 4.
SDNR20°C as a function of DO, according to Models II and III, at three different F:MDEN values.
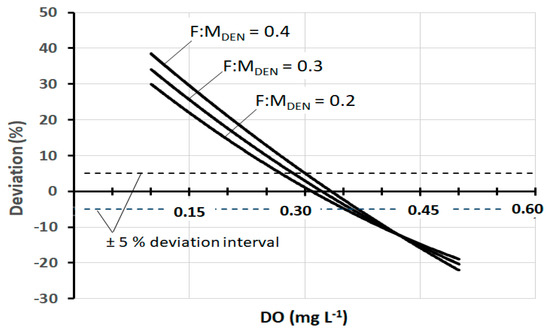
Figure 5.
Deviation of SDNR20°C of Model II from Model III, as a function of DO, at three different F:MDEN values.
What is illustrated above highlights how relevant it is to include the DO in the expressions of SDNR20°C, as it is made in Model III.
The strong influence of DO on SDNR20°C is well shown in Figure 6, which illustrates the trend of SDNR20°C of Model III as a function of the DO at three different values of F:MDEN. The specificity of this figure consists in the wide range of DO considered, from DO = 0 mg L−1 to DO = 1.2 mg L−1. At DO = 0 mg L−1, all the curves converge to the ideal value SDNR20°C = 0.864 kgNO3-N·kgMLVSS−1·d−1. By contrast, at high concentrations of DO, the curves tend to gradually flatten, making the variations of SDNR20°C less and less noticeable. The initial strong gradient leads to an about 45% reduction in SDNR20°C by increasing the dissolved oxygen from DO = 0 mg L−1 to DO = 0.2 mg L−1. A further increase in DO to 0.4 results in a further 18% reduction of SDNR20°C. At higher DO values (DO > 1 mg L−1), the SDNR20°C tends to be determined more and more by only cellular synthesis. The graph also shows how, although appreciable, the incidence of F:MDEN is relatively limited.
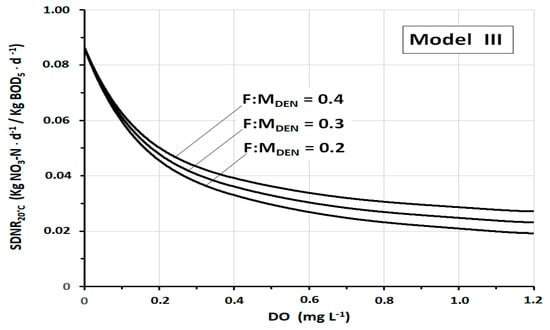
Figure 6.
SDNR20°C as a function of DO (in the wide range DO = 0–1.2 mg L−1), according to Model III, at three different F:MDEN values.
A full confirmation of the above evaluations can be seen in Figure 7, which shows the mathematical derivative of Model III, always as a function of DO. The derivative expresses the response of SDNR20°C to the variation of each specific DO value. As such, it expresses the sensitivity better than any other parameter. The curves show a very high sensitivity of SDNR20°C to DO, mainly at low DO concentrations (DO approximately < 0.3 mg L−1). The sensitivity then tends to decrease with a progressively less pronounced gradient with increasing DO values (above 0.4–0.5 mg L−1). It is useful to consider that DO greater than 0.5–0.6 mg L−1 is rarely found on well-designed and operated full-scale plants. This figure, even more so than the previous one, shows that the variations of F:MDEN are of little relevance and do not appreciably influence this sensitivity analysis.
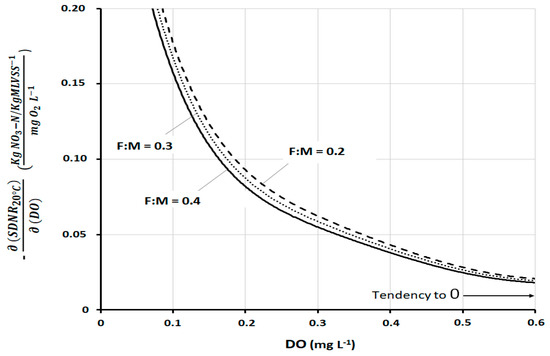
Figure 7.
Derivative of SDNR20°C with respect to DO, according to Model III at three different F:MDEN.
Overall, the results of the present sensitivity analysis highlight the need to limit, as much as possible, the concentration of DO in the denitrification reactor, and this should already be done at the plant design stage. Among the measures that can be adopted, the following can be mentioned:
- An appropriate hydrodynamic configuration for the denitrification reactor. In fact, the results of specific experimentations highlight the influence of the hydrodynamic model of the anoxic reactor on the residual DO and consequently on the denitrification efficiency. A set of four reactors demonstrates greater oxygen consumption capability (allowing residual DO below 0.1 mg L−1) than a single complete mixing reactor (allowing residual DO of 0.18–0.30 mg L−1). It is therefore necessary to provide configurations of the denitrification reactor tending as much as possible to the plug-flow [45].
- A post-anoxic reactor (after the pre-denitrification and oxidation-nitrification steps) proved to be very effective in improving the efficiency of nitrogen removal [46]. In fact, in this stage, a marked reduction of the dissolved oxygen can be obtained so as to allow the recycling of the mixed liquor with a relatively small DO. The reduction of the dissolved oxygen in the post-anoxic reactor is influenced by the retention time and the sludge loading of the biological process. It was observed that, with F:M = 0.130 kg BOD5∙d−1∙kg MLVSS−1 (referring to the volumes of denitrification plus oxidation-nitrification) and 1.5 h of retention time, it is possible to obtain the reduction of the dissolved oxygen in the post-anoxic reactor to the average concentration of 0.31 mg L−1, such as to determine an average concentration down to 0.11 mg L−1 in the pre-denitrification reactor. The consumption of DO in the post-anoxic reactor is due to the bio-assimilation of the residual BOD and the bio-oxidation of the endogenous carbon.
- The limitation of DO in the inlet flows to the denitrification reactor (pre-treated sewage, sludge recycle, mixed liquor recycle) using closed pipes instead of open channels [47,48].
- The dosage of a reducing agent such as Fe2+ in denitrification (or in the post-anoxic reactor), which easily oxidizes to Fe3+, by consuming DO. A specific experimentation proved that dosages of 6 mg L−1 Fe2+ can lower the average DO concentration from 0.45 mg L−1 to 0.28 mg L−1, consequently increasing the denitrification efficiency. In addition, ferrous ion has been found to act as a catalyst for the reduction of nitrates [49,50,51].
This solution can be of particular interest in cases where the sewage treatment includes the removal of phosphorus, which would be precipitated as ferric orthophosphate [52,53].
- The careful choice of the mixed liquor stirring system (and of the relative power) in the denitrification reactor to avoid excessive surface turbulence with consequent excessive dissolution of atmospheric oxygen. In general, completely submerged agitators equipped with a power regulator are preferred. The specific power input must be limited to the minimum necessary to keep activated sludge in suspension, and it generally ranges from 8 to 12 W m−3 [38,39].
- The coverage of the reactor surface with floating plastic elements in order to limit the exchange of oxygen with the overlying atmosphere.
4. Conclusions
The sensitivity analysis highlights the strong dependence of the SDNR20°C on dissolved oxygen (DO) in biological denitrification. Therefore, every reliable computational model should include this dependency. According to the following model proposed by the authors and validated by numerous experimentations on pilot plants and full-scale plants, the sensitivity proves to be particularly relevant at low values of DO.
where:
- SDNR20°C = specific denitrification rate at 20 °C (kg NO3-N·kg MLVSS−1·d−1);
- SDNRT = specific denitrification rate at the real temperature T (°C) of the mixed liquor (kg NO3-N·kg MLVSS−1·d−1);
- F:MDEN = food:microrganism ratio in denitrification (kg BOD5·kg MLVSS−1);
- K’O = 0.18 mgO2 L−1;
- ηBOD = 0.85–0.95 depending on the values assumed by F:MDEN;
- θ = 1.026–1.07 temperature coefficient.
In particular, the strong initial gradient leads to a reduction of about 45% of the SDNR20°C while increasing the initial concentration DO = 0 mg L−1 up to DO = 0.2 mg L−1. A further increase to 0.4 mg L−1 determines an additional 18% decrease in SDNR20°C. The influence of the F:MDEN on this sensitivity analysis appears very modest. In full-scale plants, the residual concentration of DO in denitrification is frequently found in the range of 0.3–0.4 mg L−1. In some cases, this range is increased to 0.5–0.6 mg L−1, thus often leading to a reduced efficiency of biological denitrification. In particularly favorable cases, DO is found in the range of 0.2–0.3 mg L−1, which allows a better denitrification performance.
The objectives of a good design of the denitrification reactor must include several measures capable of limiting the DO as much as possible. The main measures are summarized below:
- Designing the denitrification reactor with a hydrodynamic configuration closer to plug-flow than to complete mixing;
- Minimizing the transport of oxygen with the flows entering the reactor: use of pipes instead of open channels; tapered aeration in oxidation-nitrification or even the addition of a real post-anoxic reactor;
- Dosage in denitrification (or in the eventual post-anoxic reactor) of an easily oxidizable reagent by dissolved oxygen: Fe2+ (i.e., as ferrous sulphate) has proven to be effective;
- Minimizing the surface oxygen exchange by the careful choice of the agitation system.
Future research developments in this field are expected, in particular regarding the sensitivity of SDNR with respect to F:MDEN and to the temperature.
Author Contributions
Conceptualization: M.R., P.V., and M.R.B.; methodology: M.R., P.V., and M.R.B.; validation: M.R., P.V., E.C.R., and F.C.; investigation: M.R., P.V., and M.R.B.; writing—original draft preparation: M.R., P.V., and M.R.B.; writing—review and editing: M.R. and E.C.R. All authors have read and agreed to the published version of the manuscript.
Funding
This research received no external funding
Conflicts of Interest
The authors declare no conflict of interest.
References
- Patil, P.B.; Bhandari, V.M.; Ranade, V.V. Improving efficiency for removal of ammoniacal nitrogen from wastewaters using hydrodynamic cavitation. Ultrason. Sonochemistry 2020, 70, 105306. [Google Scholar] [CrossRef] [PubMed]
- Xiang, S.; Liu, Y.; Zhang, G.; Ruan, R.; Wang, Y.; Wu, X.; Zheng, H.; Zhang, Q.; Cao, L. New progress of ammonia recovery during ammonia nitrogen removal from various wastewaters. World J. Microbiol. Biotechnol. 2020, 36, 1–20. [Google Scholar] [CrossRef] [PubMed]
- Tuerdi, A.; Yang, L.; An, D.; Wang, T. Progresses in air stripping for treatment of ammonia wastewater. Petrochem. Technol. 2014, 43, 1348–1353. [Google Scholar]
- Zou, M.; Dong, H.; Zhu, Z.; Zhan, Y. Optimization of Ammonia Stripping of Piggery Biogas Slurry by Response Surface Methodology. Int. J. Environ. Res. Public Health 2019, 16, 3819. [Google Scholar] [CrossRef]
- Raboni, M.; Capodaglio, A.G.; Hlavínek, P. Physico-chemical technologies for nitrogen removal from wastewaters: A review. Ambient. Agua Interdiscip. J. Appl. Sci. 2015, 10, 481–498. [Google Scholar] [CrossRef]
- Wu, H.Z. A review on the key factors of high ammonia nitrogen wastewater treatment by stripping. J. Green Sci. Technol. 2013, 2, 144–146. [Google Scholar]
- Ferraz, F.M.; Povinelli, J.; Vieira, E.M. Ammonia removal from landfill leachate by air stripping and absorption. Environ. Technol. 2013, 34, 2317–2326. [Google Scholar] [CrossRef]
- Jia, D.; Lu, W.; Zhang, Y. Research on mechanism of air stripping enabled ammonia removal from industrial wastewater and its application. Chem. Eng. Trans. 2017, 62, 115–120. [Google Scholar]
- Liao, P.; Chen, A.; Lo, K. Removal of nitrogen from swine manure wastewaters by ammonia stripping. Bioresour. Technol. 1995, 54, 17–20. [Google Scholar] [CrossRef]
- Luo, X.; Yan, Q.; Wang, C.; Luo, C.; Zhou, N.; Jian, C. Treatment of Ammonia Nitrogen Wastewater in Low Concentration by Two-Stage Ozonization. Int. J. Environ. Res. Public Health 2015, 12, 11975–11987. [Google Scholar] [CrossRef]
- Khuntia, S.; Majumder, S.K.; Ghosh, P. Removal of Ammonia from Water by Ozone Microbubbles. Ind. Eng. Chem. Res. 2013, 52, 318–326. [Google Scholar] [CrossRef]
- Zhong, L.; Kuo, C.H. Investigation on wet-ozonization degradation of ammonia nitrogen. China Water Wastewater 2000, 16, 15–16. [Google Scholar]
- Bertanza, G.; Menoni, L.; Capoferri, G.U.; Pedrazzani, R. Promoting biological phosphorus removal in a full scale pre-denitrification wastewater treatment plant. J. Environ. Manag. 2020, 254, 109803. [Google Scholar] [CrossRef] [PubMed]
- Liu, T.; Lim, Z.K.; Chen, H.; Wang, Z.; Hu, S.; Yuan, Z.; Guo, J. Biogas-driven complete nitrogen removal from wastewater generated in side-stream partial nitritation. Sci. Total. Environ. 2020, 745, 141153. [Google Scholar] [CrossRef]
- Yang, Y.; Wang, L.; Xiang, F.; Zhao, L.; Qiao, Z. Activated Sludge Microbial Community and Treatment Performance of Wastewater Treatment Plants in Industrial and Municipal Zones. Int. J. Environ. Res. Public Health 2020, 17, 436. [Google Scholar] [CrossRef]
- Wei, Y.; Jin, Y.; Zhang, W. Domestic Sewage Treatment Using a One-Stage ANAMMOX Process. Int. J. Environ. Res. Public Health 2020, 17, 3284. [Google Scholar] [CrossRef]
- Arun, S.; Manikandan, N.A.; Pakshirajan, K.; Pugazhenthi, G. Novel shortcut biological nitrogen removal method using an algae-bacterial consortium in a photo-sequencing batch reactor: Process optimization and kinetic modelling. J. Environ. Manag. 2019, 250, 109401. [Google Scholar] [CrossRef]
- Capodaglio, A.G.; Hlavinek, P.; Raboni, M. Advances in wastewater nitrogen removal by biological processes: State of the art review. Ambient. Agua Interdiscip. J. Appl. Sci. 2016, 11, 250. [Google Scholar] [CrossRef]
- Copelli, S.; Raboni, M.; Urbini, G. Water Pollution: Biological Oxidation and Natural Control Techniques. In Reference Module in Chemistry, Molecular Sciences and Chemical Engineering; Elsevier BV: Amsterdam, The Netherlands, 2015. [Google Scholar]
- Moghaddam, A.; Sargolzaei, J. A Review over Diverse Methods Used in Nitrogen Removal from Wastewater. Recent Pat. Chem. Eng. 2013, 6, 133–139. [Google Scholar] [CrossRef]
- Rezakazemi, M.; Shirazian, S.; Ashrafizadeh, S.N. Simulation of ammonia removal from industrial wastewater streams by means of a hollow-fiber membrane contactor. Desalination 2012, 285, 383–392. [Google Scholar] [CrossRef]
- Luciano, A.; Viotti, P.; Mancini, G.; Torretta, V. An integrated wastewater treatment system using a BAS reactor with biomass attached to tubular supports. J. Environ. Manag. 2012, 113, 51–60. [Google Scholar] [CrossRef] [PubMed]
- Zhu, G.; Peng, Y.; Li, B.; Guo, J.; Yang, Q.; Wang, S. Biological Removal of Nitrogen from Wastewater. Residue Rev. 2008, 192, 159–195. [Google Scholar] [CrossRef]
- Hamada, K.; Kuba, T.; Torrico, V.; Okazaki, M.; Kusuda, T. Comparison of nutrient removal efficiency between pre- and post-denitrification wastewater treatments. Water Sci. Technol. 2006, 53, 169–175. [Google Scholar] [CrossRef] [PubMed]
- Farabegoli, G.; Gavasci, R.; Lombardi, F.; Romani, F. Denitrification in Tertiary Filtration: Application of an Up-Flow Filter. J. Environ. Sci. Health Part A 2003, 38, 2169–2177. [Google Scholar] [CrossRef]
- Ekama, G.A.; Wentzel, M.C. Denitrification kinetics in biological N and P removal activated sludge systems treating municipal wastewaters. Water Sci. Technol. 1999, 39, 69–77. [Google Scholar] [CrossRef]
- Ekama, G. Biological Nutrient Removal. In Treatise on Water Science; Elsevier BV: Amsterdam, The Netherlands, 2011; pp. 409–526. [Google Scholar]
- Tchobanoglous, G.; Burton, F.L.; Stensel, H.D. Wastewater Engineering: Treatment and Reuse; McGraw-Hill Education: New York, NY, USA, 2003; p. 1819. [Google Scholar]
- Drewnowski, J.; Mąkinia, J.; Kopeć, L.; Fernandez-Morales, F.J. Modelization of Nutrient Removal Processes at a Large WWTP Using a Modified ASM2d Model. Int. J. Environ. Res. Public Health 2018, 15, 2817. [Google Scholar] [CrossRef]
- Ofiţeru, I.; Bellucci, M.; Picioreanu, C.; Lavric, V.; Curtis, T.P. Multi-scale modelling of bioreactor–separator system for wastewater treatment with two-dimensional activated sludge floc dynamics. Water Res. 2014, 50, 382–395. [Google Scholar] [CrossRef]
- Jahan, K.; Hoque, S.; Ahmed, T. Activated sludge and other suspended culture processes. Water Environ. Res. 2012, 84, 1029–1080. [Google Scholar] [CrossRef]
- Munz, G.; Lubello, C.; Oleszkiewicz, J.A. Factors affecting the growth rates of ammonium and nitrite oxidizing bacteria. Chemosphere 2011, 83, 720–725. [Google Scholar] [CrossRef]
- Esposito, G.; Fabbricino, M.; Lens, P.; Pirozzi, F. Mathematical Model for Sizing Combined Nitrification and Pre-denitrification Activated Sludge Systems. Environ. Technol. 2007, 28, 391–399. [Google Scholar] [CrossRef]
- Dawson, R.; Murphy, K. The temperature dependency of biological denitrification. Water Res. 1972, 6, 71–83. [Google Scholar] [CrossRef]
- Xue, W.; Peng, D.; Wang, P.; Dong, T. Effect of dissolved oxygen on nitrogen removal efficiency of simultaneous nitrification and denitrification in oxidation ditch. Chin. J. Environ. Eng. 2015, 9, 3305–3310. [Google Scholar]
- Plósz, B.G.; Jobbágy, A.; Grady, C.P.L., Jr. Factors influencing deterioration of denitrification by oxygen entering an anoxic reactor through the surface. Water Res. 2003, 37, 853–863. [Google Scholar] [CrossRef]
- Badstreet, K.A.; Jhonson, G.R. Study of critical operational parameters for nitrogen reduction at municipal wastewater treatment plant. In Proceedings of the Water Environment Federation 67th Annual Conference & Exposition, Chicago, IL, USA, 15–19 October 1994; pp. 669–680. [Google Scholar]
- Oh, J.; Silverstein, J. Oxygen inhibition of activated sludge denitrification. Water Res. 1999, 33, 1925–1937. [Google Scholar] [CrossRef]
- US-EPA. Nutrient Control Design Manual, EPA/600/R-10/100. United States—Environmental Protection Agency. 2010. Available online: https://nepis.epa.gov/Exe/ZyNET.exe (accessed on 15 October 2020).
- US-EPA. Nutrient Control Design Manual: State of Technology, EPA/600/R-09/012. United States—Environmental Protection Agency. 2009. Available online: https://www.epa.gov/sites/production/files/201902/documents/nutrient-control-design-manual-state-tech (accessed on 15 October 2020).
- Raboni, M.; Torretta, V.; Viotti, P.; Urbini, G. Calculating specific denitrification rates in pre-denitrification by assessing the influence of dissolved oxygen, sludge loading and mixed-liquor recycle. Environ. Technol. 2014, 35, 2582–2588. [Google Scholar] [CrossRef]
- Raboni, M.; Torretta, V. Validation of a new model for the sizing of denitrification reactors, by testing full-scale plants. Environ. Technol. 2016, 38, 1376–1382. [Google Scholar] [CrossRef]
- Teck, H.C.; Loong, K.S.; Sun, D.D.; Leckie, J.O. Influence of a prolonged solid retention time environment on nitrification/denitrification and sludge production in a submerged membrane bioreactor. Desalination 2009, 245, 28–43. [Google Scholar] [CrossRef]
- Henze, M.; Aspregren, H.; Jansen, J.L.C.; Nielsen, P.; Lee, N. Effect of solids retention time and wastewater characteristics on biological phosphorus removal. Water Sci. Technol. 2002, 45, 137–144. [Google Scholar] [CrossRef]
- Raboni, M.; Gavasci, R.; Viotti, P. Influence of denitrification reactor retention time distribution (RTD) on dissolved oxygen control and nitrogen removal efficiency. Water Sci. Technol. 2015, 72, 45–51. [Google Scholar] [CrossRef][Green Version]
- Urbini, G.; Gavasci, R.; Viotti, P. Oxygen Control and Improved Denitrification Efficiency by Means of a Post-Anoxic Reactor. Sustainability 2015, 7, 1201–1212. [Google Scholar] [CrossRef]
- Torretta, V.; Ragazzi, M.; Trulli, E.; De Feo, G.; Urbini, G.; Raboni, M.; Rada, E.C. Assessment of Biological Kinetics in a Conventional Municipal WWTP by Means of the Oxygen Uptake Rate Method. Sustainability 2014, 6, 1833–1847. [Google Scholar] [CrossRef]
- Tan, T.W.; Ng, H.Y. Influence of mixed liquor recycle ratio and dissolved oxygen on performance of pre-denitrification submerged membrane bioreactors. Water Res. 2008, 42, 1122–1132. [Google Scholar] [CrossRef] [PubMed]
- Viotti, P.; Collivignarelli, M.C.; Martorelli, E.; Raboni, M. Oxygen control and improved denitrification efficiency by dosing ferrous ions in the anoxic reactor. Desalin. Water Treat. 2015, 57, 18240–18247. [Google Scholar] [CrossRef]
- Stumm, W.; Lee, G.F. Oxygenation of Ferrous Iron. Ind. Eng. Chem. 1961, 53, 143–146. [Google Scholar] [CrossRef]
- Sung, W.; Morgan, J.J. Kinetics and product of ferrous iron oxygenation in aqueous systems. Environ. Sci. Technol. 1980, 14, 561–568. [Google Scholar] [CrossRef]
- Buresh, R.J.; Moraghan, J.T. Chemical Reduction of Nitrate by Ferrous Iron. J. Environ. Qual. 1976, 5, 320–325. [Google Scholar] [CrossRef]
- Ottley, C.; Davison, W.; Edmunds, W. Chemical catalysis of nitrate reduction by iron (II). Geochim. Cosmochim. Acta 1997, 61, 1819–1828. [Google Scholar] [CrossRef]
Publisher’s Note: MDPI stays neutral with regard to jurisdictional claims in published maps and institutional affiliations. |
© 2020 by the authors. Licensee MDPI, Basel, Switzerland. This article is an open access article distributed under the terms and conditions of the Creative Commons Attribution (CC BY) license (http://creativecommons.org/licenses/by/4.0/).