Integrating the Built and Social Environment into Health Assessments for Maternal and Child Health: Creating a Planning-Friendly Index

 ,
,
Abstract
1. Introduction
1.1. Maternal and Child Health in the US
1.2. Social Determinates of MCH
1.3. Planning to Improve Maternal and Child Health
2. Methods
2.1. Selection of Indicators for MCH Needs
2.2. Data Source and Definitions for Indicators
2.3. Need Score on Each Indicator
2.4. A Composite Need Index on Each Domain
2.5. Sub-County Analyses
3. Results
3.1. Indicator-Level Results
3.2. Overall Domain Results
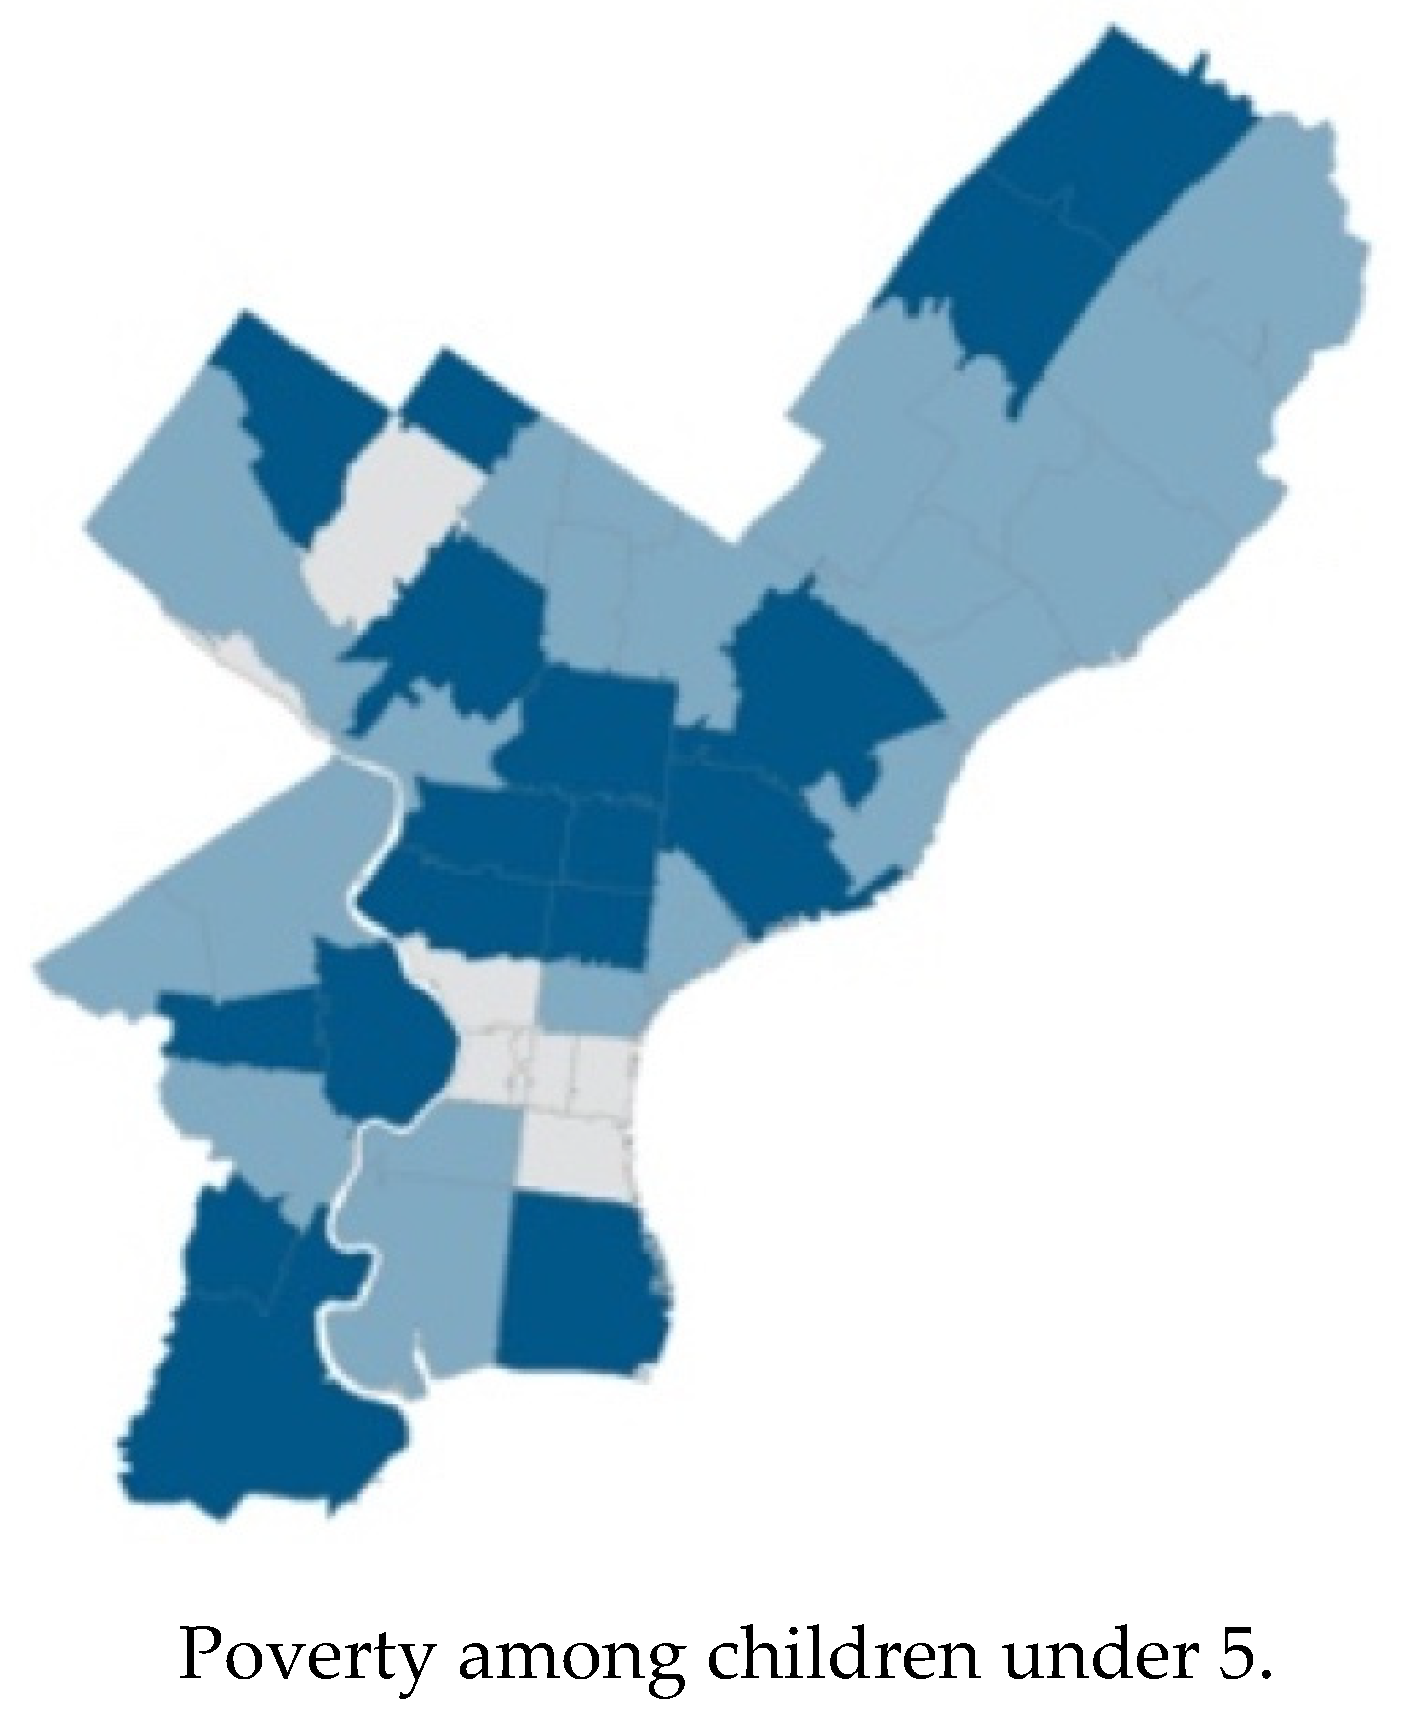
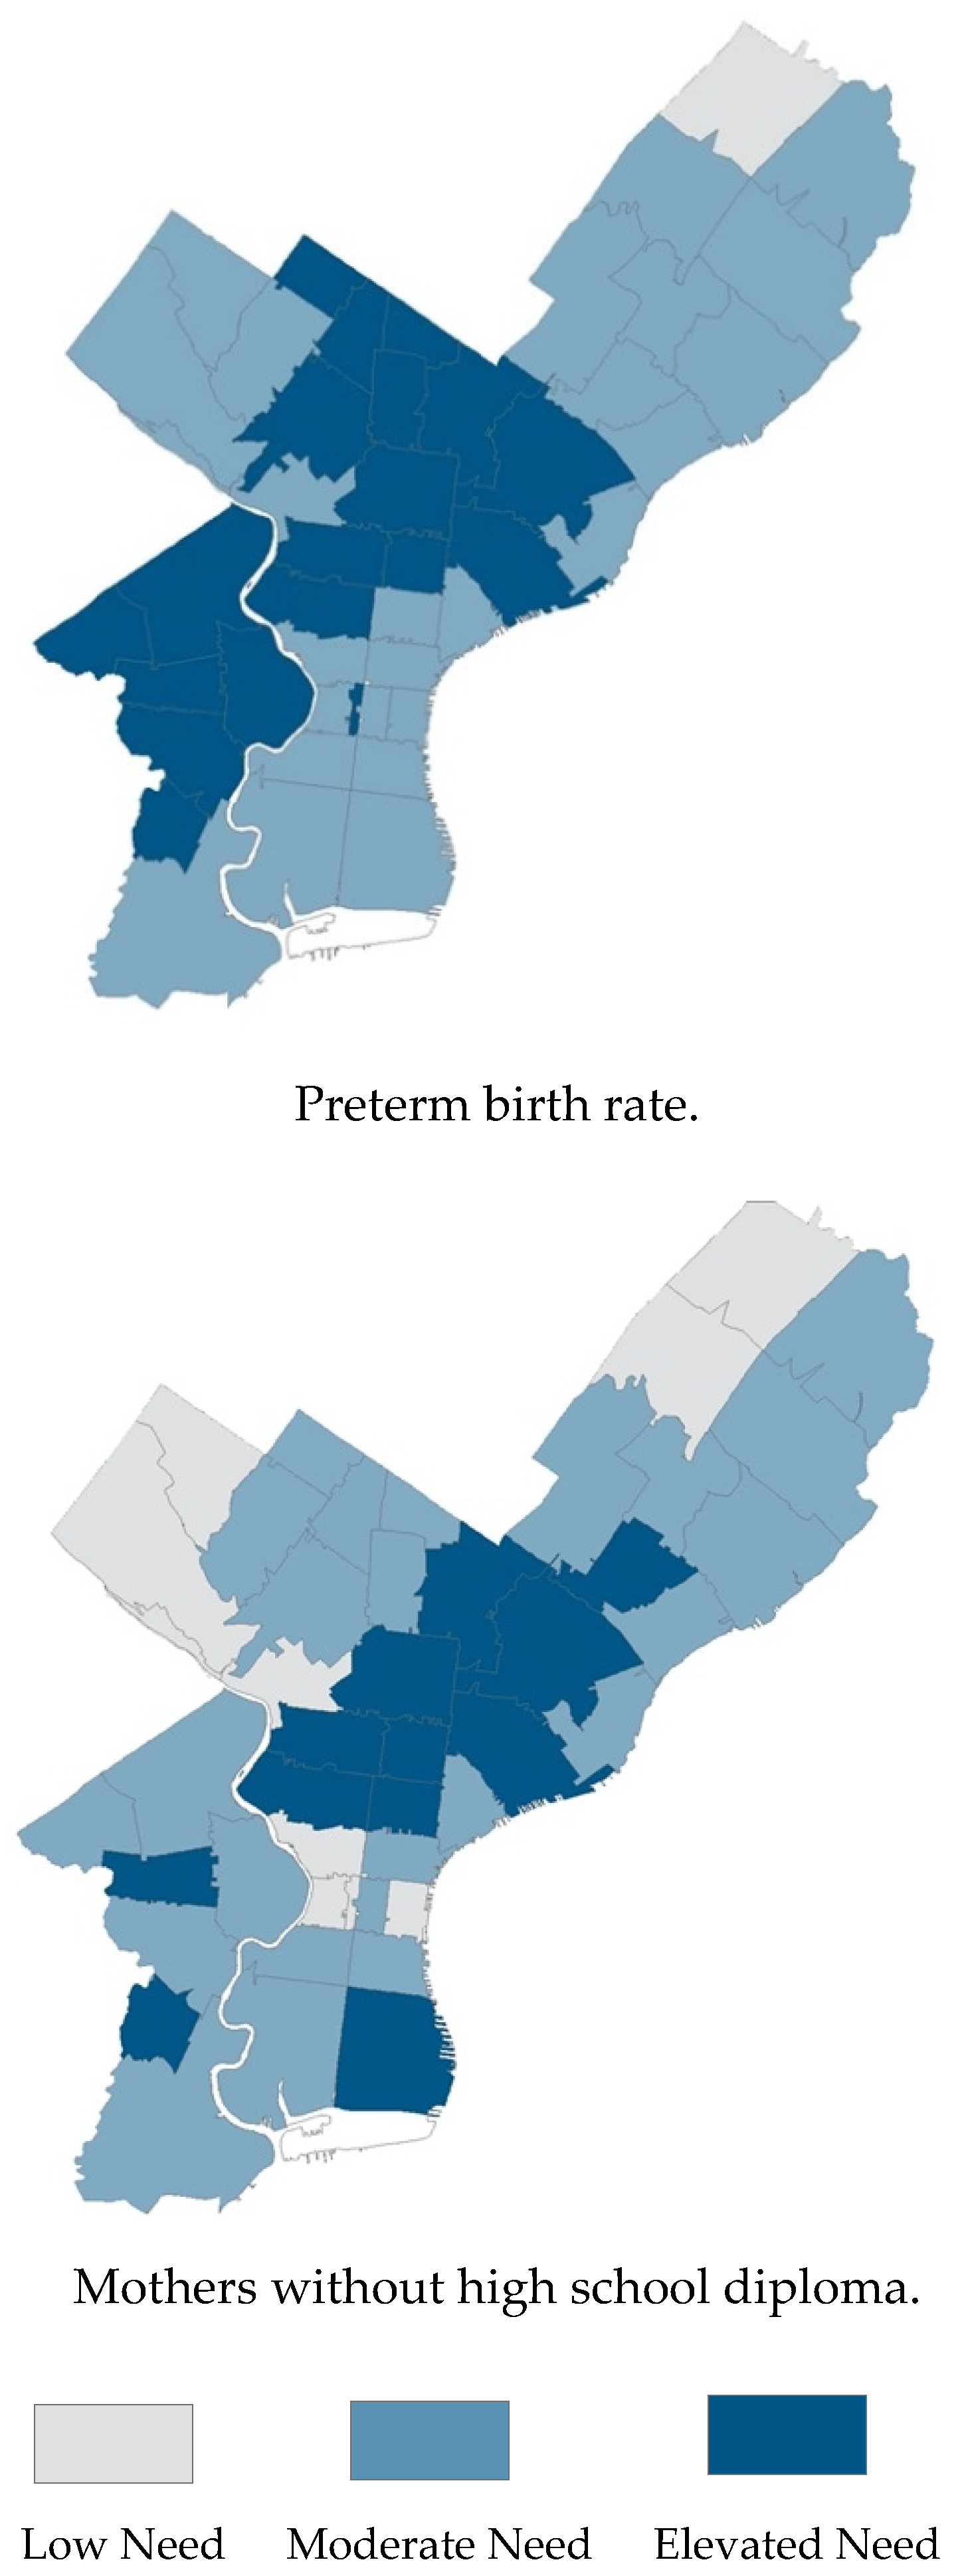
3.3. Sub-County Results
4. Discussion
4.1. Incorporating Social Determinants in Evaluating Maternal and Child Health Needs
4.2. Incorporating Maternal and Child Health Needs with Planning
5. Conclusions
Supplementary Materials
Author Contributions
Funding
Acknowledgments
Conflicts of Interest
References
- World Health Association. Trends in Maternal Mortality: 2000–2017—Estimates by WHO, UNICEF, UNFPA, the World Bank, and the United Nations Population Division; World Health Organization: Geneva, Switzerland, 2019. [Google Scholar]
- Organization for Economic Cooperation and Development. OECD Health Statistics; Organization for Economic Cooperation and Development: Paris, France, 2015. [Google Scholar]
- MacDorman, M.; Mathews, T.J.; Mohoangoo, A.; Zeitlin, J. International Comparisons for Infant Mortality and Related Factors: United States and Europe; U.S. Department of Health and Human Services: Washington, DC, USA, 2014.
- Centers for Disease Control and Prevention. Enhancing Reviews and Surveillance to Eliminate Maternal Mortality; Centers for Disease Control and Prevention: Atlanta, GA, USA, 2019.
- World Health Organization. About Social Determinants of Health. Available online: http://www.who.int/social_determinants/sdh_definition/en/ (accessed on 21 October 2020).
- McGinnis, J.M.; Williams-Russo, P.; Knickman, J.R. The case for more active policy attention to health promotion. Health Aff. 2002, 21, 78–93. [Google Scholar] [CrossRef]
- Braveman, P.; Gottlieb, L. The social determinants of health: It’s time to consider the causes of the causes. Public Health Rep. 2014, 129, 19–31. [Google Scholar] [CrossRef] [PubMed]
- Roberts, E.M. Neighborhood Social Environments and the Distribution of Low Birth Weight in Chicago. Am. J. Public Health 1997, 87, 597–603. [Google Scholar] [CrossRef] [PubMed]
- O’Campo, P.; Xue, X.; Wang, M.C. Neighborhood Risk Factors for Low Birthweight in Baltimore: A Multilevel Analysis. Am. J. Public Health 1997, 87, 1113–1118. [Google Scholar] [CrossRef] [PubMed]
- Pearl, M.; Braveman, P.; Abrams, B. The Relationship of Neighborhood Socioeconomic Characteristics to Birthweight Among 5 Ethnic Groups in California. Am. J. Public Health 2001, 91, 1808–1814. [Google Scholar] [CrossRef] [PubMed]
- Shannon, M.M.; Clougherty, J.E.; McCarthy, C.; Elovitz, M.A.; Jordan, M.; Tiako, N.; Melly, S.J.; Burris, H.H. Neighborhood violent crime and perceived stress in pregnancy. Int. J. Environ. Res. Public Health 2020, 17, 5585. [Google Scholar] [CrossRef] [PubMed]
- Burris, H.H.; Gerson, K.D.; Ravel, J.; Elovitz, M.A. 560: Neighborhood deprivation is associated with spontaneous preterm birth and high-risk cervicovaginal microbial communities. Am. J. Obstet. Gynecol. 2020, 222, S359–S360. [Google Scholar] [CrossRef]
- Salow, S.D.; Pool, L.R.; Grobman, W.A.; Kershaw, K.N. Associations of neighborhood-level racial residential segregation with adverse pregnancy outcomes. Am. J. Obstet. Gynecol. 2018, 218, 351-e1. [Google Scholar] [CrossRef]
- Braveman, P.; Egerter, S. Overcoming Obstacles to Health in 2013 and Beyond: Report to the Commission to Build a Healthier America; Robert Wood Johnson Foundation: Princeton, NJ, USA, 2013. [Google Scholar]
- Institute, T.A. Glossary for Understanding the Dismantling Structural Racism/Promoting Racial Equity Analysis. Available online: https://assets.aspeninstitute.org/content/uploads/files/content/docs/rcc/RCC-Structural-Racism-Glossary.pdf (accessed on 21 October 2020).
- Taylor, J.; Novoa, C.; Hamm, K.; Phadke, S. Eliminating Racial Disparities in Maternal and Infant Mortality: A Comprehensive Policy Blueprint; Center for American Progress: Washington, DC, USA, 2019. [Google Scholar]
- Sealy-Jefferson, S.; Mustafaa, F.; Misra, D. Early-Life Neighborhood Context, Perceived Stress, and PReterm Birth in African American Women. SSM-Popul. Health 2019, 7, 100362. [Google Scholar] [CrossRef]
- Building, U.S. Capacity to Review and Prevent Maternal Deaths. In Report from Nine Maternal Mortality Review Committees; Centers for Disease Control and Prevention: Atlanta, GA, USA, 2018. [Google Scholar]
- Hung, P.; Kozhimannil, K.B.; Casey, M.M.; Moscovice, I.S. Why are obstetric units in rural hospitals closing their doors? Health Serv. Res. 2016, 51, 1546. [Google Scholar] [CrossRef]
- Hung, P.; Henning-Smith, C.E.; Casey, M.M.; Kozhimannil, K.B. Access To Obstetric Services In Rural Counties Still Declining, With 9 Percent Losing Services, 2004–2014. Health Aff. 2017, 36, 1663–1671. [Google Scholar] [CrossRef] [PubMed]
- American Planning Association. What Is Planning? Available online: https://www.planning.org/aboutplanning/ (accessed on 13 October 2020).
- Hayden, D. Building Suburbia: Green Fields and Urban Growth, 1820–2000, 1st ed.; Pantheon Books: New York, NY, USA, 2003. [Google Scholar]
- Hayden, D. Redesigning the American Dream: Gender, Housing, and Family Life; W.W. Norton: New York, NY, USA, 2002. [Google Scholar]
- Leavitt, J.; Saegert, S. From Abandonment to Hope: Community Households in Harlam; Columbia Unviersity Press: New York, NY, USA, 1990. [Google Scholar]
- Fainstein, S.S. Feminism and Planning-Theoretical Issues. In Gender and Planning: A Reader; Fainstein, S.S., Servon, L.J., Eds.; Rutgers University Press: New Brunswick, NJ, USA, 2005. [Google Scholar]
- Israel, E.; Warner, M. Planning for Family Friendly Communities. In Pas Memo; American Planning Association: Chicago, IL, USA, 2008. [Google Scholar]
- Warner, M.E. Planning for Inclusion: The Case of Child Care; Practice Plan; Cornell University: Ithaca, NY, USA, 2007. [Google Scholar]
- Braveman, P.; Egerter, S.A.; Mockenhaupt, R.E. Broadening the focus: The need to address the social determinants of health. Am. J. Prev. Med. 2011, 40, S4–S18. [Google Scholar] [CrossRef] [PubMed]
- Lu, M.; Halfon, N. Racial and ethnic disparities in birth outcomes: A life-course perspective. Matern. Child Health 2003, 7, 13–30. [Google Scholar] [CrossRef] [PubMed]
- Kuh, D.; Ben-Shlomo, Y.; Lynch, J.; Hallqvist, J.; Power, C. Life course epidemiology. J. Epidemiol. Community Health 2003, 57, 778. [Google Scholar] [CrossRef]
- Krieger, N. Theories for Social Epidemiology in the 21st Century: An Ecosocial Perspective. Int. J. Epidemiol. 2001, 30, 668–677. [Google Scholar] [CrossRef]
- Maternal Infant and Early Childhood Home Visiting Program. Supplemental Information Request (SIR) for the Submission of the Territory Statewide (“Territorywide”) Needs Assessment Update; Health Resources and Service Administration: Rockville, MD, USA, 2019.
- Remington, P.L.; Catlin, B.B.; Gennuso, K.P. The County Health Rankings: Rationale and Methods. Popul. Health Metr. 2015, 13, 11. [Google Scholar] [CrossRef]
- Acevedo-Garcia, D.; Noelke, C.; McArdle, N.; Sofer, N.; Hardy, E.F.; Weiner, M.; Baek, M.; Huntington, N.; Huber, R.; Reece, J. Racial And Ethnic Inequities In Children’s Neighborhoods: Evidence From The New Child Opportunity Index 2.0. Health Aff. 2020, 39, 1693–1701. [Google Scholar] [CrossRef]
- Ferre, C.; Callaghan, W.; Olson, C.; Sharma, A.; Barfield, W. Effects of Maternal Age and Age-Specific Preterm Birth Rates on Overall Preterm Birth Rates—United States, 2007 and 2014. Morb. Mortal. Wkly. Rep. 2016, 65, 1181–1184. [Google Scholar] [CrossRef]
- Glouberman, S. Towards a New Perspective on Health Policy; Canadian Policy Research Networks: Ottowa, ON, Canada, 2001. [Google Scholar]
- Wilkerson, R.; Marmot, M. The Social Determinants of Health: The Solid Facts; World Health Organization Regional Office for Europe: Copenhagan, Denmark, 1998. [Google Scholar]
- Affairs, O.O.P. Title X Statutes, Regulations, and Legislative Madates; US Department of Health and Human Services: Washington, DC, USA, 2019.
- Matone, M.; O’Reilly, A.; Luan, X.; Localio, R.; Rubin, D. Home visitation program effectiveness and the influence of community behavioral norms: A propensity score matched analysis of prenatal smoking cessation. BMC Public Health 2012, 12, 1–6. [Google Scholar] [CrossRef]
- Pies, C.; Barr, M.; Strouse, C.; Kotelchuck, M.; Best Babies Zone Initiative Team. Growing a Best Babies Zone: Lessons Learned fomr the Pilot Phase of a Multi-Sector, Place-Based Initiative to Reduce Infant Mortality. Matern. Child Health 2016, 20, 968–973. [Google Scholar] [CrossRef]
- Goldstein, N.D.; Palumbo, A.J.; Bellamy, S.L.; Purtle, J.; Locke, R. State and Local Government Expenditures and Infant Mortality in the United States. Pediatrics 2020, 146, e20201134. [Google Scholar] [CrossRef] [PubMed]
- Corburn, J. Confronting the Challenges in Reconnecting Urban Planning and Public Health. Am. J. Public Health 2004, 94, 541–546. [Google Scholar] [CrossRef] [PubMed]


| Indicator Name | Indicator Definition |
|---|---|
| Perinatal and Neonatal Outcomes Domain | |
| Late prenatal care | Percent of births to mothers who did not initiate prenatal care in the first trimester |
| Preterm birth | Percent of live births < 37 completed gestational weeks |
| Low birth weight | Percent of live births < 2500 g at birth |
| NICU admission | Percent of live births admitted to a neonatal intensive care unit (NICU) |
| Late/no breastfeeding initiation | Percent of live births who were NOT breastfed at hospital discharge |
| Infant mortality | Infant deaths per 1000 live births |
| Child mortality | Deaths of children under 5 years old per 1000 residents under 5 |
| Maternal depression | Prevalence of diagnosed depression in the 2016 calendar year among Medicaid-enrolled women who were pregnant or gave birth during 2014–2016 |
| Well-baby visits | Median number of well-child visits among Medicaid-enrolled children aged less than 1 year |
| Young child well-child visit | Median number of well-child visits among Medicaid-enrolled children aged 1–5 years |
| Racial disparity in low birth weight | Ratio of low-birth-weight rate in births born to Black mothers to that in births born to white mothers |
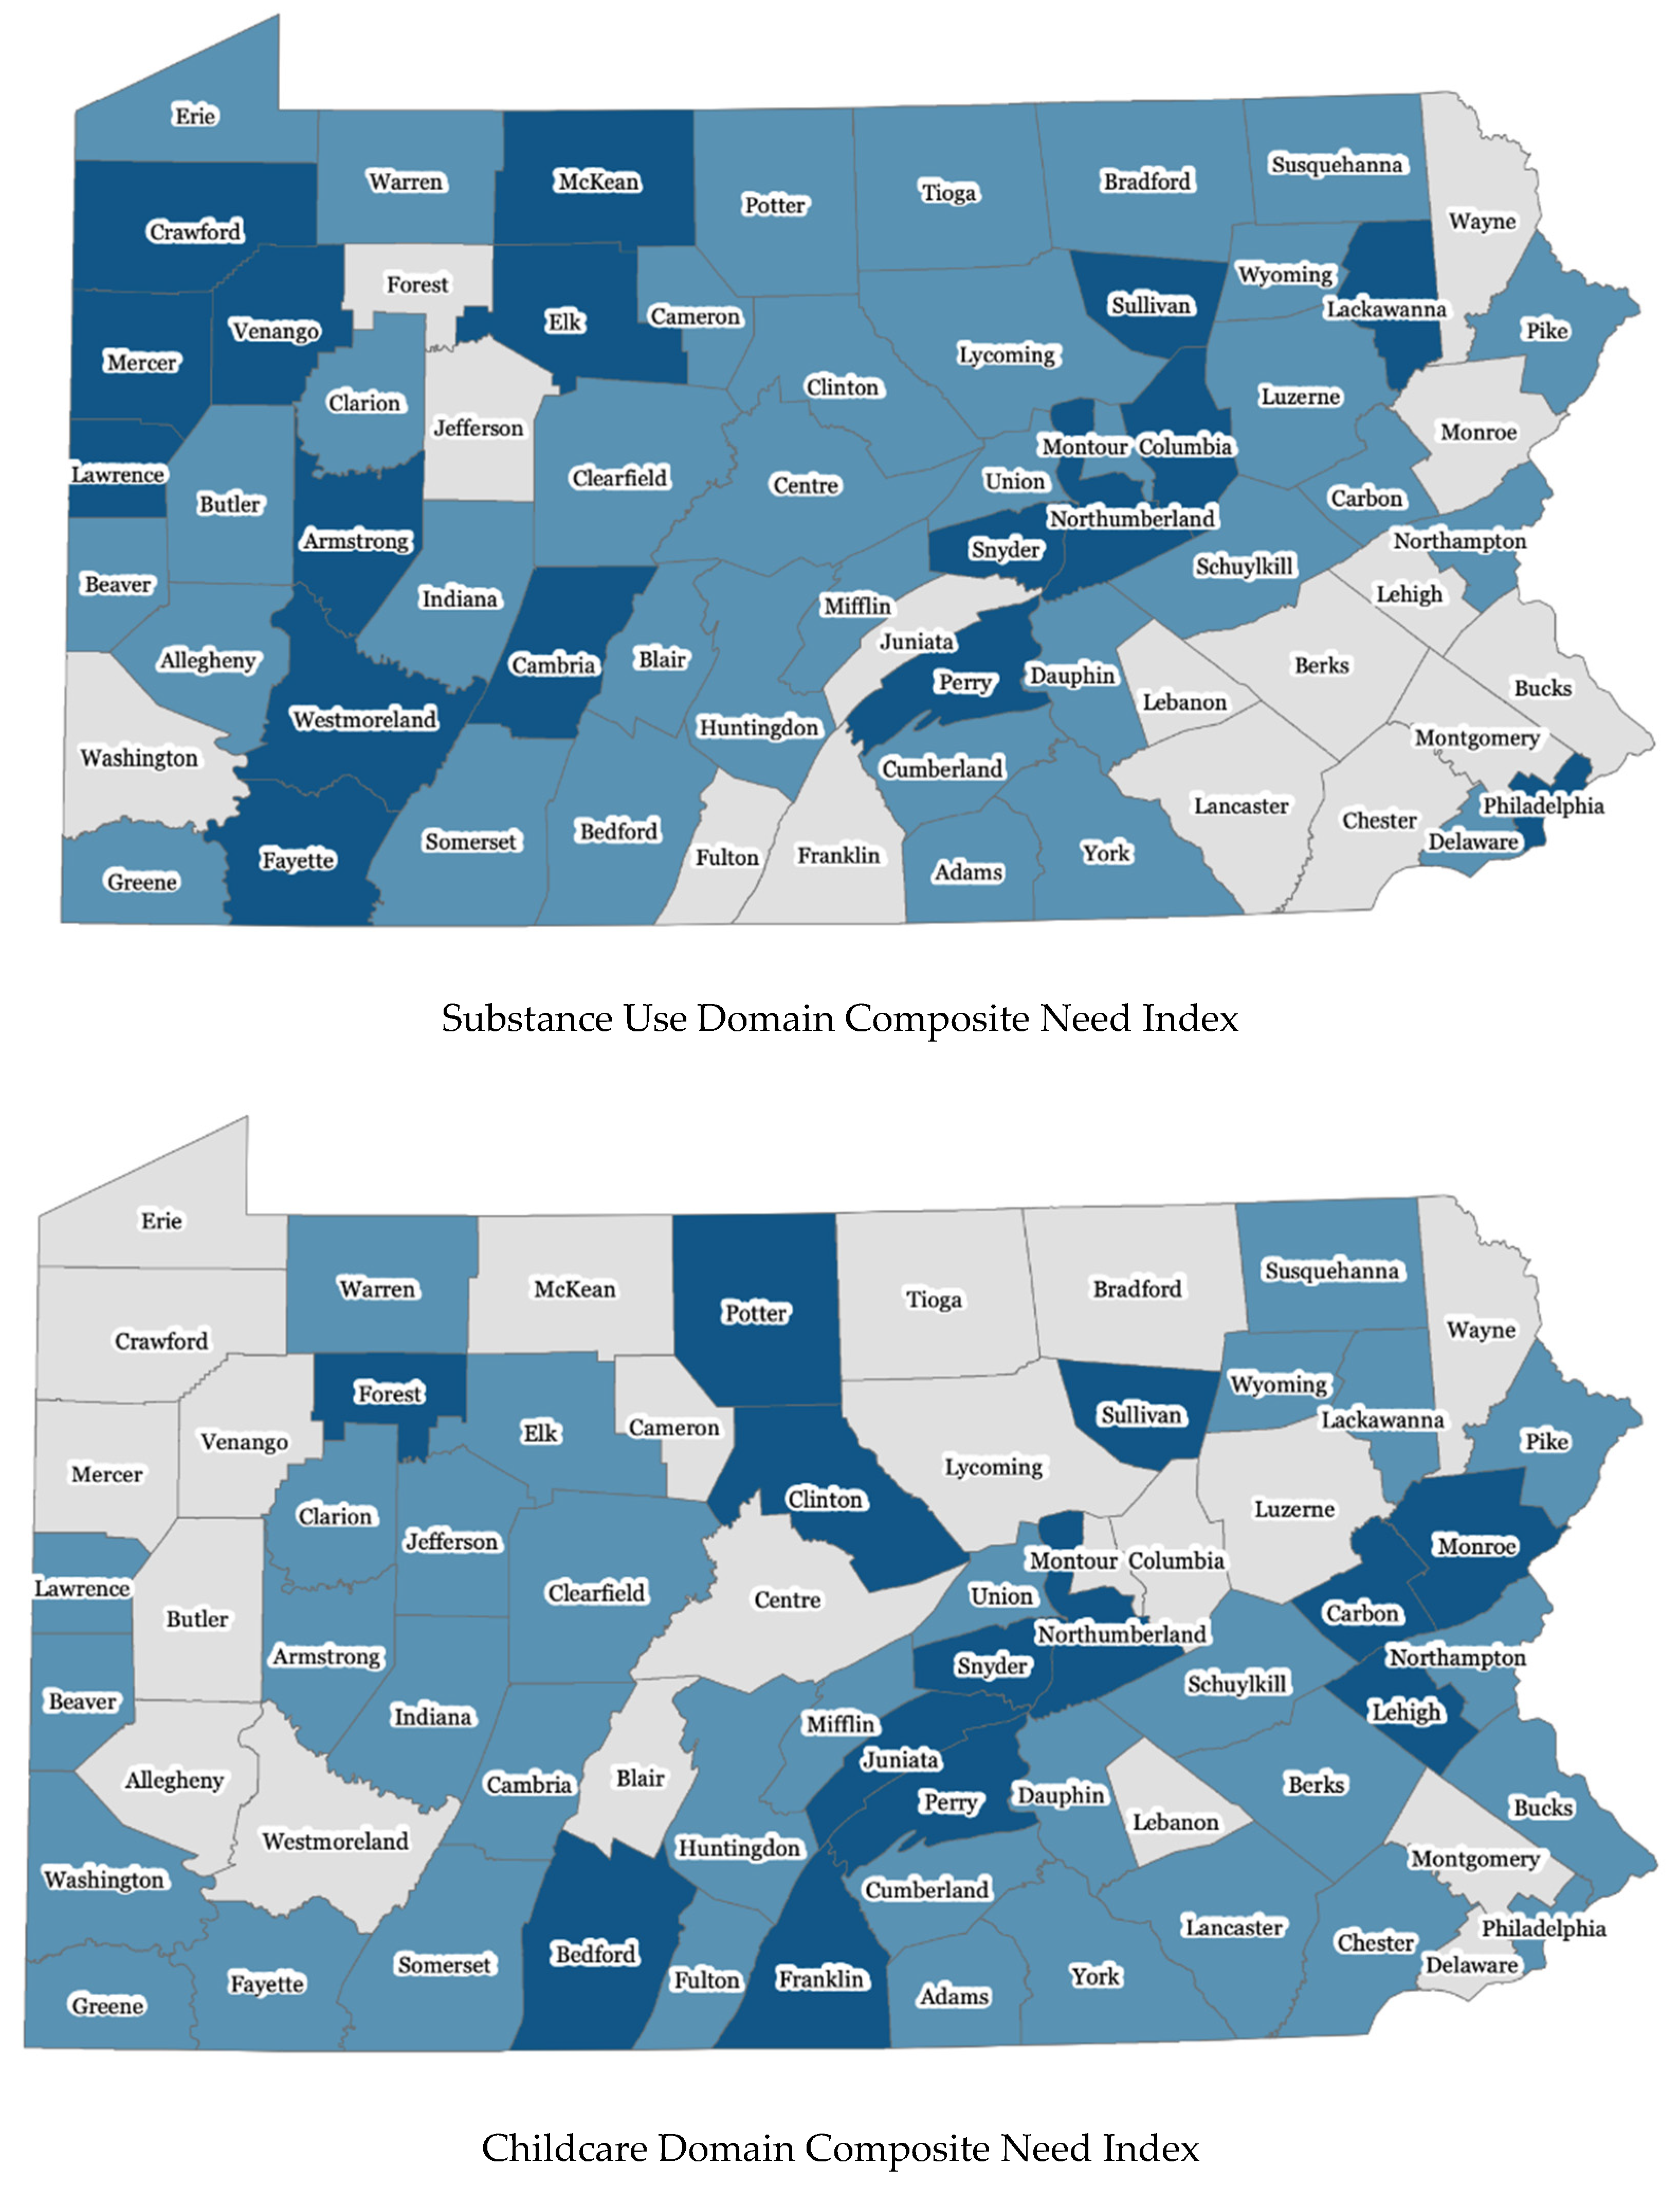
| Substance Use Domain | |
| Postpartum high-risk opioid use | Rate of mothers filling ≥ 2 opioid prescriptions in the 2017 calendar year among Medicaid-enrolled mothers who delivered live births during 2015–2016 |
| Substance treatment facilities | Number of drug and alcohol treatment facilities per 100,000 residents |
| Mental health treatment facilities | Number of mental health treatment facilities per 100,000 residents |
| Buprenorphine physicians | Number of Buprenorphine treatment practitioners per 100,000 residents |
| Impaired drivers | Number of vehicle crashes involving impaired driver per 100,000 residents |
| Overdose deaths | Rate of overdose deaths per 100,000 people aged 15–64 years |
| Opioid overdose hospitalizations | Rate of hospitalization for opioid overdose per 100,000 residents |
| Neonatal abstinence syndrome | Rate of neonatal abstinence syndrome per 1000 newborn stays |
| Pregnancy and postpartum substance use disorder | Rate of diagnosed substance use disorder in the 2016 calendar year among Medicaid-enrolled mothers who were pregnant or delivered live births during 2014–2016 |
| Alcohol use disorder | Prevalence rate of Alcohol Use Disorder among individuals aged 12 and older |
| Marijuana use | Prevalence rate of marijuana use in past month among individuals aged 12 and older |
| Cocaine use | Prevalence rate of cocaine use in the past year among individuals aged 12 and older |
| Heroin use | Prevalence rate of heroin use in the past year among 12 and older |
| Maternal smoking during pregnancy | Rate of births to mothers who used tobacco during pregnancy per 100 live births |
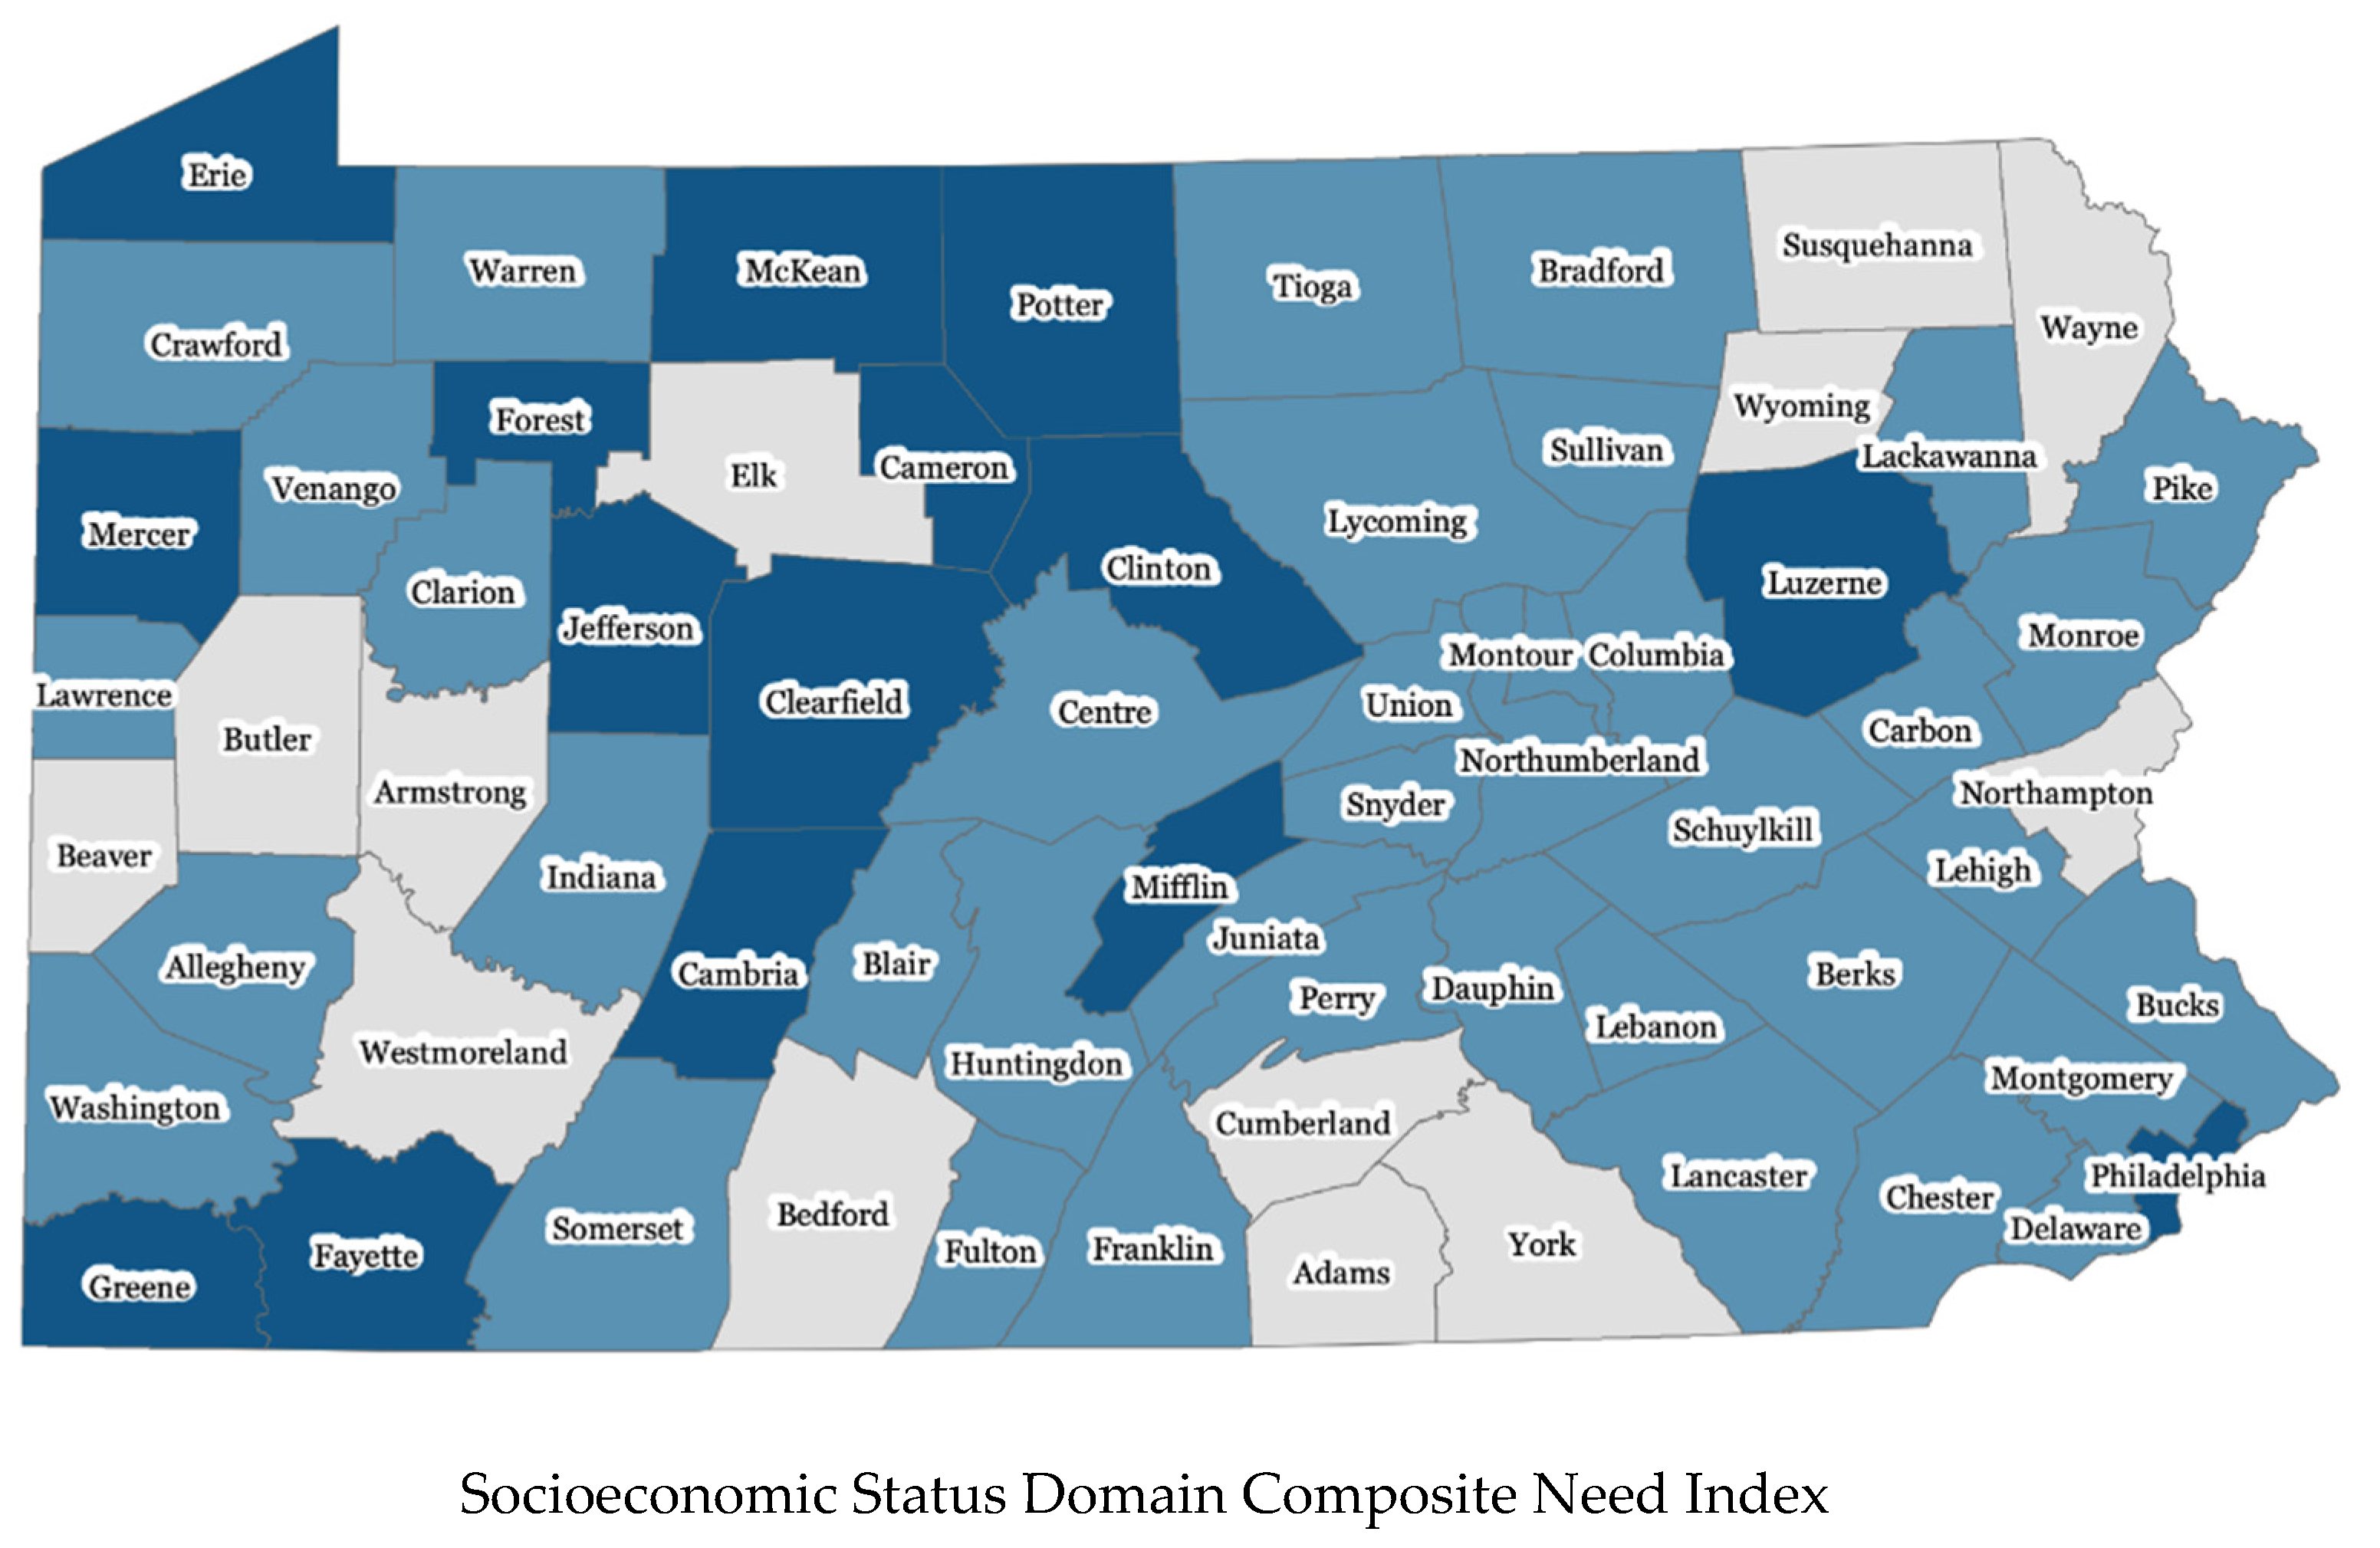
| Socioeconomic Status Domain | |
| Poverty | Percent of population living below 100% Federal Poverty Level (FPL) |
| Child poverty | Percent of children under age 5 living in poverty |
| Income inequality | Gini Coefficient 5-year estimate or 1-year estimate |
| Unemployment | Unemployed percent of the civilian labor force |
| Teens Not in School | Percent of 16–19-year-olds not enrolled in school and with no high school diploma |
| Teen births | Number of births per 1000 female population ages 15–19 |
| Mothers without high school diploma | Percent of births to mothers whose educational attainment is below high school |
| Public assistance | Percent of households with children under 18 years who have received Supplemental Security Income (SSI), Cash Assist, or Supplemental Nutrition Assistance Program (SNAP) in the past 12 months |
| Renters who are cost burdened | Percent of renters who are cost burdened by rent |
| WIC redemptions | Per capita dollar amount of SNAP for Women, Infant, and Children (WIC) redemptions |
| Child food insecurity | Percent of children living in households that experienced food insecurity at some point in 2017 |
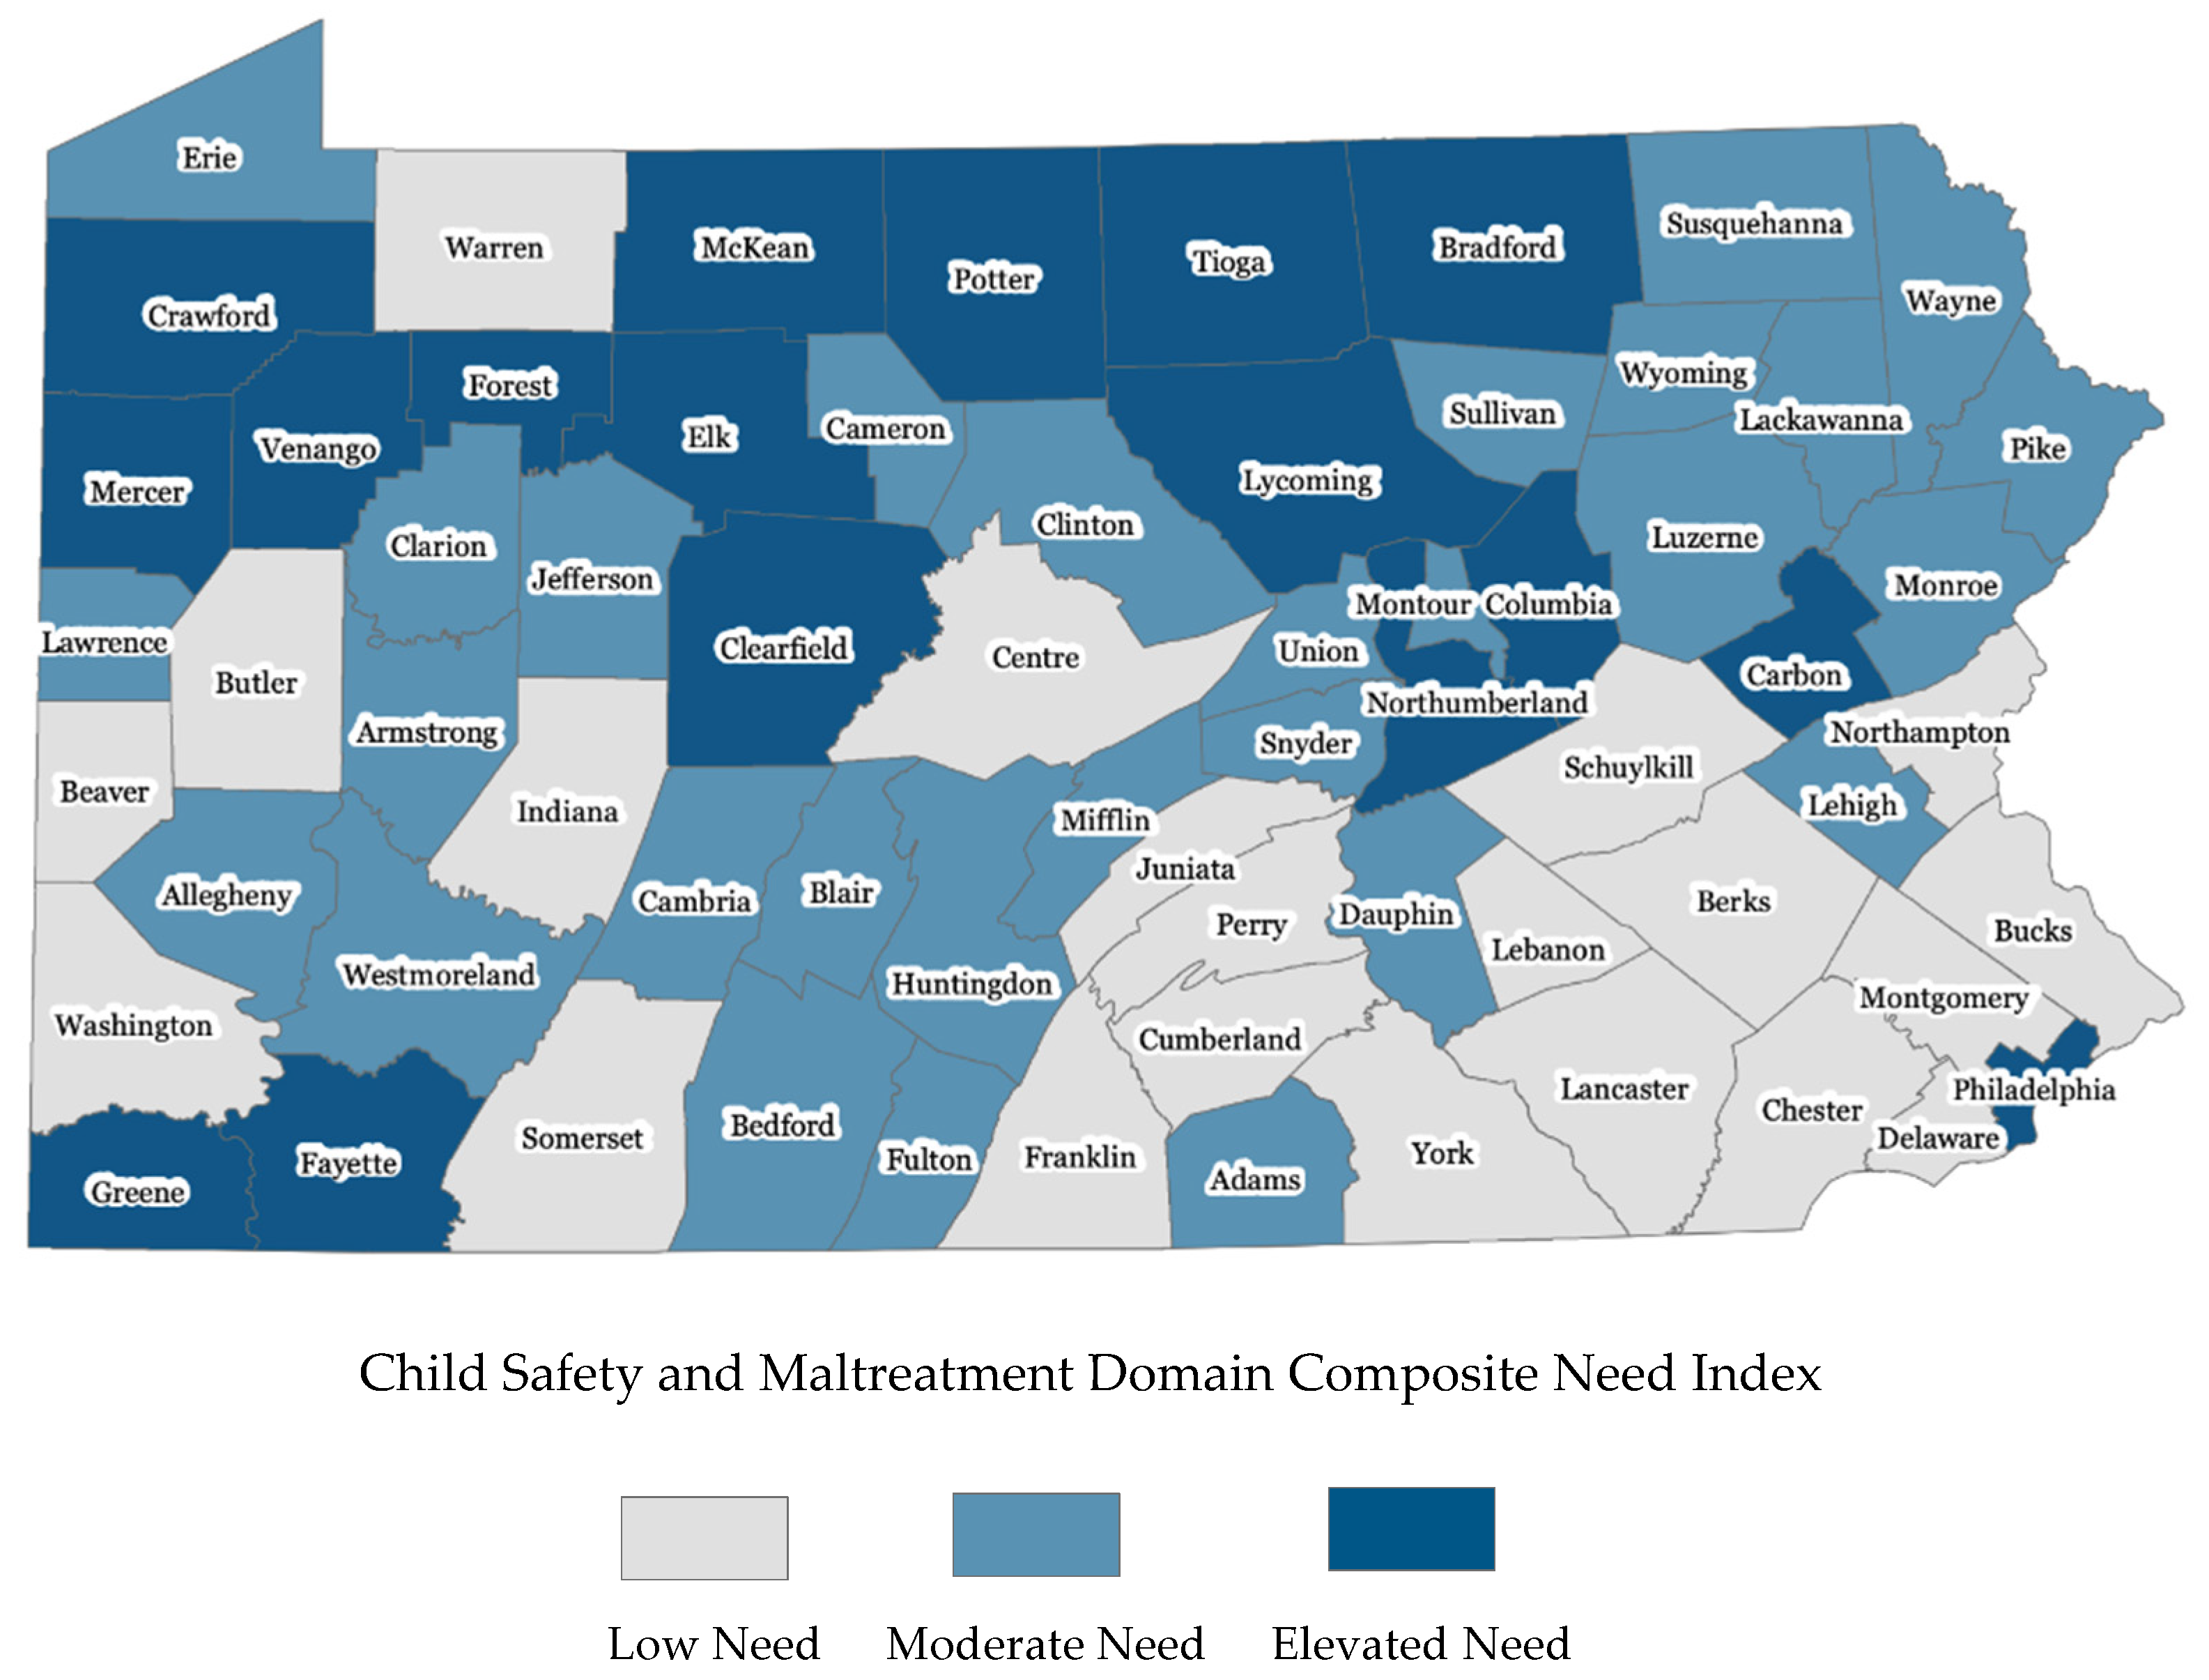
| Child Safety and Maltreatment Domain | |
| Child Maltreatment | Number of children with substantiated reports of child abuse per 1000 children under 18 years old |
| Substantiated young child abuse and neglect | Number of substantiated child abuse and neglect per 1000 children aged 0–4 |
| Abuse against pregnant and postpartum women | Rate of diagnosed abuse in the 2016 calendar year among Medicaid-enrolled pregnant women or women who gave live birth during 2014–2016 |
| Domestic violence-related deaths among women of childbearing age | Number of domestic violence-related deaths per 1000 female aged 15–50 years |
| Protection from abuse order | Number of judge-grated protection from abuse order per 1000 residents |
| Infant non-superficial injury | Prevalence of children having non-superficial injury during the first year of life per 1000 Medicaid-enrolled children |
| Young child non-superficial injury | Prevalence of children having non-superficial injury during the first 5 years of life per 1000 Medicaid-enrolled children |
| Child welfare in-home services | Percent of children under 18 receiving child welfare in-home services in Fiscal Year (FY) 2017–2018 |
| Substance Use Need | Composite need score of a set of substance use disorder-related indicators |
| Community Environment Domain | |
| SNAP-authorized stores | Number of SNAP authorized stores per 1000 families |
| WIC-authorized stores | Number of WIC authorized stores per 1000 families with children under 6 |
| Low-income and low-access census tracts | Percent of census tract with low income and low access |
| Hospitals | Number of hospital beds per 1000 residents |
| Community Health Centers | Number of community Health Centers, Federally Qualified Health Centers (FQHCs), and look alikes per 100,000 residents |
| Primary care physicians | Number of primary care physicians per 1000 residents |
| Pediatric Dentists | Number of Active Clinical Pediatric Dentists per 1000 children under age 18 |
| Crimes | Number of reported crimes per 1000 residents |
| Juvenile arrests | Number of crime arrests ages 0–17 per 100 juveniles aged 0–17 |
| Environmental quality | Average index score of potential exposure to harmful toxins |
| Libraries | Number of libraries per 100,000 residents |
| Public Transit in Urban Counties | Public transit performance score in 6 urban counties (Delaware, Chester, Montgomery, Bucks, Philadelphia, and Allegheny) |
| Car Ownership in Rural Counties | Percent of census tracts with low car ownership in 61 rural counties |
| Children Blood Lead Level (BLL) | Percent of children with confirmed BLLs ≥ 5 µg/dL |
| Residential Segregation | Index of dissimilarity, where higher values indicate greater residential segregation between Black and White county residents |
| Childcare Domain | |
| Regulated Childcare | Number of regulated childcare providers per 100 children residents under 3 years old |
| High-quality Childcare | Percent of regulated childcare providers meeting high-quality standards |
| Subsidized Childcare | Percent of children 0–5 eligible for Child Care Works (CCW) who were served by CCW |
| Publicly Funded Pre-K | Percent of children aged 3–4 below 300% poverty with access to publicly funded, high-quality pre-k |
| Quality of Subsidized Childcare | Percent of children aged 0–5 receiving subsidized childcare in Keystone STARS (Standards, Training/Professional Development, Assistance, Resources, and Supports) program level 3 or 4 facilities |
| Indicator Estimates and Need Scores | Domain Composite Need Index | |||||||||||||||||||||||
|---|---|---|---|---|---|---|---|---|---|---|---|---|---|---|---|---|---|---|---|---|---|---|---|---|
| Indicator Name 1: | Late Prenatal Care | Preterm Birth | Low Birth Weight | NICU Admission | Late/No Breastfeeding Initiation | Infant Mortality | Child Mortality | Maternal Depression | Well-Baby Visits | Young Child Well-Child Visit | Racial Disparity in Low Birth Weight | |||||||||||||
| Indicator Weight: | 7 | 8 | 8 | 6 | 6 | 7 | 7 | 7 | 7 | 6 | 7 | Composite Need Score 3 | Composite Need Index 4 | |||||||||||
| Raw Value | Need Score 2 | Raw Value | Need Score 2 | Raw Value | Need Score 2 | Raw Value | Need Score 2 | Raw Value | Need Score 2 | Raw Value | Need Score 2 | Raw Value | Need Score 2 | Raw Value | Need Score 2 | Raw Value | Need Score 2 | Raw Value | Need Score 2 | Raw Value | Need Score 2 | |||
| Example counties: | ||||||||||||||||||||||||
| Mercer | 31.6 | 1 | 9.5 | 0 | 7.2 | 0 | 6.2 | 0 | 27.6 | 0 | 7.8 | 1 | 2.2 | 1 | 15.5 | 1 | 3 | 1 | 0 | 1 | 2.5 | 1 | 0.63 | Elevated |
| Dauphin | 31.2 | 1 | 10.1 | 1 | 9.1 | 1 | 9.9 | 1 | 15.2 | 0 | 7.8 | 1 | 1.9 | 1 | 7.7 | 0 | 5 | 0 | 1 | 0 | 1.9 | 0 | 0.57 | Elevated |
| Allegheny | 12.4 | 0 | 9.3 | 0 | 7.8 | 0 | 11.0 | 1 | 20.3 | 0 | 5.9 | 0 | 1.4 | 0 | 10.3 | 0 | 4 | 1 | 1 | 0 | 2.2 | 1 | 0.26 | Moderate |
| Butler | 17 | 0 | 8.5 | 0 | 6.1 | 0 | 8.8 | 0 | 18.2 | 0 | 2.8 | 0 | 0.5 | 0 | 11.9 | 0 | 3 | 1 | 0 | 1 | 2.3 | 1 | 0.26 | Moderate |
| Lehigh | 22.5 | 0 | 9.2 | 0 | 8.1 | 0 | 9.1 | 0 | 16.6 | 0 | 6.2 | 0 | 1.3 | 0 | 8.8 | 0 | 5 | 0 | 1 | 0 | 1.8 | 0 | 0.0 | Low |
| Montgomery | 21.3 | 0 | 8.4 | 0 | 7.4 | 0 | 8.4 | 0 | 9.2 | 0 | 4.8 | 0 | 1.1 | 0 | 5.7 | 0 | 5 | 0 | 1 | 0 | 1.9 | 0 | 0.0 | Low |
| State-wide statistics: | ||||||||||||||||||||||||
| Min | 12.4 | 6.1 | 4.8 | 3.5 | 2.6 | 0.0 | 0.0 | 3.0 | 2 | 0 | 0.8 | 0.0 | ||||||||||||
| 25th Percentile | 20.8 | 8.3 | 7.0 | 5.7 | 16.0 | 3.1 | 0.8 | 9.9 | 4 | 1 | 1.6 | 0.09 | ||||||||||||
| 75th Percentile | 30.2 | 9.7 | 8.1 | 9.3 | 27.6 | 7.2 | 1.7 | 14.5 | 6 | 1 | 2.0 | 0.37 | ||||||||||||
| Max | 38.9 | 11.7 | 10.6 | 20.7 | 46.2 | 14.4 | 3.6 | 18.4 | 7 | 2 | 2.5 | 0.63 | ||||||||||||
| Indicator Estimates and Need Scores | Domain Composite Need Index | |||||||||||||||||||||||||||||
|---|---|---|---|---|---|---|---|---|---|---|---|---|---|---|---|---|---|---|---|---|---|---|---|---|---|---|---|---|---|---|
| Indicator Name 1 | SNAP Stores | WIC-Stores | Low-income & Low-Access Census Tracts | Hospitals | Community Health Centers | Physicians | Pediatric Dentists | Crimes | Juvenile Arrests | Environment Quality | Libraries | Car Ownership | Children Blood Lead | Residential Segregation | ||||||||||||||||
| Indicator Weight | 3 | 3 | 4 | 4 | 6 | 6 | 5 | 5 | 5 | 4 | 4 | 4 | 7 | 5 | Composite Need Score 3 | Composite Need Index 4 | ||||||||||||||
| Raw Value | Need Score 2 | Raw Value | Need Score 2 | Raw Value | Need Score 2 | Raw Value | Need Score 2 | Raw Value | Need Score 2 | Raw Value | Need Score 2 | Raw Value | Need Score 2 | Raw Value | Need Score 2 | Raw Value | Need Score 2 | Raw Value | Need Score 2 | Raw Value | Need Score 2 | Raw Value | Need Score 2 | Raw Value | Need Score 2 | Raw Value | Need Score 2 | |||
| Example counties: | ||||||||||||||||||||||||||||||
| Monroe | 4.1 | 1 | 3.2 | 0 | 3.0 | 0 | 1.4 | 1 | 0.0 | 1 | 0.4 | 1 | 0.00 | 1 | 21.6 | 1 | 1.9 | 1 | 72 | 0 | 4.2 | 1 | 24.2 | 0 | 0.01 | 0 | 34 | 0 | 0.59 | Elevated |
| Juniata | 6.2 | 0 | 1.8 | 1 | 20.0 | 1 | 0.0 | 1 | 0.0 | 1 | 0.2 | 1 | 0.00 | 1 | 8.2 | 0 | 1.1 | 0 | 90 | 0 | 4.1 | 1 | 60.0 | 0 | 0.04 | 0 | 66 | 1 | 0.57 | Elevated |
| Northampton | 5.1 | 1 | 3.4 | 0 | 7.4 | 0 | 3.5 | 0 | 0.7 | 0 | 0.8 | 0 | 0.05 | 0 | 17.0 | 0 | 1.6 | 0 | 60 | 1 | 3.3 | 1 | 42.7 | 0 | 0.11 | 1 | 44 | 0 | 0.28 | Moderate |
| Northumberland | 7.9 | 0 | 3.1 | 0 | 8.3 | 0 | 0.8 | 1 | 1.1 | 0 | 0.5 | 0 | 0.00 | 1 | 15.5 | 0 | 2.0 | 1 | 79.5 | 0 | 7.6 | 0 | 66.7 | 1 | 0.08 | 0 | 53 | 0 | 0.28 | Moderate |
| Columbia | 7.9 | 0 | 3.3 | 0 | 0.0 | 0 | 2.6 | 0 | 1.5 | 0 | 0.6 | 0 | 0.08 | 0 | 15.3 | 0 | 1.2 | 0 | 87 | 0 | 4.5 | 0 | 40.0 | 0 | 0.06 | 0 | 52 | 0 | 0.00 | Low |
| Wayne | 7.1 | 0 | 5.1 | 0 | 7.1 | 0 | 1.7 | 0 | 15.6 | 0 | 0.5 | 0 | 0.11 | 0 | 12.6 | 0 | 0.7 | 0 | 93 | 0 | 11.7 | 0 | 14.3 | 0 | 0.07 | 0 | 43 | 0 | 0.00 | Low |
| State-wide statistics: | ||||||||||||||||||||||||||||||
| Min | 2.7 | 1.4 | 0.0 | 0.0 | 0.0 | 0.0 | 0.00 | 7.9 | 0.7 | 20 | 2.2 | 14.3 | 0.01 | 34 | 0.00 | |||||||||||||||
| 25th Percentile | 5.7 | 2.6 | 1.0 | 1.7 | 0.5 | 0.5 | 0.00 | 12.6 | 1.2 | 71 | 4.3 | 38.7 | 0.04 | 51 | 0.18 | |||||||||||||||
| 75th Percentile | 8.0 | 4.3 | 13.2 | 3.8 | 4.0 | 0.8 | 0.08 | 17.8 | 1.9 | 92 | 10.4 | 60.0 | 0.08 | 65.5 | 0.35 | |||||||||||||||
| Max | 15.8 | 47.6 | 50.0 | 42.5 | 44.5 | 4.5 | 0.27 | 41.5 | 5.6 | 97 | 29.5 | 100 | 0.29 | 76 | 0.58 | |||||||||||||||
| Perinatal, Infant, and Child Health Domain | |||
|---|---|---|---|
| Low Need (Total 14 Counties) | Moderate Need (Total 37 Counties) | Elevated Need (Total 16 Counties) | |
| N of Counties (Column %) | N of Counties (Column %) | N of Counties (Column %) | |
| Community and Environment Domain | |||
| Low Need | 5 (36%) | 10 (27%) | 2 (13%) |
| Moderate Need | 7 (50%) | 19 (51%) | 7 (44%) |
| Elevated Need | 2 (14%) | 8 (22%) | 7 (44%) |
| Socioeconomic Status Domain | |||
| Low Need | 4 (29%) | 8 (22%) | 1 (6%) |
| Moderate Need | 10 (71%) | 21 (57%) | 8 (50%) |
| Elevated Need | 0 (0%) | 8 (22%) | 7 (44%) |
| Substance Use Domain | |||
| Low Need | 4 (26%) | 10 (27%) | 3 (19%) |
| Moderate Need | 8 (57%) | 21 (57%) | 6 (38%) |
| Elevated Need | 2 (14%) | 6 (16%) | 7 (44%) |
| Childcare Domain | |||
| Low Need | 5 (36%) | 13 (35%) | 3 (19%) |
| Moderate Need | 7 (50%) | 17 (46%) | 9 (56%) |
| Elevated Need | 2 (14%) | 7 (19%) | 4 (25%) |
| Child Safety and Maltreatment Domain | |||
| Low Need | 6 (43%) | 13 (35%) | 2 (13%) |
| Moderate Need | 5 (36%) | 18 (49%) | 6 (38%) |
| Elevated Need | 3 (21%) | 6 (16%) | 8 (50%) |
Publisher’s Note: MDPI stays neutral with regard to jurisdictional claims in published maps and institutional affiliations. |
© 2020 by the authors. Licensee MDPI, Basel, Switzerland. This article is an open access article distributed under the terms and conditions of the Creative Commons Attribution (CC BY) license (http://creativecommons.org/licenses/by/4.0/).
Share and Cite
Wang, X.; Whittaker, J.; Kellom, K.; Garcia, S.; Marshall, D.; Dechert, T.; Matone, M. Integrating the Built and Social Environment into Health Assessments for Maternal and Child Health: Creating a Planning-Friendly Index. Int. J. Environ. Res. Public Health 2020, 17, 9224. https://doi.org/10.3390/ijerph17249224
Wang X, Whittaker J, Kellom K, Garcia S, Marshall D, Dechert T, Matone M. Integrating the Built and Social Environment into Health Assessments for Maternal and Child Health: Creating a Planning-Friendly Index. International Journal of Environmental Research and Public Health. 2020; 17(24):9224. https://doi.org/10.3390/ijerph17249224
Chicago/Turabian StyleWang, Xi, Jennifer Whittaker, Katherine Kellom, Stephanie Garcia, Deanna Marshall, Tara Dechert, and Meredith Matone. 2020. "Integrating the Built and Social Environment into Health Assessments for Maternal and Child Health: Creating a Planning-Friendly Index" International Journal of Environmental Research and Public Health 17, no. 24: 9224. https://doi.org/10.3390/ijerph17249224
APA StyleWang, X., Whittaker, J., Kellom, K., Garcia, S., Marshall, D., Dechert, T., & Matone, M. (2020). Integrating the Built and Social Environment into Health Assessments for Maternal and Child Health: Creating a Planning-Friendly Index. International Journal of Environmental Research and Public Health, 17(24), 9224. https://doi.org/10.3390/ijerph17249224