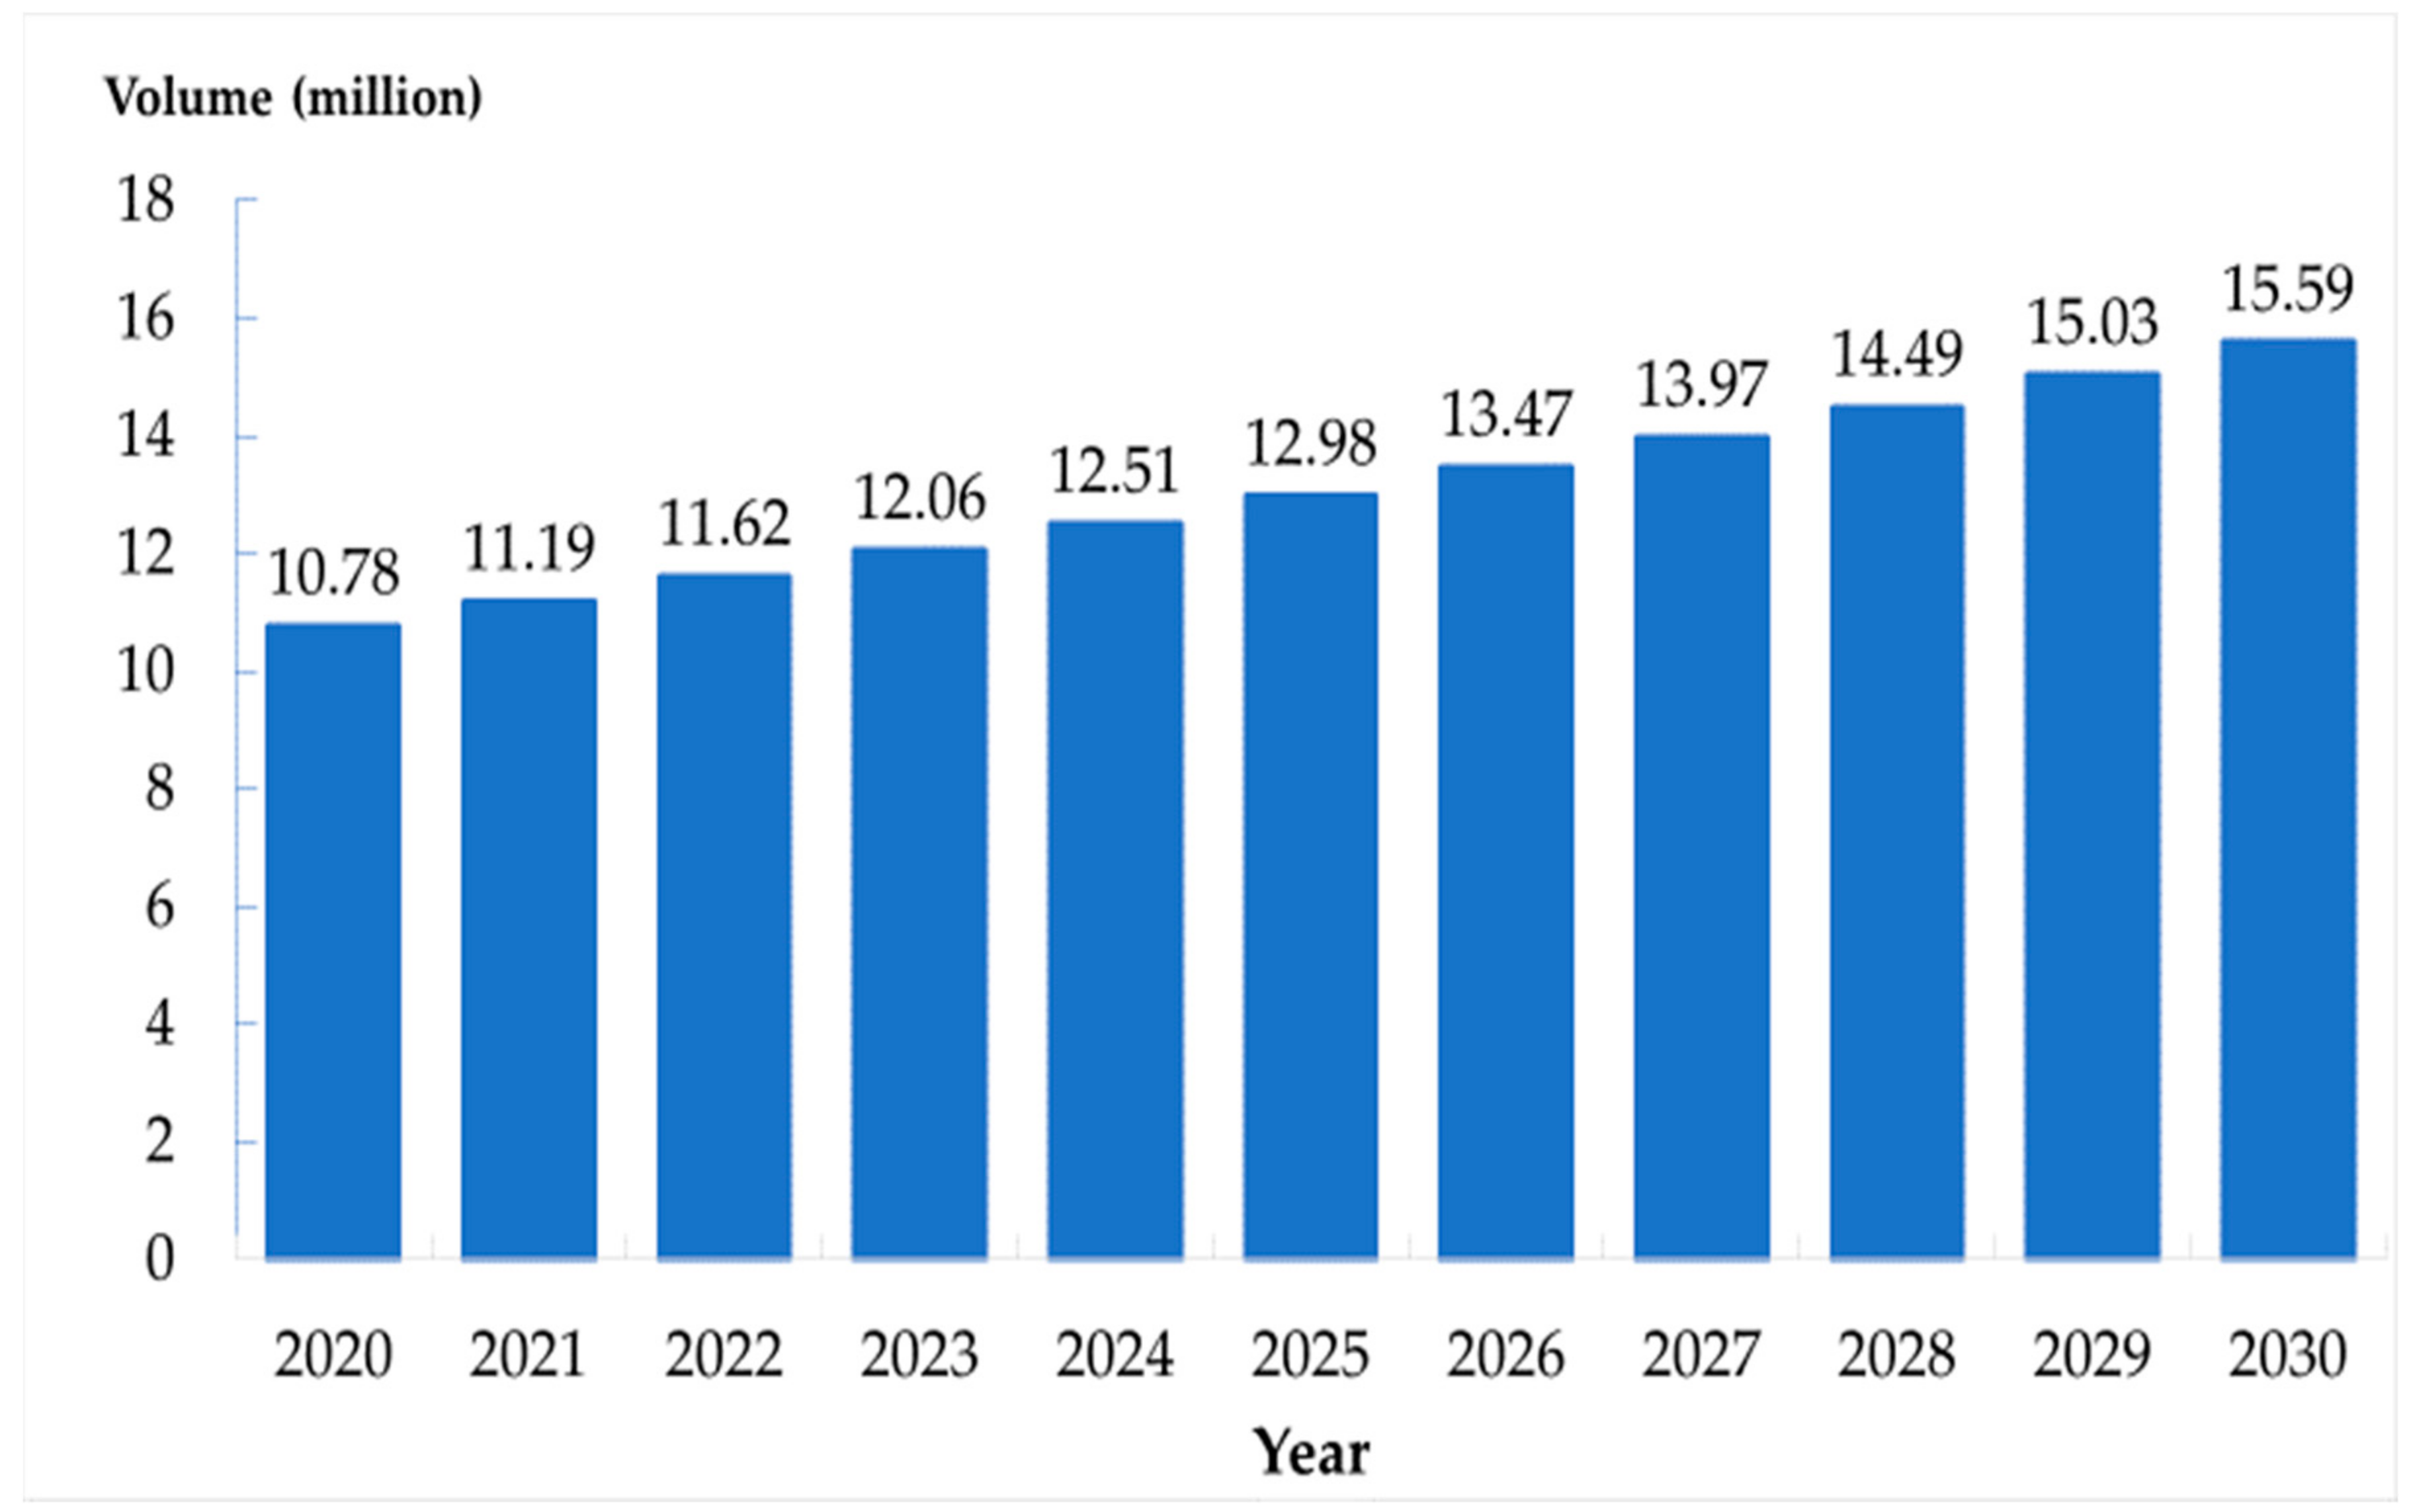
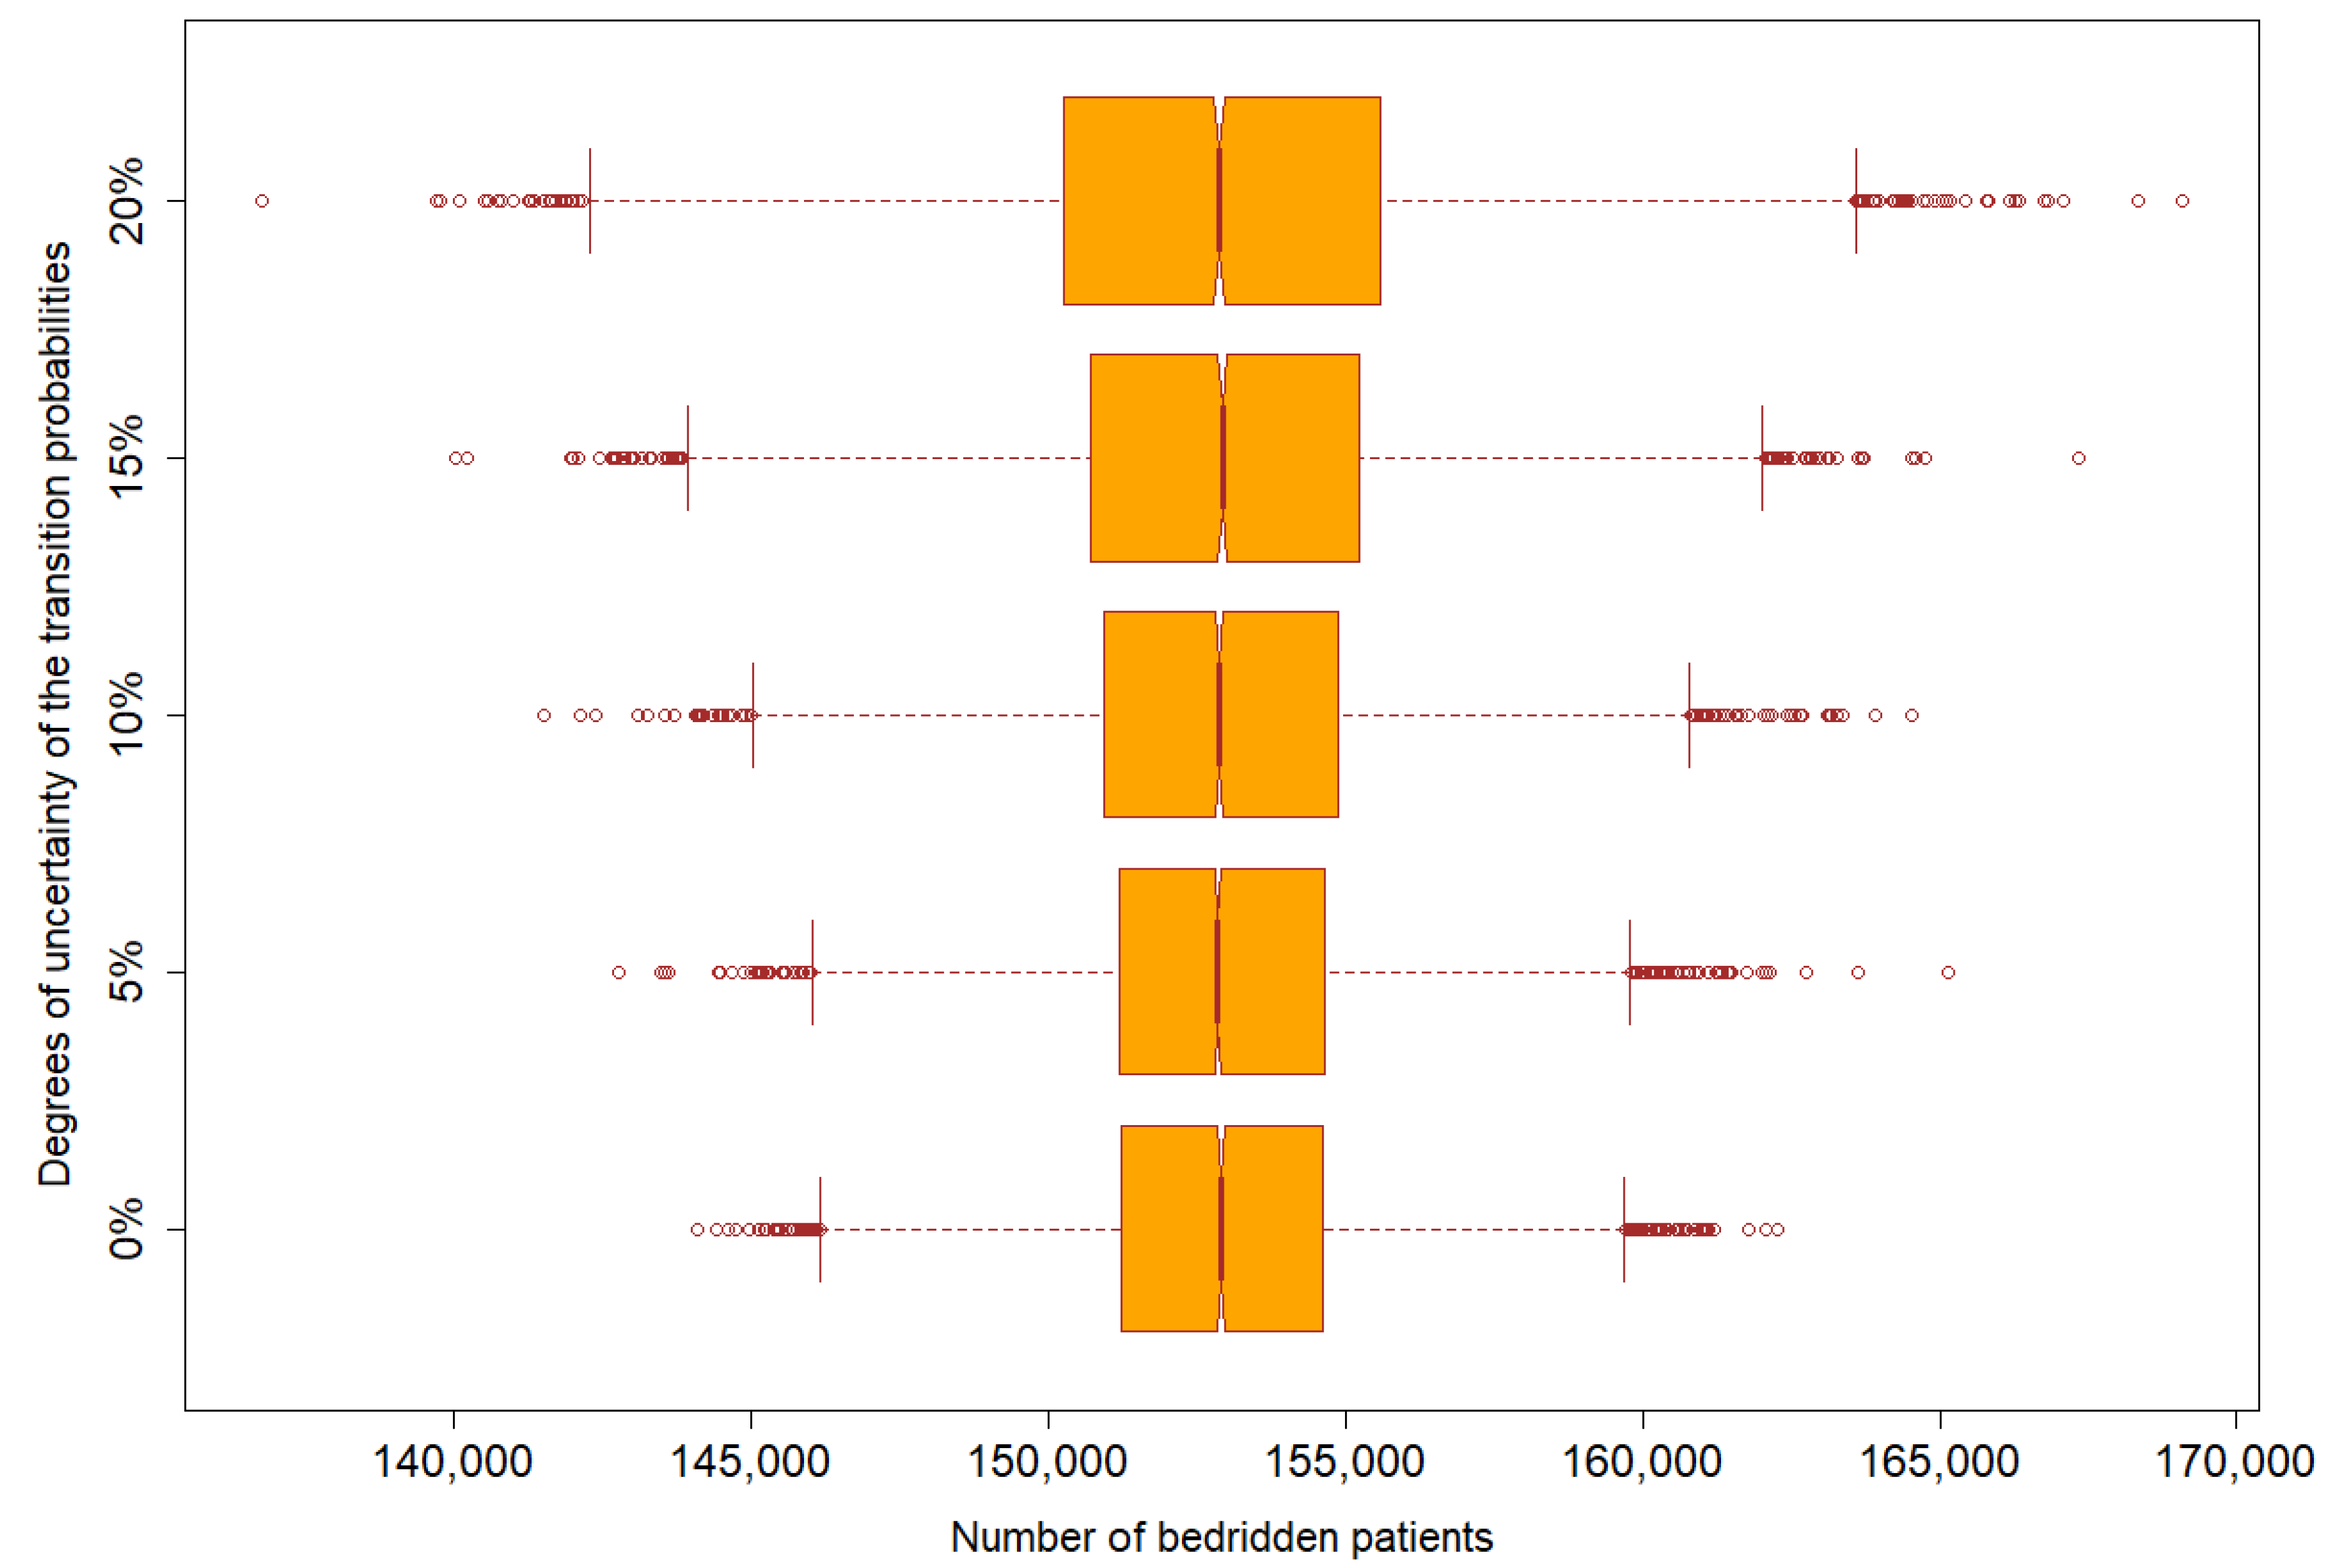
Projection of the Number of Elderly in Different Health States in Thailand in the Next Ten Years, 2020–2030
Abstract
1. Introduction
2. Method
2.1. Study Design and Development of Conceptual Framework
2.2. Parameter Management
2.2.1. Population Cohort in Each Time Frame (Λ)
2.2.2. Transition Probabilities (Θ)
2.2.3. Starting Population (Pop(t = 0))
2.2.4. Mortality Rate (Δ)
2.3. Model Prediction Error
2.4. Model Validation
2.5. Projection of the Amount of Bedridden Patients
2.6. Sensitivity Analysis
2.7. Statistical Software
3. Results
3.1. Parameter Identification
3.1.1. Population Cohort in Each Time Frame (Λ)
3.1.2. Transition Probabilities (Θ)
3.1.3. Starting Population
3.1.4. Mortality Rate (Δ)
3.2. Model Validation
3.3. Projected Amount of Bedridden Patients
3.4. Sensitivity Analysis
4. Discussion
5. Conclusions
Author Contributions
Funding
Acknowledgments
Conflicts of Interest
Ethical Consideration
References
- Foundation of Thai Gerontology Research and Development Institute. Situation of the Thai Elderly 2018; AP: Bangkok, Thailand, 2018.
- UN. Department of Economic and Social Affairs Population Dynamics. Available online: https://population.un.org/wpp/ (accessed on 28 January 2019).
- Divison of Epidemiology. Annual Epidemiology Surveillance Report 2017; MOPH: Nonthaburi, Thailand, 2017.
- Divison of Epidemiology. Annual Epidemiological Surveillance Report 2018; MOPH: Nonthaburi, Thailand, 2018.
- Department of Health, Ministry of Public Health. Barthel Activities of Daily Living: ADL. Available online: http://hpc9.anamai.moph.go.th/ewt_dl_link.php?nid=508 (accessed on 28 January 2019).
- National Health Security Office (NHSO). Guideline of Long-Term Care Services Management for the Dependent Elderly in the National Health Insurance System; NHSO: Bangkok, Thailand, 2016.
- Ekkaphakorn, W. Report of the 3rd Public Health Survey by Physical Examination 2003, 3rd ed.; Prapakkham, Y., Bunyaratpan, P., Eds.; MOPH: Nonthaburi, Thailand, 2006.
- Leung, E. Projecting the Needs and Costs of Long Term Care in Australia; The University of Melbourne Victoria: Melbourne, Australia, 2003; pp. 1–31. [Google Scholar]
- Rickayzen, B.D.; Walsh, D.E.P. A Multi-State Model of Disability for the United Kingdom: Implications for Future Need for Long-Term Care for the Elderly. Br. Actuar. J. 2002, 1, 341–393. [Google Scholar] [CrossRef]
- Costa-Font, J.; Wittenberg, R.; Patxot, C.; Comas-Herrera, A.; Gori, C.; di Maio, A.; Pickard, L.; Pozzi, A.; Rothgang, H. Projecting Long-Term Care Expenditure in Four European Union Member States: The Influence of Demographic Scenarios. Soc. Indic. Res. 2008, 86, 303–321. [Google Scholar]
- Hsu, K.-T.; Yan, T.-M. Applying Grey Forecasting Models to Disability Rate and Demand for Long-Term Care Service of the Aged in Taiwan. In Proceedings of the 2008 IEEE International Conference on Systems, Man and Cybernetics, Singapore, 12–15 October 2008; pp. 2860–2865. [Google Scholar]
- Lagergren, M. Whither Care of Older Persons in Sweden?—A Prospective Analysis Based upon Simulation Model Calculations, 2000–2030. Health Policy 2005, 74, 325–334. [Google Scholar] [CrossRef] [PubMed]
- Srithamrongsawat, S.; Bundhamcharoen, K.; Sasat, S.; Odton, P.; Ratkjaroenkhajorn, S. Projection of Demand and Expenditure for Institutional Long Term Care in Thailand; Health Insurance System Research Office: Bangkok, Thailand, 2014. [Google Scholar]
- Charnduwit, W. Long-Term Care Insurance System: A System Suitable for Thailand; TDRI: Bangkok, Thailand, 2017. [Google Scholar]
- Meira-Machado, L.; de Uña-Álvarez, J.; Cadarso-Suárez, C.; Andersen, P.K. Multi-state models for the analysis of time-to-event data. Stat. Methods Med. Res. 2009, 18, 195–222. [Google Scholar] [CrossRef] [PubMed]
- World Health Organisation (WHO). Current and Future Long-Term Care Needs. 2002. Available online: http://www.who.int/chp/knowledge/publications/ltc_needs.pdf (accessed on 1 April 2020).
- Bureau of Registration Administration. Offical Statistic Registration System. Available online: https://stat.bora.dopa.go.th/stat/statnew/statTDD/ (accessed on 1 April 2020).
- Abdel-Aleem, A.; El-Sharief, M.A.; Hassan, M.A.; El-Sebaie, M.G. Optimization of Reliability Based Model for Production Inventory System. Int. J. Manag. Sci. Eng. Manag. 2018, 13, 54–64. [Google Scholar] [CrossRef]
- Hashemi, S.H.; Mousavi Dehghani, S.A.; Samimi, S.E.; Dinmohammad, M.; Hashemi, S.A. Performance Comparison of GRG Algorithm with Evolutionary Algorithms in an Aqueous Electrolyte System. Model. Earth Syst. Environ. 2020, 6, 2103–2110. [Google Scholar] [CrossRef]
- Strategy and Planning Division. Public Health Statistics A.D.2018; MOPH: Nonthaburi, Thailand, 2018.
- Ryg, J.; Engberg, H.; Mariadas, P.; Pedersen, S.G.; Jorgensen, M.G.; Vinding, K.L.; Andersen-Ranberg, K. Barthel index at hospital admission is associated with mortality in geriatric patients: A danish nationwide population-based cohort study. Clin. Epidemiol. 2018, 10, 1789–1800. [Google Scholar] [CrossRef] [PubMed]
- Department of Health, Ministry of Public Health. Long Term Care. Available online: http://ltc.anamai.moph.go.th/ (accessed on 28 June 2020).


| Model Equation | Formula |
|---|---|
| 1 | S(t + 1) = S(t) + ΛS(t) + H(t) × ΘHS + B(t) × ΘBS − S(t) × ΘSH − S(t) × ΘSB − S(t) × ΔS |
| 2 | H(t + 1) = H(t) + ΛH(t) + S(t) × ΘSH + B(t) × ΘBH − H(t) × ΘHS − H(t) × ΘHB − H(t) × ΔH |
| 3 | B(t + 1) = B(t) + ΛB(t) + H(t) × ΘHB + S(t) × ΘSB − B(t) × ΘBS − B(t) × ΘBH − BG(t) × ΔB |
| 4 | D(t + 1) = D(t) + S(t) × ΔS + H(t) × ΔH + B(t) × ΔB |
| Equation | Formula | Description |
|---|---|---|
| 1 | ΛD = πdie before becoming 60-year-old × Λ | Number of deaths at time t − 1 |
| 2 | Λ′ = Λ − ΛD | Number of the elders entering time t |
| 3 | ΛS = πS × Λ′ | Number of social group entering time t |
| 4 | ΛH = πH × Λ′ | Number of home group entering time t |
| 5 | ΛB = πB × Λ′ | Number of bedridden group entering time t |
| Equation | Formula | Description |
|---|---|---|
| 1 | Pop(0) = S(0) + H(0) + B(0) + D(0) | Total volume of population aged ≥60 years consisted of people aged ≥60 years in the social group, the home group, the bedridden group, and the death group at time 0. |
| 2 | S(0) = Pop(0) × ΠS | Volume of people aged ≥60 years in the social group resulted from population aged ≥60 years multiplied by prevalence of social group. |
| 3 | H(0) = Pop(0) × ΠH | Volume of people aged ≥60 years in the home group resulted from population aged ≥60 years multiplied by prevalence of home group. |
| 4 | B(0) = Pop(0) × ΠB | Volume of people aged ≥60 years in the bedridden group resulted from population aged ≥60 years multiplied by prevalence of bedridden group. |
| 5 | D(0) = 0 | Volume of dead people in the model. We assumed there was no death at the beginning of the analysis. |
| Equation | Formula | Description |
|---|---|---|
| 1 | Crude mortality rate was a prevalence weight average of group-specific mortality. | |
| 2 | ΔS = × Δ | Social group mortality rate was social group specific severity factors multiply by crude mortality. |
| 3 | ΔH = × Δ | Home group mortality rate was home group specific severity factors multiply by crude mortality. |
| 4 | ΔB = × Δ | Bedridden group mortality rate was bedridden group specific severity factors multiply by crude mortality. |
| 5 | Relative risk of home mortality was calculated from home group mortality rate over social group mortality rate. | |
| 6 | Relative risk of bedridden mortality was calculated from bedridden group mortality rate over social group mortality rate. | |
| 7 | Social group mortality was calculated from group specific prevalence and relative risk. This equation was rewritten form of equations 1–6. |
| Equation | Formula | Description |
|---|---|---|
| 1 | Mean absolute percentage error (MAPE) of group j was the summation of absolute difference divided by observed value. | |
| 2 | Model error was mean average of all group-specific errors combined. |
| No | Group of Variables | Parameters | Mean | SD | Reference (Ref) |
|---|---|---|---|---|---|
| 1 | New population | Λ | Λ = 302,880 × e0.0359(t) | Bureau of Registration administration [17] | |
| 2 | Prevalence of specific group who age equal 59-year-old | πS | 0.9922 | - | Model calibration from Bureau of Registration administration [17] |
| 3 | πH | 0.0029 | 0.000031 | Charnduwit [14] | |
| 4 | πB | 0.0049 | 0.000041 | ||
| 5 | πD | 0.0131 | 0.0054 | Model calibration from Bureau of Registration administration [17] | |
| 6 | Mortality rate | Δ | 0.0307 | 0.0011 | Bureau of Registration administration and Strategy and Planning Division [17,20] |
| 7 | Relative mortality rate | RH | 1.45 | 0.0010 (SE of ln RR) | Ryg [21] |
| 8 | RB | 2.27 | 0.0010 (SE of ln RR) | ||
| 9 | Prevalence of specific group in elderly | ΠS | 0.9683 | - | Model calibration from Charnduwit [14] |
| 10 | ΠH | 0.0199 | 0.000046 | Charnduwit [14] | |
| 11 | ΠB | 0.0118 | 0.000036 | ||
| 12 | Mortality rate in specific group | ΔS | 0.0494 | - | Model calibration from Bureau of Registration administration, Strategy and Planning Division, and Ryg [17,20,21] |
| 13 | ΔH | 0.1465 | - | ||
| 14 | ΔB | 0.2050 | - | ||
| 15 | Transit probability from social group | ΘSH | 0.0169 | - | Model calibration from Rickayzen [9] |
| 16 | ΘSB | 0.0071 | - | ||
| 17 | Transit probability from home group | ΘHS | 0.1257 | - | |
| 18 | ΘHB | 0.0782 | - | ||
| 19 | Transit probability from bedridden group | ΘBS | 0.0470 | - | |
| 20 | ΘBH | 0.0688 | - | ||
| 21 | Initial Total population | Pop(t = 0) | 11,136,059 | - | Bureau of Registration administration [17] |
Publisher’s Note: MDPI stays neutral with regard to jurisdictional claims in published maps and institutional affiliations. |
© 2020 by the authors. Licensee MDPI, Basel, Switzerland. This article is an open access article distributed under the terms and conditions of the Creative Commons Attribution (CC BY) license (http://creativecommons.org/licenses/by/4.0/).
Share and Cite
Tantirat, P.; Suphanchaimat, R.; Rattanathumsakul, T.; Noree, T. Projection of the Number of Elderly in Different Health States in Thailand in the Next Ten Years, 2020–2030. Int. J. Environ. Res. Public Health 2020, 17, 8703. https://doi.org/10.3390/ijerph17228703
Tantirat P, Suphanchaimat R, Rattanathumsakul T, Noree T. Projection of the Number of Elderly in Different Health States in Thailand in the Next Ten Years, 2020–2030. International Journal of Environmental Research and Public Health. 2020; 17(22):8703. https://doi.org/10.3390/ijerph17228703
Chicago/Turabian StyleTantirat, Panupong, Repeepong Suphanchaimat, Thanit Rattanathumsakul, and Thinakorn Noree. 2020. "Projection of the Number of Elderly in Different Health States in Thailand in the Next Ten Years, 2020–2030" International Journal of Environmental Research and Public Health 17, no. 22: 8703. https://doi.org/10.3390/ijerph17228703
APA StyleTantirat, P., Suphanchaimat, R., Rattanathumsakul, T., & Noree, T. (2020). Projection of the Number of Elderly in Different Health States in Thailand in the Next Ten Years, 2020–2030. International Journal of Environmental Research and Public Health, 17(22), 8703. https://doi.org/10.3390/ijerph17228703


