Article

Development of a Prediction Model to Identify Children at Risk of Future Developmental Delay at Age 4 in a Population-Based Setting

by
Nienke H. van Dokkum
1,2,*,
Sijmen A. Reijneveld
2,
Martijn W. Heymans
3,
Arend F. Bos
1 and
Marlou L. A. de Kroon
2
1
Department of Pediatrics, Division of Neonatology, Beatrix Children’s Hospital, University Medical Center Groningen, University of Groningen, Hanzeplein 1, 9713GZ Groningen, The Netherlands
2
Department of Health Sciences, University Medical Center Groningen, University of Groningen, Hanzeplein 1, 9713GZ Groningen, The Netherlands
3
Department of Epidemiology and Biostatistics, Amsterdam University Medical Center, location VU, University Medical Center, de Boelelaan 1089a, 1081HV Amsterdam, The Netherlands
*
Author to whom correspondence should be addressed.
Int. J. Environ. Res. Public Health 2020, 17(22), 8341; https://doi.org/10.3390/ijerph17228341
Submission received: 14 October 2020 / Revised: 5 November 2020 / Accepted: 7 November 2020 / Published: 11 November 2020

Abstract

:
Our aim was to develop a prediction model for infants from the general population, with easily obtainable predictors, that accurately predicts risk of future developmental delay at age 4 and then assess its performance. Longitudinal cohort data were used (N = 1983), including full-term and preterm children. Development at age 4 was assessed using the Ages and Stages Questionnaire. Candidate predictors included perinatal and parental factors as well as growth and developmental milestones during the first two years. We applied multiple logistic regression with backwards selection and internal validation, and we assessed calibration and discriminative performance (i.e., area under the curve (AUC)). The model was evaluated in terms of sensitivity and specificity at several cut-off values. The final model included sex, maternal educational level, pre-existing maternal obesity, several milestones (smiling, speaking 2–3 word sentences, standing) and weight for height z score at age 1. The fit was good, and the discriminative performance was high (AUC: 0.837). Sensitivity and specificity were 73% and 80% at a cut-off probability of 10%. Our model is promising for use as a prediction tool in community-based settings. It could aid to identify infants in early life (age 2) with increased risk of future developmental problems at age 4 that may benefit from early interventions.

1. Introduction

The World Health Organization estimates that 8% of all children under 5 years have some type of developmental deficit [1]. In the United States, estimates are even higher, with developmental deficits occurring in 15% of children aged 3 to 17 years [2]. In approximately 10% of all children worldwide, developmental deficits occur as early as 4 to 12 months of age [3]. Developmental delay in childhood has been adversely related to academic achievement in adolescence [4] and adulthood [5,6]. Early interventions, i.e., at preschool age, have been shown to improve the functioning of these children [7,8,9], with earlier interventions yielding greater developmental gains [7,8,9]. Several early intervention services have been evaluated in these reviews, mainly preschool programs focusing on language acquisition, motor development, or both [7,8,9]. Effects included enhanced cognitive and motor development in infancy, academic achievement and social competence at school age, as well as a higher socio-economic status (that is higher rates of high school graduation, employment or home ownership) [7,8,9].
The positive effects of early intervention confirm the importance of timely identification of the children concerned. Ideally, such identification should be conducted in a community-based setting, where all eligible children receive follow-up. An example of such an environment is community-based well-child care, such as preventive child healthcare (PCH) offered in the Netherlands. PCH includes repeated consultations, which are offered to all children from birth until adolescence; these consultations are free of charge and attended by over 95% of all Dutch children during the first years of life [10]. Many factors from birth onwards in several domains (i.e., perinatal factors, developmental milestones, or growth) have been associated with developmental delay (i.e., lagging behind in psychomotor, cognitive, or language development from preschool age to adolescence) [4,11,12,13,14,15,16,17,18,19,20,21,22,23]. However, some of these, specifically clinical factors such as results from cranial ultrasound, umbilical cord pH values, or extensive developmental tests, cannot easily be obtained in community-based well-child settings.
A prediction tool could assist clinicians in identifying children at high risk of future developmental delay. However, studies on prediction models for developmental delay in childhood are scarce [24,25,26]. Moreover, most models developed to date require information that is usually not available for all children in community-based settings. To be effective in community-based well-child care, a prediction model and eventually a tool should be based on information commonly recorded or easily obtainable in such settings. Therefore, the aim of our study was to develop a prediction model for infants from the general population, with easily obtainable predictors, that accurately predicts risk of future developmental delay at age 4, and to assess its performance, in order to support well-child care professionals and pediatricians, thereby enhancing possibilities for timely interventions.

2. Materials and Methods

2.1. Setting and population

For this study, we used data from the Longitudinal Preterm Outcome Project (LOLLIPOP). LOLLIPOP is a community-based cohort consisting of both full-term and preterm (early and moderately-late preterm) children. As preterm children in particular are at greater risk of developmental delay and are well represented in this cohort, the data suited our aim of developing a prediction tool. Thirteen PCH services participated in LOLLIPOP, from which 45,446 children, full-term and preterm (gestational age [GA] < 36 weeks) and comprising almost 25% of all Dutch 4-year-olds, were screened for eligibility. After every second preterm child, the next full-term child from the same birth year was selected as a control. In addition, the cohort was enriched with early preterm children (GA < 32 weeks) from 5 neonatal intensive care units, who were alive upon discharge. Children with major congenital malformations and syndromes were excluded. Eventually, a total inclusion of 2517 children (79%) were achieved in LOLLIPOP. For 1983 children, developmental data within the preset timeframe were available.

2.2. Outcome Measure

Development was assessed upon school entry (i.e., at age 4 in the Dutch setting), using the Dutch version of the parent-reported Ages and Stages Questionnaire (ASQ) 48 months’ form. Our research group showed that the Dutch ASQ, although not a diagnostic instrument, is a valid, reliable, cost-effective, fast, and easy way to screen children for developmental delay with a sensitivity to predict special educational needs at age 5 of 89% and corresponding specificity of 80% [26]. The ASQ 48 months’ form contains 30 items in 5 developmental domains: communication, gross motor, fine motor, problem solving, and personal–social functioning [26]. All five domains add up to an ASQ total score, which indicates a child’s general development. A total score below -2 standard deviations (SD) for the reference group of Dutch full-term children was considered to be abnormal and was coded as 1, compared to a normal score, which was coded as 0.

2.3. Candidate Predictors

Based on a literature search, we identified predictors associated with developmental delay. To prevent overfitting of the prediction model, we made a selection from these variables, based on their expected predictive strength and feasibility of use in community-based well-child care. We grouped our candidate predictors into four groups: (1) perinatal factors, i.e., GA and birth weight [11,12], sex [13,14,15], being born small-for-gestational-age (SGA) [16], multiple birth [17], and Apgar score [22]; (2) parental factors, i.e., maternal educational level [18], pre-existing maternal obesity [17], and maternal smoking during pregnancy [19] (3) growth, i.e., weight for height z score at 1 and 2 years [20], and (4) developmental milestones, i.e., smiling [21], speaking 2–3 word sentences [5,21], head-lifting [6,21], standing [4,5,21], and walking [5,21].
GA was verified by early ultrasound measures during pregnancy in over 95% of all participants. We extracted information on candidate predictors from a general questionnaire upon inclusion and cross-examined using either PCH or hospital files. We defined pre-existing maternal obesity as a body mass index (BMI) >30kg/m2. Maternal educational level was defined as low (i.e., <12 years of formal education) or high (i.e., 12+ years of formal education). Being born SGA was classified as <P10 according to the Dutch Kloosterman curves [27]. Apgar score was assessed 5 min after birth, and a score <7 was classified as abnormal. Growth measurements of height and weight were determined according to protocol at PCH at 1 and 2 years of age. Weight for height z scores were calculated according to the fourth Dutch nationwide growth study [28]. Developmental milestones were assessed in PCH. Smiling is normally achieved at approximately 6 weeks of age, upon which PCH physicians asked parents for the exact age in weeks. The developmental milestones head-lifting (3 months), standing (1 year), walking (18 months), and speaking 2 to 3-word sentences (2 years) were assessed by the PCH physician as attained versus not attained.

2.4. Statistical Analyses

Statistical analyses were conducted using R version 3.5.1 (R Foundation for Statistical Computing, Vienna, Austria) and SPSS version 25.0 (IBM Corp., Armonk, NY, USA). All analyses and reporting were conducted according to the Transparent Reporting of a multivariable prediction model for Individual Prognosis Or Diagnosis (TRIPOD) guideline [29]. First, we described data completeness and participant characteristics. Second, we imputed missing values using the Multivariate Imputation by Chained Equations (MICE) method, assuming the data to be missing at random [30], leading to 10 imputed datasets. Then, we used backwards selection to select variables for our prediction model, using a p-value of <0.157 (Akaike Information Criterion) [29]. Next, we performed internal validation, using bootstrapping techniques [29], generating 250 bootstrap samples from the original dataset, and applying replacements from the original sample and the prediction model in the bootstrapped samples. Using this procedure, we estimated and corrected for optimism in regression coefficients.
For the prediction model, we used the Hosmer–Lemeshow test to test the agreement between observed and predicted probabilities of developmental delay, interpreting it as a good fit when the p-value was above 0.05. We also assessed discriminative performance, both before and after internal validation. Discriminative performance (i.e., the potential of the prediction model to distinguish between children with and without developmental delay) was assessed using the area under the curve (AUC) of the receiver operating characteristic (ROC) curve.
Next, we evaluated our prediction model in terms of sensitivity, specificity, positive predictive value (PPV) and negative predictive value (NPV) at several cut-off values.
Finally, we constructed a tool with the help of Excel, a calculator to automatically determine the probability of an abnormal ASQ score at 4 years of age (available upon request).

2.5. Ethical Consideration

Written informed consent was obtained from all parents or guardians of the participants in this study. The study was conducted in accordance with the Declaration of Helsinki, and the protocol was approved by the Ethics Committee of University Medical Center Groningen (METc 2005/130). Clinical Trial registry name and registration number could be accessed on controlled-trials.com, ISRCTN 80622320.

3. Results

3.1. Population Characteristics

Of all children in our sample, 8.9% had an ASQ total score below −2 SD. Descriptive values of candidate predictors and information regarding missing data are summarized in Table 1. Data completeness for individual variables ranged from 27% to 100%.

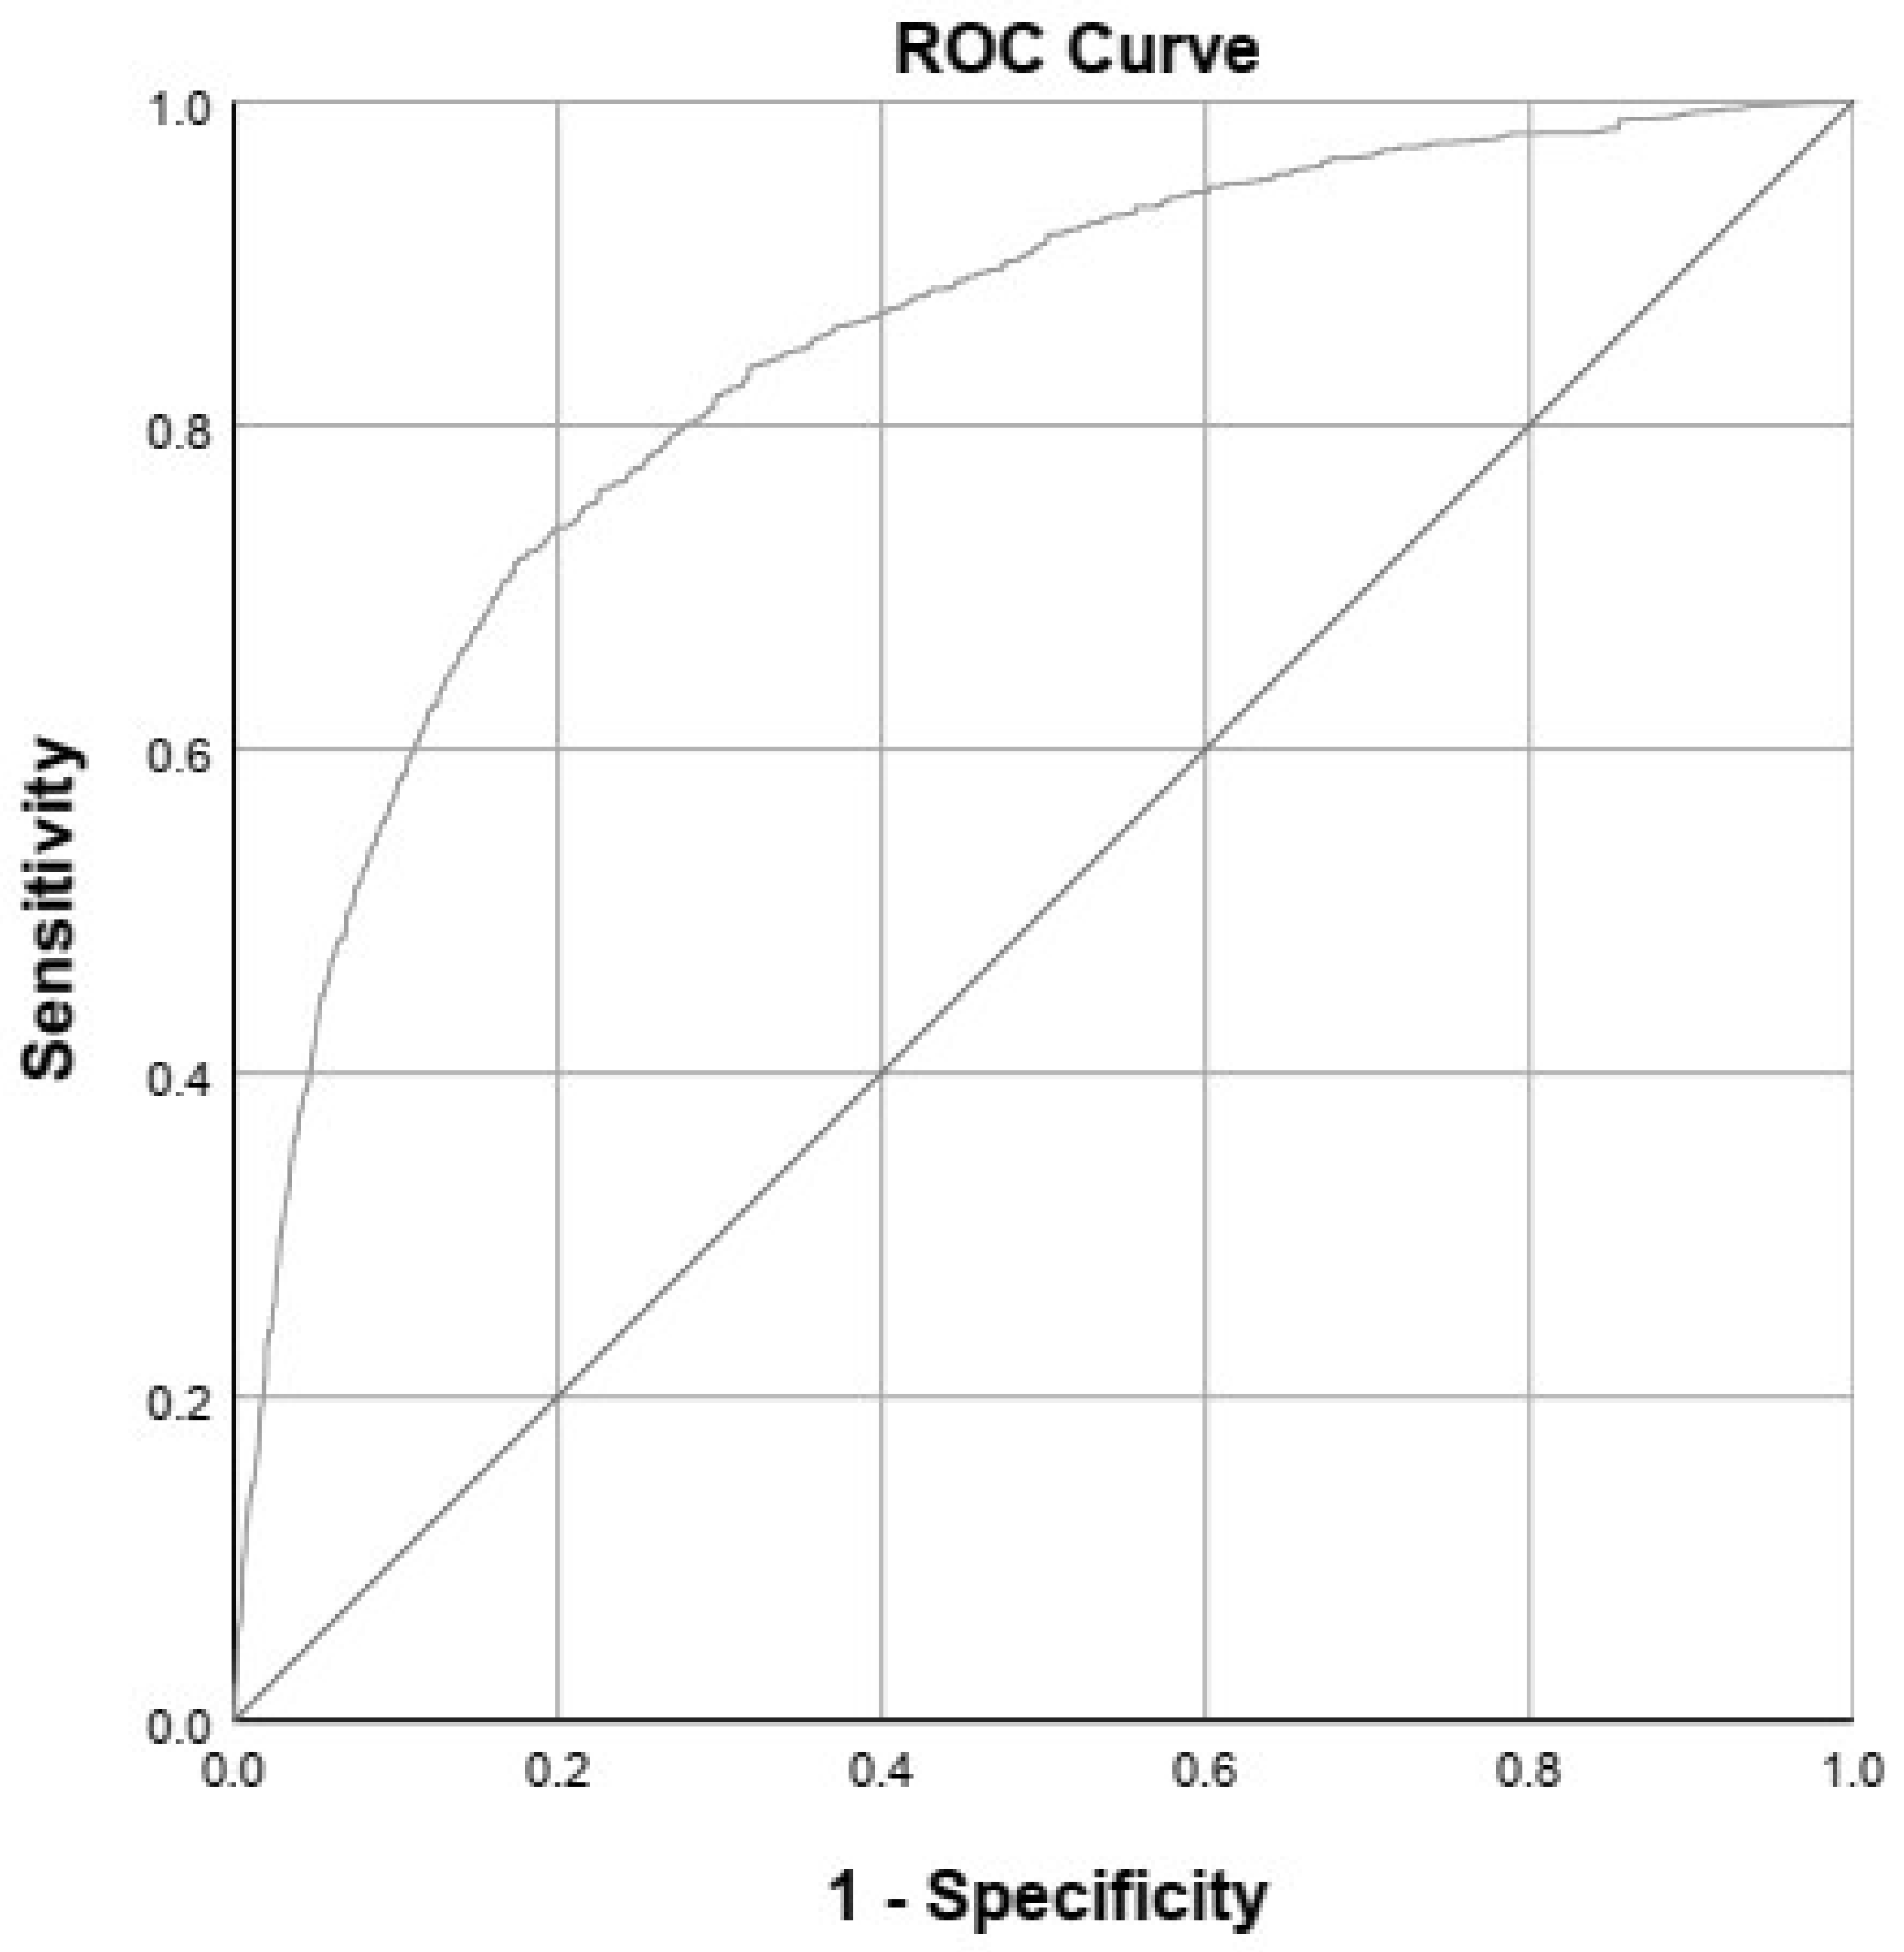
3.2. Prediction Model

The variables in the final prediction model are presented in Table 2 and consisted of variables from all four categories (i.e., perinatal factors, parental factors, growth and developmental milestones). These variables regard sex, maternal educational level, pre-existing maternal obesity, smiling, speaking 2 to 3-word sentences, standing, and weight for height z score at 1 year. Not attaining speaking 2 to 3-word sentences at the age of 2 years implied a five-fold increase in the likelihood of an abnormal ASQ total score at age 4 (OR 5.45, 95%-CI 3.41–8.69). The model showed good calibration; the fit of the model was good, with a p = 0.98 on the Hosmer–Lemeshow test and an explained variance of 31% (Nagelkerke’s R2). Our model had a relatively good discriminative performance. Before internal validation, the model showed an AUC of 0.844, and after internal validation (i.e., after correction for optimism in the regression coefficients), the AUC showed only a slight decrease, to 0.837 (Figure 1). In Table 3, we present the evaluation of our prediction model at several probability cut-off values. The sensitivity (73%) and specificity (80%) values were reasonably good when using a cut-off probability of 10% (i.e., a predicted probability of ≥10% is considered “at risk”).

3.3. Example

Based on the model, we developed a tool, a calculator in Excel. To illustrate the use of the developed calculator in Excel, we introduced a hypothetical child and assume it to be of male sex, having a mother with an education <12 years and pre-existing obesity, having a BMI z score of −0.09 at 1 year of age, and being behind in development, with a smiling age of 13 weeks calendar age (normally approximately 6 weeks) and non-attainment of standing (normally at approximately 1 year) and speaking (normally at approximately 2 years). According to the calculator, the probability that the child’s ASQ will be abnormal at 4 years of age is 63% (Table 4). If this child were to have had a mother without pre-existing obesity, and if he had attained standing and speaking on time, the predicted probability of an abnormal ASQ score at 4 years of age would already be reduced to 6.8%. The first child would be considered at risk, whereas the second would not.

4. Discussion

In this study, we developed a prediction model to predict general developmental delay upon school entry at age 4. With only seven predictors, our prediction model had a good performance. These predictors are easy to obtain in community-based well-child care. The calculator, a tool that was developed on the basis of the underlying model, can support well-child care professionals and pediatricians in identifying children who could benefit from early preventive interventions.
In line with previous studies, we found sex [13,14,15], maternal educational level [17], pre-existing maternal obesity [17], smiling [21], speaking 2 to 3-word sentences [5,6,7,8,9,10,11,12,13,14,15,16,17,18,19,20,21], standing [4,5,21], and BMI z score at 1 year [20] to be predictors. Candidate predictors that did not improve the model were GA, birth weight, being born SGA, being part of a multiple, a low Apgar score, maternal smoking during pregnancy, head-lifting, walking, and BMI z score at 2 years, even though these factors were found to be associated with developmental delay in earlier studies [5,11,12,16,17,19,21,22,31]. Very remarkably, neither GA nor birth weight were included in the final prediction model, although several studies have found prematurity and very low birth weight to be highly predictive of developmental outcomes [11,12,32]. One explanation could be a correlation with included predictors in the final model, although we found no evidence for multi-collinearity. An alternative explanation may be that the developmental milestones are a proxy of a combination of several perinatal variables, such as GA, being born SGA, and perinatal conditions, as the attainment of these milestones is highly related to these variables [33].
We found that our model, based on an inclusion of factors that are easy to obtain in community-based settings, had a good performance, with an AUC of 0.84. We found one comparable prediction model, by Nelson et al., who predicted school readiness on the basis of nine variables, after evaluation of a wide range of predictors obtainable in community-based settings, with an AUC of 0.76 [25]. Importantly, the ASQ and school readiness can be considered as comparable outcome measures, because they both include similar milestones assessed at the same age. However, this study did not include growth and multiple developmental milestones in earlier life as potential predictors. In contrast, two other prediction models that aimed to predict neurodevelopmental outcomes in early infancy included variables that can only be obtained in clinical settings. In the first, Lodha et al. evaluated the Clinical Risk Index for Babies score, including among other factors admission temperature and base-excess determined by blood tests, and they reported good performance, with an AUC of 0.84 [23]. In the second, Yeo et al. constructed a prediction model including among others the use of prenatal steroids, with a much poorer performance, i.e., an AUC of 0.65 [24]. Compared to these clinical prediction models, our prediction model performed relatively well and is of use particularly in community-based settings because of its easily obtainable component variables.
Our prediction model, which has been operationalized in our calculator, showed relatively good sensitivity and specificity at a cut-off predicted probability of 10%. The American Academy of Pediatrics (AAP) has deemed a sensitivity and specificity of around 70% to 80% to be reasonable, even though these values are somewhat lower than generally accepted for medical screening tests, where a specificity of 90% is more common [34]. Routine PCH assessments consisting of the factors that are part of the prediction model we developed are feasible in a population-based setting and only take a little time. With the predictor variables in our model, a risk estimate can be obtained at 2 years of age. Since PCH offers repeated consultations, our model may lead to more intense surveillance in the crucial period between this age and school entry (4 years) in children at increased risk at age 2. Therefore, our model could be used as a tool to aid clinicians in their developmental surveillance, i.e., in making a risk calculation of whether a child is likely to encounter developmental delays later in life.
Our model used the ASQ total score as an outcome measure, which indicates a general developmental delay. Our results might have yielded different predictors regarding the domain scores underlying this total score, i.e., communication, gross motor, fine motor, personal social skills, and problem solving. However, the ASQ total score summarizes development on all these domains and may therefore identify children with delays in any of these domains. An assessment of a high risk of future delay may lead to a more extensive development assessment, e.g., with the Bayley Scales of Infant and Toddler Development, to get a better picture of the development at age 2. Moreover, developmental delay in one domain is often accompanied by a delay in another domain. This focus on general delay aligns with the nature of early intervention services offered to a child, which mostly do not focus on a specific skill (such as motor skills) but rather offer a wide package of support for a child’s development.

4.1. Strengths and Limitations

Our study has several strengths. First and foremost, we retrieved this prediction model using a large dataset from a community-based cohort study, which enabled us to consider many candidate predictors and enhanced the applicability of our model in community-based practice. Second, we internally validated our prediction model by using bootstrapping techniques [29]. Therefore, we believe that our correction for optimism is realistic.
We also acknowledge some limitations of our study. First, instead of a neuropsychological test, we used a parent-reported outcome measure, i.e., the ASQ, to determine developmental delay at age 4. However, the ASQ is considered a valid screening tool for the assessment of general developmental delay, with high sensitivity (89%) and acceptable specificity (80%) for the detection of school problems [26]. Second, some of our variables had a relatively high percentage of missing values. This possibly means that relatively little attention was given to these variables during the consultations, although these data are easy to obtain. We were able to limit the influence of these missing values by using multiple imputation techniques. Third, the predictive values that we calculated (i.e., the NPV and PPV) are population specific. The prevalence of developmental delay was relatively high in our population because it included an oversampling of preterm children. Therefore, for a general population, for which this prediction model was developed, the positive predictive value would probably be lower and the negative predictive value would probably be higher. Finally, we did not have information on early intervention services used by the participating children, which may have decreased the predictive power of our model somewhat.

4.2. Implications

Our results regarding the performance of our prediction model are promising. However, our model should first be externally validated in another cohort to assess whether adaptations to specific populations are needed. Future studies in this field should examine the possibility of developing a dynamic prediction model [35] that can be applied within PCH, enabling a reassessment of the risk after incorporating new information into the model, which may further improve developmental surveillance. Future studies should also focus on implementing the calculator in practice, e.g., by including the calculator into the digitized (preventive) well-child care files, in several settings, and evaluate the effects of combining the calculator with targeted interventions.

5. Conclusions

In conclusion, we developed a prediction model based on only seven easily obtainable variables to predict general developmental delay at age 4 in the general population, with good performance properties. This model is promising for use as a tool in community-based settings, aiding PCH professionals and pediatricians in identifying children at increased risk of developmental delay who may benefit from early preventive interventions.

Author Contributions

Conceptualization: N.H.v.D., S.A.R., A.F.B., and M.L.A.d.K. Methodology: N.H.v.D., M.W.H., and M.L.A.d.K. Formal analysis: N.H.v.D., M.W.H. and M.L.A.d.K. Writing—original draft: N.D. Writing—review and editing: S.A.R., A.F.B., M.W.H., and M.L.A.d.K. Supervision: M.L.A.d.K. All authors have read and agreed to the published version of the manuscript.

Funding

The LOLLIPOP study has been sponsored by grants from the research foundation of the Beatrix Children’s Hospital, the Cornelia Foundation for the Handicapped Child, the A. Bulk-Child Preventive Child Health Care research fund, the Dutch Brain Foundation, and unrestricted investigator initiated research grants from FrieslandCampina, Friso Infant Nutrition, and Pfizer Europe. The financers have had no role in any stage of the project, including the decision to submit the manuscript.

Acknowledgments

This study is part of a larger study on the growth and development of preterm children, known as the LOLLIPOP study. We wish to thank the participating PCHC physicians for their contribution to the field work. In particular, we thank E.M.J. ten Vergert, M. Broer van Dijk and B. van der Hulst for coordinating the project. We kindly thank J. van Seventer for correcting the English of the manuscript. The calculator is available on request from the corresponding author.

Conflicts of Interest

The authors have no conflicts of interest relevant to this article to disclose.

References

  1. Global Research on Developmental Disabilities Collaborators. Developmental disabilities among children younger than 5 years in 195 countries and territories, 1990–2016: A systematic analysis for the global burden of disease study 2016. Lancet Glob. Health 2018, 6, e1100–e1121. [Google Scholar] [CrossRef] [Green Version]
  2. Boyle, C.A.; Boulet, S.; Schieve, L.A.; Cohen, R.A.; Blumberg, S.J.; Yeargin-Allsopp, M.; Visser, S.; Kogan, M.D. Trends in the prevalence of developmental disabilities in US children, 1997–2008. Pediatrics 2011, 127, 1034–1042. [Google Scholar] [CrossRef] [PubMed] [Green Version]
  3. Valla, L.; Wentzel-Larsen, T.; Hofoss, D.; Slinning, K. Prevalence of suspected developmental delays in early infancy: Results from a regional population-based longitudinal study. BMC Pediatr. 2015, 15, 215. [Google Scholar] [CrossRef] [PubMed] [Green Version]
  4. Murray, G.K.; Jones, P.B.; Kuh, D.; Richards, M. Infant developmental milestones and subsequent cognitive function. Ann. Neurol. 2007, 62, 128–136. [Google Scholar] [CrossRef] [PubMed]
  5. Taanila, A.; Murray, G.K.; Jokelainen, J.; Isohanni, M.; Rantakallio, P. Infant developmental milestones: A 31-year follow-up. Dev. Med. Child. Neurol. 2005, 47, 581–586. [Google Scholar] [CrossRef] [PubMed]
  6. Flensborg-Madsen, T.; Mortensen, E.L. Infant developmental milestones and adult intelligence: A 34-year follow-up. Early Hum. Dev. 2015, 91, 393–400. [Google Scholar] [CrossRef] [PubMed]
  7. Anderson, L.M.; Shinn, C.; Fullilove, M.T.; Scrimshaw, S.C.; Fielding, J.E.; Normand, J.; Carande-Kulis, V.G.; Task Force on Community Preventive Services. The effectiveness of early childhood development programs. A systematic review. Am. J. Prev. Med. 2003, 24, 32–46. [Google Scholar] [CrossRef]
  8. McCormick, M.C.; Brooks-Gunn, J.; Buka, S.L.; Goldman, J.; Yu, J.; Salganik, M.; Scott, D.T.; Bennett, F.C.; Kay, L.L.; Bernbaum, J.C.; et al. Early intervention in low birth weight premature infants: Results at 18 years of age for the infant health and development program. Pediatrics 2006, 117, 771–780. [Google Scholar] [CrossRef] [Green Version]
  9. Spittle, A.J.; Orton, J.; Doyle, L.W.; Boyd, R. Early developmental intervention programs post hospital discharge to prevent motor and cognitive impairments in preterm infants. Cochrane Database Syst. Rev. 2007, CD005495. [Google Scholar] [CrossRef] [Green Version]
  10. Siderius, E.J.; Carmiggelt, B.; Rijn, C.S.; Heerkens, Y.F. Preventive child health care within the framework of the dutch health care system. J. Pediatr. 2016, 177S, S138–S141. [Google Scholar] [CrossRef]
  11. Schonhaut, L.; Armijo, I.; Pérez, M. Gestational age and developmental risk in moderately and late preterm and early term infants. Pediatrics 2015, 135, e835–e841. [Google Scholar] [CrossRef] [PubMed] [Green Version]
  12. Kirkegaard, I.; Obel, C.; Hedegaard, M.; Henriksen, T.B. Gestational age and birth weight in relation to school performance of 10-year-old children: A follow-up study of children born after 32 completed weeks. Pediatrics 2006, 118, 1600–1606. [Google Scholar] [CrossRef] [PubMed] [Green Version]
  13. Cho, J.; Holditch-Davis, D.; Miles, M.S. Effects of gender on the health and development of medically at-risk infants. JOGNN 2010, 39, 536–549. [Google Scholar] [CrossRef] [PubMed] [Green Version]
  14. Urben, S.; Van Hanswijck De Jonge, L.; Barisnikov, K.; Pizzo, R.; Monnier, M.; Lazeyras, F.; Borradori Tolsa, C.; Hüppi, P.S. Gestational age and gender influence on executive control and its related neural structures in preterm-born children at 6 years of age. Child Neuropsychol. 2017, 23, 188–207. [Google Scholar] [CrossRef] [Green Version]
  15. Romeo, D.M.; Brogna, C.; Sini, F.; Romeo, M.G.; Cota, F.; Ricci, D. Early psychomotor development of low-risk preterm infants: Influence of gestational age and gender. Eur. J. Paediatr. Neurol. 2016, 20, 518–523. [Google Scholar] [CrossRef]
  16. Van Wassenaer, A. Neurodevelopmental consequences of being born SGA. Pediatr. Endocrinol. Rev. 2005, 2, 372–377. [Google Scholar]
  17. Kerstjens, J.M.; De Winter, A.F.; Sollie, K.M.; Bocca-Tjeertes, I.F.; Potijk, M.R.; Reijneveld, S.A.; Bos, A.F. Maternal and pregnancy-related factors associated with developmental delay in moderately preterm-born children. J. Obstet. Gynecol. 2013, 121, 727–733. [Google Scholar] [CrossRef] [Green Version]
  18. Potijk, M.R.; Kerstjens, J.M.; Bos, A.F.; Reijneveld, S.A.; De Winter, A.F. Developmental delay in moderately preterm-born children with low socioeconomic status: Risks multiply. J. Pediatr. 2013, 163, 1289–1295. [Google Scholar] [CrossRef]
  19. Smith, L.K.; Draper, E.S.; Evans, T.A.; Field, D.J.; Johnson, S.J.; Manktelow, B.N.; Seaton, S.E.; Marlow, N.; Petrou, S.; Boyle, E.M. Associations between late and moderately preterm birth and smoking, alcohol, drug use and diet: A population-based case-cohort study. Arch. Dis. Child Fetal Neonatal Ed. 2015, 100, F486–F491. [Google Scholar] [CrossRef] [Green Version]
  20. Simon, L.; Nusinovici, S.; Flamant, C.; Cariou, B.; Rouger, V.; Gascoin, G.; Darmaun, D.; Rozé, J.; Hanf, M. Post-term growth and cognitive development at 5 years of age in preterm children: Evidence from a prospective population-based cohort. PLoS ONE 2017, 12, e0174645. [Google Scholar] [CrossRef]
  21. Di Rosa, G.; Cavallaro, T.; Alibrandi, A.; Marseglia, L.; Lamberti, M.; Giaimo, E.; Nicotera, A.; Bosignore, M.; Gagliano, A. Predictive role of early milestones-related psychomotor profiles and long-term neurodevelopmental pitfalls in preterm infants. Early Hum. Dev. 2016, 101, 49–55. [Google Scholar] [CrossRef] [PubMed]
  22. Källén, K.; Serenius, F.; Westgren, M.; Maršál, K. Impact of obstetric factors on outcome of extremely preterm births in Sweden: Prospective population-based observational study (EXPRESS). Acta Obstet. Gynecol. Scand. 2015, 94, 1203–1214. [Google Scholar] [CrossRef] [PubMed]
  23. Lodha, A.; Sauvé, R.; Chen, S.; Tang, S.; Christianson, H. Clinical risk index for babies score for the prediction of neurodevelopmental outcomes at 3 years of age in infants of very low birthweight. Dev. Med. Child Neurol. 2009, 51, 895–900. [Google Scholar] [CrossRef] [PubMed]
  24. Yeo, K.T.; Safi, N.; Wang, Y.A.; Le Marsney, R.; Schindler, T.; Bolisetty, S.; Haslam, R.; Lui, K. Prediction of outcomes of extremely low gestational age newborns in Australia and New Zealand. BMJ Paediatr. Open. 2017, 1, e000205. [Google Scholar] [CrossRef]
  25. Nelson, B.B.; Dudovitz, R.N.; Coker, T.R.; Barnet, E.S.; Biely, C.; Li, N.; Sziagyi, P.G.; Larson, K.; Halfon, N.; Zimmerman, F.J.; et al. Predictors of poor school readiness in children without developmental delay at age 2. Pediatrics 2016, 138, e20154477. [Google Scholar] [CrossRef] [Green Version]
  26. Kerstjens, J.M.; Bos, A.F.; Ten Vergert Elisabeth, M.J.; De Meer, G.; Butcher, P.R.; Reijneveld, S.A. Support for the global feasibility of the ages and stages questionnaire as developmental screener. Early Hum. Dev. 2009, 85, 443–447. [Google Scholar] [CrossRef] [Green Version]
  27. Kloosterman, G.J. On intrauterine growth: The significance of prenatal care. Int. J. Gynaecol. Obstet. 1970, 1, 895–912. [Google Scholar] [CrossRef]
  28. Fredriks, A.M.; Van Buuren, S.; Burgmeijer, R.J.; Meulmeester, J.F.; Beuker, F.J.; Brugman, E.; Roede, M.J.; Verloove-Vanhorick, S.P.; Wit, J.M. Continuing positive secular growth change in the Netherlands 1955–1997. Pediatr. Res. 2000, 47, 316–323. [Google Scholar] [CrossRef] [Green Version]
  29. Moons, K.G.M.; Altman, D.G.; Reitsma, J.B.; Ioannidis, J.P.A.; Macaskill, P.; Steyerberg, E.W.; Vickers, A.J.; Fansohoff, D.F.; Collins, G.S. Transparent reporting of a multivariable prediction model for individual prognosis or diagnosis (TRIPOD): Explanation and elaboration. Ann. Intern. Med. 2015, 162, 1. [Google Scholar] [CrossRef] [Green Version]
  30. Van Buuren, S.; Groothuis-Oudshoorn, K. Mice: Multivariate imputation by chained equations in R. J. Stat. Software 2011, 45, 1–67. [Google Scholar] [CrossRef] [Green Version]
  31. Shah, P.E.; Kaciroti, N.; Richards, B.; Lumeng, J.C. Gestational age and kindergarten school readiness in a national sample of preterm infants. J. Pediatr. 2016, 178, 61–67. [Google Scholar] [CrossRef] [PubMed] [Green Version]
  32. Kerstjens, J.M.; De Winter, A.F.; Bocca-Tjeertes, I.F.; Bos, A.F.; Reijneveld, S.A. Risk of developmental delay increases exponentially as gestational age of preterm infants decreases: A cohort study at age 4 years. Dev. Med. Child. Neurol. 2012, 54, 1096–1101. [Google Scholar] [CrossRef] [PubMed] [Green Version]
  33. Van Dokkum, N.H.; De Kroon, M.L.; Bos, A.F.; Reijneveld, S.A.; Kerstjens, J.M. Attainment of gross motor milestones by preterm children with normal development upon school entry. Early Hum. Dev. 2018, 119, 62–67. [Google Scholar] [CrossRef] [PubMed]
  34. Council on Children with Disabilities; Section on Developmental Behavioral Pediatrics; Bright Futures Steering Committee; Medical Home Initiatives for Children with Special Needs Project Advisory Committee. Identifying infants and young children with developmental disorders in the medical home: An algorithm for developmental surveillance and screening. Pediatrics 2006, 118, 405–420. [Google Scholar] [CrossRef] [Green Version]
  35. Welten, M.; Wijga, A.H.; Hamoen, M.; Gehring, U.; Koppelman, G.H.; Twisk, J.W.R.; Raat, H.; Heymans, M.W.; De Kroon, M.L.A. Dynamic prediction model to identify young children at high risk of future overweight: Development and internal validation in a cohort study. Pediatr. Obes. 2020, 15, e12647. [Google Scholar] [CrossRef]
Figure 1. Receiver operating characteristic (ROC) curve after correction for optimism over the 10 imputed datasets (area under the curve = 0.837).
Ijerph 17 08341 g001
Table 1. Description of candidate predictors for the LOLLIPOP population for analysis (N = 1983).
Candidate PredictorsDescriptive ValueData Available for n (%)
Perinatal Factors
Gestational age at birth in weeks, mean (SD)34.3 (4.05)1983 (100)
Gestational age 24–32 weeks, n (%)513 (26)
Gestational age 32–36 weeks, n (%)627 (32)
Gestational age 37–42 weeks, n (%)543 (27)
Male sex, n (%) 1065 (54)1982 (99.9)
SGA, n (%)226 (11)1983 (100)
Multiple birth, n (%)443 (22)1983 (100)
Apgar score at 5 min <7, n (%)73 (3.7)1326 (67)
Parental factors
Maternal educational level <12 years, n (%)1407 (71)1973 (99.5)
Pre-existing maternal obesity (BMI > 30 kg/m2), n (%)94 (4.7)770 (39)
Maternal smoking during pregnancy, n (%)297 (15)1338 (68)
Growth (0–2 years)
Weight for height z score 1 year, mean (SD)−0.08 (1.09)1260 (64)
Weight for height z score 2 years, mean (SD)−0.24 (1.06)1206 (61)
Developmental milestones (0–2 years)
Smiling, onset age in weeks, mean (SD)8.5 (3.51)540 (27)
Speaking 2 to 3 word sentences, n abnormal (%)287 (15)1382 (70)
Head lifting, n abnormal (%)335 (17)1019 (51)
Standing, n abnormal (%)353 (18)1088 (55)
Walking, onset age in months, mean (SD)15.5 (3.12)1239 (63)
LOLLIPOP: Longitudinal Preterm Outcome Project, SD: Standard Deviation, N: number, SGA: small-for-gestational age, BMI: Body Mass Index.
Table 2. Prediction model to identify children at risk of future developmental delay at age 4 according to the ASQ.
Predictor Categories or Unit of MeasurementRegression CoefficientOR95%-CI of OR
Sex0 = female, 1 = male1.23.52.3–5.3
Maternal educational level0 = 12+ years, 1 = <12 years0.82.3 1.4–3.8
Maternal pre-existing obesity0 = BMI <30 kg/m2,
1 = BMI >30 kg/m2
0.61.90.9–4.0
SmilingAge in weeks0.11.1 1.0–1.2
Speaking 2–3 word sentences (2 years)0 = yes, 1 = no1.75.5 3.4–8.7
Standing (1 year)0 = yes, 1 = no0.92.5 1.4–4.4
Weight for height 1 yearz score −0.20.8 0.7–1.0
OR: odds ratio, 95%-CI: 95% confidence interval. According to the Akaike Information Criterion, a p-value < 0.157 is considered statistically significant, and these variables are considered an added value to the prediction model. Each coefficient is multiplied with the shrinkage factor of 0.9748, and subsequently, the new intercept of −5.99 was determined for the shrunken model (pooled optimism factor 0.1181). The linear predictor of this model is −5.99 + 1.21 × Sex + 0.80 × Maternal educational level + 0.60 × Maternal pre-existing obesity + 0.10 × Smiling + 1.65 × Speaking 2–3 word sentences + 0.88 × Standing − 0.21 × BMI z score 1 year.
Table 3. Sensitivity, specificity, NPV and PPV for the developed prediction model, operationalized in the calculator, for an abnormal ASQ total score at age 4 at several cut-off values.
Cut-off valueSensitivity (%)Specificity (%)NPV (%)PPV (%)
Probability 5%86621898
Probability 10%73802797
Probability 20%55913895
Probability 30%38964794
Probability 40%25985193
Probability 50%14995592
Probability: the probability of an abnormal ASQ total score at age four using the linear predictor of the prediction model. NPV: negative predictive value; PPV: positive predictive value.
Table 4. Example of the use of the calculator in Excel format, using the developed prediction model for a hypothetical child as described in the results (“Example”).
VariableUnit
Weight for height z score 1 yearz score−0.09
SmilingAge in weeks13
Maternal pre-existing obesity0 = no (BMI < 30), 1 = yes (BMI > 30)1
Maternal educational level0 = 12+ years, 1 = <12 years1
Standing0 = yes, 1 = no1
Sex0 = female, 1 = male1
Speaking 2–3 word sentences0 = yes, 1 = no1
Probability (%)62.68
Publisher’s Note: MDPI stays neutral with regard to jurisdictional claims in published maps and institutional affiliations.

