Performance Pay in Hospitals: An Experiment on Bonus–Malus Incentives

Abstract
:1. Introduction
2. Literature Review and Research Questions
- Research question 1: How do hospital physicians provide medical treatment in a simplified German DRG system?
- Research question 2: Does the provision behavior of hospital physicians change with the introduction of performance component with bonus–malus incentives to a simplified German DRG system?
- Research question 3: Is there a difference in treatment behavior between practicing hospital physicians and medical students? How does this affect the introduction of a performance component with bonus–malus incentives to a simplified German DRG system?
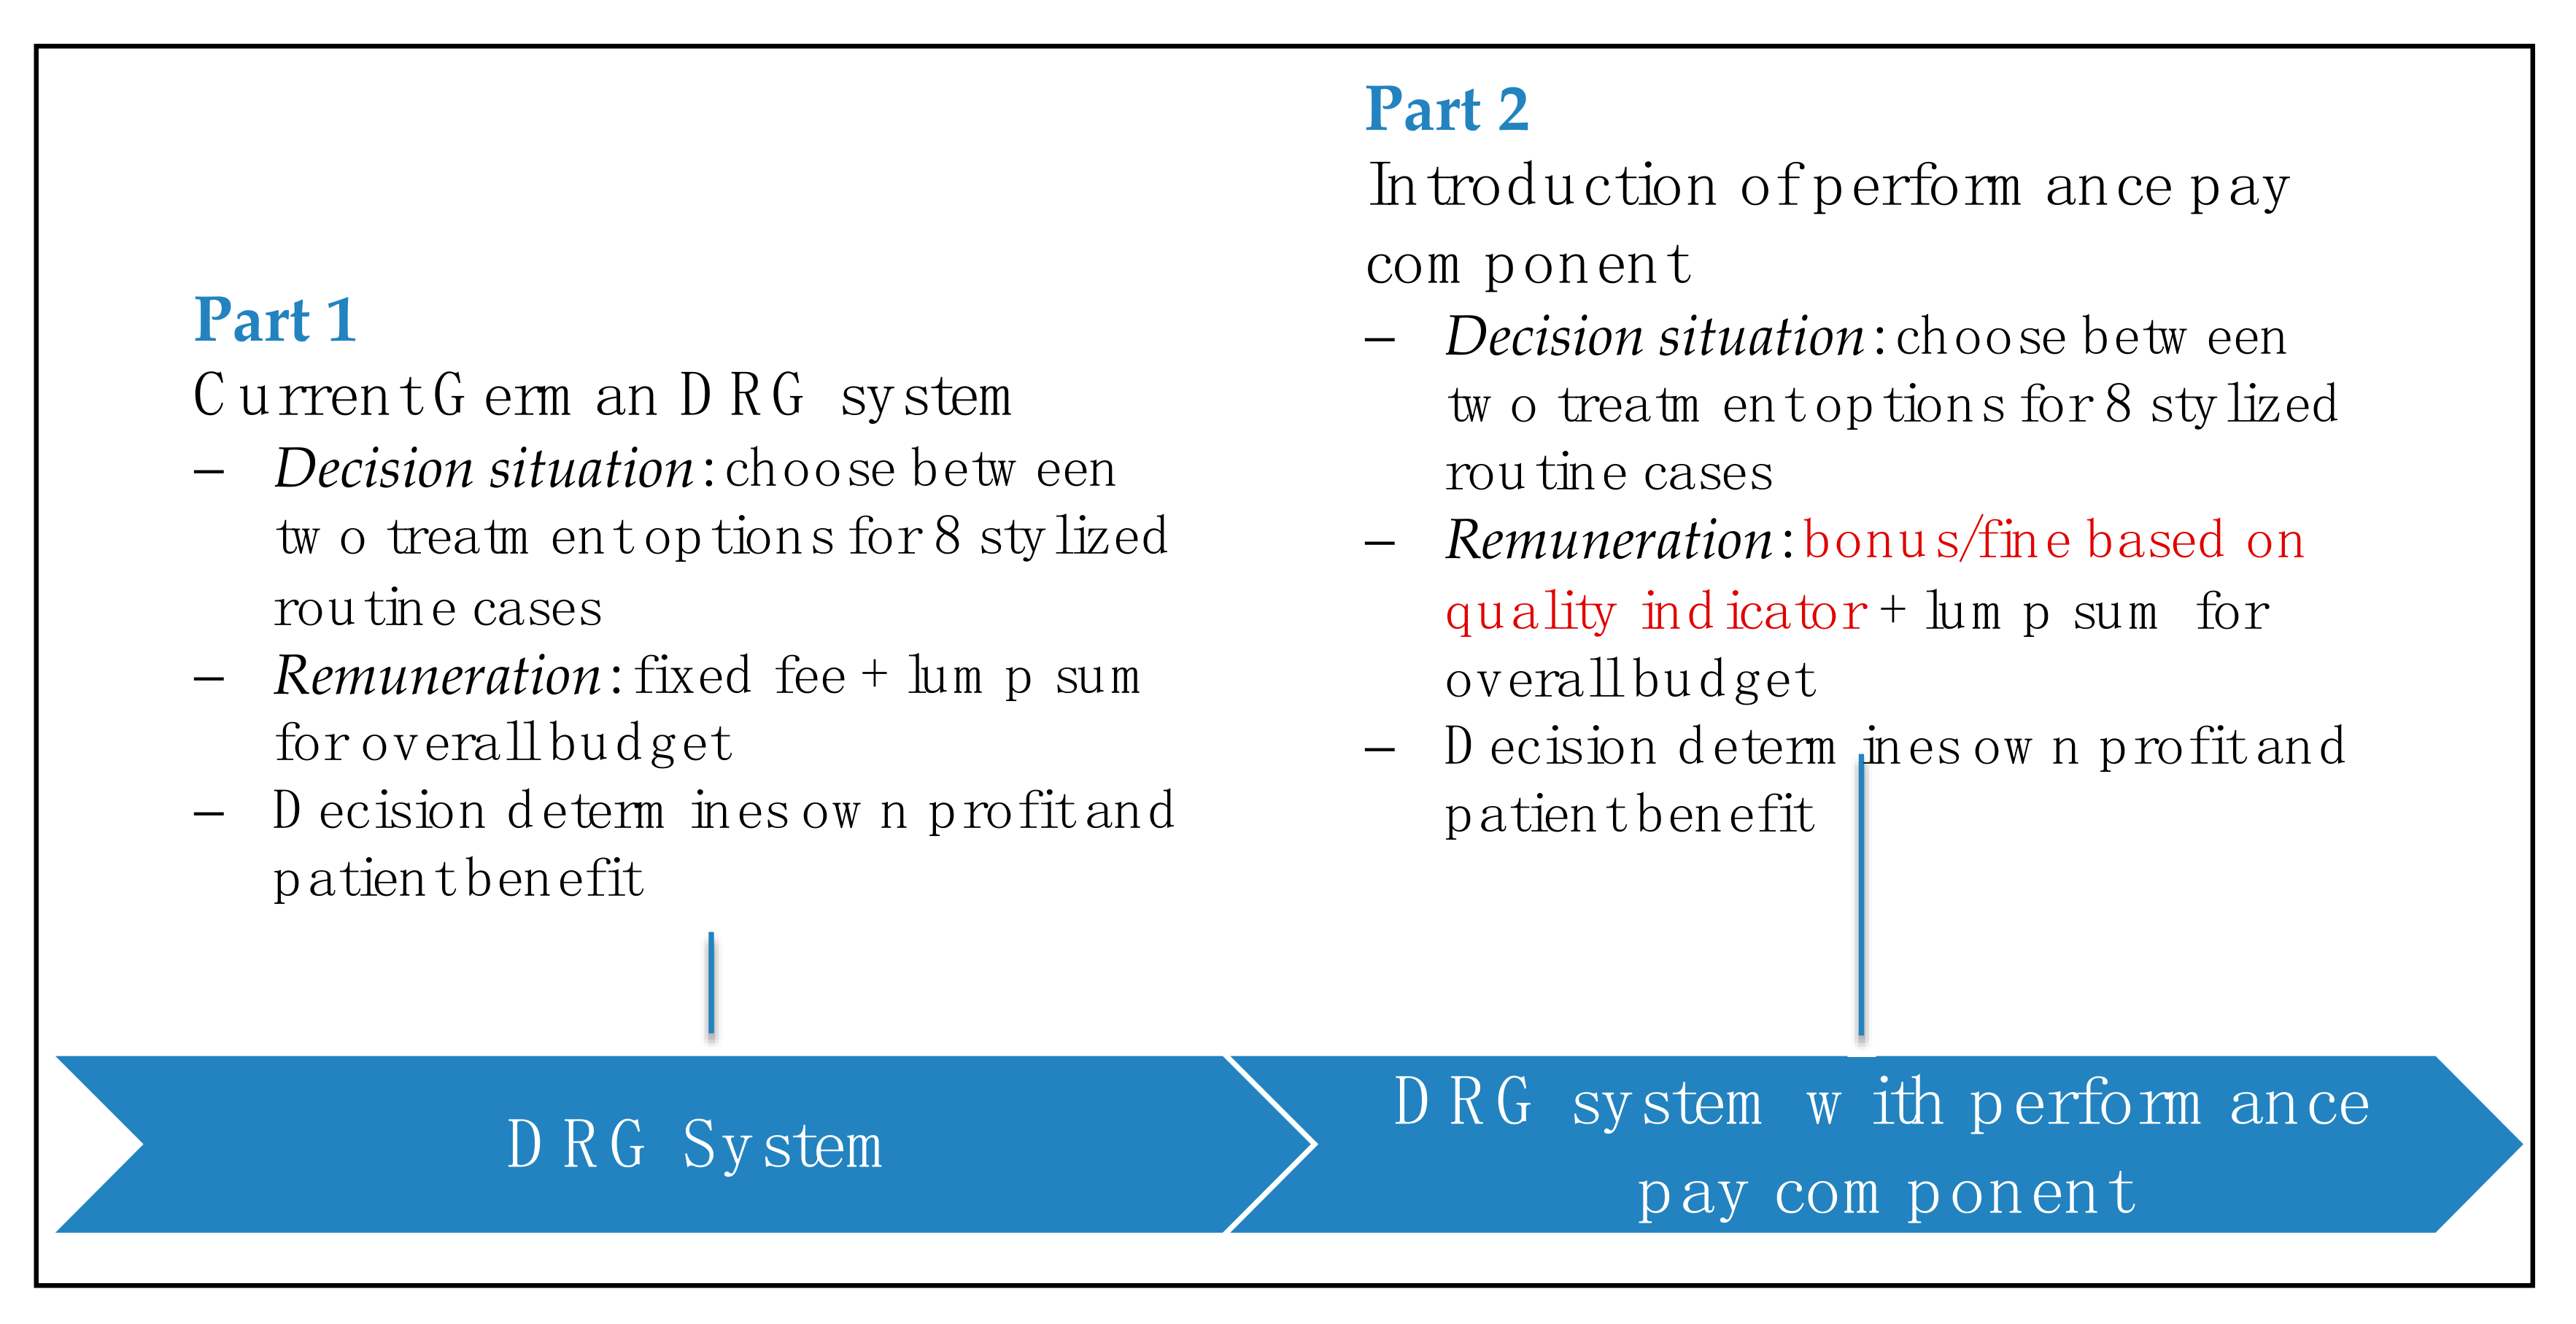
3. Experimental Design
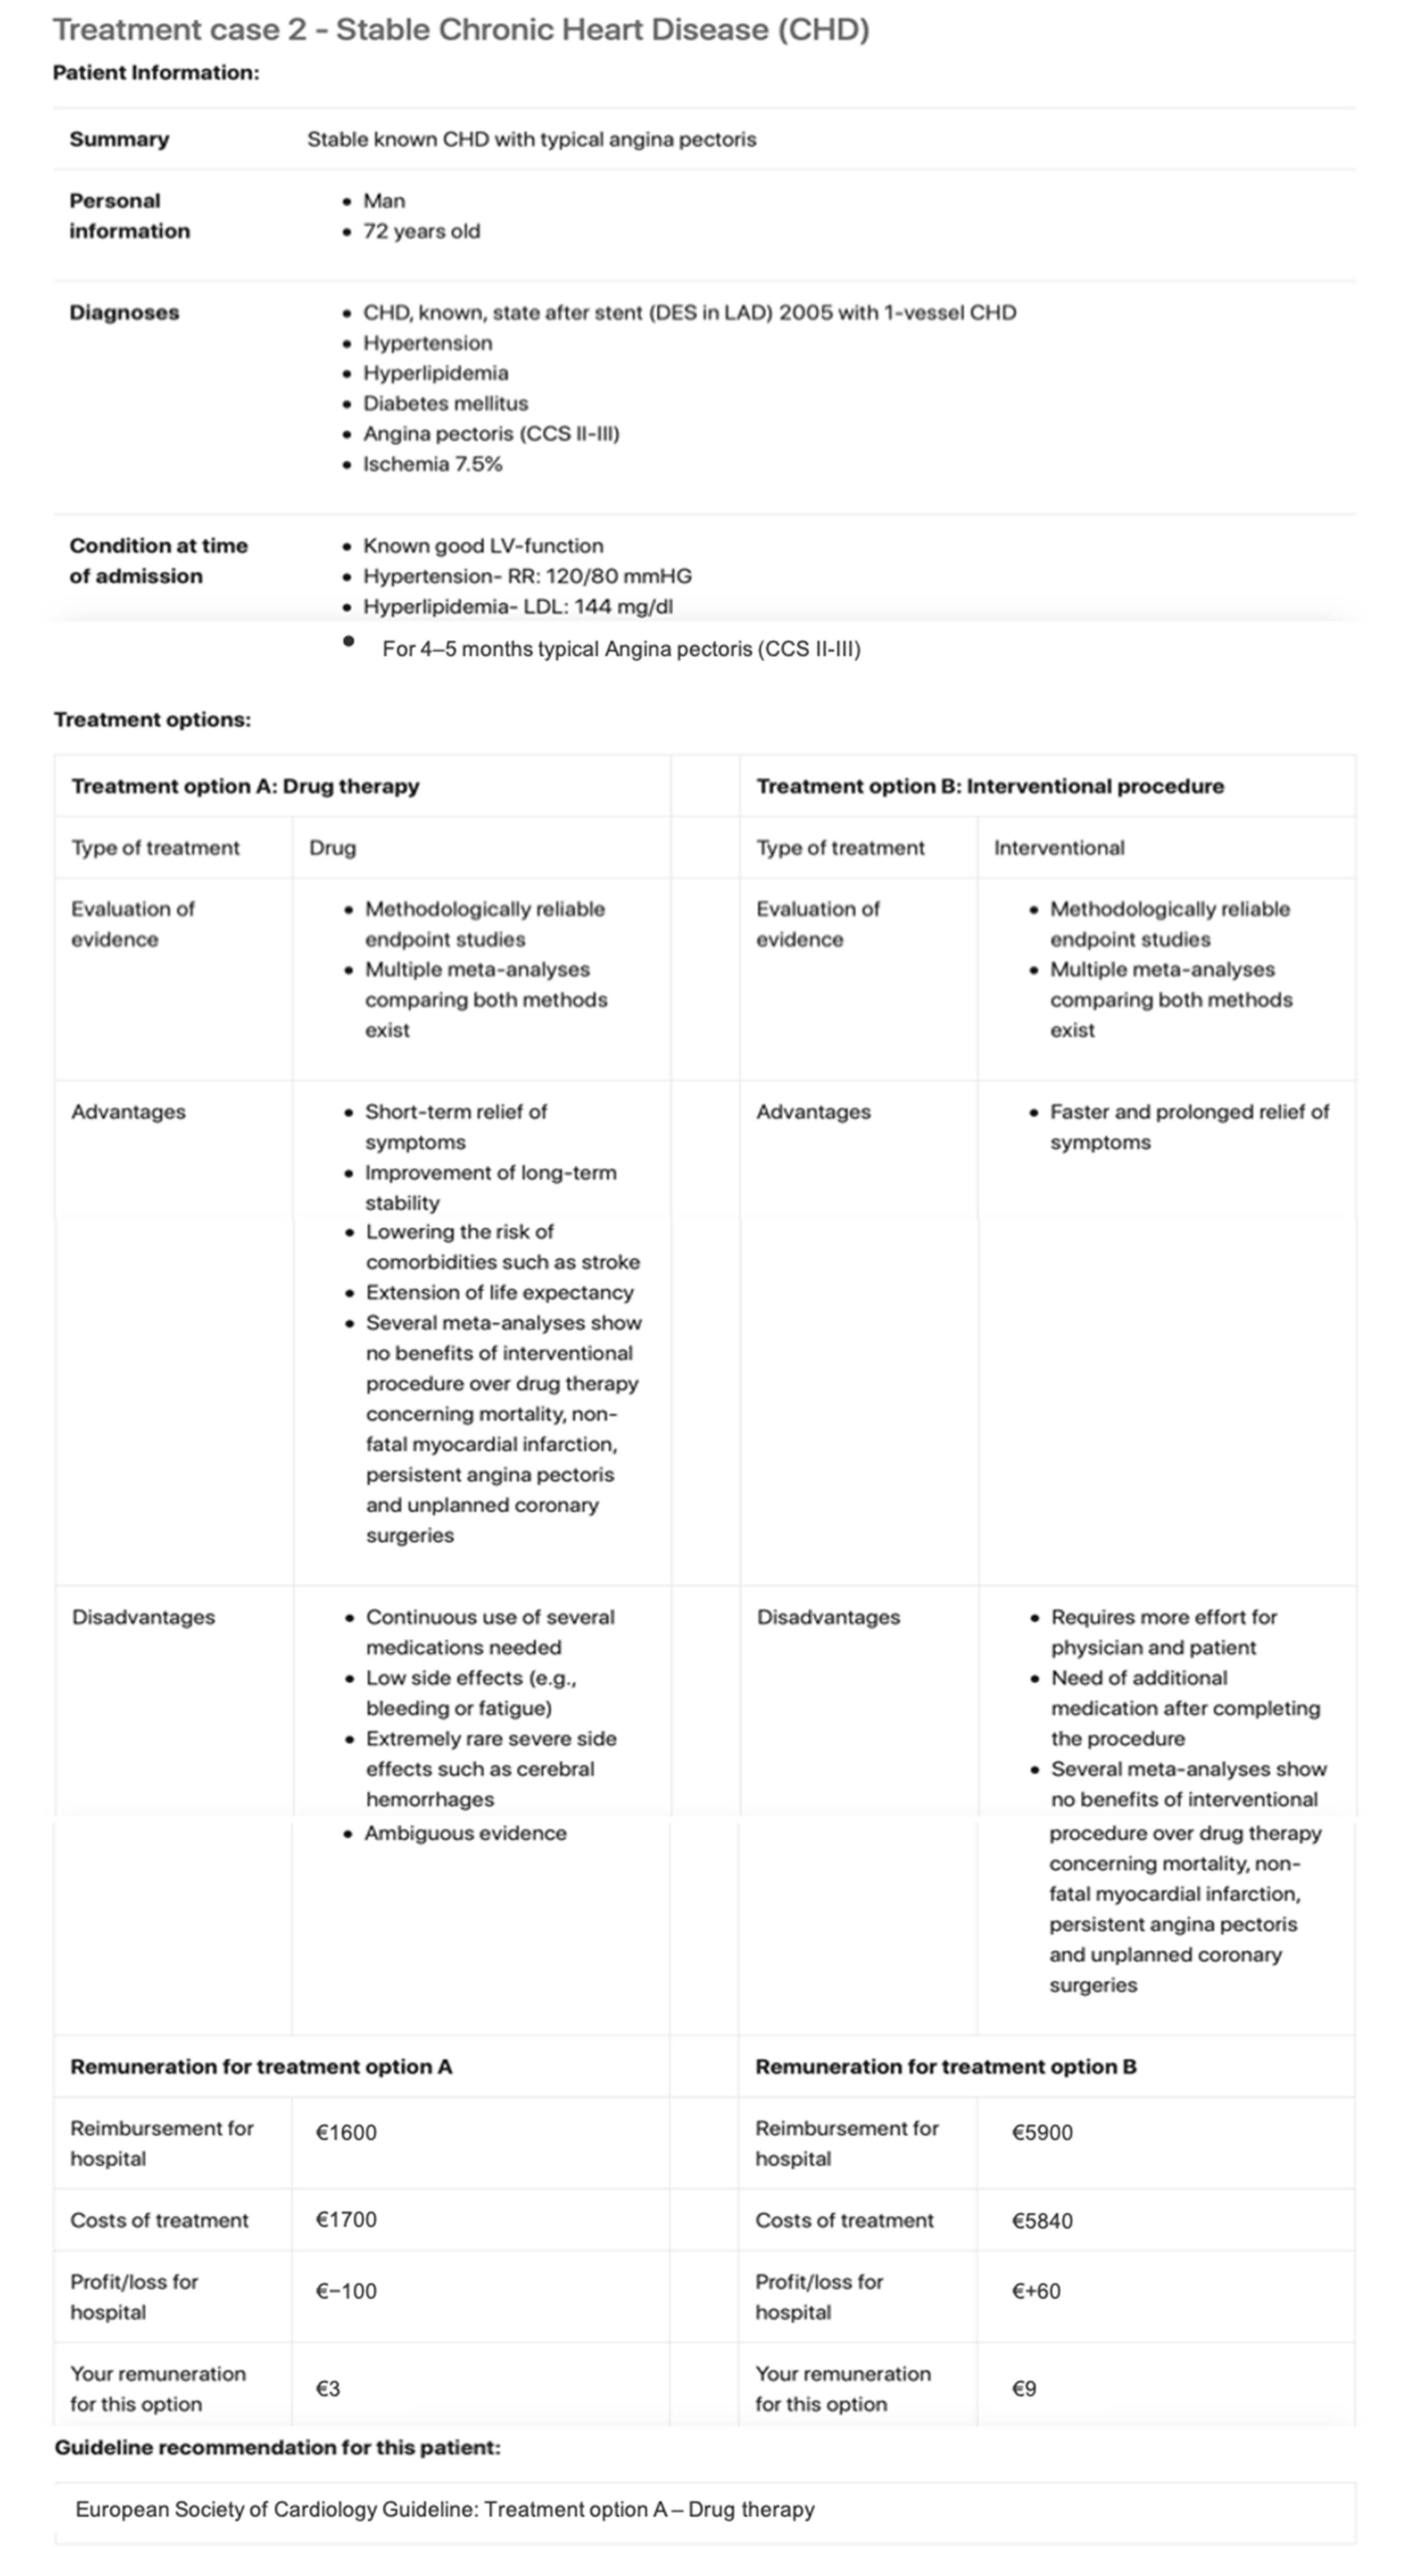
3.1. Treatment Cases
3.2. Payment Incentives
3.3. Experimental Protocol
4. Results
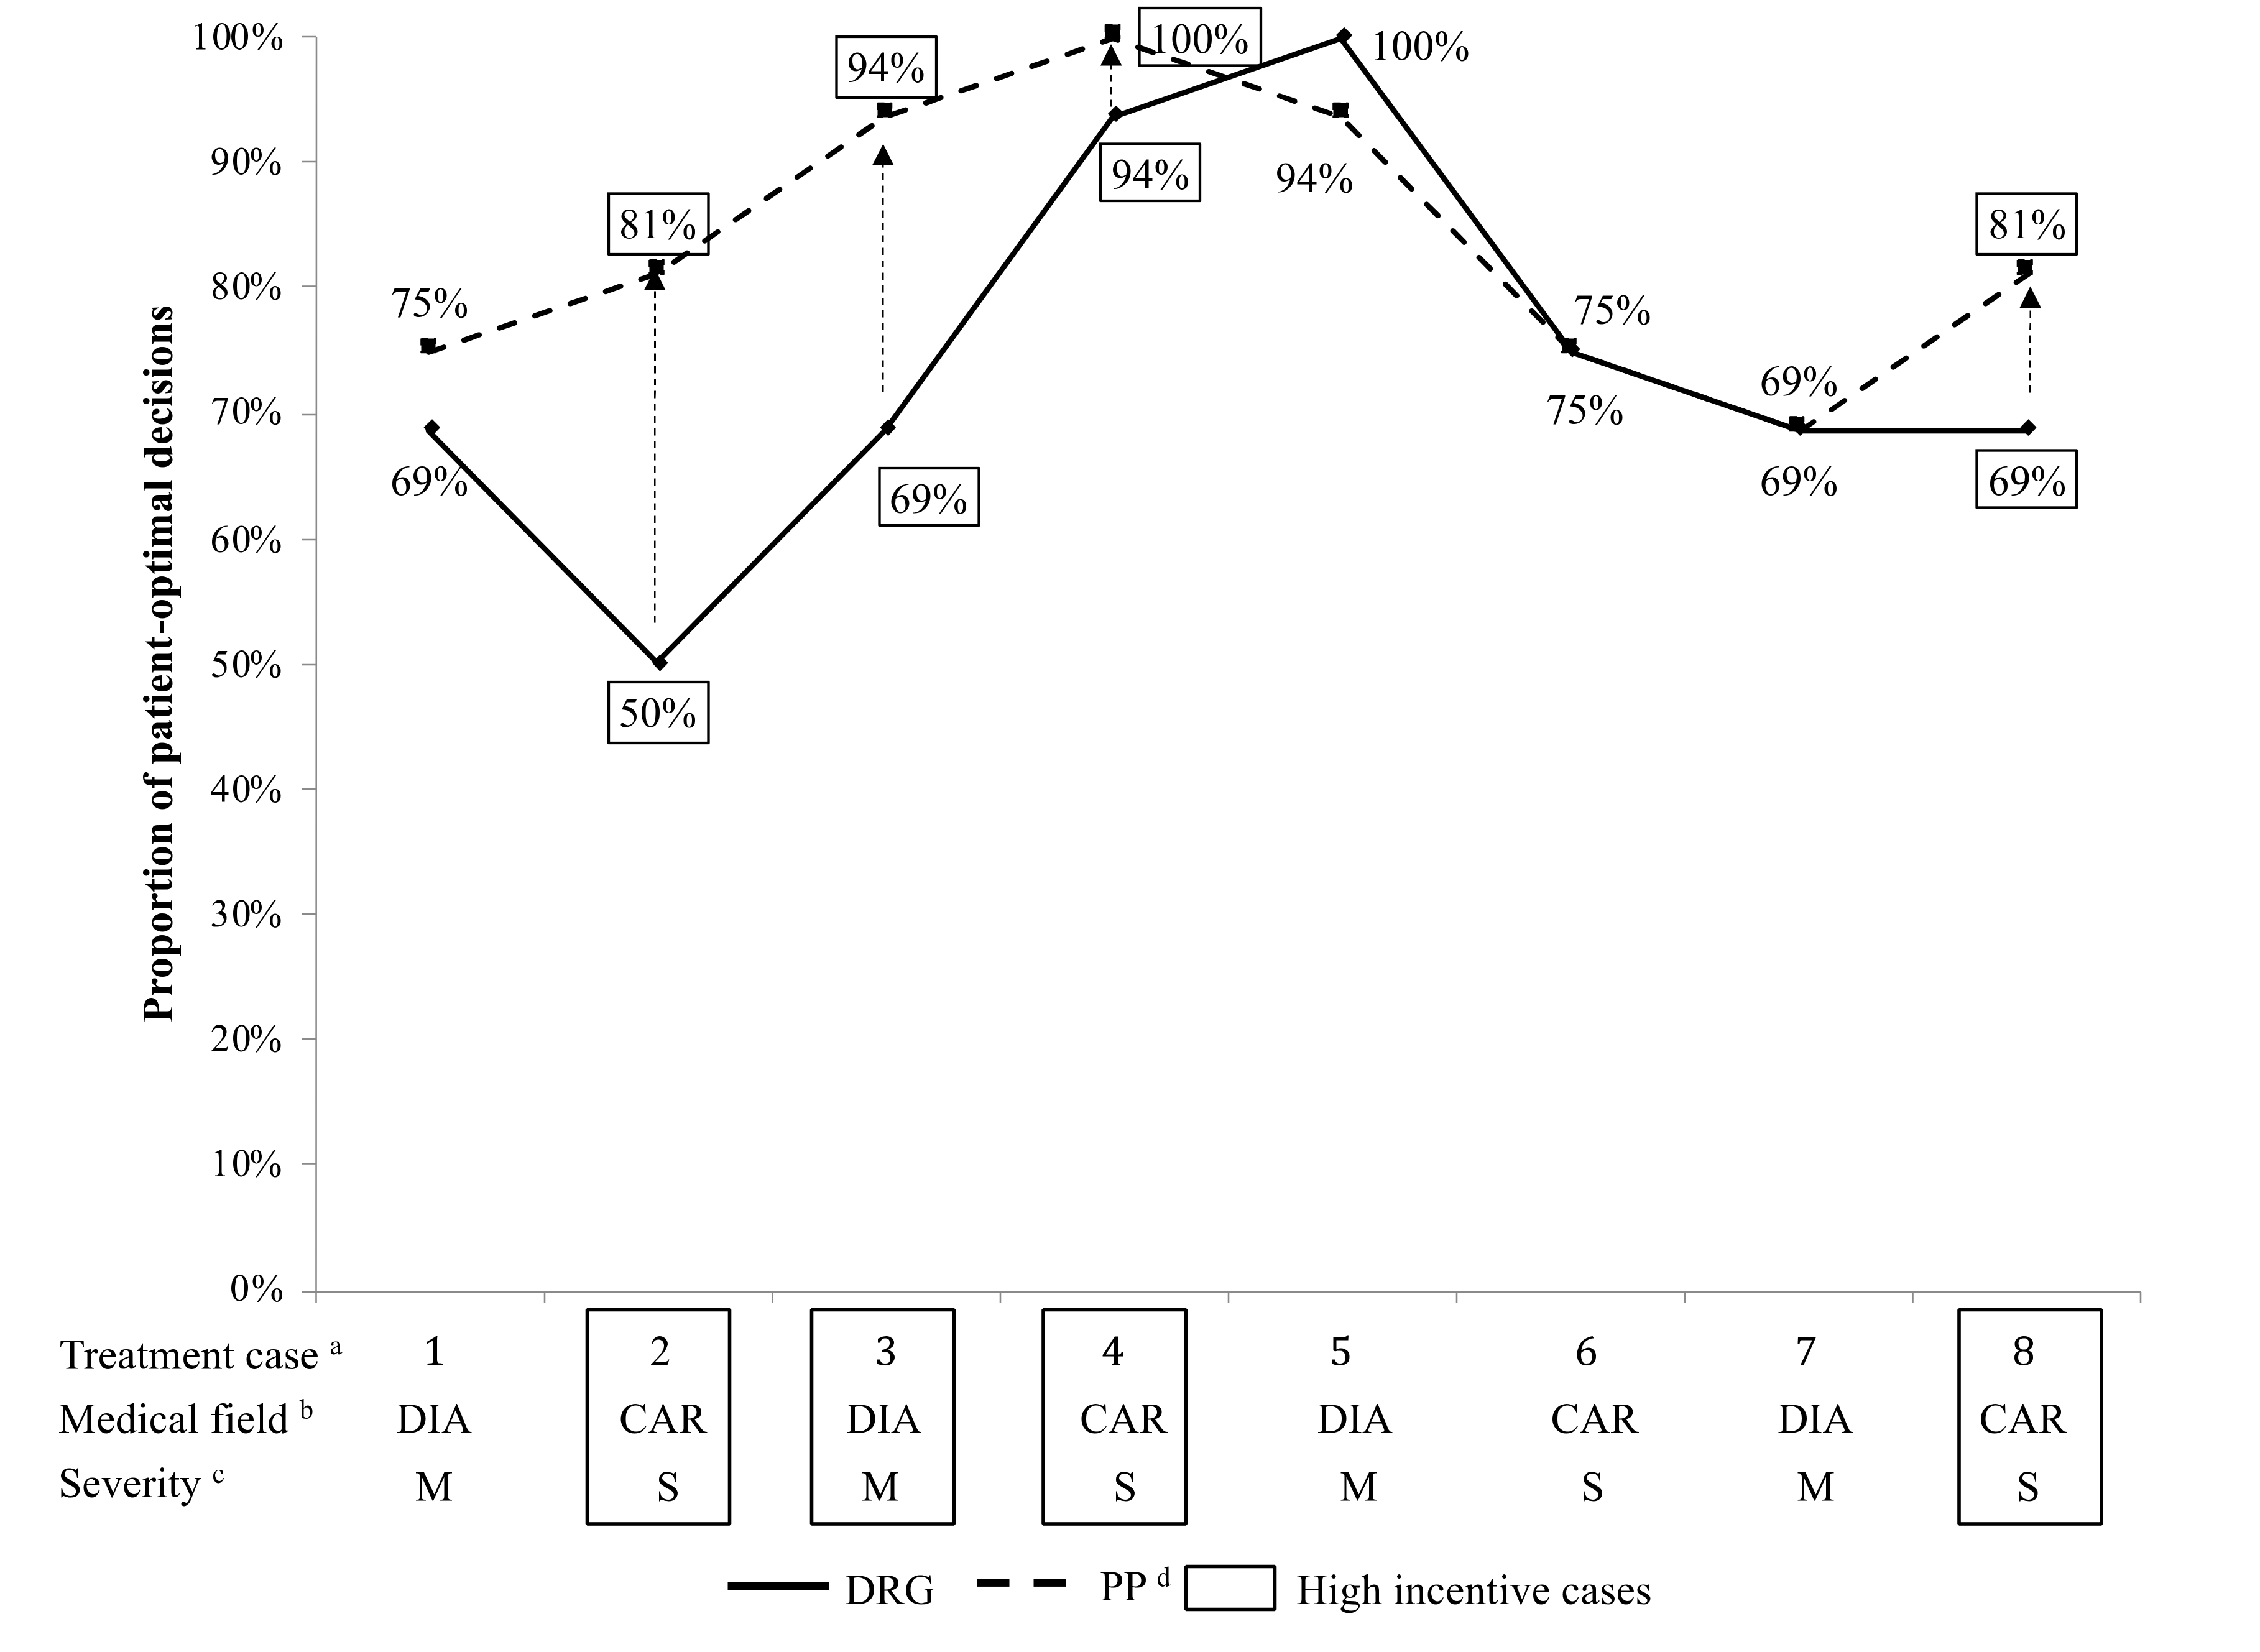
4.1. Physician Provision Behavior in the DRG System
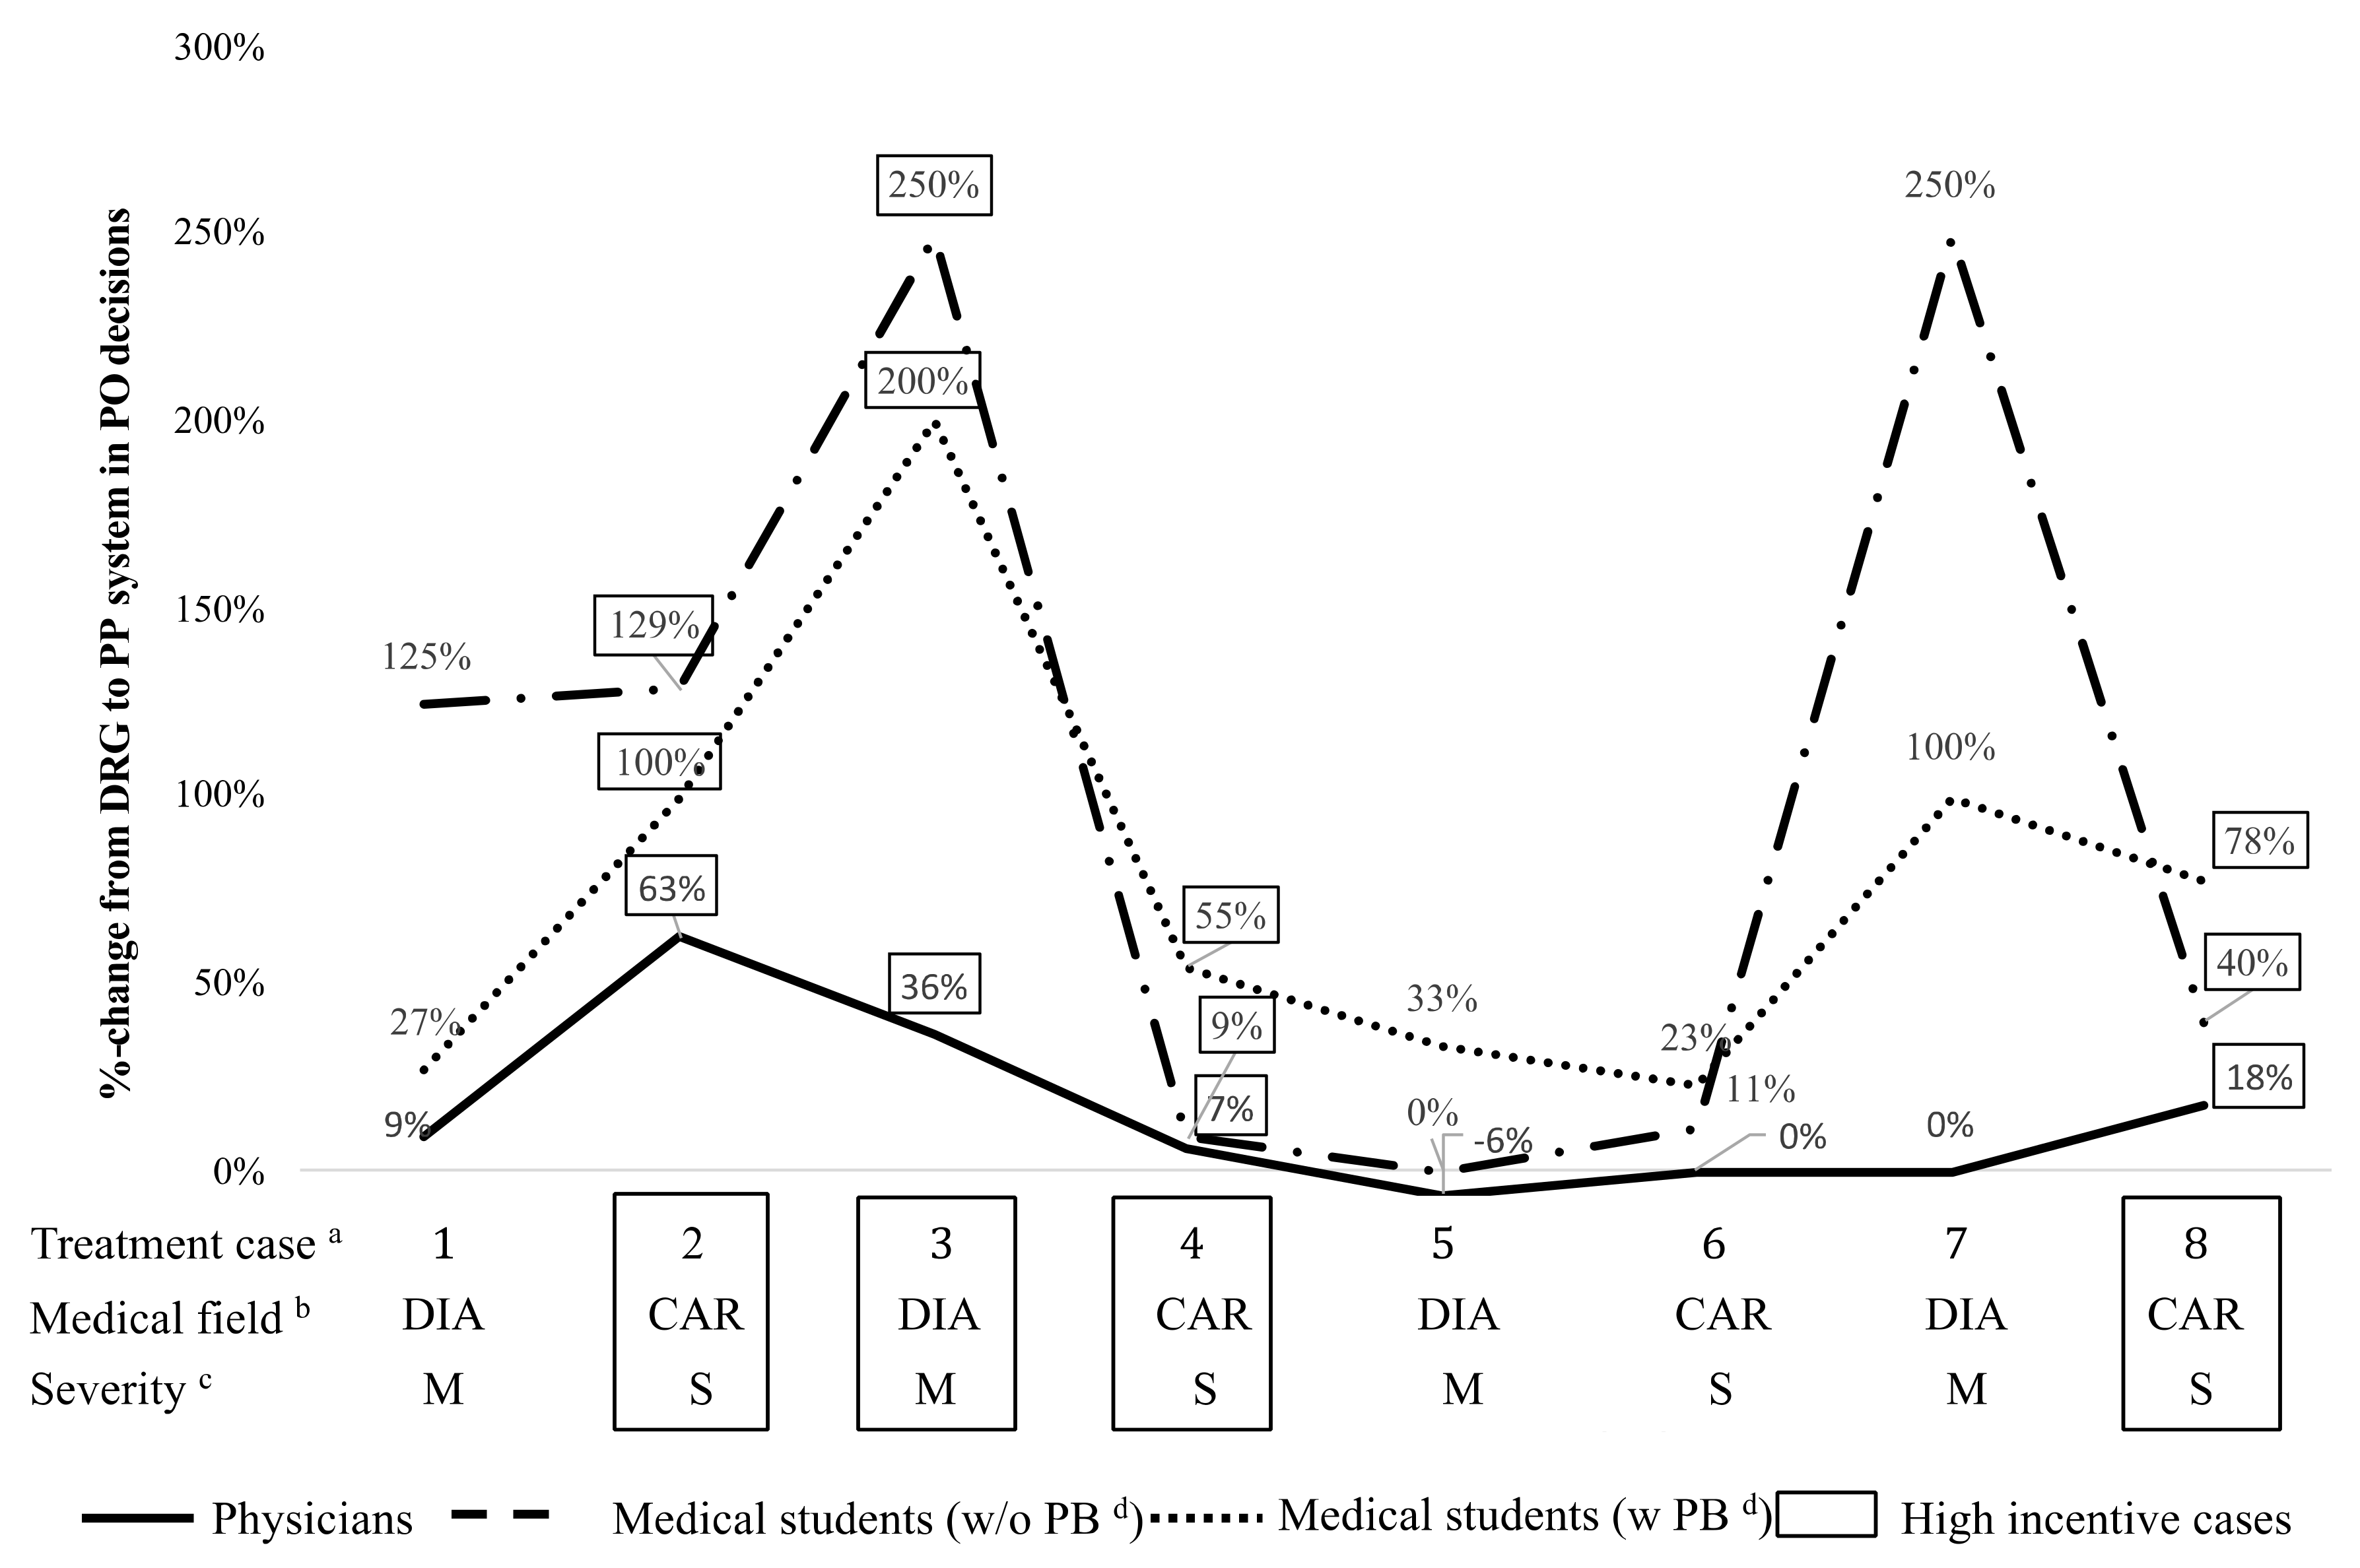
4.2. Impact of Bonus–Malus Incentives on Provision Behavior
4.3. Differences between Hospital Physicians and Medical Students
5. Discussion and Conclusions
Author Contributions
Funding
Acknowledgments
Conflicts of Interest
Appendix A

| Monetary Parameters | ||||||||
|---|---|---|---|---|---|---|---|---|
| PO | PM | PO | PM | PO | PM | PO | PM | |
| 1st part—DRG | ||||||||
| Patient benefit | x | x | x | x | x | x | x | x |
| Hospital DRG fee | 2240 | 2240 | 1600 | 5900 | 9225 | 13,410 | 5900 | 25,000 |
| Corresponding German DRG | K60E | K60E | F66A | F24B | F27B | F27A | F24B | F06B |
| Difference between PM and PO | 0 | 4300 | 4185 | 19,100 | ||||
| Hospital costs | 2500 | 2000 | 1700 | 5840 | 9000 | 12,000 | 6040 | 24,730 |
| Hospital budget impact | −260 | 240 | −100 | 60 | 225 | 1410 | −140 | 270 |
| Physician remuneration | 3 | 9 | 3 | 9 | 5 | 15 | 5 | 15 |
| 2nd part—PP | ||||||||
| Patient benefit | x | x | x | x | x | x | x | x |
| Hospital DRG fee | 2240 | 2240 | 1600 | 5900 | 9225 | 13,410 | 5900 | 25,000 |
| Corresponding German DRG | K60E | K60E | F66A | F24B | F27B | F27A | F24B | F06B |
| Difference between PM and PO | 0 | 4300 | 4185 | 19,100 | ||||
| Hospital costs | 2500 | 2000 | 1700 | 5840 | 9000 | 12,000 | 6040 | 24,730 |
| Hospital budget impact | −260 | 240 | −100 | 60 | 225 | 1410 | −140 | 270 |
| Quality indicator | 105 | 95 | 105 | 85 | 105 | 85 | 105 | 95 |
| Monetary Parameters | ||||||||
|---|---|---|---|---|---|---|---|---|
| PO | PM | PO | PM | PO | PM | PO | PM | |
| 1st part—DRG | ||||||||
| Patient benefit | x | x | x | x | x | x | x | x |
| Hospital DRG fee | 2240 | 2240 | 14,500 | 14,500 | 5200 | 5200 | 16,000 | 33,000 |
| Corresponding German DRG | K60E | K650E | F15Z | F15Z | B04D | B04D | F98C | F03F |
| Difference between PM and PO | 0 | 0 | 0 | 17,000 | ||||
| Hospital costs | 2800 | 2000 | 15,500 | 14,320 | 5300 | 5000 | 15,800 | 30,000 |
| Hospital budget impact | −560 | 240 | −1000 | 180 | −100 | 200 | 200 | 3000 |
| Physician remuneration | 3 | 9 | 3 | 9 | 5 | 15 | 5 | 15 |
| 2nd part—PP | ||||||||
| Patient benefit | x | x | x | x | x | x | x | x |
| Hospital DRG fee | 2240 | 2240 | 14,500 | 14,500 | 5200 | 5200 | 16,000 | 33,000 |
| Corresponding German DRG | K60E | K650E | F15Z | F15Z | B04D | B04D | F98C | F03F |
| Difference between PM and PO | 0 | 0 | 0 | 17,000 | ||||
| Hospital costs | 2800 | 2000 | 15,500 | 14,320 | 5300 | 5000 | 15,800 | 30,000 |
| Hospital budget impact | −560 | 240 | −1000 | 180 | −100 | 200 | 200 | 3000 |
| Quality indicator | 115 | 85 | 115 | 95 | 115 | 95 | 115 | 85 |
| Monetary Parameters | ||||||||
|---|---|---|---|---|---|---|---|---|
| PO | PM | PO | PM | PO | PM | PO | PM | |
| 1st part—DRG | ||||||||
| Patient benefit | x | x | x | x | x | x | x | x |
| Hospital DRG fee | 2240 | 2240 | 1600 | 5900 | 9225 | 13,410 | 5900 | 25,000 |
| Corresponding German DRG | K60E | K60E | F66A | F24B | F27B | F27A | F24B | F06B |
| Difference between PM and PO | 0 | 4300 | 4185 | 19,100 | ||||
| Hospital costs | 2500 | 2000 | 1700 | 5840 | 9000 | 12,000 | 6040 | 24,730 |
| Hospital budget impact | −260 | 240 | −100 | 60 | 225 | 1410 | −140 | 270 |
| Student remuneration | 0.33 | 1 | 0.33 | 1 | 1 | 3 | 1 | 3 |
| 2nd part—PP | ||||||||
| Patient benefit | x | x | x | x | x | x | x | x |
| Hospital DRG fee | 2240 | 2240 | 1600 | 5900 | 9225 | 13,410 | 5900 | 25,000 |
| Corresponding German DRG | K60E | K60E | F66A | F24B | F27B | F27A | F24B | F06B |
| Difference between PM and PO | 0 | 4300 | 4185 | 19,100 | ||||
| Hospital costs | 2500 | 2000 | 1700 | 5840 | 9000 | 12,000 | 6040 | 24,730 |
| Hospital budget impact | −260 | 240 | −100 | 60 | 225 | 1410 | −140 | 270 |
| Quality indicator | 105 | 95 | 105 | 85 | 105 | 85 | 105 | 95 |
| Monetary Parameters | ||||||||
|---|---|---|---|---|---|---|---|---|
| PO | PM | PO | PM | PO | PM | PO | PM | |
| 1st part—DRG | ||||||||
| Patient benefit | x | x | x | x | x | x | x | x |
| Hospital DRG fee | 2240 | 2240 | 14,500 | 14,500 | 5200 | 5200 | 16,000 | 33,000 |
| Corresponding German DRG | K60E | K650E | F15Z | F15Z | B04D | B04D | F98C | F03F |
| Difference between PM and PO | 0 | 0 | 0 | 17,000 | ||||
| Hospital costs | 2800 | 2000 | 15,500 | 14,320 | 5300 | 5000 | 15,800 | 30,000 |
| Hospital budget impact | −560 | 240 | −1000 | 180 | −100 | 200 | 200 | 3000 |
| Student remuneration | 0.33 | 1 | 0.33 | 1 | 1 | 3 | 1 | 3 |
| 2nd part—PP | ||||||||
| Patient benefit | x | x | x | x | x | x | x | x |
| Hospital DRG fee | 2240 | 2240 | 14,500 | 14,500 | 5200 | 5200 | 16,000 | 33,000 |
| Corresponding German DRG | K60E | K650E | F15Z | F15Z | B04D | B04D | F98C | F03F |
| Difference between PM and PO | 0 | 0 | 0 | 17,000 | ||||
| Hospital costs | 2800 | 2000 | 15,500 | 14,320 | 5300 | 5000 | 15,800 | 30,000 |
| Hospital budget impact | −560 | 240 | −1000 | 180 | −100 | 200 | 200 | 3000 |
| Quality indicator | 115 | 85 | 115 | 95 | 115 | 95 | 115 | 85 |
| Monetary Parameters | ||||||||
|---|---|---|---|---|---|---|---|---|
| PO | PM | PO | PM | PO | PM | PO | PM | |
| 1st part—DRG | ||||||||
| Patient benefit | 0.83 | 0.28 | 0.83 | 0.28 | 2.5 | 0.83 | 2.5 | 0.83 |
| Hospital DRG fee | 2240 | 2240 | 1600 | 5900 | 9225 | 13,410 | 5900 | 25,000 |
| Corresponding German DRG | K60E | K60E | F66A | F24B | F27B | F27A | F24B | F06B |
| Difference between PM and PO | 0 | 4300 | 4185 | 19,100 | ||||
| Hospital costs | 2500 | 2000 | 1700 | 5840 | 9000 | 12,000 | 6040 | 24,730 |
| Hospital budget impact | −260 | 240 | −100 | 60 | 225 | 1410 | −140 | 270 |
| Student remuneration | 0.33 | 1 | 0.33 | 1 | 1 | 3 | 1 | 3 |
| 2nd part—PP | ||||||||
| Patient benefit | 0.83 | 0.28 | 0.83 | 0.28 | 2.5 | 0.83 | 2.5 | 0.83 |
| Hospital DRG fee | 2240 | 2240 | 1600 | 5900 | 9225 | 13,410 | 5900 | 25,000 |
| Corresponding German DRG | K60E | K60E | F66A | F24B | F27B | F27A | F24B | F06B |
| Difference between PM and PO | 0 | 4300 | 4185 | 19,100 | ||||
| Hospital costs | 2500 | 2000 | 1700 | 5840 | 9000 | 12,000 | 6040 | 24,730 |
| Hospital budget impact | −260 | 240 | −100 | 60 | 225 | 1410 | −140 | 270 |
| Quality indicator | 105 | 95 | 105 | 85 | 105 | 85 | 105 | 95 |
| Monetary Parameters | ||||||||
|---|---|---|---|---|---|---|---|---|
| PO | PM | PO | PM | PO | PM | PO | PM | |
| 1st part—DRG | ||||||||
| Patient benefit | 0.83 | 0.28 | 0.83 | 0.28 | 2.5 | 0.83 | 2.5 | 0.83 |
| Hospital DRG fee | 2240 | 2240 | 145,00 | 14,500 | 5200 | 5200 | 16,000 | 33,000 |
| Corresponding German DRG | K60E | K650E | F15Z | F15Z | B04D | B04D | F98C | F03F |
| Difference between PM and PO | 0 | 0 | 0 | 17,000 | ||||
| Hospital costs | 2800 | 2000 | 15,500 | 14,320 | 5300 | 5000 | 15,800 | 30,000 |
| Hospital budget impact | −560 | 240 | −1000 | 180 | −100 | 200 | 200 | 3000 |
| Student remuneration | 0.33 | 1 | 0.33 | 1 | 1 | 3 | 1 | 3 |
| 2nd part—PP | ||||||||
| Patient benefit | 0.83 | 0.28 | 0.83 | 0.28 | 2.5 | 0.83 | 2.5 | 0.83 |
| Hospital DRG fee | 2240 | 2240 | 14,500 | 14,500 | 5200 | 5200 | 16,000 | 33,000 |
| Corresponding German DRG | K60E | K650E | F15Z | F15Z | B04D | B04D | F98C | F03F |
| Difference between PM and PO | 0 | 0 | 0 | 17,000 | ||||
| Hospital costs | 2800 | 2000 | 15,500 | 14,320 | 5300 | 5000 | 15,800 | 30,000 |
| Hospital budget impact | −560 | 240 | −1000 | 180 | −100 | 200 | 200 | 3000 |
| Quality indicator | 115 | 85 | 115 | 95 | 115 | 95 | 115 | 85 |
Appendix A.1. Formal Description of Experimental Design with Parameters and Annotations
Appendix A.1.1. Treatment Cases
Appendix A.1.2. Payment incentives
| Definition | Annotation | Description/Values |
|---|---|---|
| Stylized routine cases | N/A | |
| Medical field | DIA = diabetology CAR = cardiology | |
| Degree of severity | M = moderate S = severe | |
| Treatment option | PO = patient optimal PM = profit maximizing | |
| Level of monetary incentive | L = low H = high | |
| DRG fee for hospital | N/A | |
| Costs per treatment case for hospital | N/A | |
| Profit per treatment case for hospital | N/A | |
| Participant´s budget for all stylized routine cases | N/A | |
| Participant´s total remuneration | N/A | |
| Participant´s remuneration part 1 | N/A | |
| Participant´s fixed remuneration part 1 | Remuneration difference between PO and PM option: Remuneration difference between moderate and severe cases: | |
| Participant´s lump sum remuneration part 1 and 2 | Remuneration difference between positive/balanced and negative budget: | |
| Participant´s remuneration part 2 | N/A | |
| Participant´s performance pay remuneration part 2 | Remuneration for above average quality: Remuneration for average quality: Remuneration for below average quality: | |
| Quality score based on participant´s decisions for all stylized routine cases | N/A | |
| Patient benefit | Differences in monetary value of patient benefit between PO and PM option: Differences in monetary value of patient benefit between moderate and severe cases: |
Appendix A.2. Recruitment Process for Hospital Physicians and Medical Students
Appendix A.3. Instructions
- Part 1
- Decision Situation
- Reimbursement System in the Hospital
- Your Total Compensation for Part 1
- 2.
- Part 2
- Decision Situation
- Quality Measurement
- Reimbursement System in the Hospital
- Your Total Compensation for the Part 2
Appendix A.4. Calculation of Incentive Differences between PO and PM Options
Appendix A.5. Calculation of Incentive Differences between Moderate and Severe Cases
| Treatment Case | Chosen Option | Profit/Loss for Hospital | Your Remuneration for This Option | Guideline Recommentation |
|---|---|---|---|---|
| Treatment case 1—Derailment of glucose metabolism due to diabetes | B—Drug therapy with standard diabetic | €240 | €9 | A—Drug therapy with new diabetic |
| Treatment case 2—Stable Chronic Heart Disease | A—Drug therapy | €-100 | €3 | A—Drug therapy |
| Treatment case 3—Diabetic Foot | A—Interventional procedure | €225 | €5 | A—Interventional procedure |
| Treatment case 4—Multivessel disease | B—Surgery | €270 | €15 | A—Interventional procedure |
| Treatment case 5—Hypo disorder | B—Treatment of hypoglycemia and patient education program | €−560 | €3 | B—Treatment of hypoglycemia and patient education program |
| Treatment case 6—STEMI | B—Interventional procedure with thrombus aspiration and drug therapy | €−1000 | €3 | B—Interventional procedure with thrombus aspiration and drug therapy |
| Treatment case 7—Stenosis of the arteria carotis interna | A—Surgery | €200 | €15 | B—Interventional procedure |
| Treatment case 8—Aortic stenosis | A—Interventional procedure | €3000 | €15 | B—Surgery |
| Your budget | €2275 | Positive | ||
Appendix B
| Fisher´s Exact Tests | Physician | Student | Student+Patient |
|---|---|---|---|
| DRG within-subject | |||
| Medical field | 0.6865 | 0.3148 | 0.5358 |
| Degree of severity | 1 | 0.1799 | 0.0129 |
| Level of monetary DRG incentive | 0.4192 | 0.7377 | 0.0435 |
| PP within-subject | |||
| Medical field | 1 | 0.5029 | 0.2959 |
| Degree of severity | 0.6355 | 1 | 0.1630 |
| Level of monetary DRG incentive | 0.1510 | 0.7377 | 1 |
| DRG vs. PP within-subject | 0.4667 | 0.0002 | <0.0000 |
| High monetary DRG incentives | 0.0146 | 0.0006 | 0.0001 |
| Low monetary DRG incentives | 1 | 0.0146 | 0.0099 |
| DRG between-subject | |||
| Physician vs. Student | <0.0000 | <0.0000 | n/a |
| Physician vs. Student+Patient | <0.0000 | n/a | <0.0000 |
| Student vs. Student+Patient | n/a | 0.1414 | 0.1414 |
| PP between-subject | |||
| Physician vs. Student | 0.0009 | 0.0009 | n/a |
| Physician vs. Student+Patient | 0.0354 | n/a | 0.0354 |
| Student vs. Student+Patient | n/a | 0.0421 | 0.0421 |
| Experimental Parts | Physician | Student | Student+Patient |
|---|---|---|---|
| Part 1—DRG | 12% (n = 2) | 10% (n = 2) | 14% (n = 3) |
| Part 2—PP | 0% (n = 0) | 26% (n = 5) | 33% (n = 7) |
| Subject Pool | 100% Patient Optimizing | 100% Profit Maximizing | ||
|---|---|---|---|---|
| Physician | 12% | 50% | 0% | 0% |
| Student | 0% | 5% | 5% | 5% |
| Student+Patient | 9% | 19% | 23% | 4% |
| Model | (1) | (2) | (3) | (4) |
|---|---|---|---|---|
| Dependent Variable: | PO Decision | PO Decision | PO Decision | PO Decision |
| BonusMalus | 0.208 *** (0.000) | 0.208 *** (0.000) | 0.231 *** (0.000) | 0.230 *** (0.000) |
| Physician | 0.293 *** (0.000) | 0.337 *** (0.000) | 0.256 *** (0.000) | |
| StudentwPB | 0.086 * (0.013) | 0.087 * (0.012) | 0.077 * (0.029) | |
| BonusMalus × Physician | −0.111 (0.136) | −0.109 (0.140) | ||
| Male | −0.040 (0.252) | |||
| Age | 0.004 (0.124) | |||
| Hexaco | 0.028 *** (0.000) | |||
| Constant | 0.010 (0.637) | −0.104 *** (0.000) | −0.115 ** (0.000) | −0.654 *** (0.000) |
| Akaike information criterion | 1151.4 | 1100 | 1099.8 | 1086.3 |
| Observations | 896 | 896 | 896 | 896 |
| Subjects | 56 | 56 | 56 | 56 |
References
- Emmert, M.; Eijkenaar, F.; Kemter, H.; Esslinger, A.S.; Schöffski, O. Economic evaluation of pay-for-performance in health care: A systematic review. Eur. J. Health Econ. 2011, 13, 755–767. [Google Scholar] [CrossRef] [PubMed]
- Milstein, R.; Schreyoegg, J. Pay for performance in the inpatient sector: A review of 34 P4P programs in 14 OECD countries. Health Policy 2016, 120, 1125–1140. [Google Scholar] [CrossRef] [PubMed] [Green Version]
- Centers for Medicare and Medicaid Services. Premier Hospital Quality Incentive Demonstration. Available online: www.cms.gov/Medicare/Quality-Initiatives-Patient-Assessment-Instruments/HospitalQuality%20Inits/HospitalPremier.html (accessed on 26 July 2020).
- Rosenthal, M.B.; Frank, R.G. What Is the Empirical Basis for Paying for Quality in Health Care? Med. Care Res. Rev. 2006, 63, 135–157. [Google Scholar] [CrossRef] [PubMed]
- Glickman, S.W.; Ou, F.-S.; Delong, E.R.; Roe, M.T.; Lytle, B.L.; Mulgund, J.; Rumsfeld, J.S.; Gibler, W.B.; Ohman, E.M.; Schulman, K.A.; et al. Pay for Performance, Quality of Care, and Outcomes in Acute Myocardial Infarction. JAMA 2007, 297, 2373–2380. [Google Scholar] [CrossRef] [PubMed] [Green Version]
- Ryan, A. Hospital-based pay-for-performance in the United States. Health Econ. 2009, 18, 1109–1113. [Google Scholar] [CrossRef] [Green Version]
- Sutton, M.; Elder, R.; Guthrie, B.; Watt, G. Record rewards: The effects of targeted quality incentives on the recording of risk factors by primary care providers. Health Econ. 2009, 19, 1. [Google Scholar] [CrossRef] [PubMed]
- Kantarevic, J.; Kralj, B. Link between pay for performance incentives and physician payment mechanisms: Evidence from the diabetes management incentive in ontario. Health Econ. 2012, 22, 1417–1439. [Google Scholar] [CrossRef] [Green Version]
- Li, J.; Hurley, J.; DeCicca, P.; Buckley, G. Physician response to pay-for-performance: Evidence from a natural experiment. Health Econ. 2013, 23, 962–978. [Google Scholar] [CrossRef]
- Meacock, R.; Kristensen, S.R.; Sutton, M. The cost-effectiveness of using financial incentives to improve provider quality: A framework and application. Health Econ. 2014, 23, 1–13. [Google Scholar] [CrossRef]
- Feng, Y.; Ma, A.H.; Farrar, S.; Sutton, M. The Tougher the Better: An Economic Analysis of Increased Payment Thresholds on the Performance of General Practices. Health Econ. 2014, 24, 353–371. [Google Scholar] [CrossRef]
- Ryan, A.; Sutton, M.; Doran, T. Does Winning a Pay-for-Performance Bonus Improve Subsequent Quality Performance? Evidence from the Hospital Quality Incentive Demonstration. Health Serv. Res. 2013, 49, 568–587. [Google Scholar] [CrossRef] [PubMed] [Green Version]
- Tversky, A.; Kahneman, D. Availability: A heuristic for judging frequency and probability. Cogn. Psychol. 1973, 5, 207–232. [Google Scholar] [CrossRef]
- Tversky, A.; Kahneman, D. Advances in prospect theory: Cumulative representation of uncertainty. J. Risk Uncertain. 1992, 5, 297–323. [Google Scholar] [CrossRef]
- Kristensen, S.R.; Bech, M.; Lauridsen, J.T. Who to pay for performance? The choice of organizational level for hospital performance incentives. Eur. J. Health Econ. 2016, 17, 435–442. [Google Scholar] [CrossRef] [PubMed]
- Friebel, R.; Hauck, K.; Aylin, P.; Steventon, A. National trends in emergency readmission rates: A longitudinal analysis of administrative data for England between 2006 and 2016. BMJ Open 2018, 8, e020325. [Google Scholar] [CrossRef] [PubMed] [Green Version]
- Lee, G.M.; Kleinman, K.; Soumerai, S.B.; Tse, A.; Cole, D.; Fridkin, S.K.; Horan, T.; Platt, R.; Gay, C.; Kassler, W.; et al. Effect of Nonpayment for Preventable Infections in U.S. Hospitals. N. Engl. J. Med. 2012, 367, 1428–1437. [Google Scholar] [CrossRef] [Green Version]
- Waters, T.M.; Daniels, M.J.; Bazzoli, G.J.; Perencevich, E.N.; Dunton, N.; Staggs, V.S.; Potter, C.; Fareed, N.; Liu, M.; Shorr, R.I. Effect of Medicare’s nonpayment for Hospital-Acquired Conditions: Lessons for future policy. JAMA Intern. Med. 2015, 175, 347–354. [Google Scholar] [CrossRef] [Green Version]
- Mellor, J.; Daly, M.; Smith, M. Does It Pay to Penalize Hospitals for Excess Readmissions? Intended and Unintended Consequences of Medicare’s Hospital Readmissions Reductions Program. Health Econ. 2016, 26, 1037–1051. [Google Scholar] [CrossRef]
- Zuckerman, R.B.; Sheingold, S.H.; Orav, E.J.; Ruhter, J.; Epstein, A.M. Readmissions, Observation, and the Hospital Readmissions Reduction Program. N. Engl. J. Med. 2016, 374, 1543–1551. [Google Scholar] [CrossRef]
- Kim, S.M.; Jang, D.H.; Ahn, H.A.; Park, H.J.; Ahn, H.S. Korean National Health Insurance Value Incentive Program: Achievements and Future Directions. J. Prev. Med. Public Health 2012, 45, 148–155. [Google Scholar] [CrossRef]
- Yang, J.H.; Kim, S.M.; Han, S.J.; Knaak, M.; Yang, G.H.; Lee, K.D.; Yoo, Y.H.; Ha, G.; Kim, E.J.; Yoo, M.S. The impact of Value Incentive Program (VIP) on the quality of hospital care for acute stroke in Korea. Int. J. Qual. Health Care 2016, 28, 580–585. [Google Scholar] [CrossRef] [PubMed]
- Kim, S.J.; Han, K.-T.; Kim, S.J.; Park, E.-C. Pay-for-performance reduces healthcare spending and improves quality of care: Analysis of target and non-target obstetrics and gynecology surgeries. Int. J. Qual. Health Care 2017, 29, 222–227. [Google Scholar] [CrossRef] [PubMed] [Green Version]
- Eilermann, K.; Halstenberg, K.; Kuntz, L.; Martakis, K.; Roth, B.; Wiesen, D. The Effect of Expert Feedback on Antibiotic Prescribing in Pediatrics: Experimental Evidence. Med. Decis. Mak. 2019, 39, 781–795. [Google Scholar] [CrossRef] [PubMed]
- Hafsteinsdottir, E.J.G.; Siciliani, L. DRG prospective payment systems: Refine or not refine? Heal. Econ. 2010, 19, 1226–1239. [Google Scholar] [CrossRef]
- Koehler, H.M. Yardstick Competition when Quality is Endogenous: The Case of Hospital Regulation. In BGPE Discussion Papers; University of Erlangen-Nürnberg: Nürnberg, Germany, 2006. [Google Scholar]
- Kifmann, M.; Siciliani, L. Average-Cost Pricing and Dynamic Selection Incentives in the Hospital Sector. Heal. Econ. 2016, 26, 1566–1582. [Google Scholar] [CrossRef] [Green Version]
- Augurzky, B.; Gülker, R.; Mennicken, R.; Felder, S.; Meyer, S.; Wasem, J.; Gülker, H.; Siemssen, N. Mengenentwicklung und Mengensteuerung stationärer Leistungen: Endbericht—Mai 2012. In Forschungsprojekt im Auftrag des GKV-Spitzenverbandes; RWI—Leibniz-Institut für Wirtschaftsforschung: Essen, Germany, 2012. [Google Scholar]
- Blum, K.; Offermanns, M. Einflussfaktoren des Fallzahl- und Mix Anstieges in deutschen Krankenhäusern—Gutachten; Deutsches Krankenhaus Institut: Düsseldorf, Germany, 2012. [Google Scholar]
- Reifferscheid, A.; Thomas, D.; Wasem, J. Zehn Jahre DRG-System in Deutschland—Theoretische Anreizwirkungen und empirische Evidenz. In Krankenhaus-Report 2013—Mengendynamik: Mehr Menge, Mehr Nutzen? Klauber, J., Geraedts, M., Friedrich, J., Wasem, J., Eds.; Stuttgart Schattauer Verlag: Stuttgart, Germany, 2013; pp. 3–19. [Google Scholar]
- Fürstenberg, T.; Laschat, M.; Zich, K.; Klein, S.; Gierling, P.; Notling, H.-D.; Schmidt, T. G-DRG-Begleitforschung Gemäß §17b Abs. 8 KHG—Endbericht des dritten Forschungszyklus (2008 bis 2010); IGES Institut GmbH: München, Germany, 2013. [Google Scholar]
- Schreyögg, J.; Bäuml, M.; Krämer, J.; Dette, T.; Busse, R.; Geissler, A. Forschungsauftrag zur Mengenentwicklung nach §17b Abs. 9 KHG; Hamburg Center for Health Economics: Hamburg, Germany, 2014. [Google Scholar]
- Abler, S.; Verde, P.; Stannigel, H.; Mayatepek, E.; Hoehn, T. Effect of the introduction of diagnosis related group systems on the distribution of admission weights in very low birthweight infants. Arch. Dis. Child.—Fetal Neonatal Ed. 2010, 96, F186–F189. [Google Scholar] [CrossRef]
- Jürges, H.; Köberlein, J. What explains DRG upcoding in neonatology? The roles of financial incentives and infant health. J. Heal. Econ. 2015, 43, 13–26. [Google Scholar] [CrossRef]
- Hennig-Schmidt, H.; Jürges, H.; Wiesen, D. Dishonesty in health care practice—A behavioral experiment on upcoding in neonatology. Health Econ. 2019, 28, 319–338. [Google Scholar] [CrossRef]
- Christianson, J.B.; Leatherman, S.; Sutherland, K. Lessons from Evaluations of Purchaser Pay-for-Performance Programs: A review of the evidence. Med. Care Res. Rev. 2008, 65, 5S–35S. [Google Scholar] [CrossRef]
- Eijkenaar, F.; Emmert, M.; Scheppach, M.; Schöffski, O. Effects of pay for performance in health care: A systematic review of systematic reviews. Health Policy 2013, 110, 115–130. [Google Scholar] [CrossRef]
- Lindenauer, P.K.; Remus, D.; Roman, S.; Rothberg, M.B.; Benjamin, E.M.; Ma, A.; Bratzler, D.W. Public Reporting and Pay for Performance in Hospital Quality Improvement. N. Engl. J. Med. 2007, 356, 486–496. [Google Scholar] [CrossRef] [PubMed] [Green Version]
- Kristensen, S.R. Financial Penalties for Performance in Health Care. Health Econ. 2016, 26, 143–148. [Google Scholar] [CrossRef] [PubMed] [Green Version]
- Holmstrom, B.; Milgrom, P. Multitask Principal-Agent Analyses: Incentive Contracts, Asset Ownership, and Job Design. J. Law Econ. Organ. 1991, 7, 24–52. [Google Scholar] [CrossRef] [Green Version]
- Eggleston, K. Multitasking and mixed systems for provider payment. J. Health Econ. 2005, 24, 211–223. [Google Scholar] [CrossRef]
- Campbell, S.; Reeves, D.; Kontopantelis, E.; Sibbald, B.; Roland, M. Effects of Pay for Performance on the Quality of Primary Care in England. N. Engl. J. Med. 2009, 361, 368–378. [Google Scholar] [CrossRef] [Green Version]
- Keser, C.; Schnitzler, C. Money Talks—Paying Physicians for Performance. Centers for European, Governance and Economics Development Research Discussion Papers SSRN. Electron. J. 2013. [Google Scholar] [CrossRef] [Green Version]
- Lagarde, M.; Blaauw, D. Testing the Effects of Doctors’ Remuneration Schemes in A Multitasking Environment: A Real Effort Laboratory Experiment; RESYST Working Paper; London School of Hygiene & Tropical Medicine: London, UK, 2014; p. 5. [Google Scholar]
- Brosig-Koch, J.; Henning-Schmidt, H.; Kairies-Schwarz, N.; Kokot, J.; Wiesen, D. Physician Performance Pay: Experimental Evidence. SSRN Electron. J. 2019, 3467583. [Google Scholar] [CrossRef]
- Cox, J.C.; Sadiraj, V.; Schnier, K.E.; Sweeney, J.F. Incentivizing cost-effective reductions in hospital readmission rates. J. Econ. Behav. Organ. 2016, 131, 24–35. [Google Scholar] [CrossRef] [Green Version]
- Hannan, R.L.; Hoffman, V.B.; Moser, D.V. Bonus versus Penalty: Does Contract Frame Affect Employee Effort. In Experimental Business Research; Rapoport, A., Zwick, R., Eds.; Springer: Boston, MA, USA, 2005; pp. 151–169. [Google Scholar]
- Brooks, R.R.W.; Stremitzer, A.; Tontrup, S.W. Framing Contracts—Why Loss Framing Increases Effort. SSRN Electron. J. 2012, 168, 62–82. [Google Scholar] [CrossRef] [Green Version]
- Hossain, T.; List, J.A. The Behavioralist Visits the Factory: Increasing Productivity Using Simple Framing Manipulations. Manag. Sci. 2012, 58, 2151–2167. [Google Scholar] [CrossRef] [Green Version]
- De Quidt, J. Your Loss Is My Gain: A Recruitment Experiment with Framed Incentives. J. Eur. Econ. Assoc. 2017, 16, 522–559. [Google Scholar] [CrossRef] [Green Version]
- Harrison, G.W.; List, J.A. Field Experiments. SSRN Electron. J. 2004, 42, 1009–1055. [Google Scholar] [CrossRef]
- Reif, S.; Hafner, L.; Seebauer, M. Physician Behavior under Prospective Payment Schemes—Evidence from Artefactual Field and Lab Experiments. Int. J. Environ. Res. Public Health 2020, 17, 5540. [Google Scholar] [CrossRef] [PubMed]
- Green, E.; Peterson, K.S.; Markiewicz, K.; O’Brien, J.; Arring, N.M. Cautionary study on the effects of pay for performance on quality of care: A pilot randomised controlled trial using standardised patients. BMJ Qual. Saf. 2020, 29, 664–671. [Google Scholar] [CrossRef] [PubMed]
- Sherry, T.B. A Note on the Comparative Statics of Pay-for-Performance in Health Care. Health Econ. 2015, 25, 637–644. [Google Scholar] [CrossRef]
- Fürstenberg, T.; Schiffhorst, G. Mengenentwicklung und deren Determinanten in ausgewählten Bereichen der Kardiologie. In Krankenhaus-Report 2013—Mengendynamik: Mehr Menge, Mehr Nutzen? Klauber, J., Geraedts, M., Friedrich, J., Wasem, J., Eds.; Stuttgart Schattauer Verlag: Stuttgart, Germany, 2013; pp. 135–156. [Google Scholar]
- Hennig-Schmidt, H.; Selten, R.; Wiesen, D. How payment systems affect physicians’ provision behaviour—An experimental investigation. J. Health Econ. 2011, 30, 637–646. [Google Scholar] [CrossRef] [Green Version]
- Godager, G.; Wiesen, D. Profit or patients’ health benefit? Exploring the heterogeneity in physician altruism. J. Health Econ. 2013, 32, 1105–1116. [Google Scholar] [CrossRef] [Green Version]
- Brosig-Koch, J.; Hennig-Schmidt, H.; Kairies-Schwarz, N.; Wiesen, D. Using artefactual field and lab experiments to investigate how fee-for-service and capitation affect medical service provision. J. Econ. Behav. Organ. 2016, 131, 17–23. [Google Scholar] [CrossRef] [Green Version]
- Brosig-Koch, J.; Hennig-Schmidt, H.; Kairies-Schwarz, N.; Wiesen, D. The Effects of Introducing Mixed Payment Systems for Physicians: Experimental Evidence. Health Econ. 2015, 26, 243–262. [Google Scholar] [CrossRef] [Green Version]
- Brosig-Koch, J.; Kairies-Schwarz, N.; Kokot, J. Sorting into payment schemes and medical treatment: A laboratory experiment. Health Econ. 2017, 26, 52–65. [Google Scholar] [CrossRef] [Green Version]
- Institut für das Entgeltsystem im Krankenhaus—InEK. Fallpauschalen-Katalog G-DRG-Version 2015. Available online: www.g-drg.de/Archiv/DRG_%20Systemjahr_2015_Datenjahr_2013#sm2 (accessed on 26 July 2020).
- Nahmmacher, K.; Clausen, T. Der Chefarztvertrag: Mit Umfangreichen Rechtlichen und Steuerlichen Erläuterungen; Müller, C.F., Ed.; Medizinrecht: Heidelberg, Germany, 2013. [Google Scholar]
- Centers for Medicare and Medicaid Services. Hospital-Acquired Condition Reduction Program (HACRP). Available online: https://www.cms.gov/Medicare/Medicare-Fee-for-Service-Payment/AcuteInpatientPPS/HAC-Reduction-Program.html (accessed on 26 July 2020).
- Chen, D.L.; Schonger, M.; Wickens, C. oTree—An Open-Source Platform for Laboratory, Online, and Field Experiments. SSRN Electron. J. 2016, 9, 88–97. [Google Scholar] [CrossRef] [Green Version]
- Greiner, B. Subject pool recruitment procedures: Organizing experiments with ORSEE. J. Econ. Sci. Assoc. 2015, 1, 114–125. [Google Scholar] [CrossRef]
- OECD. Health at a glance: Europe 2012. Available online: https://www.oecd-ilibrary.org/social-issues-migration-health/health-at-a-glance-europe-2012_9789264183896-en (accessed on 26 July 2020).
- Ashton, M.C.; Lee, K. The HEXACO-60: A Short Measure of the Major Dimensions of Personality. J. Pers. Assess. 2009, 91, 340–345. [Google Scholar] [CrossRef] [PubMed]


| Treatment | No. of Hospital Physicians | No. of Medical Students | Total |
|---|---|---|---|
| DRG-PP/Physician | 16 | - | 16 |
| DRG-PP/Student | - | 19 | 19 |
| DRG-PP/Student+Patient | - | 21 | 21 |
| Total | 16 | 40 | 56 |
| Sample Characteristics | w/o Patient Benefits | w Patient Benefits |
|---|---|---|
| Hospital Physicians | (n = 16) | n/a |
| Age (mean, std.dev.) | 43.94 (10.17) | n/a |
| Gender | ||
| % female | 31.3% | n/a |
| Specialty | ||
| % cardiologist | 50.0% | n/a |
| Job level | ||
| % physicians w/budget responsibility | 68.8% | n/a |
| Practice years (mean, std.dev.) | 15.25 (9.94) | n/a |
| Self-reported attitudes | ||
| Altruism (mean, std.dev.) | 16.44 (2.34) | n/a |
| Medical Students | (n = 19) | (n = 21) |
| Age (mean, std.dev.) | 25.58 (5.17) | 23.62 (1.80) |
| Gender | ||
| % female | 78.9% | 76.2% |
| Semester (mean, std.dev.) | 8.79 (2.94) | 8.43 (2.77) |
| Self-reported attitudes | ||
| Altruism (mean, std.dev.) | 15.58 (1.98) | 16.52 (2.42) |
| Treatment Case a | 1 | 2 | 3 | 4 | 5 | 6 | 7 | 8 | ||
|---|---|---|---|---|---|---|---|---|---|---|
| Medical Field b | DIA | CAR | DIA | CAR | DIA | CAR | DIA | CAR | ||
| Severity c | M | S | M | S | M | S | M | S | ||
| Subject Pool | % of Patient Optimal Choices | Mean | p-Value d | |||||||
| Physician (n = 16) | 69% | 50% | 69% | 94% | 100% | 75% | 69% | 69% | 74% | |
| Student (n = 19) | 21% | 37% | 21% | 58% | 68% | 47% | 21% | 26% | 38% | <0.0000 |
| Student+ Patient e (n = 21) | 52% | 38% | 19% | 52% | 71% | 62% | 29% | 43% | 46% | <0.0000 |
| Treatment case a | 1 | 2 | 3 | 4 | 5 | 6 | 7 | 8 | ||
|---|---|---|---|---|---|---|---|---|---|---|
| Medical field b | DIA | CAR | DIA | CAR | DIA | CAR | DIA | CAR | ||
| Severity c | M | S | M | S | M | S | M | S | ||
| Subject Pool | % of Patient Optimal Choices | Mean | p-Value d | |||||||
| Physician (n = 16) | 75% | 81% | 94% | 100% | 94% | 75% | 69% | 81% | 84% | |
| Student (n = 19) | 47% | 84% | 74% | 63% | 68% | 53% | 74% | 37% | 63% | 0.0009 |
| Student+ Patient (n = 21) | 67% | 76% | 57% | 81% | 95% | 76% | 57% | 76% | 73% | 0.0354 |
Publisher’s Note: MDPI stays neutral with regard to jurisdictional claims in published maps and institutional affiliations. |
© 2020 by the authors. Licensee MDPI, Basel, Switzerland. This article is an open access article distributed under the terms and conditions of the Creative Commons Attribution (CC BY) license (http://creativecommons.org/licenses/by/4.0/).
Share and Cite
Kairies-Schwarz, N.; Souček, C. Performance Pay in Hospitals: An Experiment on Bonus–Malus Incentives. Int. J. Environ. Res. Public Health 2020, 17, 8320. https://doi.org/10.3390/ijerph17228320
Kairies-Schwarz N, Souček C. Performance Pay in Hospitals: An Experiment on Bonus–Malus Incentives. International Journal of Environmental Research and Public Health. 2020; 17(22):8320. https://doi.org/10.3390/ijerph17228320
Chicago/Turabian StyleKairies-Schwarz, Nadja, and Claudia Souček. 2020. "Performance Pay in Hospitals: An Experiment on Bonus–Malus Incentives" International Journal of Environmental Research and Public Health 17, no. 22: 8320. https://doi.org/10.3390/ijerph17228320
APA StyleKairies-Schwarz, N., & Souček, C. (2020). Performance Pay in Hospitals: An Experiment on Bonus–Malus Incentives. International Journal of Environmental Research and Public Health, 17(22), 8320. https://doi.org/10.3390/ijerph17228320