The Use of Penalized Regression Analysis to Identify County-Level Demographic and Socioeconomic Variables Predictive of Increased COVID-19 Cumulative Case Rates in the State of Georgia

 ,
,  and
and
Abstract
1. Introduction
2. Materials and Methods
2.1. Study Population and Data Sources
2.2. Outcome of Interest
2.3. Data Analysis
3. Results
4. Discussion
5. Conclusions
Supplementary Materials
Author Contributions
Funding
Conflicts of Interest
References
- Li, Q.; Guan, X.; Wu, P.; Wang, X.; Zhou, L.; Tong, Y.; Ren, R.; Leung, K.S.M.; Lau, E.H.Y.; Wong, J.Y.; et al. Early transmission dynamics in Wuhan, China, of novel coronavirus–infected pneumonia. N. Engl. J. Med. 2020, 382, 1199–1207. [Google Scholar] [CrossRef] [PubMed]
- Johns Hopkins University. COVID-19 Case Tracker. Available online: https://coronavirus.jhu.edu (accessed on 10 August 2020).
- Ghebreyesus, T. WHO Director-General’s Opening Remarks at the Media Briefing on COVID-19. Available online: https://www.who.int/dg/speeches/detail/who-director-general-s-opening-remarks-at-the-media-briefing-on-covid-19---11-march-2020 (accessed on 1 July 2020).
- Mahajan, U.V.; Larkins-Pettigrew, M. Racial demographics and COVID-19 confirmed cases and deaths: A correlational analysis of 2886 US counties. J. Public Health 2020, 42, 445–447. [Google Scholar] [CrossRef] [PubMed]
- Abuelgasim, E.; Saw, L.J.; Shirke, M.; Zeinah, M.; Harky, A. COVID-19: Unique public health issues facing Black, Asian and minority ethnic communities. Curr. Probl. Cardiol. 2020, 45, 100621. [Google Scholar] [CrossRef] [PubMed]
- Gao, S.; Jiang, F.; Jin, W.; Shi, Y.; Yang, L.; Xia, Y.; Jia, L.; Wang, B.; Lin, H.; Cai, Y.; et al. Risk factors influencing the prognosis of elderly patients infected with COVID-19: A clinical retrospective study in Wuhan, China. Aging 2020, 12, 12504–12516. [Google Scholar] [CrossRef] [PubMed]
- Bambra, C. Health Divides-Where You Live Can Kill You, 1st ed.; Policy Press: Bristol, UK, 2016. [Google Scholar]
- Hatch, S.L.; Frissa, S.; Verdecchia, M.; Stewart, R.; Fear, N.T.; Reichenberg, A.; Morgan, C.; Kankulu, B.; Clark, J.; Gazard, B.; et al. Identifying socio-demographic and socioeconomic determinants of health inequalities in a diverse London community: The South East London Community Health (SELCoH) study. BMC Public Health 2011, 11, 861. [Google Scholar] [CrossRef]
- Garg, S.; Kim, L.; Whitaker, M.; O’Halloran, A.; Cummings, C.; Holstein, R.; Prill, M.; Chai, S.J.; Kirley, P.D.; Alden, N.B.; et al. Hospitalization rates and characteristics of patients hospitalized with laboratory-confirmed Coronavirus disease 2019-COVID-NET, 14 States, March 1-30, 2020. Mmwr. Morb. Mortal. Wkly. Rep. 2020, 69, 458–464. [Google Scholar] [CrossRef] [PubMed]
- Stafford, K.; Hoyer, M.; Morrison, A. Outcry Over Racial Data Grows as Virus Slams Black Americans. Associated Press News. 8 April 2020. Available online: https://apnews.com/article/71d952faad4a2a5d14441534f7230c7c (accessed on 27 October 2020).
- Vahidy, F.S.; Nicolas, J.C.; Meeks, J.R.; Khan, O.; Jones, S.L.; Masud, F.; Sostman, H.D.; Phillips, R.A.; Andrieni, J.D.; Kash, B.A.; et al. Racial and ethnic disparities in SARS-CoV-2 pandemic: Analysis of a COVID-19 observational registry for a diverse U.S. metropolitan population. medRxiv 2020. [Google Scholar] [CrossRef]
- Mourad, A.; Turner, N.A.; Baker, A.W.; Okeke, N.L.; Narayanasamy, S.; Rolfe, R.; Engemann, J.J.; Cox, G.M.; Stout, J.E. Social disadvantage, politics, and SARS-CoV-2 trends: A county-level analysis of United States data. medRxiv 2020. [Google Scholar] [CrossRef]
- Olulana, O.; Abedi, V.; Avula, V.; Chaudhary, D.; Khan, A.; Shahjouei, S.; Li, J.; Zand, R. Regional Association of Disability and SARS-CoV-2 Infection in 369 Counties of the United States. Medrxiv Prepr. Serv. Health Sci. 2020. [Google Scholar] [CrossRef]
- Marmot, M.; Friel, S.; Bell, R.; Houweling, T.A.J.; Taylor, S. Closing the gap in a generation: Health equity through action on the social determinants of health. Lancet 2008, 372, 1661–1669. [Google Scholar] [CrossRef]
- Walker, R.J.; Strom Williams, J.; Egede, L.E. Influence of race, ethnicity and social Determinants of Health on Diabetes Outcomes. Am. J. Med Sci. 2016, 351, 366–373. [Google Scholar] [CrossRef] [PubMed]
- Coffey, P.M.; Ralph, A.P.; Krause, V.L. The role of social determinants of health in the risk and prevention of group A streptococcal infection, acute rheumatic fever and rheumatic heart disease: A systematic review. PLoS Negl. Trop. Dis. 2018, 12, e0006577. [Google Scholar] [CrossRef]
- Lillie-Blanton, M.; Laveist, T. Race/ethnicity, the social environment, and health. Soc. Sci. Med. 1996, 43, 83–91. [Google Scholar] [CrossRef]
- Nazroo, J.Y. The structuring of ethnic inequalities in health: Economic position, racial discrimination, and racism. Am. J. Public Health 2003, 93, 277–284. [Google Scholar] [CrossRef] [PubMed]
- Thomas, T.L.; DiClemente, R.; Snell, S. Overcoming the triad of rural health disparities: How local culture, lack of economic opportunity, and geographic location instigate health disparities. Health Educ. J. 2013, 73, 285–294. [Google Scholar] [CrossRef]
- Scott, A.J.; Wilson, R.F. Social determinants of health among African Americans in a rural community in the Deep South: An ecological exploration. Rural Remote Health 2011, 11, 1634. [Google Scholar]
- Paul, R.; Arif, A.A.; Adeyemi, O.; Ghosh, S.; Han, D. Progression of COVID-19 From Urban to Rural Areas in the United States: A Spatiotemporal Analysis of Prevalence Rates. J. Rural Health 2020, 36, 591–601. [Google Scholar] [CrossRef]
- Shah, G.H.; Shankar, P.; Schwind, J.S.; Sittaramane, V. The detrimental impact of the COVID-19 crisis on health equity and social determinants of health. J. Public Health Manag. Pr. 2020, 26, 317–319. [Google Scholar] [CrossRef]
- Georgia Department of Public Health. COVID-19 Daily Status Report. Available online: https://dph.georgia.gov/covid-19-daily-status-report (accessed on 1 August 2020).
- University of Wisconsin Public Health Institute and Robert Wood Johnson Foundation. County Health Rankings. Available online: https://www.countyhealthrankings.org/ (accessed on 1 April 2020).
- Lu, M.; Zhou, J.; Naylor, C.; Kirkpatrick, B.D.; Haque, R.; Petri, W.A., Jr.; Ma, J.Z. Application of penalized linear regression methods to the selection of environmental enteropathy biomarkers. Biomark. Res. 2017, 5, 9. [Google Scholar] [CrossRef]
- Tibshirani, R. Regression shrinkage and selection via the lasso. J. R. Stat. Soc. Ser. B (Methodol.) 1996, 58, 267–288. [Google Scholar] [CrossRef]
- Simeonov, K.P.; Himmelstein, D.S. Lung cancer incidence decreases with elevation: Evidence for oxygen as an inhaled carcinogen. PeerJ 2015, 3, e705. [Google Scholar] [CrossRef] [PubMed]
- Ortega Hinojosa, A.M.; Davies, M.M.; Jarjour, S.; Burnett, R.T.; Mann, J.K.; Hughes, E.; Balmes, J.R.; Turner, M.C.; Jerrett, M. Developing small-area predictions for smoking and obesity prevalence in the United States for use in Environmental Public Health Tracking. Environ. Res. 2014, 134, 435–452. [Google Scholar] [CrossRef] [PubMed]
- Park, S.K.; Mukherjee, B.; Xia, X.; Sparrow, D.; Weisskopf, M.G.; Nie, H.; Hu, H. Bone lead level prediction models and their application to examine the relationship of lead exposure and hypertension in the Third National Health and Nutrition Examination Survey. J. Occup. Environ. Med. 2009, 51, 1422–1436. [Google Scholar] [CrossRef] [PubMed]
- Adhikari, S.; Pantaleo, N.P.; Feldman, J.M.; Ogedegbe, O.; Thorpe, L.; Troxel, A.B. Assessment of Community-Level Disparities in Coronavirus Disease 2019 (COVID-19) Infections and Deaths in Large US Metropolitan Areas. JAMA Netw. Open 2020, 3, e2016938. [Google Scholar] [CrossRef] [PubMed]
- David, R.; Messer, L. Reducing Disparities: Race, Class and the Social Determinants of Health. Matern. Child Health J. 2011, 15, 1–3. [Google Scholar] [CrossRef] [PubMed]
- Braveman, P.; Gottlieb, L. The social determinants of health: It’s time to consider the causes of the causes. Public Health Rep. 2014, 129, 19–31. [Google Scholar] [CrossRef]
- Cubrich, M. On the frontlines: Protecting low-wage workers during COVID-19. Psychol. Trauma 2020, 12, S186–S187. [Google Scholar] [CrossRef]
- Gould, E.; Shierholz, H. Not Everybody Can Work from Home: Black and Hispanic Workers are Much Less Likely to be Able to Telework; Economic Policy Institute: Washington, DC, USA, 2020. [Google Scholar]
- Hargraves, J.L.; Hadley, J. The contribution of insurance coverage and community resources to reducing racial/ethnic disparities in access to care. Health Serv. Res. 2003, 38, 809–829. [Google Scholar] [CrossRef]
- Chen, J.Y.; Fox, S.A.; Cantrell, C.H.; Stockdale, S.E.; Kagawa-Singer, M. Health disparities and prevention: Racial/ethnic barriers to flu vaccinations. J. Community Health 2007, 32, 5–20. [Google Scholar] [CrossRef]
- Gordon-Larsen, P.; Boone-Heinonen, J.; Sidney, S.; Sternfeld, B.; Jacobs, D.R., Jr.; Lewis, C.E. Active commuting and cardiovascular disease risk: The CARDIA Study. Arch. Intern. Med. 2009, 169, 1216–1223. [Google Scholar] [CrossRef]
- Cunningham, S.A.; Patel, S.A.; Beckles, G.L.; Geiss, L.S.; Mehta, N.; Xie, H.; Imperatore, G. County-level contextual factors associated with diabetes incidence in the United States. Ann. Epidemiol. 2018, 28, 20–25.e22. [Google Scholar] [CrossRef]
- King, D.M.; Jacobson, S.H. What Is Driving Obesity? A Review on the connections between obesity and motorized transportation. Curr. Obes. Rep. 2017, 6, 3–9. [Google Scholar] [CrossRef]
- Baker, M.G. Who cannot work from home? Characterizing occupations facing increased risk during the COVID-19 pandemic using 2018 BLS data. medRxiv 2020. [Google Scholar] [CrossRef]
- Reichberg, S.B.; Mitra, P.P.; Haghamad, A.; Ramrattan, G.; Crawford, J.M.; Berry, G.J.; Davidson, K.W.; Drach, A.; Duong, S.; Juretschko, S.; et al. Rapid emergence of SARS-CoV-2 in the greater New York Metropolitan Area: Geolocation, demographics, positivity rates, and hospitalization for 46,793 persons tested by Northwell Health. Clin. Infect. Dis. 2020. [Google Scholar] [CrossRef]
- Kelvin, A.A.; Halperin, S. COVID-19 in children: The link in the transmission chain. Lancet Infect. Dis. 2020, 20, 633–634. [Google Scholar] [CrossRef]
- Song, J.; Hu, W.; Yu, Y.; Shen, X.; Wang, Y.; Yan, J.; Yang, X.; Gong, S.; Wang, M. A Comparison of clinical characteristics and outcomes in elderly and younger patients with COVID-19. Med. Sci. Monit. 2020, 26, e925047. [Google Scholar] [CrossRef] [PubMed]
- Antonacci, Y.; Astolfi, L.; Nollo, G.; Faes, L. Information transfer in linear multivariate processes assessed through penalized regression techniques: Validation and application to physiological networks. Entropy 2020, 22, 732. [Google Scholar] [CrossRef]
- Haufe, S.; Müller, K.-R.; Nolte, G.; Krämer, N. Sparse causal discovery in multivariate time series. Proceedings of Causality: Objectives and Assessment at MPIS 2008, Proceedings of Machine Learning Research. Whistler, Canada, 12 December 2008. [Google Scholar]
- Yancy, C.W. COVID-19 and African Americans. JAMA 2020, 323, 1891–1892. [Google Scholar] [CrossRef] [PubMed]


| Variable | Median | Mean | Standard Deviation | Standardized Coefficient βz |
|---|---|---|---|---|
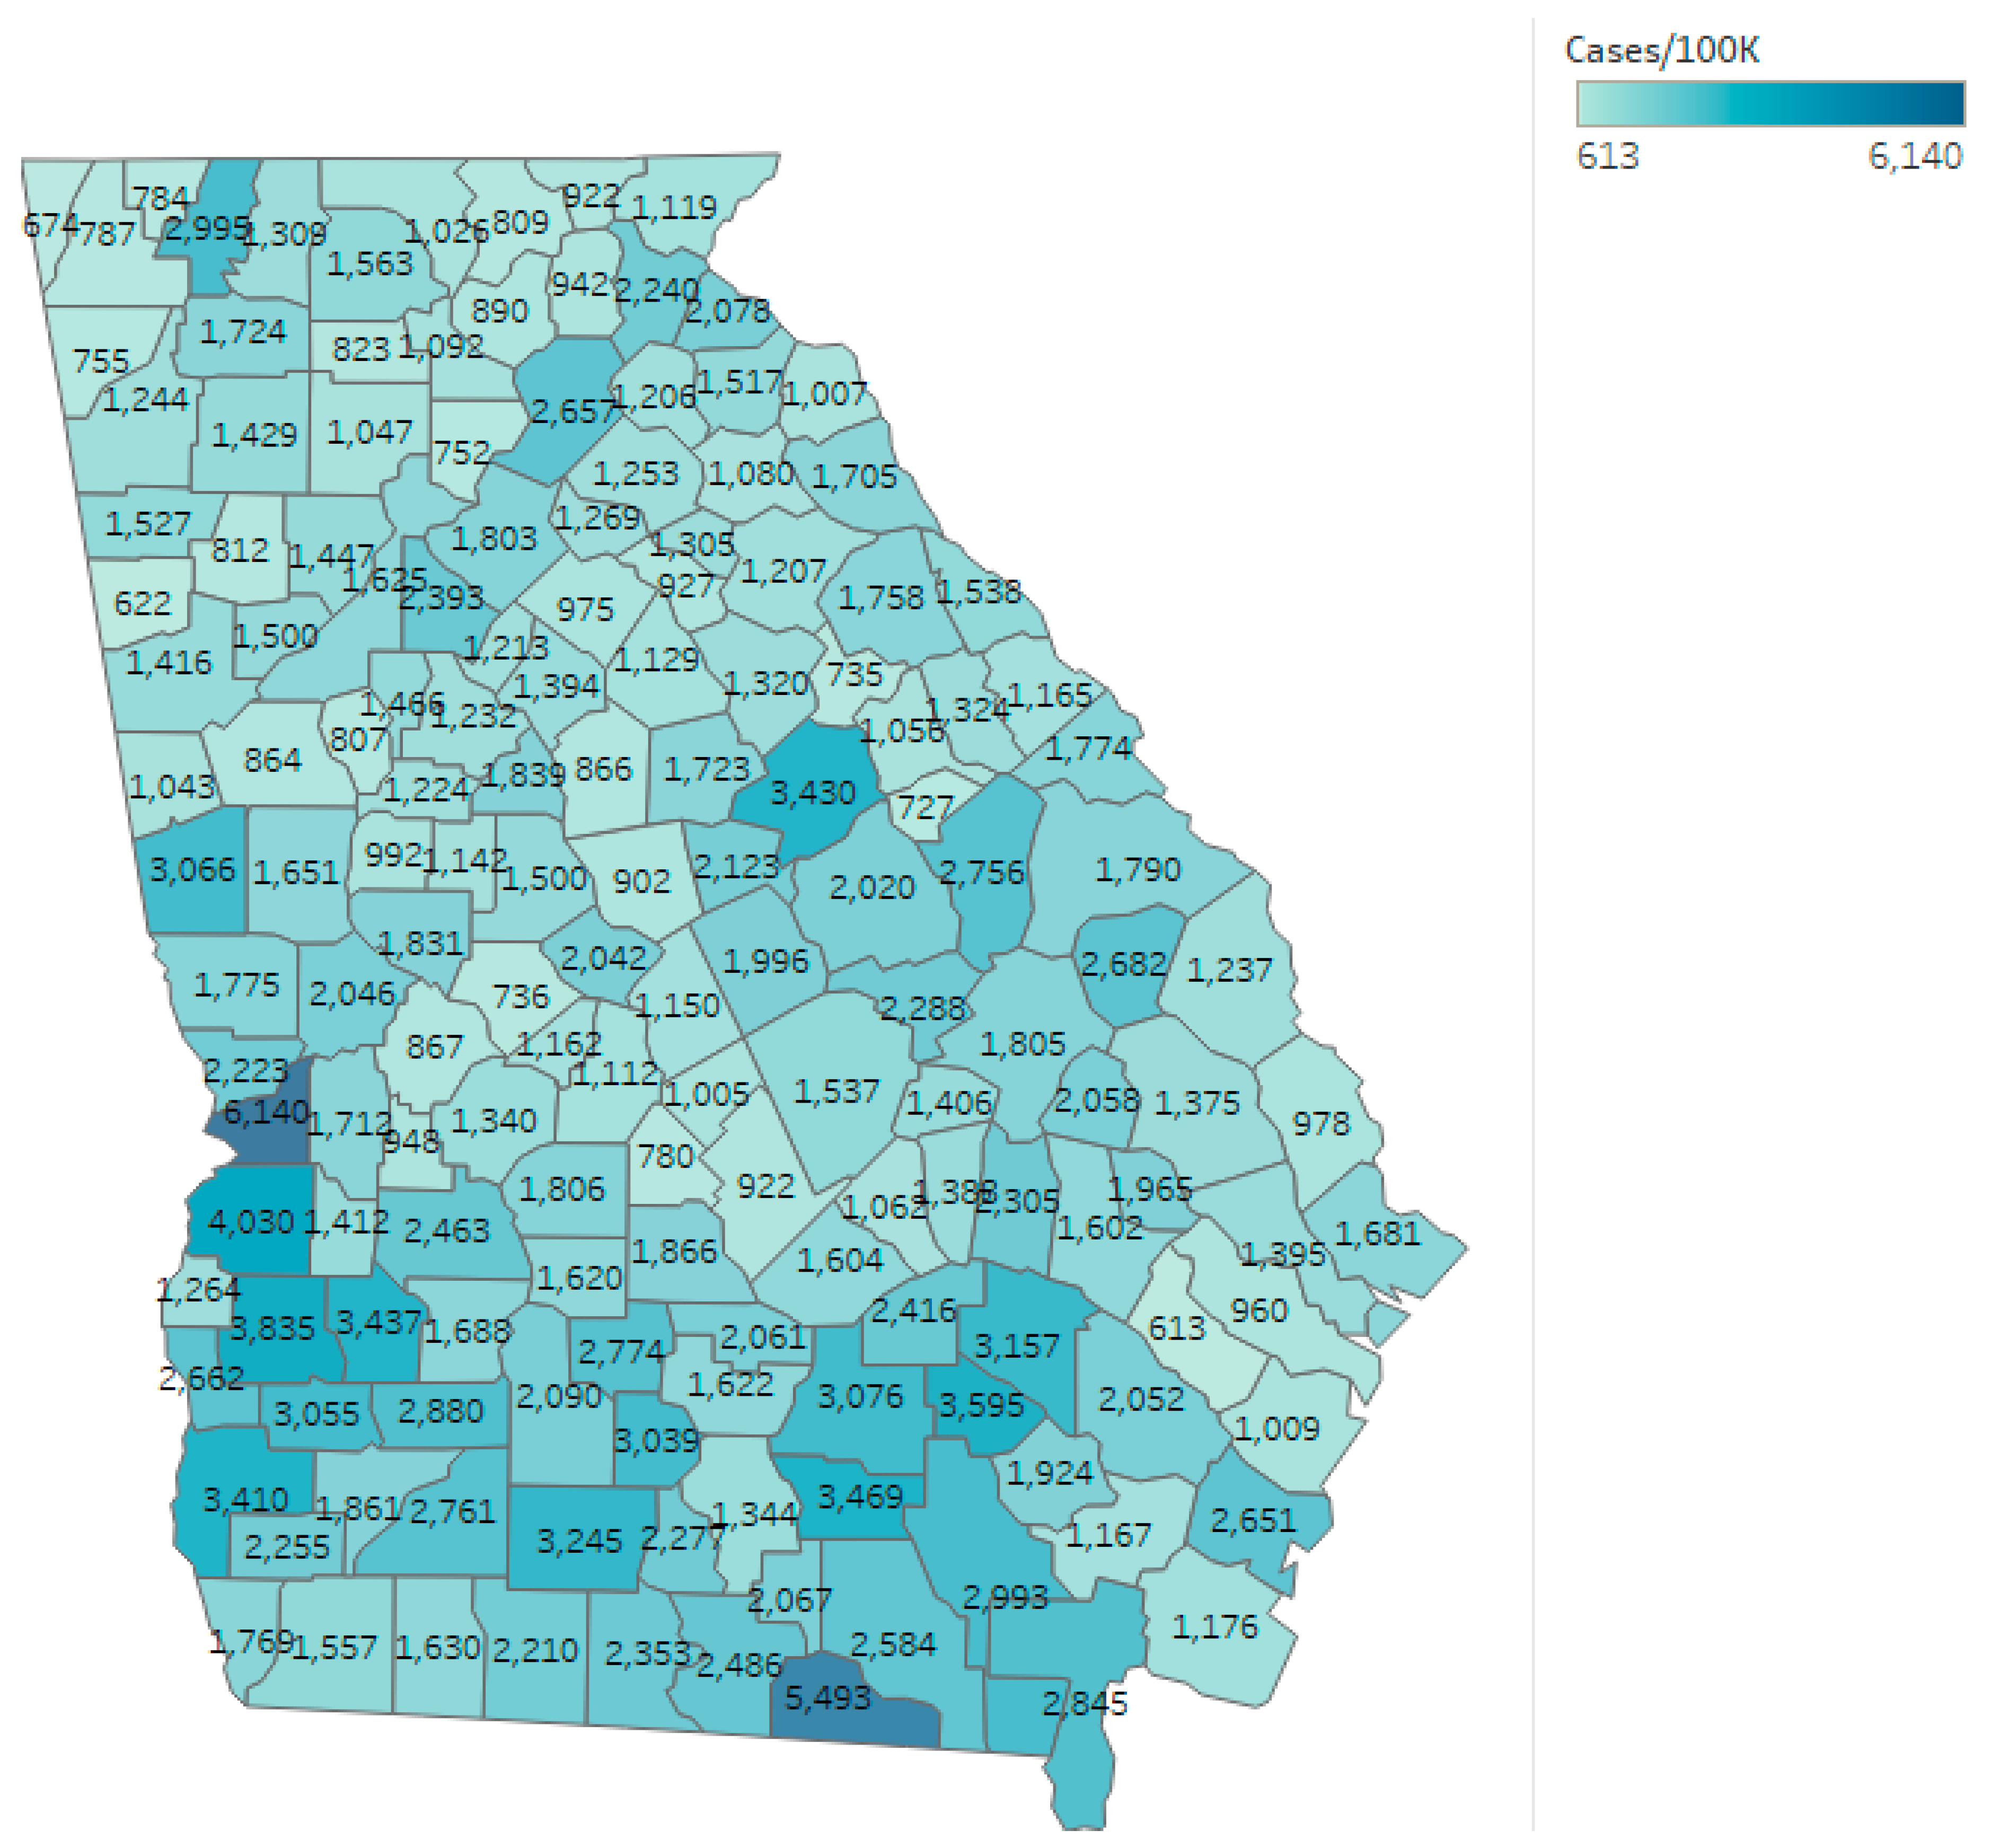
| Cumulative cases/100,000 residents | 1538.46 | 1748.341 | 889.452 | |
| Log transformed case rates (used for analysis) | 7.3385 | 7.3563 | 0.4629 | |
| Percent with long commute who drive alone | 36.8 | 36.92 | 11.95 | −0.1828 |
| Percent non-Hispanic White residents | 61.78 | 61.96 | 17.26 | −0.1741 |
| Percent of children qualifying for free lunch | 74.61 | 73.43 | 20.47 | 0.1154 |
| Percent who report poor or fair health | 20.16 | 20.1 | 3.73 | 0.0897 |
| Percent not proficient in English | 0.93 | 1.62 | 1.95 | 0.0856 |
| Segregation index: Black/White | 29.9 | 29.52 | 15.09 | 0.0876 |
| Percent of uninsured adults | 19.74 | 20.1 | 3.27 | 0.0779 |
| Percent female | 51.11 | 50.39 | 3.2 | –0.0671 |
| Percent with annual influenza vaccine | 42 | 41.13 | 5.62 | –0.0622 |
| Teen birth rate | 37.23 | 35.79 | 13.4 | 0.0351 |
| Percent under 18 years of age | 22.78 | 22.4 | 3.14 | 0.0344 |
| Child mortality rate | 71.96 | 73.1 | 24.26 | 0.0114 |
| Category | 4/1/2020 | 5/1/2020 | 6/1/2020 | 7/1/2020 | 8/1/2020 |
|---|---|---|---|---|---|
| Demographics | Percent non-Hispanic White (βz = −0.056) | Percent non-Hispanic White (βz = −0.11) | Percent non-Hispanic White (βz = −0.055) | Percent non-Hispanic White (βz = −0.174) | |
| Segregation index—Black:White (βz = 0.088) | |||||
| Percent under 18 years of age (βz = 0.034) | |||||
| Percent female (βz = −0.067) | |||||
| Percent not proficient in English (βz = 0.086) | |||||
| Health indicators | Percent who report poor or fair health (βz = 0.192) | Percent who report poor or fair health (βz = 0.09) | |||
| Access to care | Women with annual mammography (βz = 0.055) | ||||
| Percent with annual flu vaccine (βz = −0.062) | |||||
| Urban vs. rural spread | Violent crimes rate (βz = 0.14) | Violent crimes rate (βz = 0.063) | |||
| Long commute who drive alone (βz = −0.066) | Long commute who drive alone (βz = −0.183) | ||||
| Average daily PM2.5 (βz = 0.069) | |||||
| Socioeconomic | Children in single-family homes (βz = 0.132) | Children in single-family homes (βz = 0.012) | Teen birth rate (βz = 0.035) | ||
| Children in poverty (βz = 0.116) | Children in poverty (βz = 0.125) | ||||
| Low birthweight (βz = 0.015) | Low birthweight (βz = −0.076) | Children qualifying for free lunch (βz = 0.115) | |||
| Child mortality rate (βz = 0.19) | Child mortality rate (βz = 0.042) | Child mortality rate (βz = 0.11) | |||
| Uninsured adults (βz = −0.054) | Uninsured adults (βz = 0.078) | ||||
| Model adjusted r-squared | 0.0930 | 0.2011 | 0.1421 | 0.2322 | 0.4525 |
| Model F statistic | 16.99 | 7.63 | 6.23 | 10.56 | 11.88 |
| Model p-value | <0.0001 | <0.0001 | <0.0001 | <0.0001 | <0.0001 |
Publisher’s Note: MDPI stays neutral with regard to jurisdictional claims in published maps and institutional affiliations. |
© 2020 by the authors. Licensee MDPI, Basel, Switzerland. This article is an open access article distributed under the terms and conditions of the Creative Commons Attribution (CC BY) license (http://creativecommons.org/licenses/by/4.0/).
Share and Cite
Richmond, H.L.; Tome, J.; Rochani, H.; Fung, I.C.-H.; Shah, G.H.; Schwind, J.S. The Use of Penalized Regression Analysis to Identify County-Level Demographic and Socioeconomic Variables Predictive of Increased COVID-19 Cumulative Case Rates in the State of Georgia. Int. J. Environ. Res. Public Health 2020, 17, 8036. https://doi.org/10.3390/ijerph17218036
Richmond HL, Tome J, Rochani H, Fung IC-H, Shah GH, Schwind JS. The Use of Penalized Regression Analysis to Identify County-Level Demographic and Socioeconomic Variables Predictive of Increased COVID-19 Cumulative Case Rates in the State of Georgia. International Journal of Environmental Research and Public Health. 2020; 17(21):8036. https://doi.org/10.3390/ijerph17218036
Chicago/Turabian StyleRichmond, Holly L., Joana Tome, Haresh Rochani, Isaac Chun-Hai Fung, Gulzar H. Shah, and Jessica S. Schwind. 2020. "The Use of Penalized Regression Analysis to Identify County-Level Demographic and Socioeconomic Variables Predictive of Increased COVID-19 Cumulative Case Rates in the State of Georgia" International Journal of Environmental Research and Public Health 17, no. 21: 8036. https://doi.org/10.3390/ijerph17218036
APA StyleRichmond, H. L., Tome, J., Rochani, H., Fung, I. C.-H., Shah, G. H., & Schwind, J. S. (2020). The Use of Penalized Regression Analysis to Identify County-Level Demographic and Socioeconomic Variables Predictive of Increased COVID-19 Cumulative Case Rates in the State of Georgia. International Journal of Environmental Research and Public Health, 17(21), 8036. https://doi.org/10.3390/ijerph17218036