The Moderating Effect of Distance on Features of the Built Environment and Active School Transport


Abstract
1. Introduction
2. Materials and Methods
2.1. Participants and Setting
2.2. Research Design
3. Measures
3.1. School Transport
3.2. Built Environment
3.3. Distance
3.4. Covariates
3.5. Data Analysis
4. Results
5. Discussion
Limitations
6. Conclusions
Author Contributions
Funding
Acknowledgments
Conflicts of Interest
References
- Biddle, S.J.; Gorely, T.; Stensel, D.J. Health-enhancing physical activity and sedentary behaviour in children and adolescents. J. Sports Sci. 2004, 22, 679–701. [Google Scholar] [CrossRef] [PubMed]
- Cooper, A.R.; Page, A.S.; Foster, L.J.; Qahwaji, D. Commuting to school: Are children who walk more physically active? Am. J. Prev. Med. 2003, 25, 273–276. [Google Scholar] [CrossRef]
- Omura, J.D.; Carlson, S.A.; Brown, D.R.; Hopkins, D.P.; Kraus, W.E.; Staffileno, B.A.; Thomas, R.J.; Lobelo, F.; Fulton, J.E. Built Environment Approaches to Increase Physical Activity: A Science Advisory from the American Heart Association. Circulation 2020. [Google Scholar] [CrossRef] [PubMed]
- Villa-González, E.; Barranco-Ruiz, Y.; Evenson, K.R.; Chillón, P. Systematic review of interventions for promoting active school transport. Prev. Med. 2018, 111, 115–134. [Google Scholar] [CrossRef] [PubMed]
- Lubans, D.R.; Boreham, C.A.; Kelly, P.; Foster, C.E. The relationship between active travel to school and health-related fitness in children and adolescents: A systematic review. Int. J. Behav. Nutr. Phys. Act. 2011, 8, 5. [Google Scholar] [CrossRef] [PubMed]
- Van Dijk, M.L.; De Groot, R.H.M.; Van Acker, F.; Savelberg, H.H.C.M.; Kirschner, P.A. Active commuting to school, cognitive performance, and academic achievement: An observational study in Dutch adolescents using accelerometers. BMC Public Health 2014, 14, 799. [Google Scholar] [CrossRef] [PubMed]
- Kerr, J.; Emond, J.A.; Badland, H.; Reis, R.; Sarmiento, O.; Carlson, J.; Sallis, J.F.; Cerin, E.; Cain, K.; Conway, T.; et al. Perceived neighborhood environmental attributes associated with walking and cycling for transport among adult residents of 17 cities in 12 countries: The IPEN study. Environ. Health Perspect. 2016, 124, 290–298. [Google Scholar] [CrossRef]
- Federal Highway Administration 2017 National Household Travel Survey. Available online: https://nhts.ornl.gov/assets/FHWA_NHTS_%20Brief_Traveltoschool_032519.pdf (accessed on 5 October 2019).
- National Physical Activity Plan Alliance. The 2018 United States Report Card on Physical Activity for Children and Youth; National Physical Activity Plan Alliance: Washington, DC, USA, 2018. [Google Scholar]
- World Health Organization. World Health Organization Global Action Plan on Physical Activity 2018–2030: More Active People for a Healthier World; World Health Organization: Geneva, Switzerland, 2018. [Google Scholar]
- Ding, D.; Sallis, J.F.; Kerr, J.; Lee, S.; Rosenberg, D.E. Neighborhood Environment and Physical Activity among Youth: A Review. Am. J. Prev. Med. 2011, 41, 442–455. [Google Scholar] [CrossRef]
- Kowaleski-Jones, L.; Zick, C.; Smith, K.R.; Brown, B.; Hanson, H.; Fan, J. Walkable neighborhoods and obesity: Evaluating effects with a propensity score approach. SSM Popul. Health 2018, 6, 9–15. [Google Scholar] [CrossRef]
- Ikeda, E.; Hinckson, E.; Witten, K.; Smith, M. Assessment of direct and indirect associations between children active school travel and environmental, household and child factors using structural equation modelling. Int. J. Behav. Nutr. Phys. Act. 2019, 16, 32. [Google Scholar] [CrossRef]
- Wong, B.Y.-M.; Faulkner, G.; Buliung, R. GIS measured environmental correlates of active school transport: A systematic review of 14 studies. Int. J. Behav. Nutr. Phys. Act. 2011, 8, 39. [Google Scholar] [CrossRef]
- Adams, M.A.; Frank, L.D.; Schipperijn, J.; Smith, G.; Chapman, J.; Christiansen, L.B.; Coffee, N.; Salvo, D.; du Toit, L.; Dygrýn, J.; et al. International variation in neighborhood walkability, transit, and recreation environments using geographic information systems: The IPEN adult study. Int. J. Health Geogr. 2014, 13, 43. [Google Scholar] [CrossRef] [PubMed]
- Bauman, A.E.; Reis, R.S.; Sallis, J.F.; Wells, J.C.; Loos, R.J.; Martin, B.W. Correlates of physical activity: Why are some people physically active and others not? Lancet 2012, 380, 258–271. [Google Scholar] [CrossRef]
- Sallis, J.F.; Cerin, E.; Kerr, J.; Adams, M.A.; Sugiyama, T.; Christiansen, L.B.; Schipperijn, J.; Davey, R.; Salvo, D.; Frank, L.D.; et al. Built Environment, Physical Activity, and Obesity: Findings from the International Physical Activity and Environment Network (IPEN) Adult Study. Annu. Rev. Public Health 2020, 41, 119–139. [Google Scholar] [CrossRef] [PubMed]
- Larsen, K.; Buliung, R.N.; Faulkner, G.E. School travel route measurement and built environment effects in models of children’s school travel behavior. JTLU 2015. [Google Scholar] [CrossRef][Green Version]
- Braza, M.; Shoemaker, W.; Seeley, A. Neighborhood Design and Rates of Walking and Biking to Elementary School in 34 California Communities. Am. J. Health Promot. 2004, 19, 128–136. [Google Scholar] [CrossRef] [PubMed]
- Carlson, J.A.; Sallis, J.F.; Kerr, J.; Conway, T.L.; Cain, K.; Frank, L.D.; Saelens, B.E. Built environment characteristics and parent active transportation are associated with active travel to school in youth age 12–15. Br. J. Sports Med. 2014, 48, 1634–1639. [Google Scholar] [CrossRef]
- Kerr, J.; Frank, L.; Sallis, J.F.; Chapman, J. Urban form correlates of pedestrian travel in youth: Differences by gender, race-ethnicity and household attributes. Transp. Res. Part D Transp. Environ. 2007, 12, 177–182. [Google Scholar] [CrossRef]
- Mitra, R.; Buliung, R.N.; Roorda, M.J. The built environment and school travel mode choice in Toronto, Canada. Transp. Res. Rec. J. Transp. Res. Board 2010, 2156, 150–159. [Google Scholar] [CrossRef]
- Campos-Sánchez, F.S.; Abarca-Álvarez, F.J.; Molina-García, J.; Chillón, P. A GIS-based method for analysing the association between school-built environment and home-school route measures with active commuting to school in urban children and adolescents. Int. J. Environ. Res. Public Health 2020, 17, 2295. [Google Scholar] [CrossRef]
- Bringolf-Isler, B.; Grize, L.; Mäder, U.; Ruch, N.; Sennhauser, F.H.; Braun-Fahrländer, C.; SCARPOL Team. Personal and environmental factors associated with active commuting to school in Switzerland. Prev. Med. 2008, 46, 67–73. [Google Scholar] [CrossRef]
- Huertas-Delgado, F.J.; Herrador-Colmenero, M.; Villa-González, E.; Aranda-Balboa, M.J.; Cáceres, M.V.; Mandic, S.; Chillón, P. Parental perceptions of barriers to active commuting to school in Spanish children and adolescents. Eur. J. Public Health 2017, 27, 416–421. [Google Scholar] [CrossRef] [PubMed]
- Chillón, P.; Panter, J.; Corder, K.; Jones, A.P.; Van Sluijs, E.M.F. A longitudinal study of the distance that young people walk to school. Health Place 2015, 31, 133–137. [Google Scholar] [CrossRef]
- Ferri-García, R.; Fernández-Luna, J.M.; Rodríguez-López, C.; Chillón, P. Data mining techniques to analyze the factors influencing active commuting to school. Int. J. Sustain. Transp. 2020, 14, 308–323. [Google Scholar] [CrossRef]
- Mandic, S.; Leon de la Barra, S.; García Bengoechea, E.; Stevens, E.; Flaherty, C.; Moore, A.; Middlemiss, M.; Williams, J.; Skidmore, P. Personal, social and environmental correlates of active transport to school among adolescents in Otago, New Zealand. J. Sci. Med. Sport 2015, 18, 432–437. [Google Scholar] [CrossRef] [PubMed]
- Panter, J.; Jones, A.P.; van Sluijs, E.M. Environmental determinants of active travel in youth: A review and framework for future research. Int. J. Behav. Nutr. Phys. Act. 2008, 5. [Google Scholar] [CrossRef] [PubMed]
- Pont, K.; Ziviani, J.; Wadley, D.; Bennett, S.; Abbott, R. Environmental correlates of children’s active transportation: A systematic literature review. Health Place 2009, 15, 849–862. [Google Scholar] [CrossRef] [PubMed]
- Rothman, L.; Macpherson, A.K.; Ross, T.; Buliung, R.N. The decline in active school transportation (AST): A systematic review of the factors related to AST and changes in school transport over time in North America. Prev. Med. 2018, 111, 314–322. [Google Scholar] [CrossRef] [PubMed]
- Smith, M.; Ikeda, E.; Hawley, G.; Mavoa, S.; Hosking, J.; Egli, V.; Zhao, J.; Mackay, L.; Donnellan, N.; Amann, R.; et al. An integrated conceptual model of environmental needs for New Zealand children’s active travel to school. J. Transp. Health 2020, 16, 100814. [Google Scholar] [CrossRef]
- Gropp, K.M.; Pickett, W.; Janssen, I. Multi-level examination of correlates of active transportation to school among youth living within 1 mile of their school. Int. J. Behav. Nutr. Phys. Act. 2012, 9, 124. [Google Scholar] [CrossRef]
- Banerjee, T.; Bahl, D. Walking to School: The Experience of Children in City Heights; USC Price School of Public Policy: San Diego, CA, USA, 2016. [Google Scholar]
- Rodríguez-López, C.; Salas-Fariña, Z.M.; Villa-González, E.; Borges-Cosic, M.; Herrador-Colmenero, M.; Medina-Casaubón, J.; Ortega, F.B.; Chillón, P. The threshold distance associated with walking from home to school. Health Educ. Behav. 2017, 44, 857–866. [Google Scholar] [CrossRef] [PubMed]
- Panter, J.; Corder, K.; Griffin, S.J.; Jones, A.P.; van Sluijs, E.M. Individual, socio-cultural and environmental predictors of uptake and maintenance of active commuting in children: Longitudinal results from the SPEEDY study. Int. J. Behav. Nutr. Phys. Act. 2013, 10, 83. [Google Scholar] [CrossRef] [PubMed]
- National Center for Safe Routes to School. Data Collection System Parent Survey about Walking and Biking to School. 2008. Available online: http://www.saferoutesdata.org/downloads/Parent_Survey_English.pdf (accessed on 2 July 2020).
- Hurvitz, P.M.; Moudon, A.V.; Kang, B.; Saelens, B.E.; Duncan, G.E. Emerging technologies for assessing physical activity behaviors in space and time. Front. Public Health 2014, 2. [Google Scholar] [CrossRef]
- Arizona Department of Education Health & Nutrition Services. Free and Reduced Report, School Year 2018–2019; Arizona Department of Health Services: Phoenix, AZ, USA, 2018.
- National Center for Safe Routes to School. Trends in Walking and Bicycling to School from 2007 to 2014; U.S. Department of Transportation: Washington, DC, USA, 2016.
- Geverdt, D. Education Demographic and Geographic Estimates Program (EDGE): Locale Boundaries; User’s Manual; U.S. Department of Education, National Center for Education Statistics: Washington, DC, USA, 2015.
- Raudenbush, S.W.; Bryk, A.S. Hierarchical Linear Models: Applications and Data Analysis Methods; SAGE Publications: New York, NY, USA, 2002; Volume 1, ISBN 0-7619-1904-X. [Google Scholar]
- Muthén, L.K.; Muthén, B.O. Chapter 9 Examples: Mulitlevel Modeling with Complex Survey Data. In Mplus User’s Guide; Muthén & Muthén: Los Angeles, CA, USA, 2017; pp. 261–393. [Google Scholar]
- Larsen, K.; Gilliland, J.; Hess, P. The Influence of the Physical Environment and Sociodemographic Characteristics on Children’s Mode of Travel to and From School. Am. J. Public Health 2009, 99, 520. [Google Scholar] [CrossRef] [PubMed]
- Panter, J.; Jones, A.P.; Van Sluijs, E.M.F.; Griffin, S.J. Neighborhood, route, and school environments and children’s active commuting. Am. J. Prev. Med. 2010, 38, 268–278. [Google Scholar] [CrossRef]
- Lin, J.-J.; Chang, H.-T. Built Environment Effects on Children’s School Travel in Taipai: Independence and Travel Mode. Urban Stud. 2009, 47, 867–889. [Google Scholar] [CrossRef]
- Evers, C.; Boles, S.; Johnson-Shelton, D.; Schlossberg, M.; Richey, D. Parent safety perceptions of child walking routes. J. Transp. Health 2014, 1, 108–115. [Google Scholar] [CrossRef]
- Webb Jamme, H.-T.; Bahl, D.; Banerjee, T. Between “broken windows” and the “eyes on the street:” Walking to school in inner city San Diego. J. Environ. Psychol. 2018, 55, 121–138. [Google Scholar] [CrossRef]
- Jago, R.; Baranowski, T.; Baranowski, J.C.; Cullen, K.W.; Thompson, D. Distance to food stores & adolescent male fruit and vegetable consumption: Mediation effects. Int. J. Behav. Nutr. Phys. Act. 2007, 4, 35. [Google Scholar]
- Gorski Findling, M.T.; Wolfson, J.A.; Rimm, E.B.; Bleich, S.N. Differences in the Neighborhood Retail Food Environment and Obesity Among US Children and Adolescents by SNAP Participation: Neighborhood Food Environment and Childhood Obesity. Obesity 2018, 26, 1063–1071. [Google Scholar] [CrossRef]
- Morland, K.; Roux, A.V.D.; Wing, S. Supermarkets, other food stores, and obesity: The atherosclerosis risk in communities study. Am. J. Prev. Med. 2006, 30, 333–339. [Google Scholar] [CrossRef]
- Williams, J.; Scarborough, P.; Matthews, A.; Cowburn, G.; Foster, C.; Roberts, N.; Rayner, M. A systematic review of the influence of the retail food environment around schools on obesity-related outcomes: Retailing around schools. Obes. Rev. 2014, 15, 359–374. [Google Scholar] [CrossRef] [PubMed]
- Ward Thompson, C. What Makes the Difference between Some People Going Outside and Others not. In Open Space: People Space; Ward Thompson, C., Travlou, P., Eds.; Taylor and Francis: London, UK, 2007. [Google Scholar]
- Sun, Z.; Lai, K.Y.; Bell, S.; Scott, I.; Zhang, X. Exploring the Associations of Walking Behavior with Neighborhood Environments by Different Life Stages: A Cross-Sectional Study in a Smaller Chinese City. Int. J. Environ. Res. Public Health 2019, 17, 237. [Google Scholar] [CrossRef]
- Fulton, J.E.; Shisler, J.L.; Yore, M.M.; Caspersen, C.J. Research Quarterly for Exercise and Sport Active Transportation to School Findings from a National Survey. Taylor Francis 2013, 76, 352–357. [Google Scholar] [CrossRef]
- Yang, Y.; Diez-Roux, A.V. Using an agent-based model to simulate children’s active travel to school. Int. J. Behav. Nutr. Phys. Act. 2013, 10, 67. [Google Scholar] [CrossRef] [PubMed]
- Brookshire, K.; LaJeunesse, S.; Pullen-Seufert, N. Who Walking or Biking to School: Patterns from the 2017 National Household Travel Survey and Future Directions; Pedestrian and Bicycle Information Center: Chapel Hill, NC, USA, 2019. [Google Scholar]
- Safe Routes to School National Partnership. School Siting: Location Affects the Potential to Walk or Bike. Available online: https://www.saferoutespartnership.org/state/bestpractices/schoolsiting (accessed on 24 February 2020).
- Hopkins, D.; Mandic, S. Perceptions of cycling among high school students and their parents. Int. J. Sustain. Transp. 2017, 11, 342–356. [Google Scholar] [CrossRef]
- Hopkins, D. Can environmental awareness explain declining preference for car-based mobility amongst generation Y? A qualitative examination of learn to drive behaviours. Transp. Res. Part A: Policy Pract. 2016, 94, 149–163. [Google Scholar] [CrossRef]
- Sallis, J.; Owen, N.; Fisher, E.B. Ecological models of health behavior. In Health Behavior and Health Education: Theory, Research, and Practice; Glanz, K., Rimer, B.K., Viswanath, K., Eds.; Jossey-Bass: San Francisco, CA, USA, 2008; pp. 465–485. ISBN 978-0-7879-9614-7. [Google Scholar]
- Larouche, R.; Mammen, G.; Rowe, D.A.; Faulkner, G. Effectiveness of active school transport interventions: A systematic review and update. BMC Public Health 2018, 18. [Google Scholar] [CrossRef]
- Chillón, P.; Evenson, K.R.; Vaughn, A.; Ward, D. A systematic review of interventions for promoting active transportation to school. Int. J. Behav. Nutr. Phys. Act. 2011, 8, 10. [Google Scholar] [CrossRef]


| Variable | All Distances | <¼ Mile (n = 594; 45.43% of All AST) | ¼–½ Mile (n = 618; 35.35% of All AST) | ½–1 Mile (n = 1549; 14.26% of All AST) | ≥1 Miles (n = 983; 4.96% of All AST) | Correlation with AST a |
|---|---|---|---|---|---|---|
| Gender | 0.037 | |||||
| Boy | 46.30% | 45.70% | 50.70% | 49.70% | 43.90% | |
| Girl | 53.70% | 54.30% | 49.30% | 50.30% | 56.10% | |
| Grade | −0.050 * | |||||
| 3 | 25.80% | 28.20% | 23.60% | 27.20% | 24.50% | |
| 4 | 26.50% | 27.10% | 29.30% | 28.00% | 25.00% | |
| 5 | 22.70% | 26.30% | 25.10% | 22.90% | 18.20% | |
| 6 | 11.60% | 13.30% | 12.60% | 11.10% | 10.50% | |
| 7 | 9.20% | 3.70% | 4.90% | 8.00% | 15.20% | |
| 8 | 4.20% | 1.40% | 4.40% | 2.80% | 6.70% | |
| Parent Education | 19.727 ** | |||||
| Some HS or less | 18.97% | 20.20% | 21.30% | 18.70% | 12.30% | |
| HS graduate | 17.94% | 19.70% | 17.90% | 16.50% | 16.30% | |
| Some college 1 | 31.72% | 35.00% | 29.50% | 30.40% | 33.60% | |
| College graduate | 31.37% | 25.10% | 31.10% | 34.40% | 37.80% | |
| Income | 44.832 ** | |||||
| Low | 34.10% | 42.40% | 36.20% | 32.00% | 23.40% | |
| Medium | 14.80% | 10.40% | 14.30% | 12.30% | 18.30% | |
| High | 51.20% | 47.20% | 49.50% | 55.70% | 58.30% | |
| Locale | 7.120 | |||||
| City | 49.05% | 51.50% | 43.10% | 42.50% | 48.20% | |
| Suburb | 48.95% | 47.80% | 54.40% | 56.10% | 48.70% | |
| Other | 2.00% | 0.07% | 2.50% | 1.40% | 3.20% | |
| Mode of arrival | ||||||
| Walk or bike | 27.20% | 59.10% | 44.20% | 23.30% | 3.90% |
| Environmental Variable | B | S.E. | Est./S.E. | OR | 95% CI | 95% CI |
|---|---|---|---|---|---|---|
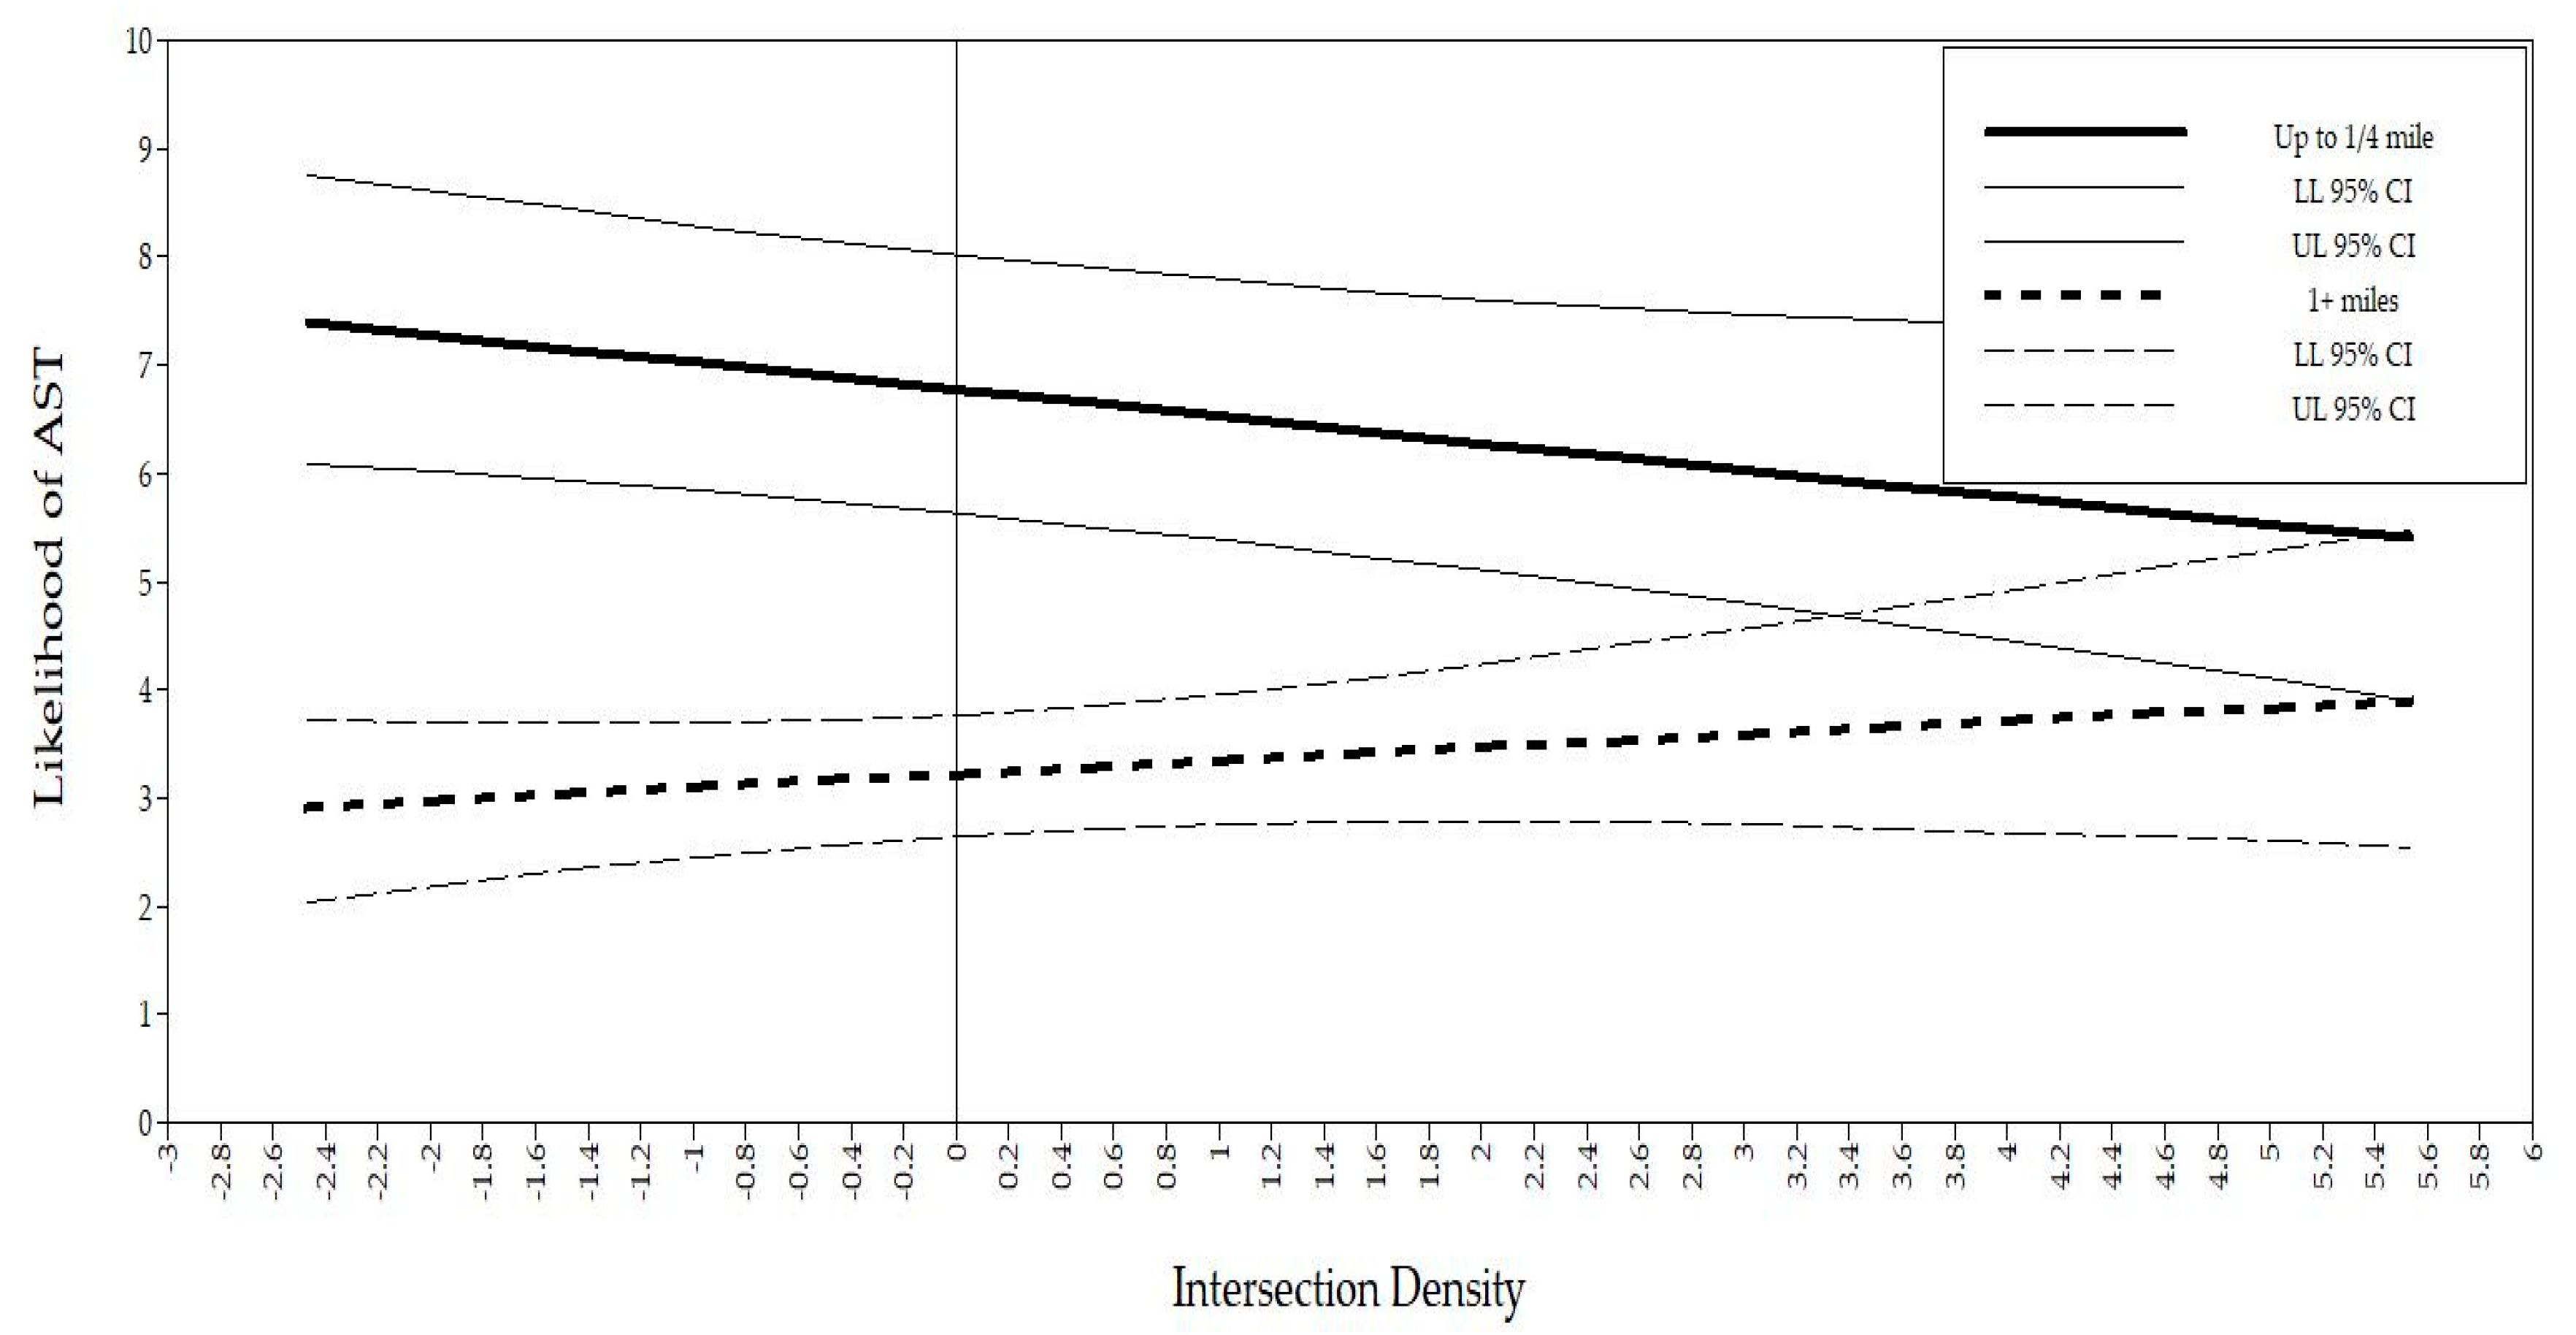
| Intersection Density | 0.122 | 0.126 | 0.971 | 1.130 | 0.935 | 1.399 |
| Up to ¼ mile | 3.555 | 0.344 | 10.324 | 34.988 | 20.615 | 63.561 |
| ¼ up to ½ mile | 2.962 | 0.314 | 9.423 | 19.337 | 12.158 | 33.920 |
| Up to 1 mile | 2.020 | 0.256 | 7.884 | 7.538 | 4.840 | 11.212 |
| Intersection Density × Up to ¼ mile * | −0.371 | 0.190 | −1.952 | 0.690 | 0.504 | 0.941 |
| Intersection Density × ¼ up to ½ mile * | −0.209 | 0.146 | −1.430 | 0.811 | 0.623 | 1.002 |
| Intersection Density × ½ up to 1 mile * | −0.201 | 0.169 | −1.193 | 0.818 | 0.594 | 1.030 |
| Residential Density | 0.255 | 0.166 | 1.356 | 1.290 | 0.914 | 1.539 |
| Up to ¼ mile | 3.553 | 0.341 | 10.423 | 34.918 | 20.573 | 62.178 |
| ¼ up to ½ mile | 2.935 | 0.289 | 10.226 | 18.822 | 12.441 | 31.881 |
| Up to 1 mile | 2.007 | 0.255 | 7.874 | 7.441 | 4.816 | 11.101 |
| Residential Density × Up to ¼ mile * | −0.165 | 0.238 | −0.695 | 0.848 | 0.582 | 1.251 |
| Residential Density × ¼ up to ½ mile * | −0.343 | 0.188 | −1.821 | 0.710 | 0.528 | 0.974 |
| Residential Density × ½ up to 1 mile * | −0.012 | 0.245 | −0.047 | 0.988 | 0.587 | 1.306 |
| Transit Density | 0.131 | 0.364 | 0.360 | 1.140 | 0.922 | 2.818 |
| Up to ¼ mile | 3.590 | 0.344 | 10.447 | 36.234 | 20.369 | 61.930 |
| ¼ up to ½ mile | 2.982 | 0.298 | 10.010 | 19.727 | 12.049 | 31.753 |
| Up to 1 mile | 2.034 | 0.246 | 8.281 | 7.645 | 4.938 | 10.924 |
| Transit Density × Up to ¼ mile * | −0.175 | 0.535 | −0.327 | 0.839 | 0.230 | 1.191 |
| Transit Density × ¼ up to ½ mile * | −0.146 | 0.499 | −0.292 | 0.864 | 0.258 | 1.130 |
| Transit Density × ½ up to 1 mile * | −0.285 | 0.436 | −0.654 | 0.752 | 0.267 | 1.108 |
| Entertainment Land Use | 0.289 | 1.608 | 0.180 | 1.335 | 0.861 | 1.972 |
| Up to ¼ mile | 3.569 | 0.521 | 6.850 | 18.672 | 20.512 | 64.715 |
| ¼ up to ½ mile | 2.961 | 0.495 | 5.981 | 19.317 | 11.989 | 33.082 |
| Up to 1 mile | 2.023 | 0.582 | 3.474 | 7.561 | 4.702 | 11.496 |
| Entertainment Land Use × Up to ¼ mile * | −0.233 | 1.650 | −0.141 | 0.792 | 0.422 | 1.226 |
| Entertainment Land Use × ¼ up to ½ mile * | −0.279 | 1.678 | −0.166 | 0.757 | 0.464 | 1.165 |
| Entertainment Land Use × ½ up to 1 mile * | −0.271 | 2.226 | −0.122 | 0.763 | 0.389 | 1.267 |
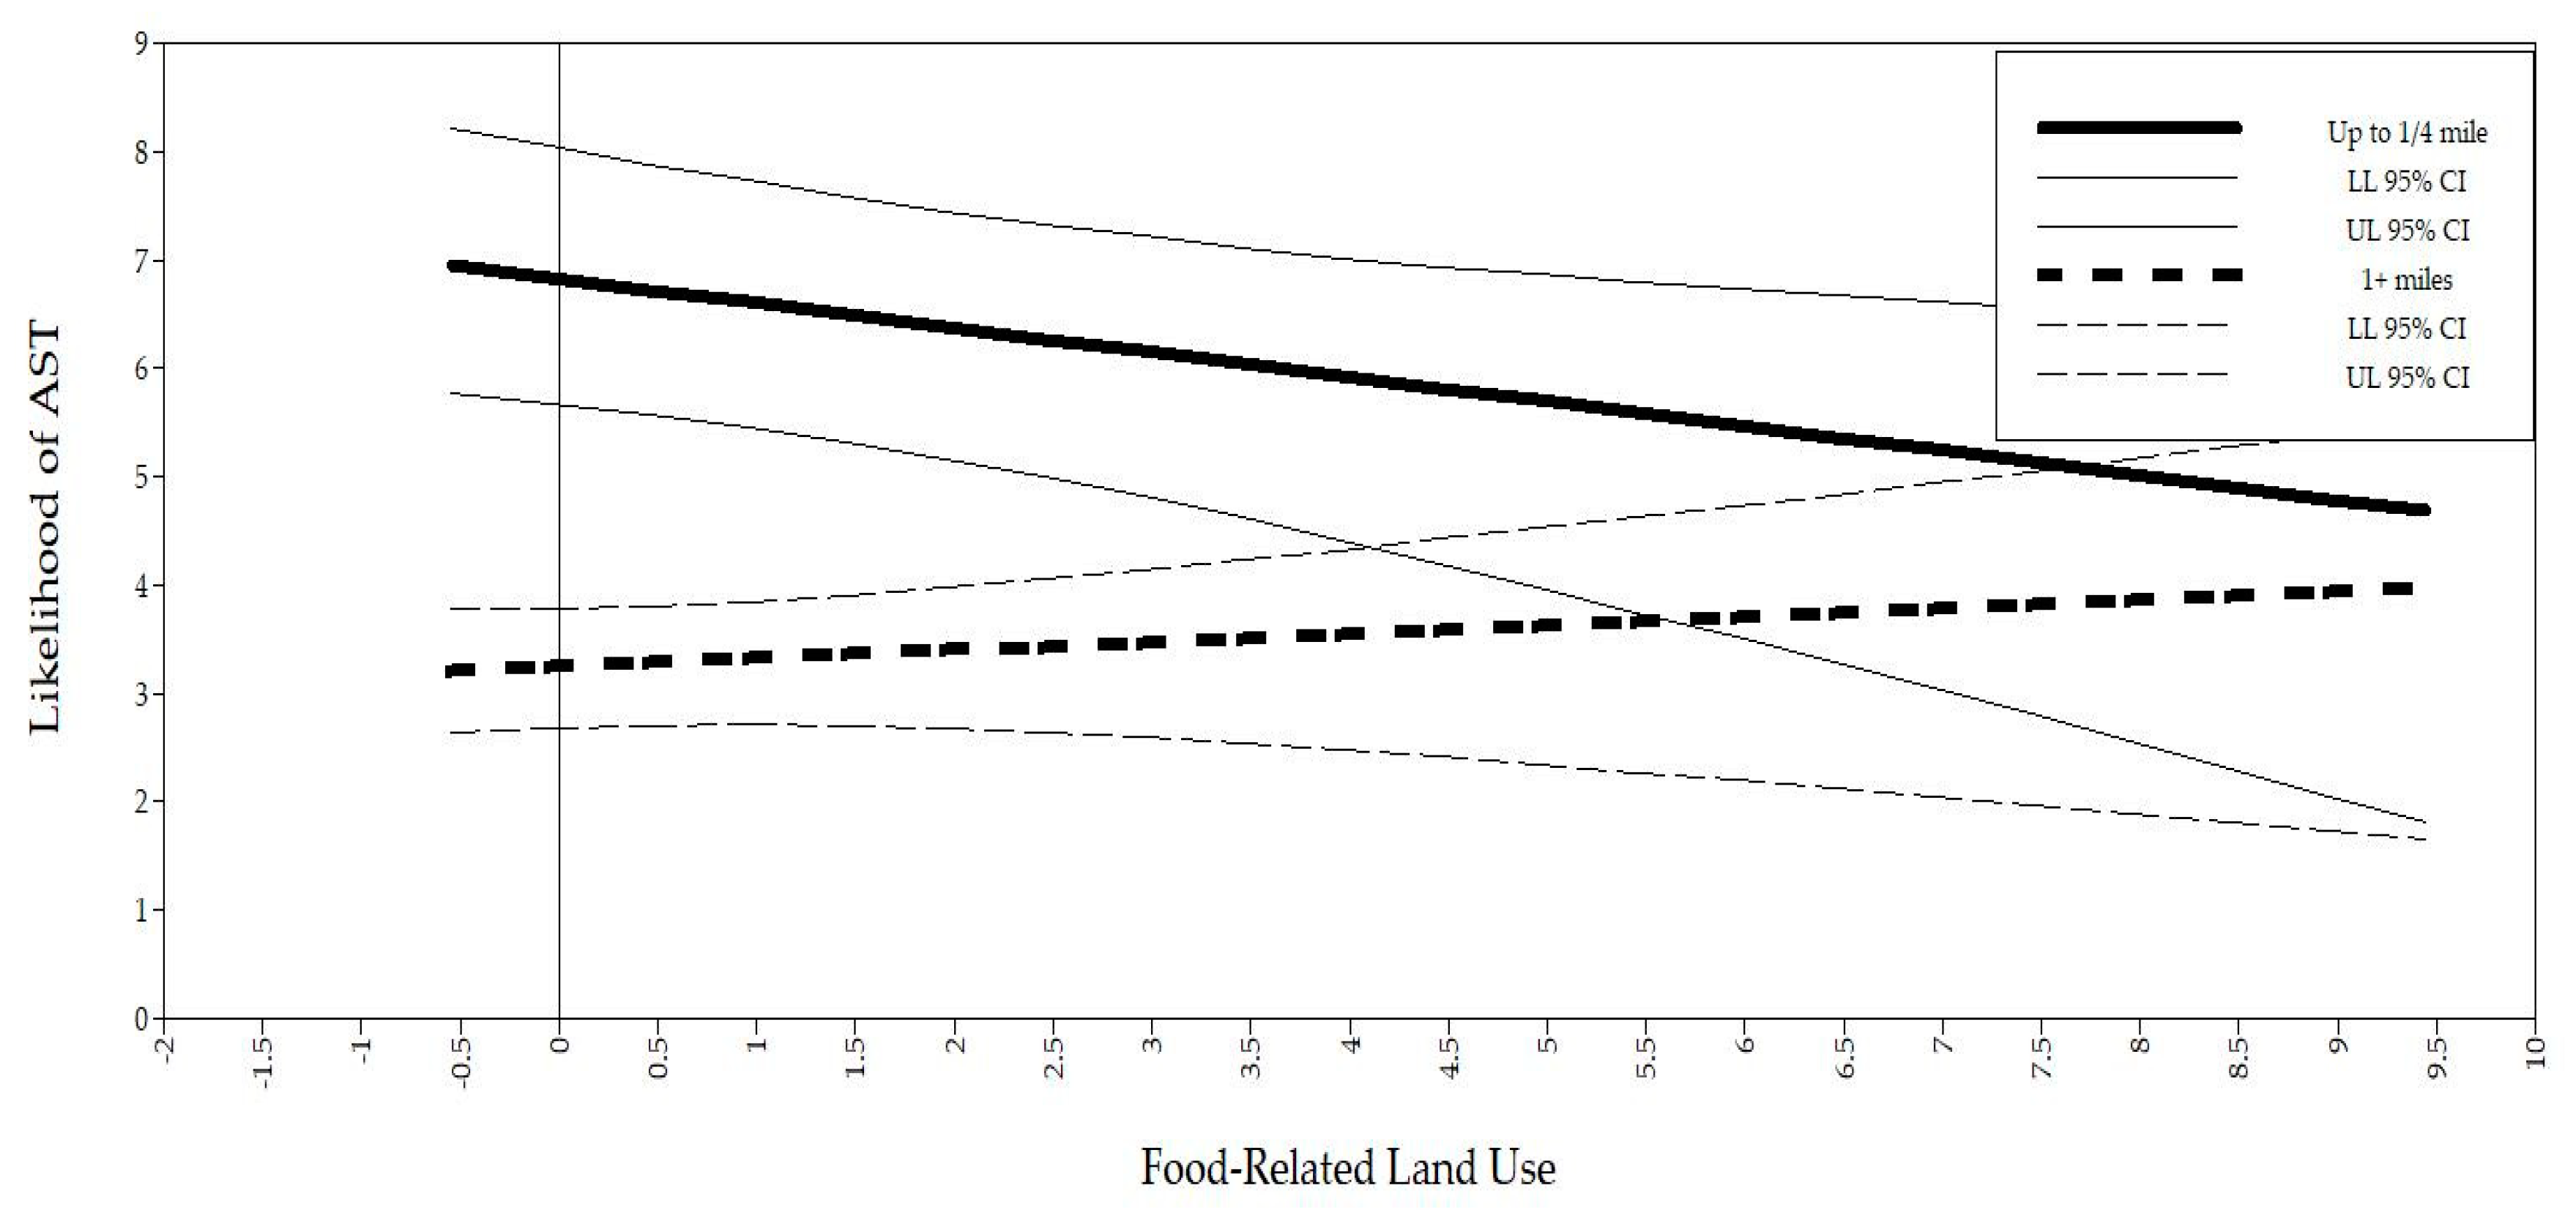
| Food Land Use | 0.077 | 0.416 | 0.184 | 1.080 | 0.910 | 1.221 |
| Up to ¼ mile | 3.579 | 0.408 | 8.767 | 19.144 | 20.739 | 63.118 |
| ¼ up to ½ mile | 2.986 | 0.380 | 7.855 | 0.722 | 12.207 | 33.920 |
| Up to 1 mile | 2.063 | 0.342 | 6.033 | 0.406 | 4.978 | 11.763 |
| Food Land Use × Up to ¼ mile * | −0.304 | 0.432 | −0.703 | 0.563 | 0.562 | 0.925 |
| Food Land Use × ¼ up to ½ mile * | −0.247 | 0.447 | −0.554 | 0.780 | 0.575 | 1.096 |
| Food Land Use × ½ up to 1 mile * | −0.221 | 0.446 | −0.496 | 0.802 | 0.592 | 1.062 |
Publisher’s Note: MDPI stays neutral with regard to jurisdictional claims in published maps and institutional affiliations. |
© 2020 by the authors. Licensee MDPI, Basel, Switzerland. This article is an open access article distributed under the terms and conditions of the Creative Commons Attribution (CC BY) license (http://creativecommons.org/licenses/by/4.0/).
Share and Cite
Ross, A.; Godwyll, J.; Adams, M. The Moderating Effect of Distance on Features of the Built Environment and Active School Transport. Int. J. Environ. Res. Public Health 2020, 17, 7856. https://doi.org/10.3390/ijerph17217856
Ross A, Godwyll J, Adams M. The Moderating Effect of Distance on Features of the Built Environment and Active School Transport. International Journal of Environmental Research and Public Health. 2020; 17(21):7856. https://doi.org/10.3390/ijerph17217856
Chicago/Turabian StyleRoss, Allison, Josephine Godwyll, and Marc Adams. 2020. "The Moderating Effect of Distance on Features of the Built Environment and Active School Transport" International Journal of Environmental Research and Public Health 17, no. 21: 7856. https://doi.org/10.3390/ijerph17217856
APA StyleRoss, A., Godwyll, J., & Adams, M. (2020). The Moderating Effect of Distance on Features of the Built Environment and Active School Transport. International Journal of Environmental Research and Public Health, 17(21), 7856. https://doi.org/10.3390/ijerph17217856