Soil Phosphorus Pools, Bioavailability and Environmental Risk in Response to the Phosphorus Supply in the Red Soil of Southern China


Abstract
1. Introduction
2. Materials and Methods
2.1. Study Area
2.2. Field Experiment Designs and Soil Samplings
2.3. Soil and Plant Chemical Analyses
2.4. Incubation Experiment
2.5. Statistical Analysis
3. Results
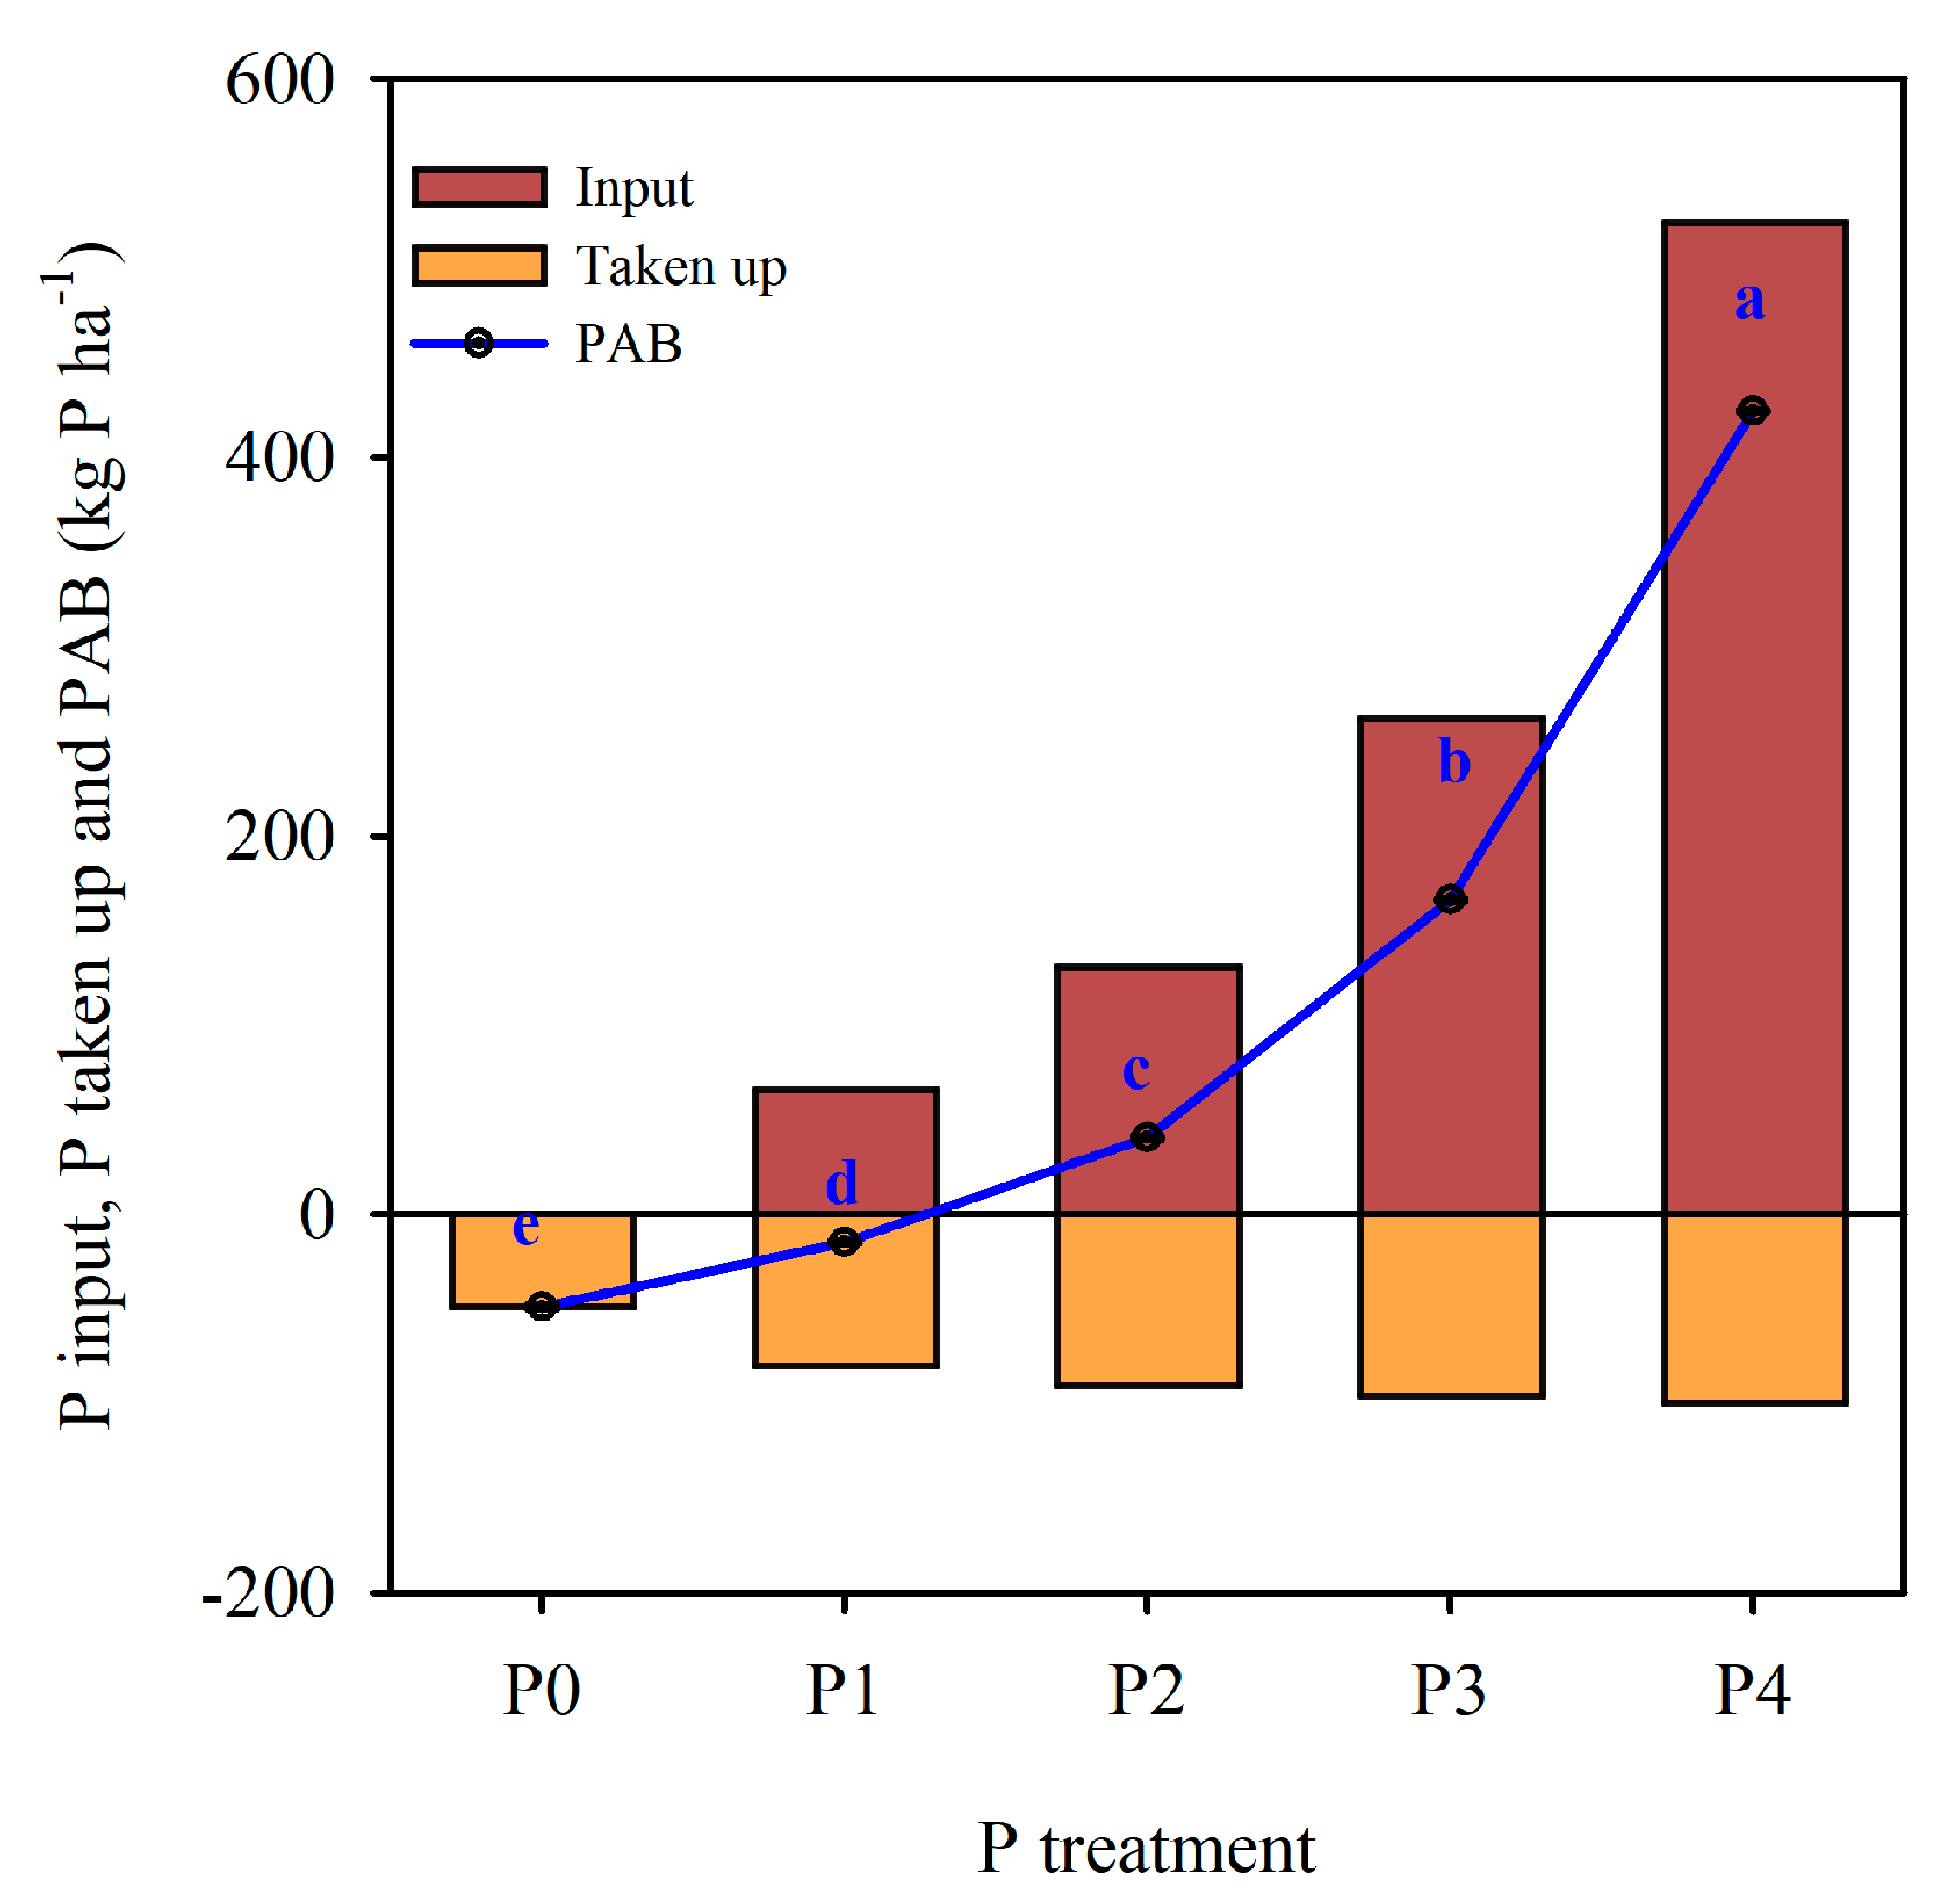
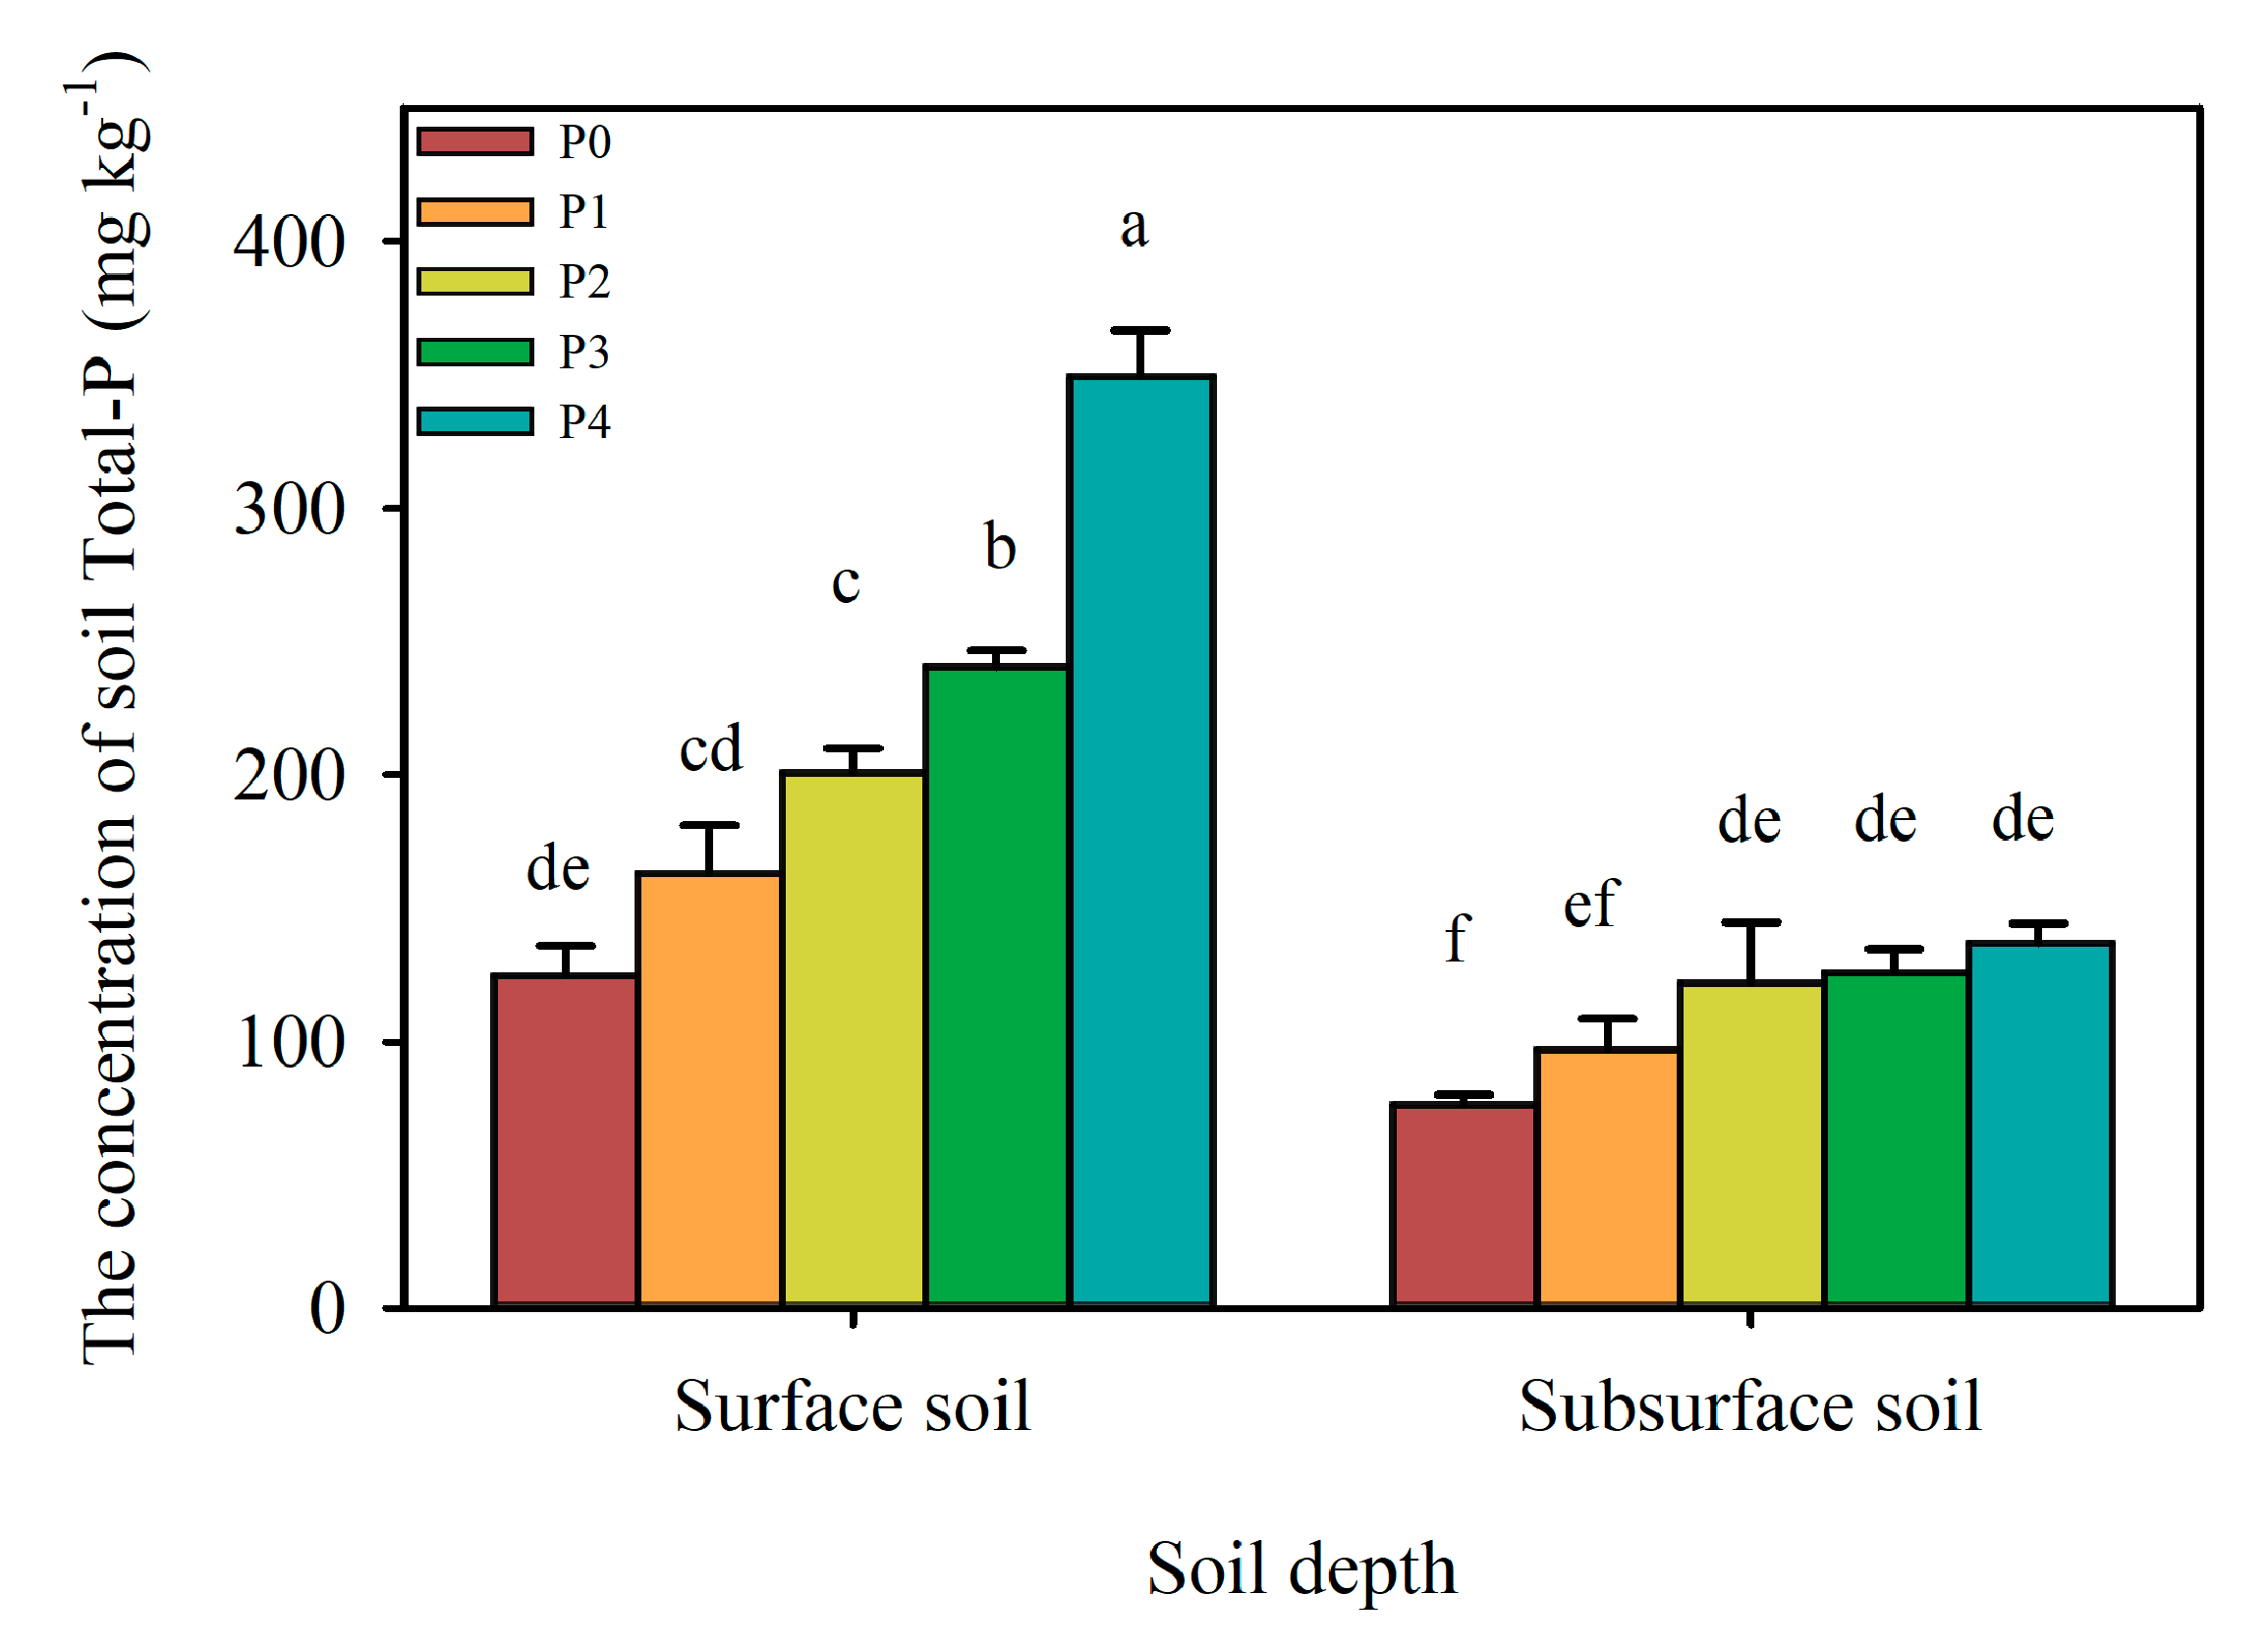
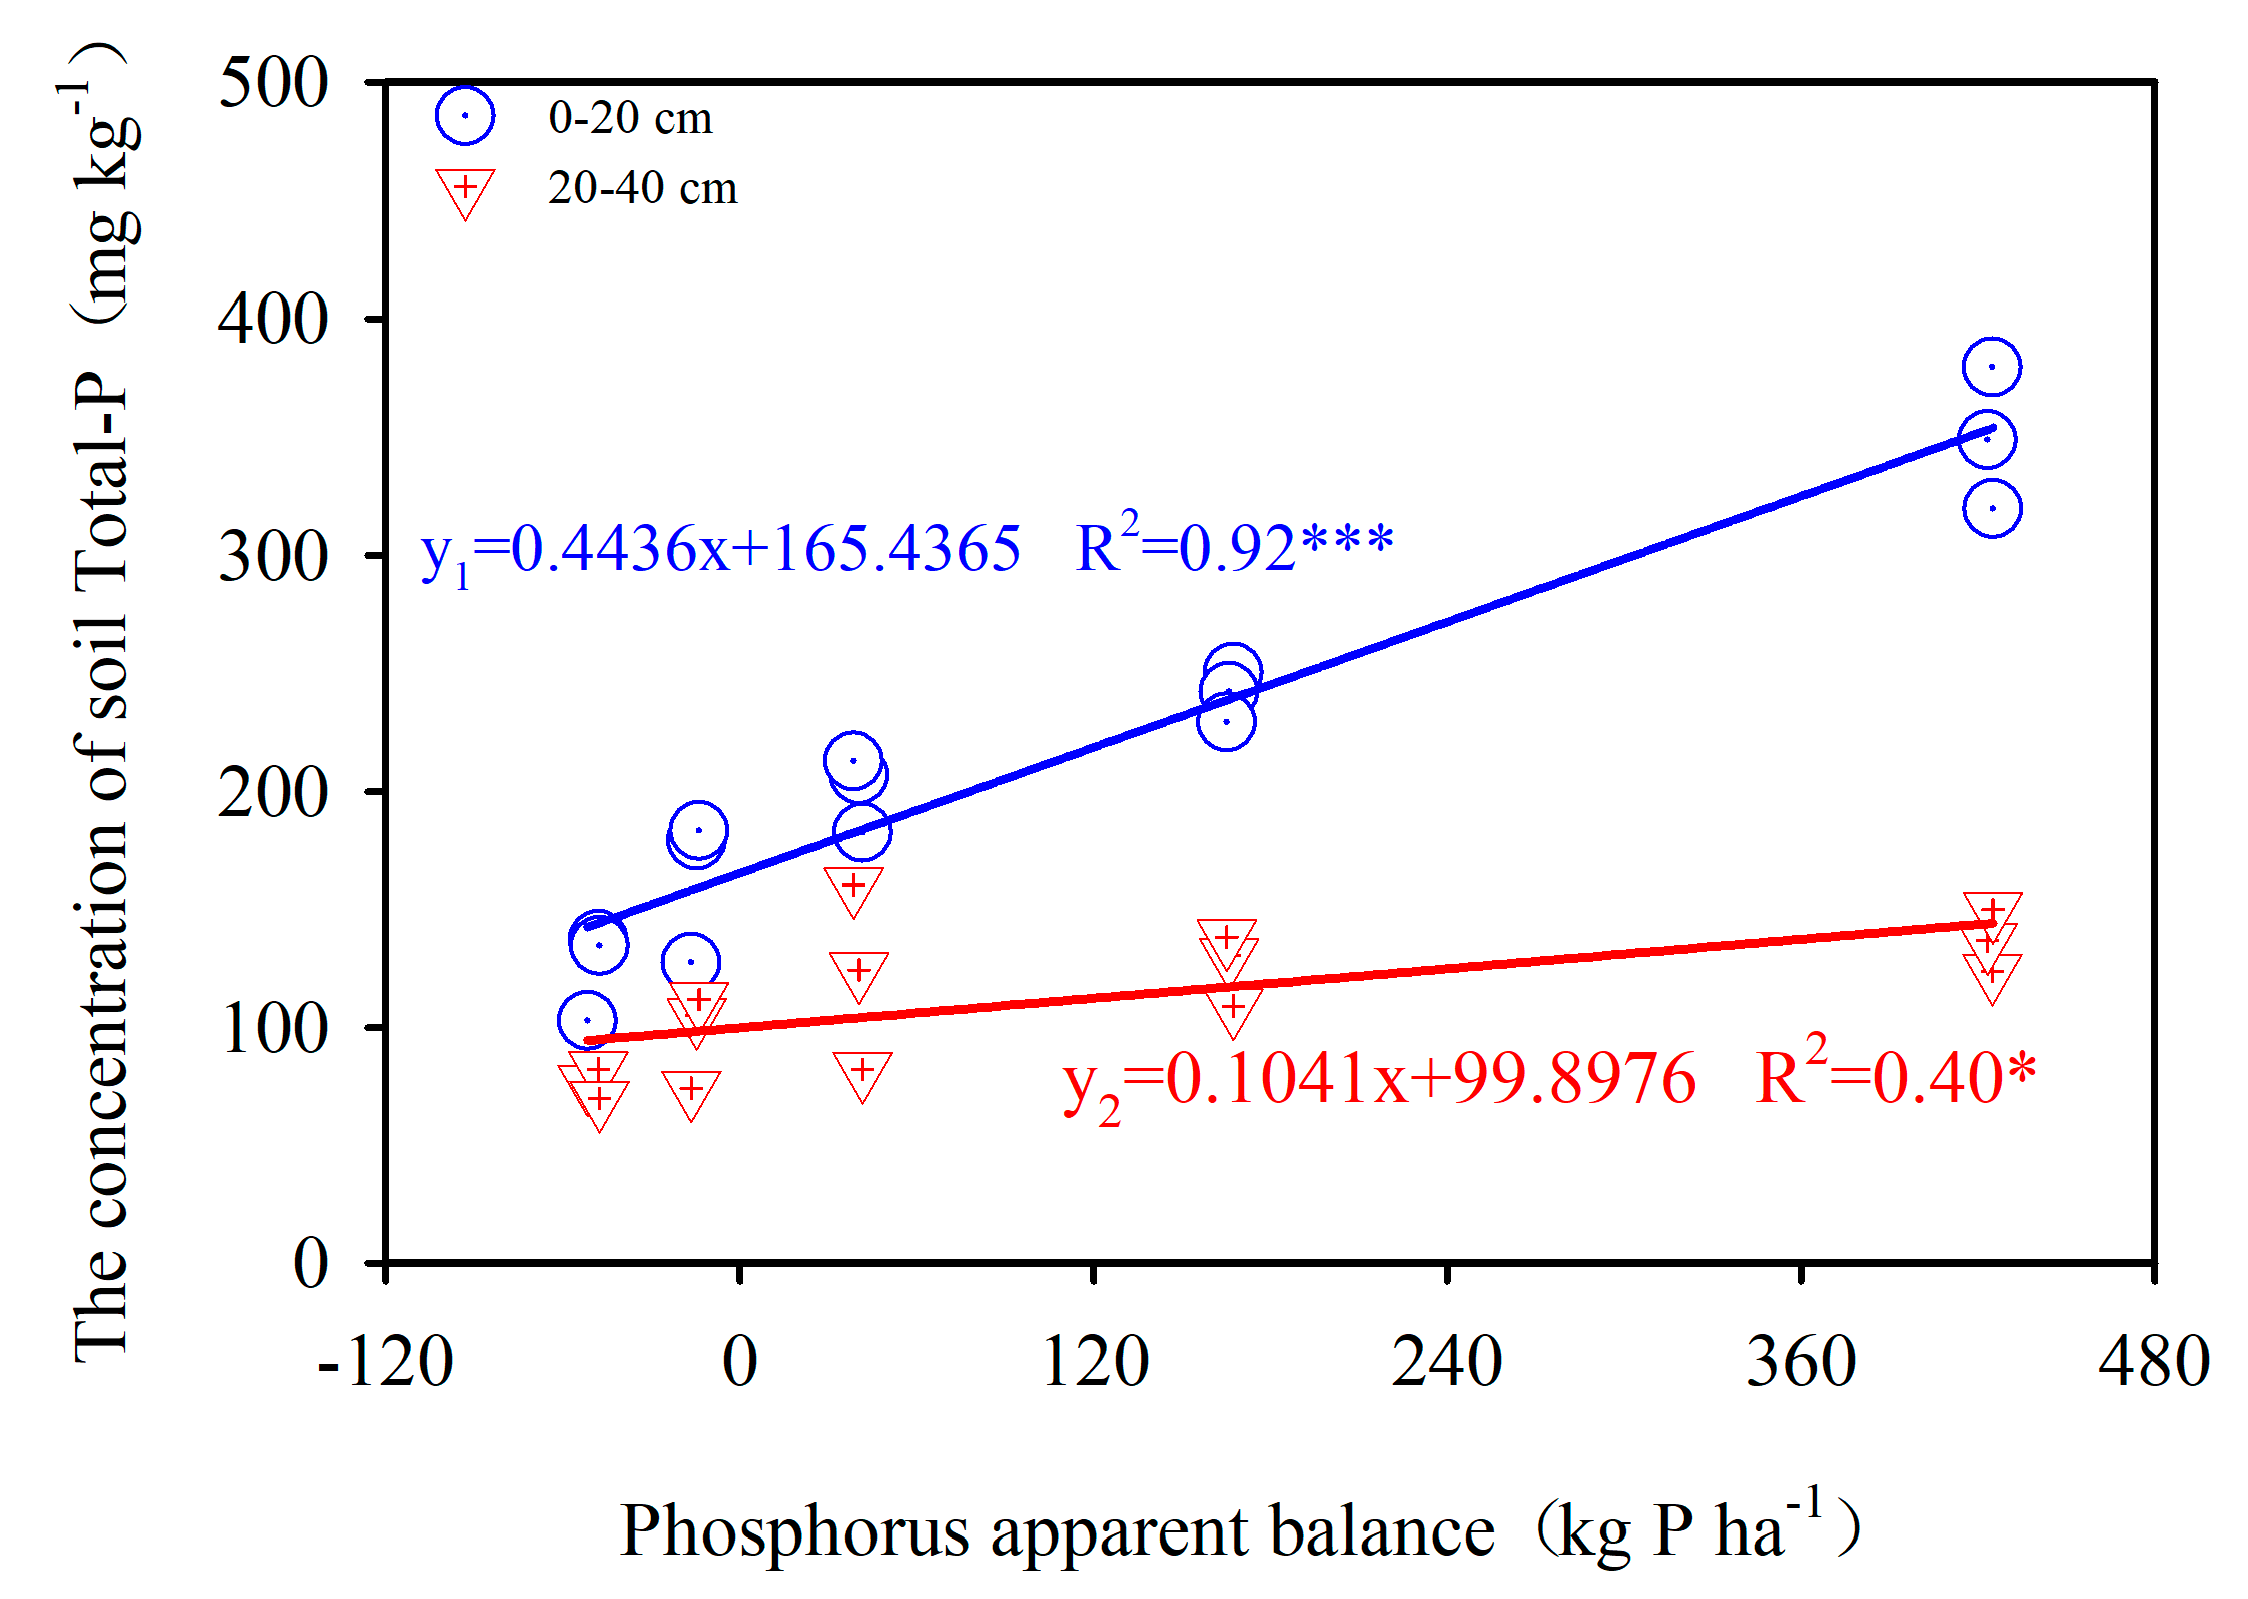
3.1. Phosphorus Apparent Balance with Total P
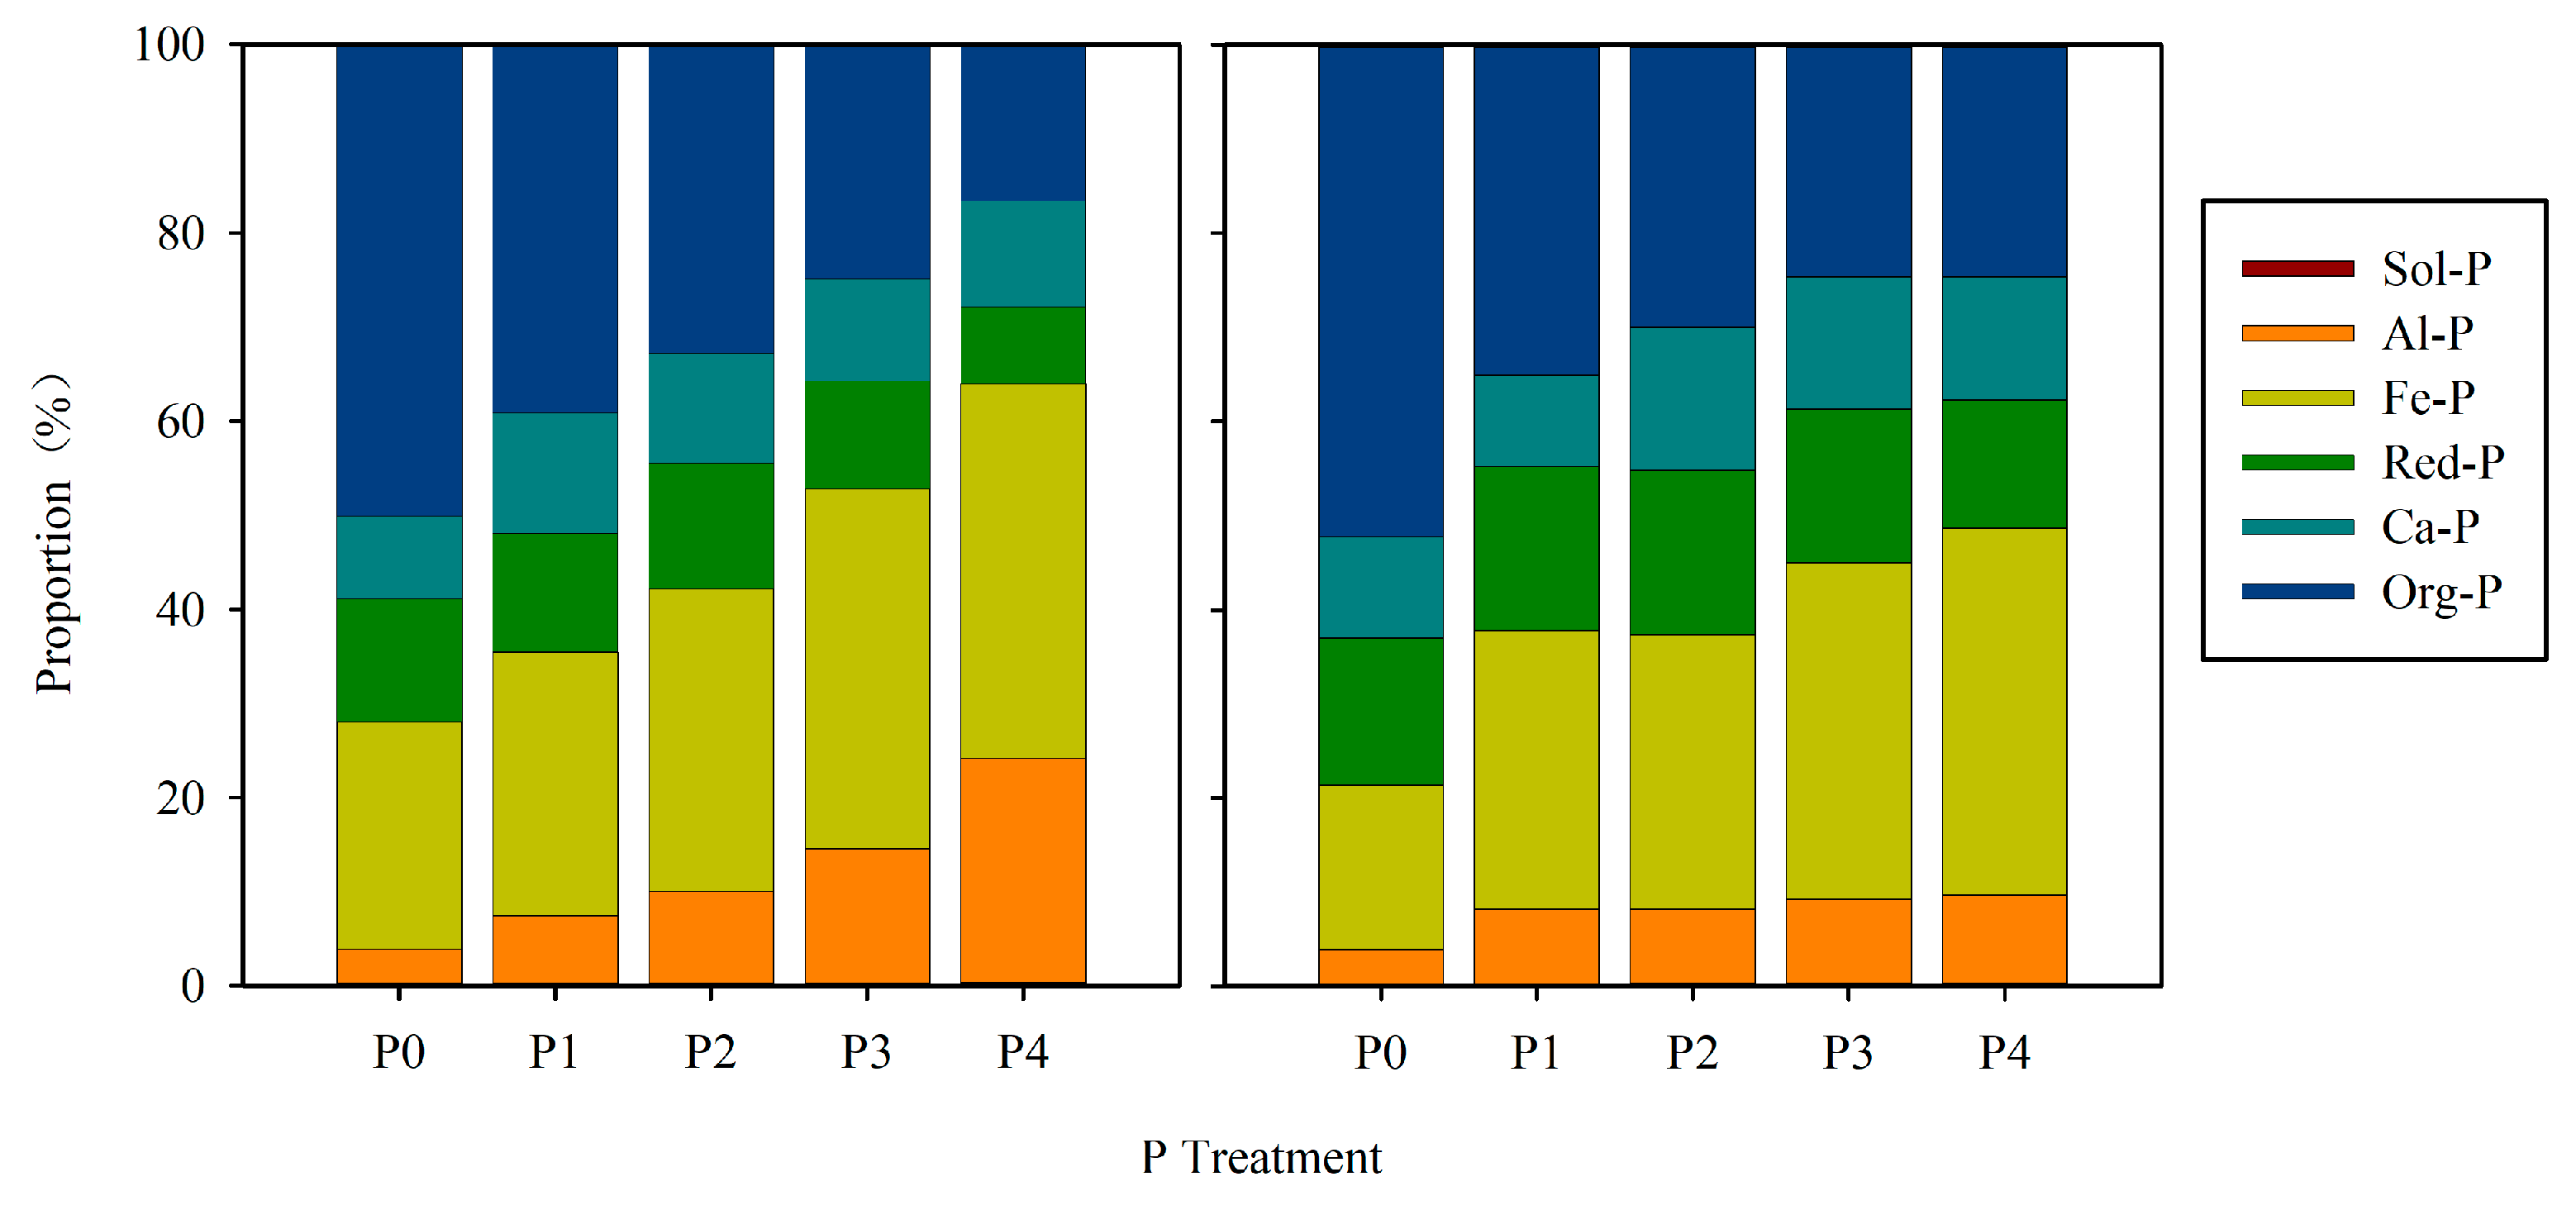
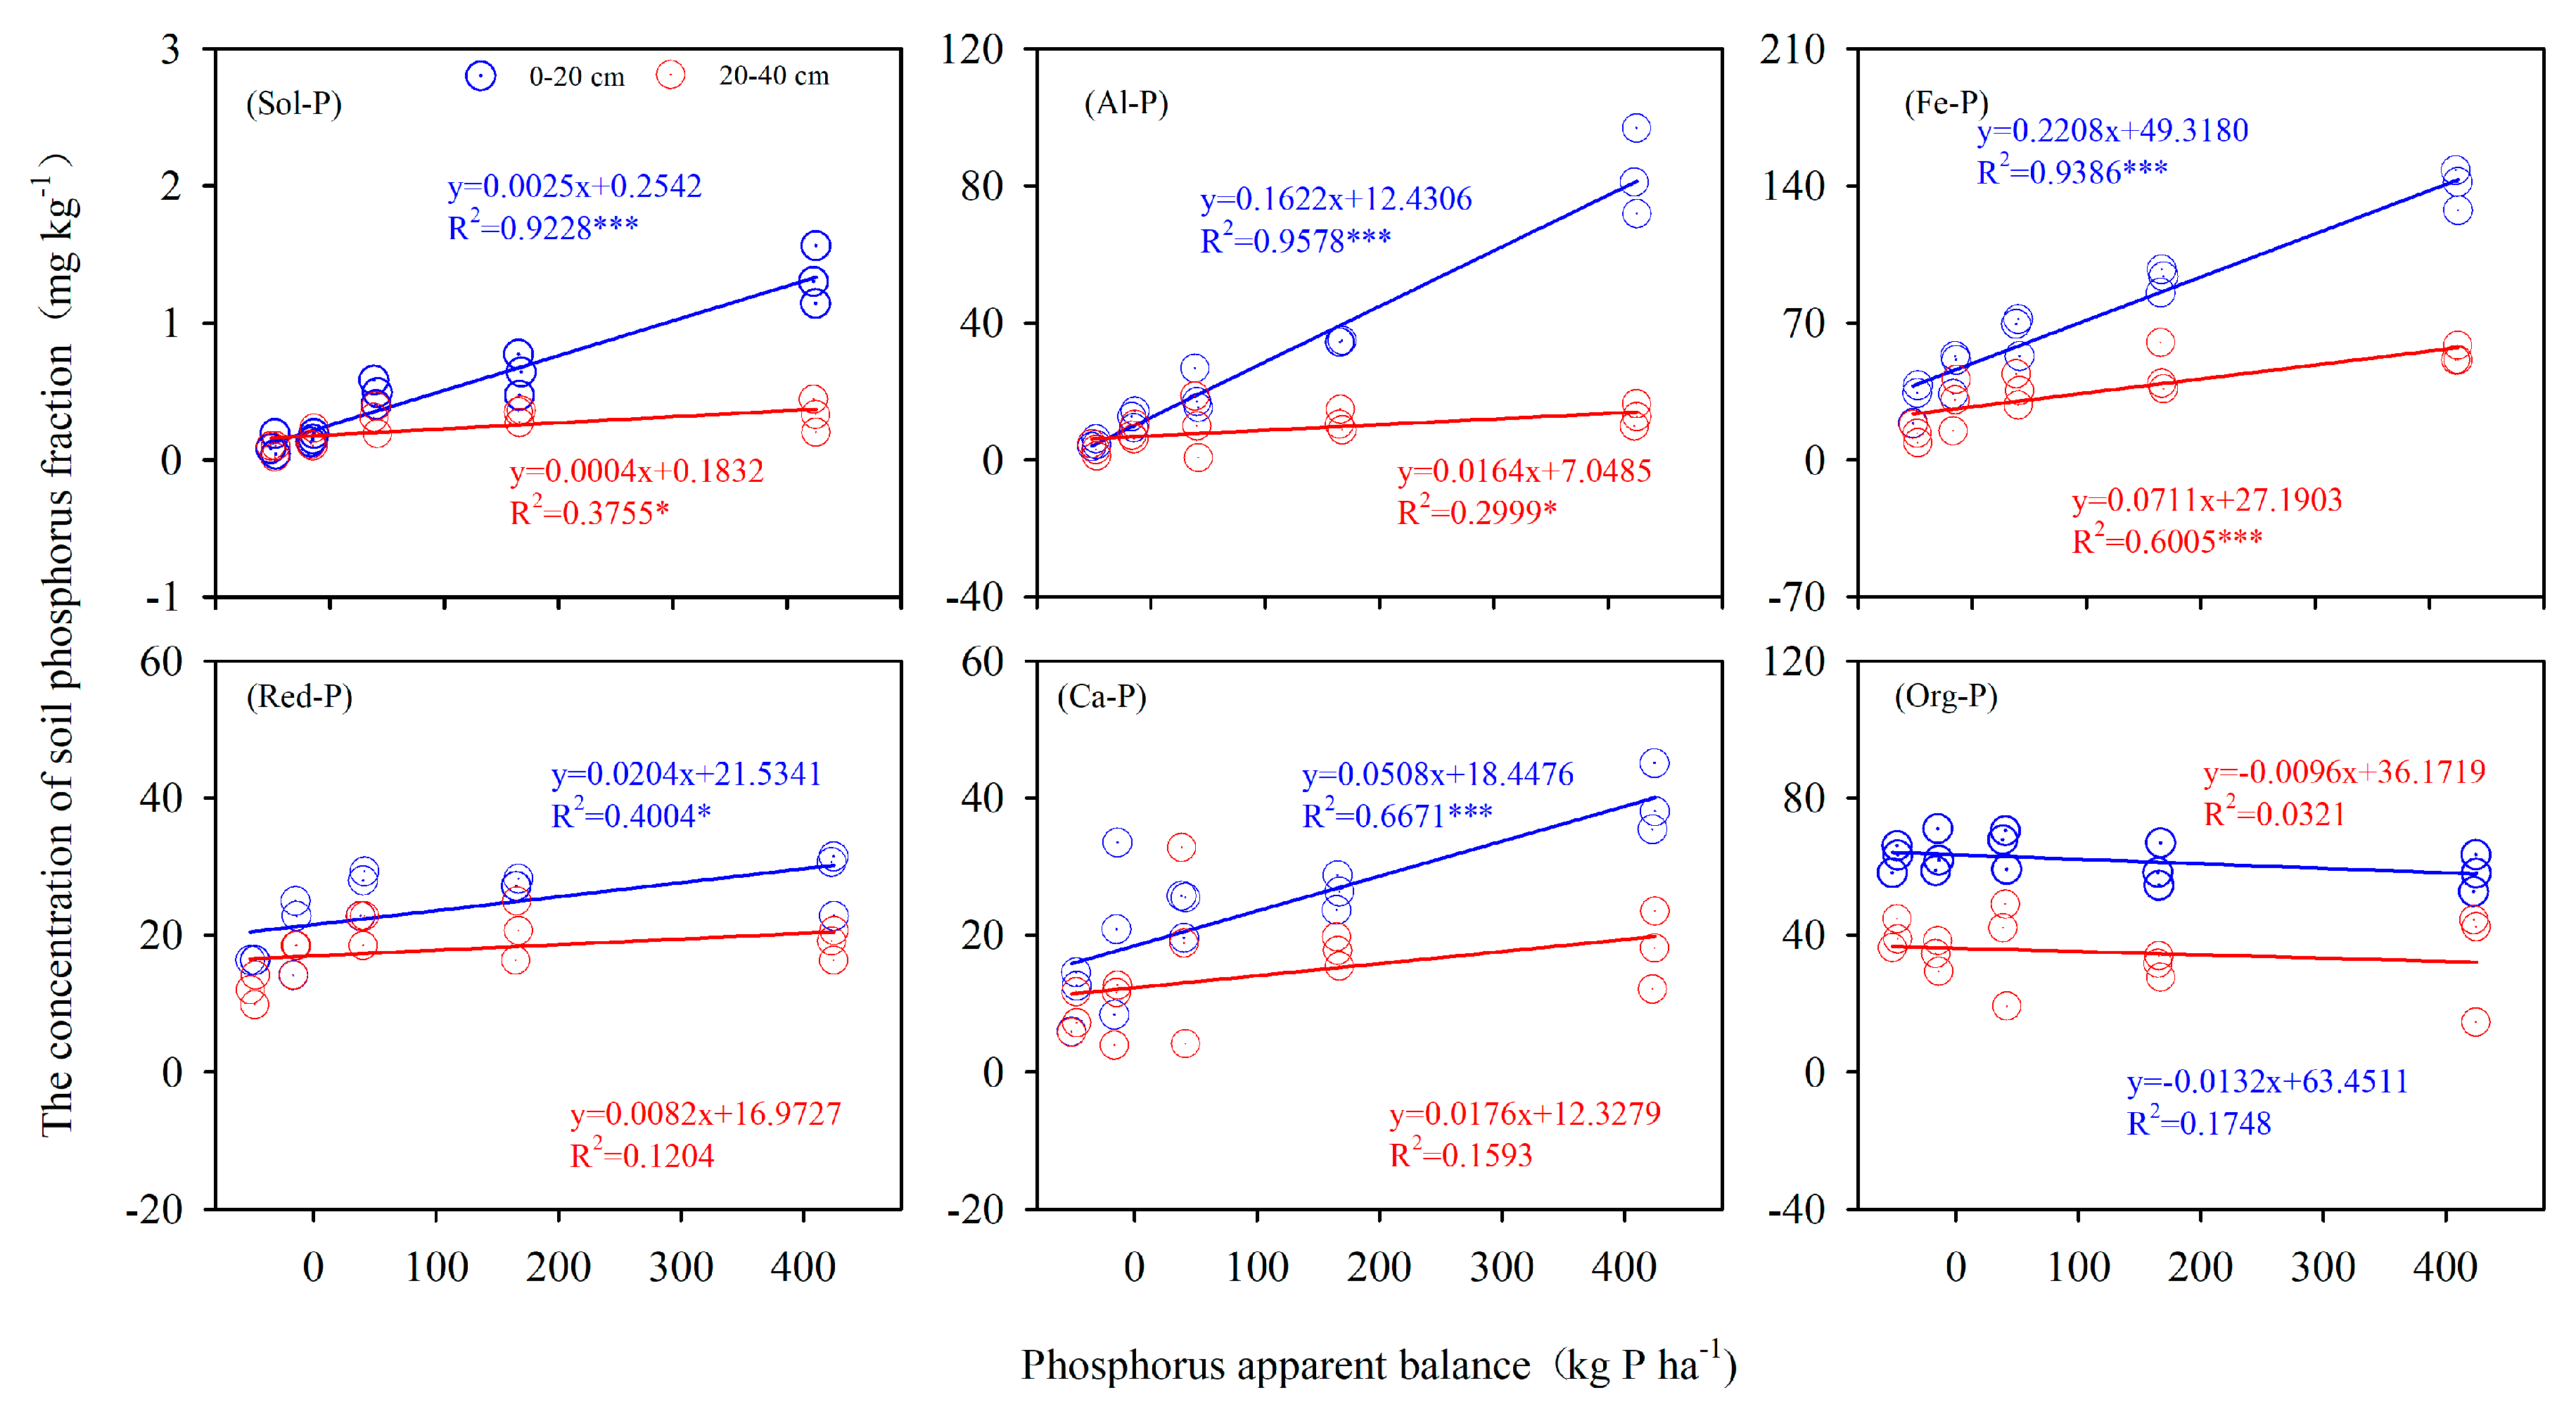
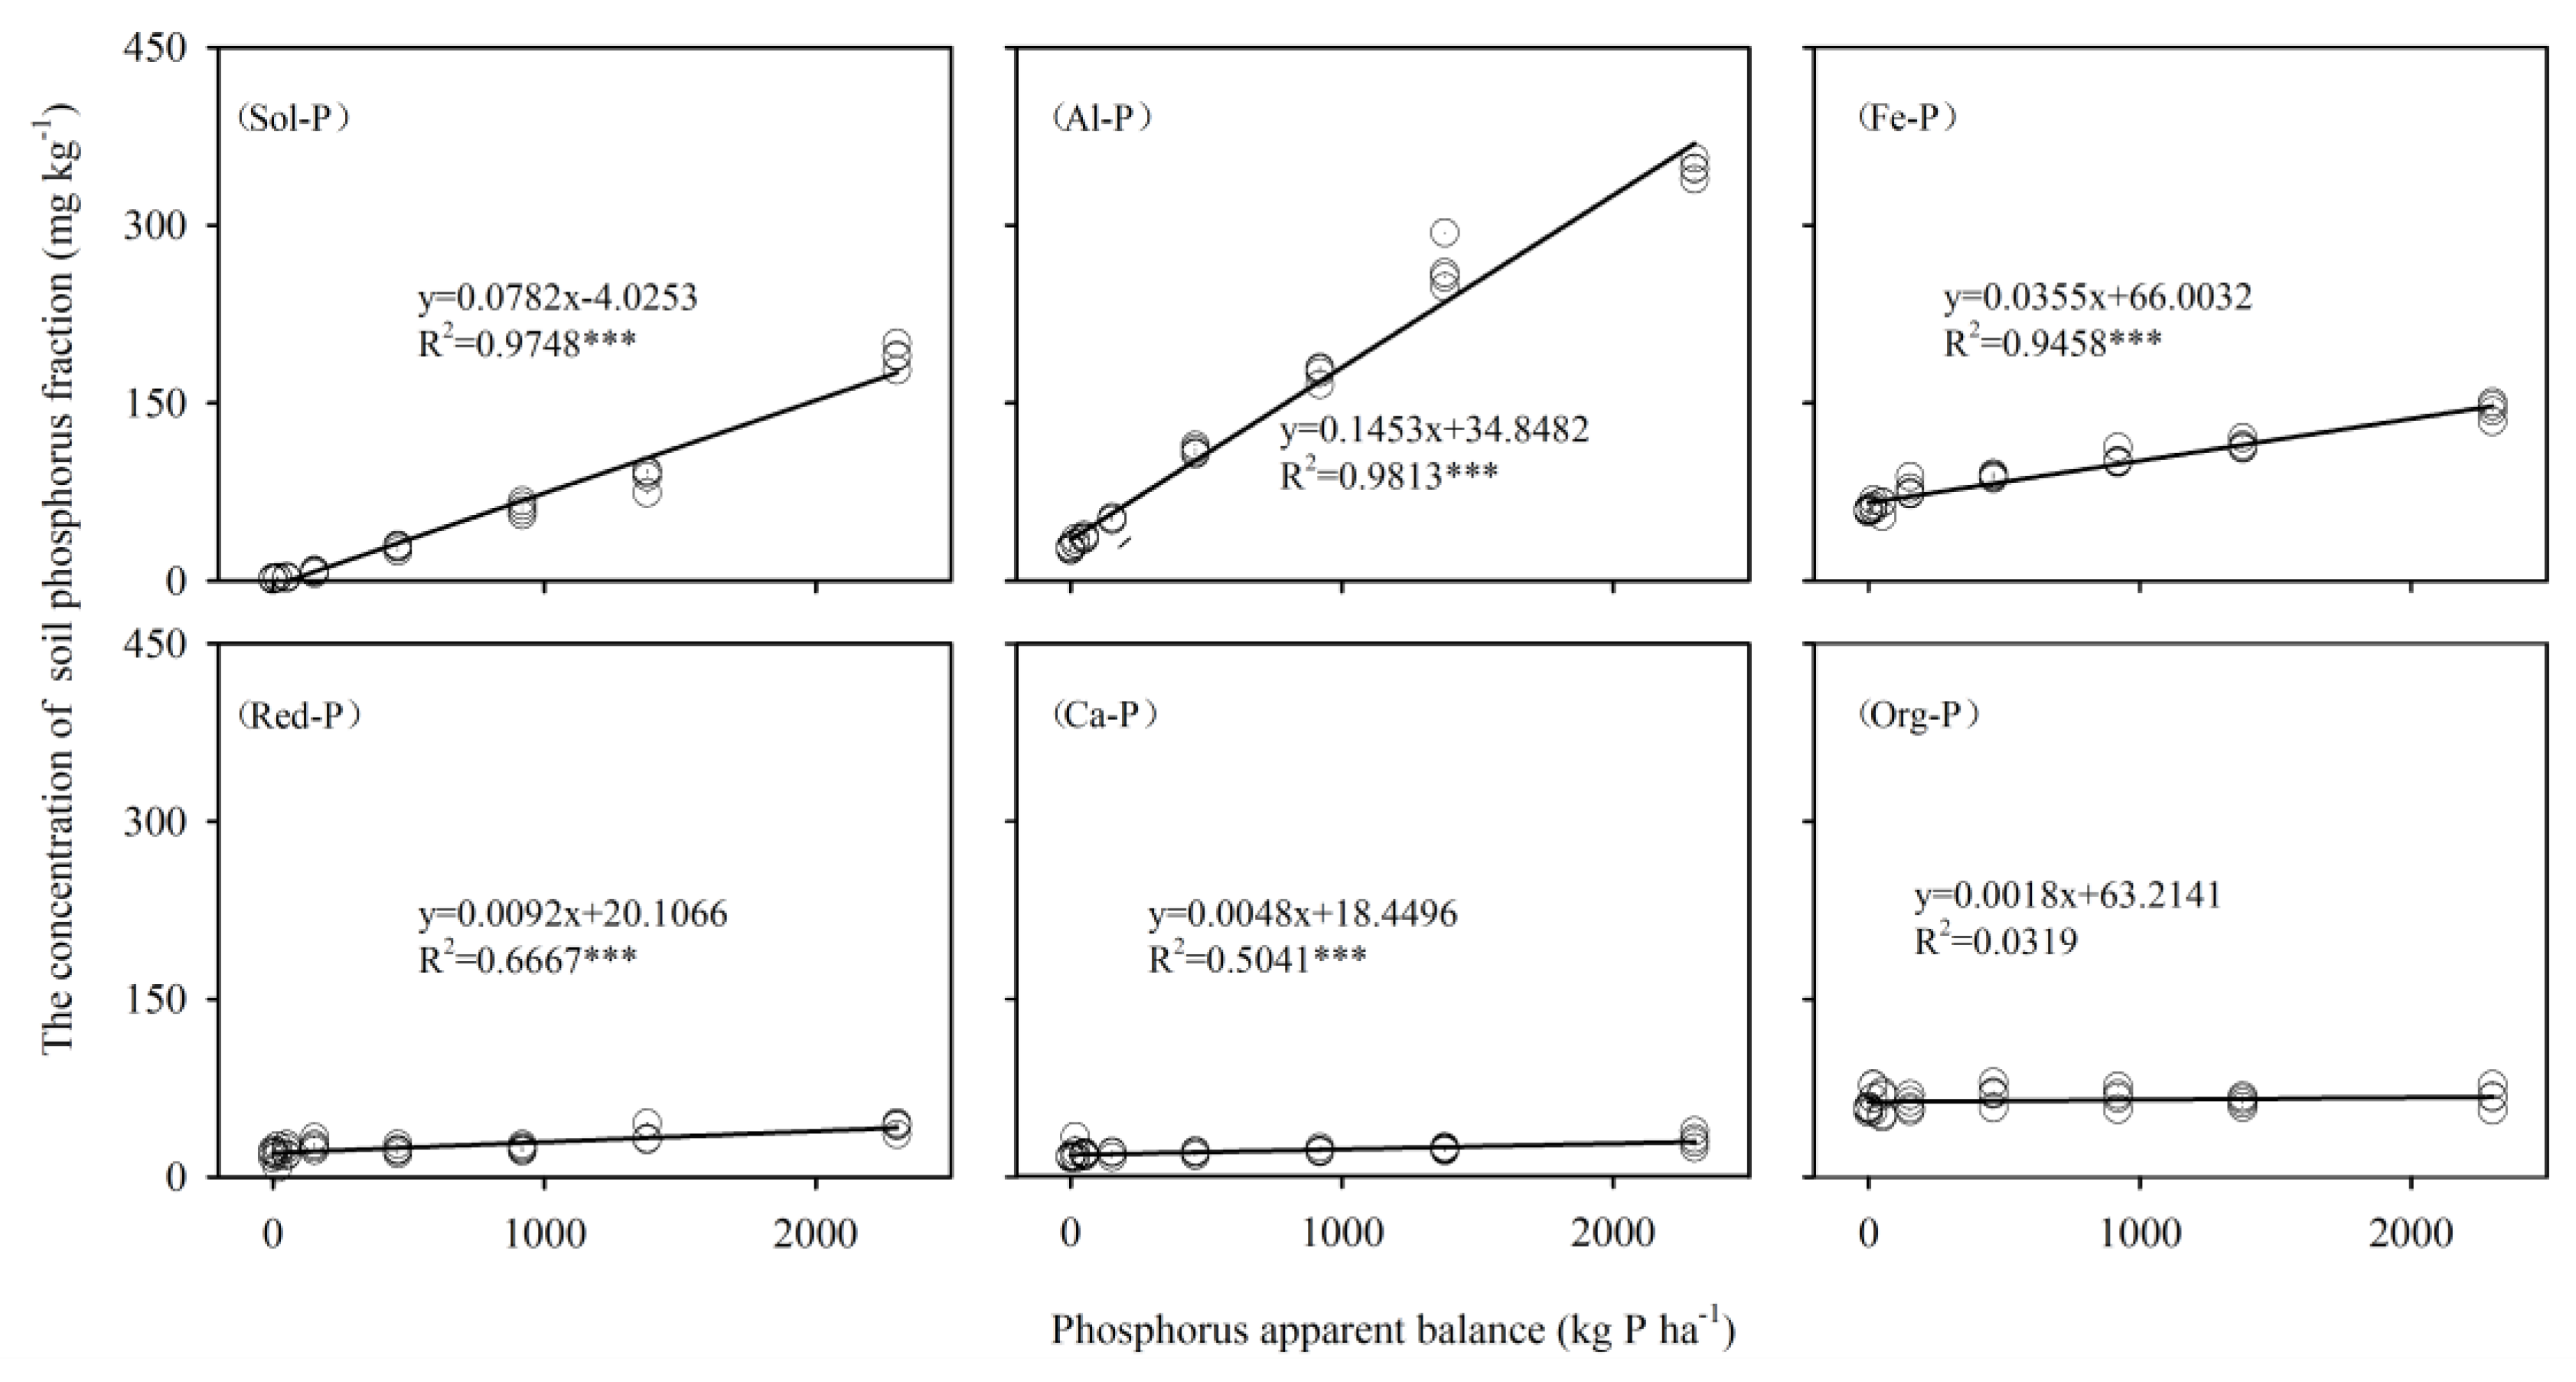
3.2. Phosphorus Apparent Balance (PAB) with P Fractions
3.3. The Bioavailability of P Fractions
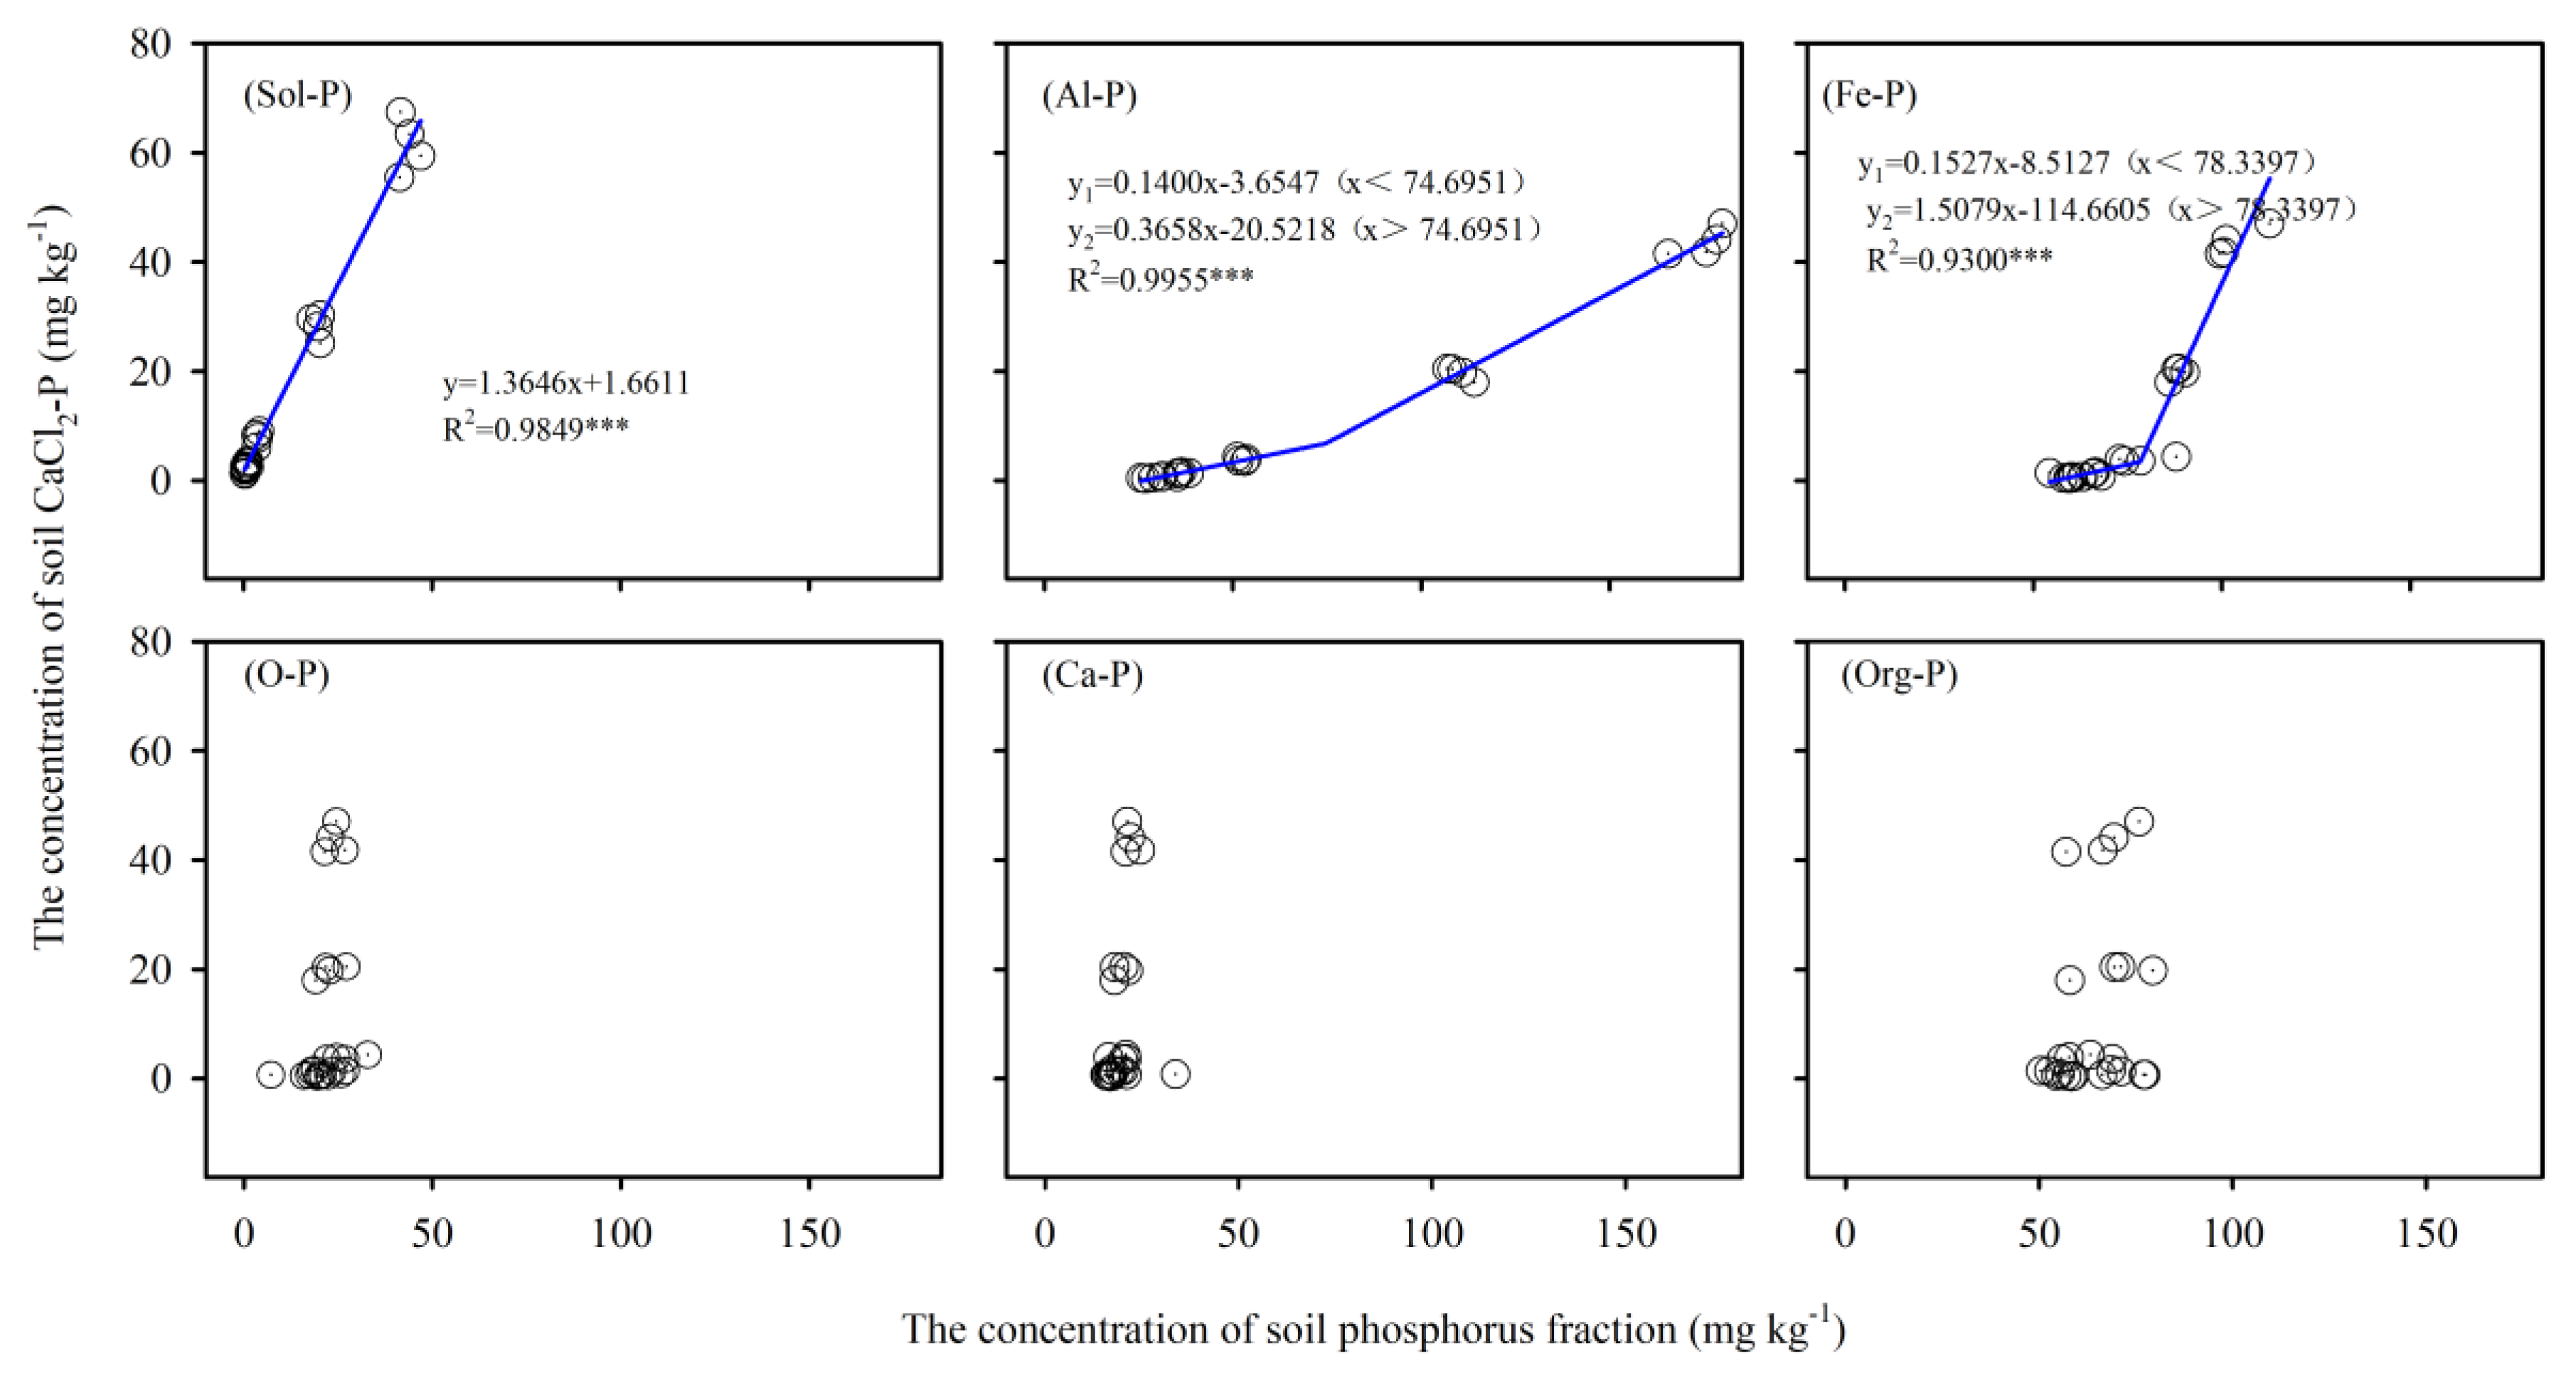
3.4. The Critical Level for Environmental Safety of Phosphorus Fractions
4. Discussion
4.1. Phosphorus Apparent Balances (PAB), Soil Total P and P Fractions
4.2. Bioavailability of P Fractions in Red Soil
4.3. The Critical Level of Environmental Safety of P Fractions in Red Soil
5. Conclusions
Supplementary Materials
Author Contributions
Funding
Conflicts of Interest
References
- Ferrol, N.; Azcón–Aguilar, C.; Pérez–Tienda, J. Arbuscular mycorrhizas as key players in sustainable plant phosphorus acquisition: An overview on the mechanisms involved. Plant Sci. 2019, 280, 441–447. [Google Scholar] [CrossRef]
- Smith, F.W. The phosphate uptake mechanism. Plant Soil 2002, 245, 105–114. [Google Scholar] [CrossRef]
- Zhang, W.J.; Xu, M.G.; Wang, B.R.; Wang, X.J. Soil organic carbon, total nitrogen and grain yields under long–term fertilizations in the upland red soil of southern China. Nut. Cycl. Agroecosyst. 2009, 84, 59–69. [Google Scholar] [CrossRef]
- National Bureau of Statistics of China (NBS; Formerly State Statistical Bureau). China Statistic Yearbook, 1986 to 2016 Editions; China Statistics: Beijing, China, 1986–2016. Available online: http://www.stats.gov.cn/ (accessed on 10 October 2020).
- Zhang, F.S.; Wang, J.Q.; Zhang, W.F.; Cui, Z.L.; Ma, W.Q.; Chen, X.P.; Jiang, R.F. Nutrient use efficiencies of major cereal crops in China and measures for improvement. Acta Pedol. Sin. 2008, 45, 915–924. [Google Scholar]
- Hooda, P.S.; Truesdale, V.W.; Edwards, A.C.; Withers, P.J.A.; Aitken, M.N.; Miller, A.; Rendell, A.R. Manuring and fertilization effects on phosphorus accumulation in soils and potential environmental implications. Adv. Environ. Res. 2001, 5, 13–21. [Google Scholar] [CrossRef]
- Azevedo, L.; Zelm, R.; Leuven, R.; Hendriks, A.; Huijbregt, M. Combined ecological risks of nitrogen and phosphorus in European freshwaters. Environ. Pollut. 2015, 200, 85–92. [Google Scholar] [CrossRef]
- Wang, J.; Liu, W.Z.; Mu, H.F.; Dang, T.H. Inorganic phosphorus fractions and phosphorus availability in a calcareous soil receiving 21–year superphosphate application. Pedosphere 2010, 20, 304–310. [Google Scholar] [CrossRef]
- Dieter, D.; Elsenbeer, H.; Turner, B.L. Phosphorus fractionation in lowland tropical rainforest soils in central Panama. Catena 2010, 82, 118–125. [Google Scholar] [CrossRef]
- Prakash, D.; Benbi, D.K.; Saroa, G.S. Land–use effects on phosphorus fractions in Indo–Gangetic alluvial soils. Agrofor. Syst. 2018, 92, 437–448. [Google Scholar]
- Chang, S.C.; Jackson, M.L. Fractionation of soil phosphorus. Soil Sci. 1957, 84, 133–144. [Google Scholar] [CrossRef]
- Blake, L.; Johnston, A.E.; Poulton, P.R.; Goulding, K.W.T. Changes in soil phosphorus fractions following positive and negative phosphorus balances for long periods. Plant Soil 2003, 254, 245–261. [Google Scholar] [CrossRef]
- Song, K.; Xue, Y.; Zheng, X.Q.; Lv, W.G.; Qiao, H.X.; Qin, Q.; Yang, J.J. Effects of the continuous use of organic manure and chemical fertilizer on soil inorganic phosphorus fractions in calcareous soil. Sci. Rep. 2017, 7, 1164. [Google Scholar] [CrossRef] [PubMed]
- Chowdhury, P.; Hoque, S.; Parvin, A.; Moniruzzaman, M. Speciation of inorganic phosphorus in some bench–merk soils of Bangladesh. Bangladesh J. Sci. Ind. Res. 2018, 53, 7–12. [Google Scholar] [CrossRef][Green Version]
- Soelaeman, Y.; Haryati, U. Soil physical properties and production of upland Ultisol soil. J. Agric. Sci. 2012, 34, 136–143. [Google Scholar] [CrossRef]
- Shen, J.B.; Li, R.Y.; Zhang, F.S.; Fan, J.; Tang, C.X.; Rengel, Z. Crop yields, soil fertility and phosphorus fractions in response to long–term fertilization under the rice monoculture system on a calcareous soil. Field Crop. Res. 2004, 86, 225–238. [Google Scholar] [CrossRef]
- Tiecher, T.; Gomes, M.V.; Ambrosini, V.G.; Amorim, M.B.; Bayer, C. Assessing linkage between soil phosphorus forms in contrasting tillage systems by path analysis. Soil Tillage Res. 2018, 175, 276–280. [Google Scholar] [CrossRef]
- Jiménez, J.G.; Healy, M.G.; Daly, K. Effects of fertiliser on phosphorus pools in soils with contrasting organic matter content: A fractionation and path analysis study. Geoderma 2019, 338, 128–135. [Google Scholar] [CrossRef]
- Wang, Y.L.; Yang, Y.D.; Zhao, L.P. Effect of inorganic phosphates on available phosphates in blake soil. J. Jilin Agric. Univ. 2005, 27, 191–201. [Google Scholar]
- Zheng, Z.; MacLeod, J.A.; Sanderson, J.B.; Lafond, J. Soil phosphorus dynamics after ten annual applications of mineral fertilizers and liquid dairy manure: Fractionation and path analyses. Soil Sci. 2004, 169, 449–456. [Google Scholar] [CrossRef]
- Dodd, R.J.; McDowell, R.W.; Condron, L.M. Changes in soil phosphorus availability and potential phosphorus loss following cessation of phosphorus fertiliser inputs. Soil Res. 2013, 51, 427–436. [Google Scholar] [CrossRef]
- T, L.; L, F.B.; L, C.S.; F, X.H.; G, L.L.; W, B.R.; W, S.L.; X, M.G. Mitigation of soil acidification through changes in soil mineralogy due to long-term fertilization in southern China. Catena 2019, 174, 227–234. [Google Scholar]
- Li, M.; Hu, Z.Y.; Zhu, X.Q.; Zhou, G.H. Risk of phosphorus leaching from phosphorus–enriched soils in the Dianchi catchment, Southwestern China. Environ. Sci. Pollut. Res. 2015, 22, 8460–8470. [Google Scholar] [CrossRef] [PubMed]
- Bai, Z.H.; Li, H.G.; Yang, X.Y.; Zhou, B.K.; Shi, X.J.; Wang, B.R.; Li, D.C.; Shen, J.B.; Chen, Q.; Qin, W.; et al. The critical soil P levels for crop yield, soil fertility and environmental safety in different soil types. Plant Soil 2013, 372, 27–37. [Google Scholar] [CrossRef]
- Guo, J.X.; Yang, J.C.; Zhang, L.J.; Chen, H.H.; Jia, Y.M.; Wang, Z.; Wang, D.; Liao, W.Q.; Chen, L.S.; Li, Y. Lower soil chemical quality of pomelo orchards compared with that of paddy and vegetable fields in acidic red soil hilly regions of southern China. J. Soils Sediments 2019, 19, 2752–2763. [Google Scholar] [CrossRef]
- Husson, O.; Brunet, A.; Babre, D.; Charpentierd, H.; Durande, M.; Sarthouf, J. Conservation agriculture systems alter the electrical characteristics (Eh, pH and EC) of four soil types in France. Soil Tillage Res. 2018, 176, 57–68. [Google Scholar] [CrossRef]
- Olsen, S.R.; Cole, C.V.; Watnabe, F.S.; Dean, D.A. Estimation of Available P in Soils by Extraction with Sodium Bicarbonate; United States Department of Agriculture (USDA): Washington, DC, USA, 1954.
- Li, P.; Shi, K.; Wang, Y.Y.; Kong, D.; Liu, T.; Jiao, J.; Liu, M.; Li, H.; Hu, F. Soil quality assessment of wheat-maize cropping system with different productivities in China: Establishing a minimum data set. Soil Tillage Res. 2019, 190, 31–40. [Google Scholar] [CrossRef]
- Hesketh, N.; Brookes, P.C. Development of an indicator for risk of phosphorus leaching. J. Environ. Qual. 2000, 29, 105–110. [Google Scholar] [CrossRef]
- Chen, J.-l.; Zhou, M.; Lin, J.-s.; Jiang, F.-s.; Huang, B.-f.; Xu, T.-t.; Wang, M.-k.; Ge, H.-l.; Huang, Y.h. Conservation Comparison of soil physicochemical properties and mineralogical compositions between noncollapsible soils and collapsed gullies. Geoderma 2018, 317, 56–66. [Google Scholar] [CrossRef]
- Zhao, S.H.; Yu, W.T.; Zhang, L.; Shen, S.M.; Ma, Q. Research advance in soil organic phosphorus. Chin. J. Appl. Ecol. 2004, 15, 2189–2194. [Google Scholar]
- Chen, C.R.; Hou, E.Q.; Condron, L.M.; Bacon, G.; Esfandbod, M.; Olley, J.; Turner, B.L. Soil phosphorus fractionation and nutrient dynamics along the Cooloola coastal dune chronosequence, southern Queensland, Australia. Geoderma 2015, 257–258, 4–13. [Google Scholar] [CrossRef]
- Prajapati, J.; Pattanayak, S.K. Phosphorous fractionation under intensive cropping system in acidic soil of Odisha and correlation matrix study with different forms of P. Commun. Soil Sci. Plant Anal. 2019, 50, 1764–1774. [Google Scholar] [CrossRef]
- Arifa, M.; Ilyasa, M.; Riazb, M.; Alic, K.; Shahd, K.; Haqd, I.U.; Fahad, S. Biochar improves phosphorus use efficiency of organic-inorganic fertilizers, maize-wheat productivity and soil quality in a low fertility alkaline soil. Field Crop. Res. 2017, 214, 25–37. [Google Scholar] [CrossRef]
- Cao, N.; Chen, X.P.; Cui, Z.L.; Zhang, F.S. Change in soil available phosphorus in relation to the phosphorus budget in China. Nutr. Cycl. Agroecosyst. 2012, 94, 161–170. [Google Scholar] [CrossRef]
- Milić, S.; Ninkov, J.; Zeremski, T.; Latković, D.; Šeremešić, S.; Radovanović, V.; Žarković, B. Soil fertility and phosphorus fractions in a calcareous chernozem after a long–term field experiment. Geoderma 2019, 339, 9–19. [Google Scholar] [CrossRef]
- Han, X.Z.; Song, C.Y.; Wang, S.Y.; Tang, C. Impact of long–term fertilization on phosphorus status in black soil. Pedosphere 2005. 15, 319–326.
- Nagumo, T.; Tajima, S.; Chikushi, S.; Yamashita, A. Phosphorus balance and soil phosphorus status in paddy rice fields with various fertilizer practices. Plant Prod. Sci 2013, 16, 69–76. [Google Scholar] [CrossRef]
- Xu, D.; Xu, J.; Wu, J.; Muhammad, A. Studies on the phosphorus sorption capacity of substrates used in constructed wetland systems. Chemosphere 2006, 63, 344–352. [Google Scholar] [CrossRef]
- Yang, X.Y.; Chen, X.W.; Yang, X.T. Effect of organic matter on phosphorus adsorption and desorption in a black soil from Northeast China. Soil Tillage Res. 2019, 187, 85–91. [Google Scholar] [CrossRef]
- Luo, Z.X.; Zhu, B.; Tang, J.L.; Wang, T. Phosphorus retention capacity of agricultural headwater ditch sediments under alkaline condition in purple soils area. China. Ecol. Eng. 2009, 35, 57–64. [Google Scholar]
- Pan, G.X.; Smith, P.; Pan, W.N. The role of soil organic matter in maintaining the productivity and yield stability of cereals in China. Agric. Ecosyst. Environ. 2009, 129, 344–348. [Google Scholar] [CrossRef]
- Kang, J.; Hesterberg, D.; Osmond, D.L. Soil organic matter effects on phosphorus sorption: A path analysis. Soil Sci. Soc. Am. J. 2009, 73, 360–366. [Google Scholar] [CrossRef]
- Piegholdt, C.; Geisseler, D.; Koch, H.J.; Ludwig, B. Long–term tillage effects on the distribution of phosphorus fractions of loess soils in Germany. J. Plant Nut. Soil Sci. 2013, 176, 217–226. [Google Scholar] [CrossRef]
- Whalen, J.K.; Chang, C. Macroaggregate characteristics in cultivated soils after 25 annual manure applications. Soil Sci. Soc. Am. J. 2002, 66, 1637–1647. [Google Scholar] [CrossRef]
- Menezes-Blackburn, D.; Giles, C.; Darch, T.; George, T.; Blackwell, M.; Stutter, M.; Shand, C.; Lumsdon, D.; Cooper, P.; Wendler, R.; et al. Opportunities for mobilizing recalcitrant phosphorus from agricultural soils: A review. Plant Soil 2018, 427, 1–2. [Google Scholar] [CrossRef]
- Adetunji, M.T. Phosphorus requirement of a maize–cowpea sequential cropping on a Paleudult. Fertil. Res. 1994, 39, 161–166. [Google Scholar] [CrossRef]
- Zhu, J.; Li, M.; Whelan, M. Phosphorus activators contribute to legacy phosphorus availability in agricultural soils: A review. Sci. Total Environ. 2018, 612, 522–537. [Google Scholar] [CrossRef]
- Pant, P.K.; Ram, S.; Mishra, A. Sequential extraction of different pools of phosphorus in alluvial and acid Soils of Uttarakhand. J. Appl. Nat. Sci. 2017, 9, 2280–2284. [Google Scholar] [CrossRef]
- Ao, J.H.; Huang, Y.; Fang, J.Q.; Zhou, W.L.; Chen, D.W.; Shen, D.C.; Wang, Q.; Huang, Z.R.; Li, Q.W.; Jiang, Y. The study of status of P in soil and fractions in Guangdong sugarcane area. Sugarcane Canesugar 2017, 6, 1–5. [Google Scholar]
- Wang, Y.; Tang, J.; Zhang, H.; Schroder, J.L.; He, Y. Phosphorus availability and sorption as affected by long–term fertilization. Agron. J. 2014, 106, 1583–1592. [Google Scholar] [CrossRef]
- Holford, I.C.R. Soil phosphorus: Its measurement, and its uptake by plants. Soil Res. 1997, 35, 227–240. [Google Scholar] [CrossRef]
- Zhang, T.Q.; MacKenzie, A.F.; Liang, B.C.; Drury, C.F. Soil test phosphorus and phosphorus fractions with long–term phosphorus addition and depletion. Soil Sci. Soc. Am. J. 2004, 68, 519–528. [Google Scholar] [CrossRef]
- Ao, J.H.; Chen, Z.J.; Wu, M.; Lu, X.; Huang, Z.R.; Liao, H. Phosphorus fractions of red soils in Guangdong Province of South China and their bioavailability for five crop species. Soil Sci. 2014, 179, 514–521. [Google Scholar] [CrossRef]
- Garcí-Albacete, M.; Martín, A.; Cartagena, M.C. Fractionation of phosphorus biowastes: Characterisation and environmental risk. Waste Manag. 2012, 32, 1061–1068. [Google Scholar]
- Zhu, Y.R.; Zhang, R.Y.; Wu, F.C.; Qu, X.X.; Xie, F.Z.; Fu, Z.Y. Phosphorus fractions and bioavailability in relation to particle size characteristics in sediments from Lake Hongfeng, Southwest China. Environ. Earth Sci. 2013, 68, 1041–1052. [Google Scholar] [CrossRef]
- Singh, B.R.; Krogstad, T.; Shivay, Y.S.; Shivakumar, B.G.; Bakkegard, M. Phosphorus fractionation and sorption in P–enriched soils of Norway. Nut. Cycl. Agroecosyst. 2005, 73, 245–256. [Google Scholar] [CrossRef]
- Schoumans, O.F.; Chardon, W.J.; Bechmann, M.E.; Gascuel–Odoux, C.; Hofman, G.; Kronvang, B.; Dorioz, J.M. Mitigation options to reduce phosphorus losses from the agricultural sector and improve surface water quality: A review. Sci. Total Environ. 2014, 468, 1255–1266. [Google Scholar] [CrossRef]


| Soil Depth | pH | Total–C (g·kg−1) | Total–N (g·kg−1) | Avai–K (mg·kg−1) | Total–P (mg·kg−1) | Olsen-P (mg·kg−1) | P Fraction (mg·kg−1) | |||||
|---|---|---|---|---|---|---|---|---|---|---|---|---|
| Sol-P | Al-P | Fe-P | Red-P | Ca-P | Org-P | |||||||
| Surface soil | 5.90 ± 0.07 | 5.20 ± 0.09 | 0.60 ± 0.03 | 40.17 ± 1.20 | 89.40 ± 4.29 | 8.19 ± 0.75 | 0.21 ± 0.07 | 6.02 ± 0.35 | 22.58 ± 1.22 | 10.84 ± 0.67 | 8.26 ± 0.53 | 38.49 ± 2.53 |
| Subsurface soil | 5.86 ± 0.21 | 2.86 ± 0.11 | 0.42 ± 0.02 | 29.86 ± 1.44 | 60.18 ± 3.16 | 7.86 ± 0.98 | 0.01 ± 0.01 | 3.28 ± 0.35 | 11.96 ± 0.44 | 7.86 ± 0.75 | 5.45 ± 0.46 | 29.62 ± 2.16 |
| Step | Pi Fraction | Extractant | Shaking Time |
|---|---|---|---|
| 1 | Sol-P | 1 mol·L−1 NH4Cl | 30 min |
| 2 a | Al-P | 0.5 mol·L−1 NH4F (pH:8.2) | 60 min |
| 3 a | Fe-P | 0.1 mol·L−1 NaOH | 2 h, 16 h stand, 2 h |
| 4 a | Red-P | 0.3 M CD b | 25 min |
| 5 | Ca-P | 0.25 mol·L−1 H2SO4 | 60 min |
| Soil Depth | Treatment | Sol-P | Al-P | Fe-P | Red-P | Ca-P | Org-P |
|---|---|---|---|---|---|---|---|
| Surface soil | P0 | 0.10 ef | 4.75 d | 30.20 ef | 16.27 cd | 10.96 cd | 62.48 a |
| P1 | 0.16 def | 12.00 cd | 45.78 de | 20.60 bc | 20.86 bcd | 63.82 a | |
| P2 | 0.49 bc | 19.61 c | 64.66 c | 26.64 ab | 23.53 bc | 65.75 a | |
| P3 | 0.63 b | 34.47 b | 92.00 b | 27.46 a | 26.19 b | 59.78 a | |
| P4 | 1.33 a | 83.23 a | 139.06 a | 28.26 a | 39.50 a | 57.97 a | |
| Subsurface soil | P0 | 0.07 f | 2.88 d | 13.39 f | 11.95 d | 8.20 d | 39.90 b |
| P1 | 0.15 def | 7.83 d | 28.71 ef | 17.00 cd | 9.37 d | 34.04 b | |
| P2 | 0.30 cde | 9.64 cd | 35.73 e | 21.32 bc | 18.53 bcd | 36.71 b | |
| P3 | 0.33 cd | 11.27 cd | 45.03 de | 20.60 bc | 17.63 bcd | 31.03 b | |
| P4 | 0.32 cd | 12.90 cd | 53.40 cd | 18.66 c | 17.87 bcd | 33.73 b | |
| Source of variation | |||||||
| Treatment | <0.001 | <0.001 | <0.001 | <0.001 | <0.01 | ns | |
| Soil depth | <0.001 | <0.001 | <0.001 | <0.001 | <0.01 | <0.001 | |
| T × S | <0.001 | <0.001 | <0.001 | ns | ns | ns | |
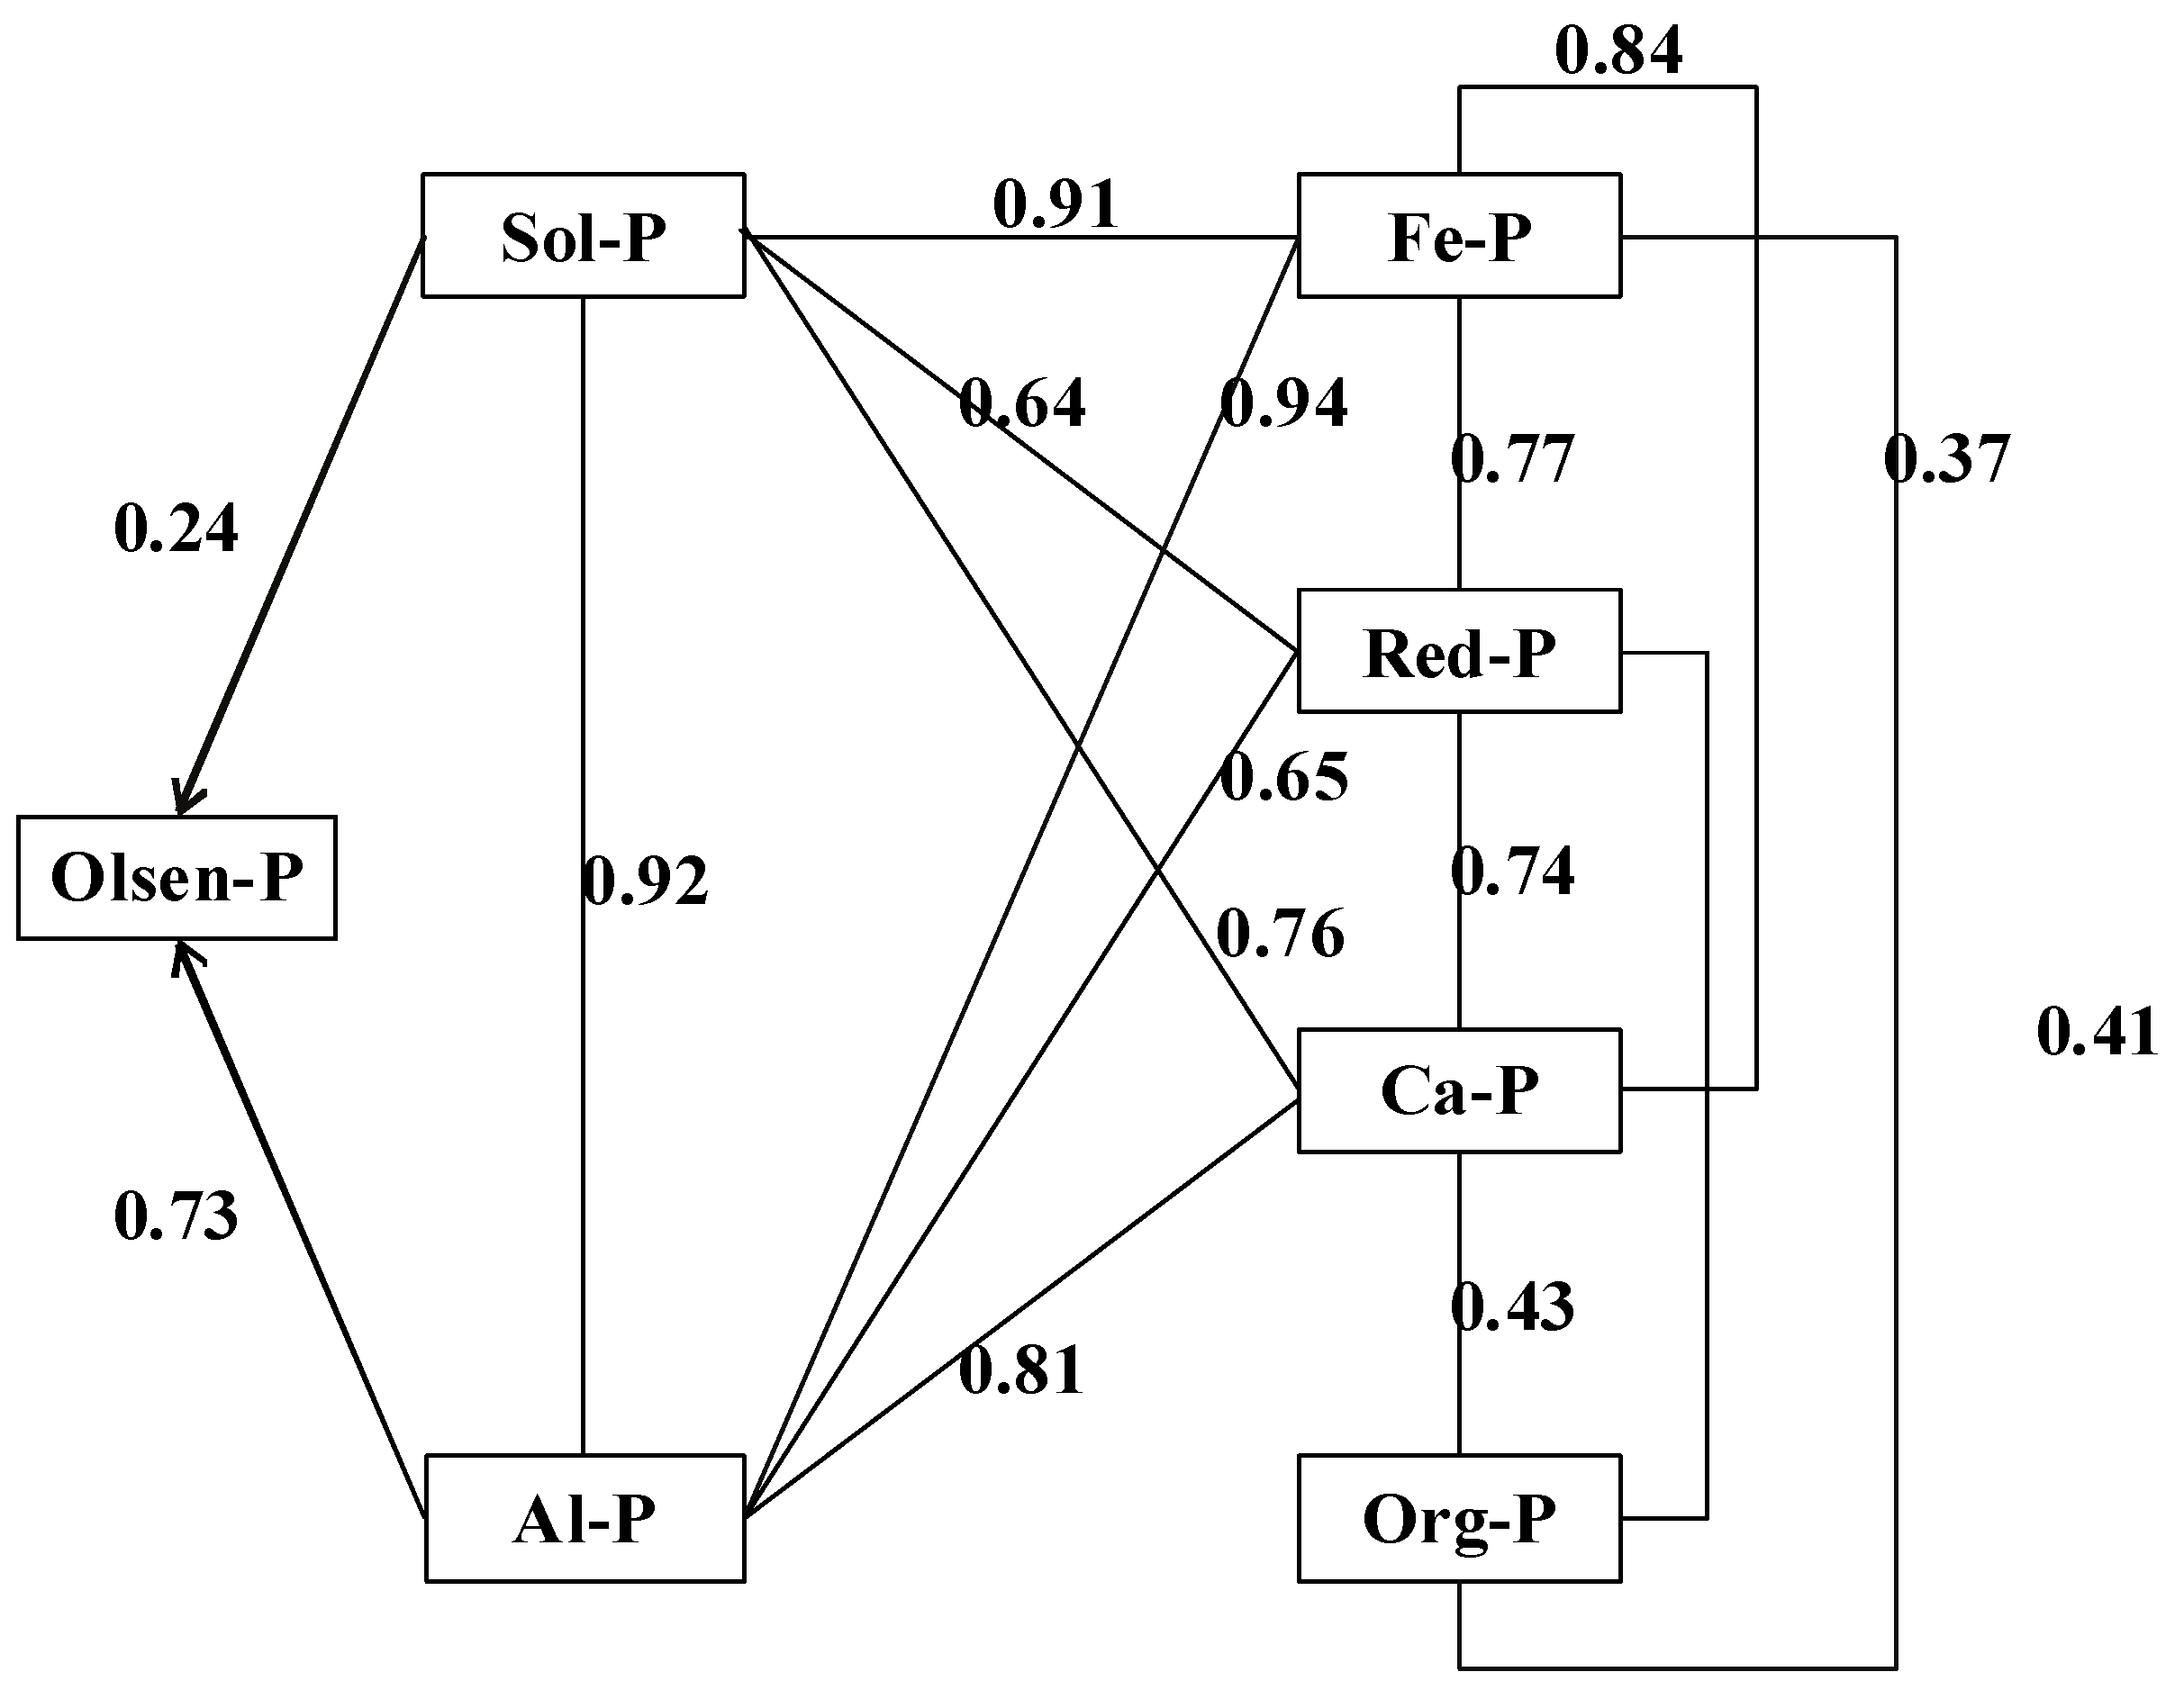
| Indicator | Olsen-P | Sol-P | Al-P | Fe-P | Red-P | Ca-P | Org-P |
|---|---|---|---|---|---|---|---|
| Olsen-P | 1 | ||||||
| Sol-P | 0.94 ** | 1 | |||||
| Al-P | 0.98 ** | 0.92 ** | 1 | ||||
| Fe-P | 0.93 ** | 0.91 ** | 0.94 ** | 1 | |||
| Red-P | 0.61 ** | 0.64 ** | 0.65 ** | 0.77 ** | 1 | ||
| Ca-P | 0.79 ** | 0.76 ** | 0.81 ** | 0.84 ** | 0.74 ** | 1 | |
| Org-P | 0.33 | 0.28 | 0.33 | 0.38 * | 0.41 * | 0.4 3 * | 1 |
© 2020 by the authors. Licensee MDPI, Basel, Switzerland. This article is an open access article distributed under the terms and conditions of the Creative Commons Attribution (CC BY) license (http://creativecommons.org/licenses/by/4.0/).
Share and Cite
Yan, X.; Yang, W.; Chen, X.; Wang, M.; Wang, W.; Ye, D.; Wu, L. Soil Phosphorus Pools, Bioavailability and Environmental Risk in Response to the Phosphorus Supply in the Red Soil of Southern China. Int. J. Environ. Res. Public Health 2020, 17, 7384. https://doi.org/10.3390/ijerph17207384
Yan X, Yang W, Chen X, Wang M, Wang W, Ye D, Wu L. Soil Phosphorus Pools, Bioavailability and Environmental Risk in Response to the Phosphorus Supply in the Red Soil of Southern China. International Journal of Environmental Research and Public Health. 2020; 17(20):7384. https://doi.org/10.3390/ijerph17207384
Chicago/Turabian StyleYan, Xiaojun, Wenhao Yang, Xiaohui Chen, Mingkuang Wang, Weiqi Wang, Delian Ye, and Liangquan Wu. 2020. "Soil Phosphorus Pools, Bioavailability and Environmental Risk in Response to the Phosphorus Supply in the Red Soil of Southern China" International Journal of Environmental Research and Public Health 17, no. 20: 7384. https://doi.org/10.3390/ijerph17207384
APA StyleYan, X., Yang, W., Chen, X., Wang, M., Wang, W., Ye, D., & Wu, L. (2020). Soil Phosphorus Pools, Bioavailability and Environmental Risk in Response to the Phosphorus Supply in the Red Soil of Southern China. International Journal of Environmental Research and Public Health, 17(20), 7384. https://doi.org/10.3390/ijerph17207384