Article

Analytical Bias in the Measurement of Plasma 25-Hydroxyvitamin D Concentrations in Infants

1
Division of Paediatrics, School of Medicine, The University of Western Australia, Perth 6009, Australia
2
Perth Children’s Hospital, Department of Paediatric Immunology, Perth 6009, Australia
3
inVIVO Planetary Health, Group of the Worldwide Universities Network (WUN), West New York, NJ 07093, USA
4
School of Public Health, Curtin University, Perth 6102, Australia
5
Telethon Kids Institute, University of Western Australia, Perth 6009, Australia
6
Institute for Health Research, University of Notre Dame, Fremantle 6160, Australia
7
Metabolomics Australia, Centre for Microscopy, Characterisation and Analysis, The University of Western Australia, Perth 6009, Australia
8
Sir Charles Gairdner Hospital, Department of Endocrinology, Perth 6009, Australia
9
PathWest Laboratory Medicine, QEII Medical Centre, Nedlands 6009, Australia
10
Perth Children’s Hospital, Department of Paediatric Endocrinology and Diabetes, Perth 6009, Australia
*
Author to whom correspondence should be addressed.
Int. J. Environ. Res. Public Health 2020, 17(2), 412; https://doi.org/10.3390/ijerph17020412
Submission received: 18 November 2019 / Revised: 30 December 2019 / Accepted: 30 December 2019 / Published: 8 January 2020
(This article belongs to the Special Issue Sun Exposure and Vitamin D for Public Health)

Abstract

:
Hypovitaminosis D is prevalent worldwide; however, analytical bias in the measurement of circulating 25-hydroxyvitamin D (25(OH)D) concentrations may affect clinical treatment decisions and research. We performed parallel plasma 25(OH)D analyses using the Abbott Architect i2000 chemiluminescent immunoassay (CIA) and liquid chromatography–tandem mass spectrometry (LC–MS/MS) for paired samples from the same infants at 3 (n = 69), 6 (n = 79) and 12 months (n = 73) of age. To test agreement, we used Lin’s concordance correlation coefficient and corresponding 95% confidence interval, Bland–Altman’s limits of agreement, and Bradley–Blackwood (BB) test. Agreement was high at 3 months (coefficient between difference and mean −0.076; BB F = 0.825; p = 0.440), good at 12 months (−0.25; BB F = 2.41; p = 0.097) but missing at 6 months of age (−0.39; BB F = 12.30; p < 0.001). Overall, 18 infants had disparate results based on the cut-off point for vitamin D deficiency (25(OH)D < 50 nmol/L), particularly at three months, with seven (10%) infants deficient according to CIA but not LC–MS/MS, and four (6%) deficient by LC–MS/MS but not CIA. To our knowledge, this is the first study to show that the reported 25(OH)D concentration may be influenced by both age and assay type. Physicians and researchers should be aware of these pitfalls when measuring circulating 25(OH)D concentrations in infants and when developing treatment plans based on measured vitamin D status.

1. Introduction

Vitamin D deficiency is a significant global concern due to both its high prevalence in diverse populations and its multisystem health implications [1,2,3,4,5]. Sunlight exposure is required for vitamin D synthesis, and a growing body of evidence suggests that lifestyle changes, including reduced outdoor activity, may explain the global rise of vitamin D insufficiency over the last decades [6,7,8]. There is long-standing awareness of the importance of vitamin D for bone health [4]. There is also expanding evidence that vitamin D plays a role in various other inflammatory non-communicable diseases [2,3,4].
Many of these multisystem effects may be influenced by the impact of vitamin D on the immune function [9]. Increased knowledge of the broader health implications of vitamin D status has translated to higher demands for measuring circulating 25-hydroxyvitamin D (25(OH)D) concentrations, with substantial cost to health systems [10,11]. This underscores the importance of cost-effective, reliable and accurate assays for determining vitamin D status—and a clear understanding of the variability between different assays used in clinical practice and research.
Thresholds for vitamin D deficiency are based on total 25(OH)D concentrations (25(OH)D3 plus 25(OH)D2) [12,13]. However, the accurate assessment of vitamin D status is challenging, since 25(OH)D is lipophilic, strongly bound to vitamin D-binding protein and has more than 50 epimers [12,14]. The interpretation of total circulating 25(OH)D concentrations is further complicated by the presence of the C3-epimeric form (C3-epi-25(OH)D3), particularly in infants aged ≤12 months [15,16]. Due to their molecular similarity, C3-epi-25(OH)D3 may be incorrectly interpreted as 25(OH)D by some assays. Furthermore, the downstream hydroxylated C3-1,25(OH)2D is thought to have considerably lower biological activity than the active form of vitamin D, 1,25-dihydroxyvitamin D. Inadvertently including C3-epi-25(OH)D3 may result in an overestimation of circulating 25(OH)D concentrations in infants, leading to under-prescription of supplements and undue toxicity concerns [15,16].
A liquid chromatography–tandem mass spectrometry (LC–MS/MS) method that is certified to the reference measurement procedures (RMPs) developed by the National Institute of Standards and Technology, Ghent University, and the US Centers for Disease Control and Prevention [17,18] is considered to be the gold standard for measuring circulating 25(OH)D concentrations [19]. LC–MS/MS can report 25(OH)D3 concentrations independently of 25(OH)D2 and C3-epi-25(OH)D3 [12]. However, the requirement of highly trained technologists, the limited sample throughput, and the high cost of the equipment, places constraints on the widespread use of LC–MS/MS in clinical laboratories. In contrast, the automated immunoassay is less expensive and much easier to perform with high-throughput capacity [20]. This is the method most commonly used in clinical laboratories and is the basis for the clinical classification of vitamin D deficiency and subsequent recommendations for vitamin D supplementation [12].
Despite the introduction of monitoring programs (International Vitamin D External Quality Assessment Scheme (DEQAS) [21], Vitamin D Standardization Program (VDSP) [17,22] and the College of Pathologists’ recommendations [23]), substantial between-assay differences have been documented between laboratories engaged in measuring circulating 25(OH)D concentrations [24]. Studies in adults have demonstrated that serum 25(OH)D concentrations measured by LC–MS/MS were generally higher than those measured by other assays [19,24].
Limited data on assay variability are available in infants [25,26]. An Australian study in neonates showed a tendency towards lower serum 25(OH)D concentrations measured by LC–MS/MS compared with those determined by immunoassay, although the difference was not statistically significant [25]. Adequate vitamin D status in infancy has unique implications for long-term health—not only for life-long bone health [27], but also for immune and metabolic health [28]. Even small individual differences around the cut-off point for vitamin D deficiency can potentially result in misclassification of vitamin D status [26] and alter decisions around vitamin D supplementation [29]. Given the lack of data comparing the performances of vitamin D assays in infants, we aimed to investigate the inter-assay variability between the chemiluminescent immunoassay (CIA) and the LC–MS/MS method in infants at 3, 6 and 12 months of age.

2. Materials and Methods

This is an observational study comparing parallel analyses by CIA and LC–MS/MS of identical paired samples for plasma 25(OH)D concentrations in the same cohort of infants at 3, 6, and 12 months of age. The samples were collected between March 2012 and August 2016 as part of a randomized controlled trial conducted in Perth, Australia [30], which was designed to assess the effect of oral vitamin D supplementation (400 IU/day cholecalciferol over 6 months) on infant immune outcomes (ACTRN12612000787886). Written informed consent was obtained before trial participation. Ethics approval was granted by the Human Research Ethics Committees of Princess Margaret Hospital (1959EP).
Peripheral blood was collected by venipuncture and processed for plasma and mononuclear cells. Ref. [30] Two different assays were used for the determination of plasma 25(OH)D concentrations.
We used a delayed one-step chemiluminescent microparticle immunoassay (CIA) on an automated Abbott Architect i2000 (Abbott Laboratories, Illinois). The calibrators were standardized against Standard Reference Material 2-972 from the National Institute of Standards and Technology [31]. The analytical coefficient of variation for 25(OH)D was 7.8% at 24 nmol/L, 4.2% at 46 nmol/L and 4.1% at 82 nmol/L. Cross reactivity between 25(OH) vitamin D and 25(OH)D3 epimer was 1.3%, and that between 25(OH) vitamin D and 25(OH)D2 epimer was 0.8%. The Abbott Architect i2000 is accredited by the National Association of Testing Authorities for measurement of 25(OH)D, and the recently improved version has been shown to have reduced variability in comparison to LC–MS/MS [32].
The concentrations of 25(OH)D were also analysed by the LC–MS/MS method certified by the VDSP [17]. This method has been previously described [33]. Briefly, liquid–liquid extraction of vitamin D metabolites was followed by 2-dimensional LC–MS/MS analysis on an Agilent 6460 LC–QQQ mass spectrometer. The coefficient of variation of the assay was consistently <5% at 23 to 182 nmol/L and could report down to 2 nmol/L. Using this assay, 25(OH)D2, 25(OH)D3 and C3-epimer concentrations were measured; 25(OH)D2 concentrations were consistently <3 nmol/L and were therefore not reported [33]. As Abbott Architect i2000 did not measure C3-epimer concentrations, these were not included in our analysis, however, they are reported in Table 1 and Table 2.
Statistical analysis was conducted using Stata v14 (ref: StataCorp. 2015. Stata Statistical Software: Release 14. College Station, TX: StataCorp LP). As measures of agreement, we used Lin’s concordance correlation coefficient and corresponding 95% confidence interval and Bland–Altman’s limits of agreement method. Bradley–Blackwood test, a test of equality of means and variances of both variables, was also performed. All statistical tests were two-tailed. Statistical significance was set at p < 0.05. Concordance was implied if the value for the correlation between difference and mean was near zero and the Bradley–Blackwood coefficient (F) was not statistically significant. Vitamin D deficiency was defined as 25(OH)D concentrations < 50 nmol/L, the preferred cut-off point used in Australia [34,35]. We compared results for plasma 25(OH)D concentrations between CIA and LC–MS/MS. For each assay, we also determined the proportion of samples identified as below the cut-off point for vitamin D deficiency (25(OH)D < 50 nmol/L) [36,37].

3. Results

Of the 120 participants, parallel plasma 25(OH)D measurements using CIA and LC–MS/MS were available for paired samples of 69 infants at 3 months, 79 infants at 6 months, and 73 infants at 12 months of age (Table 1).
The Abbott CIA reported the sum of D2 and D3 metabolites. Using LC–MS/MS, we were able to differentiate D2 and D3 metabolites, and this analysis consistently revealed 25(OH)D2 concentrations of <3 nmol/L for each included sample.
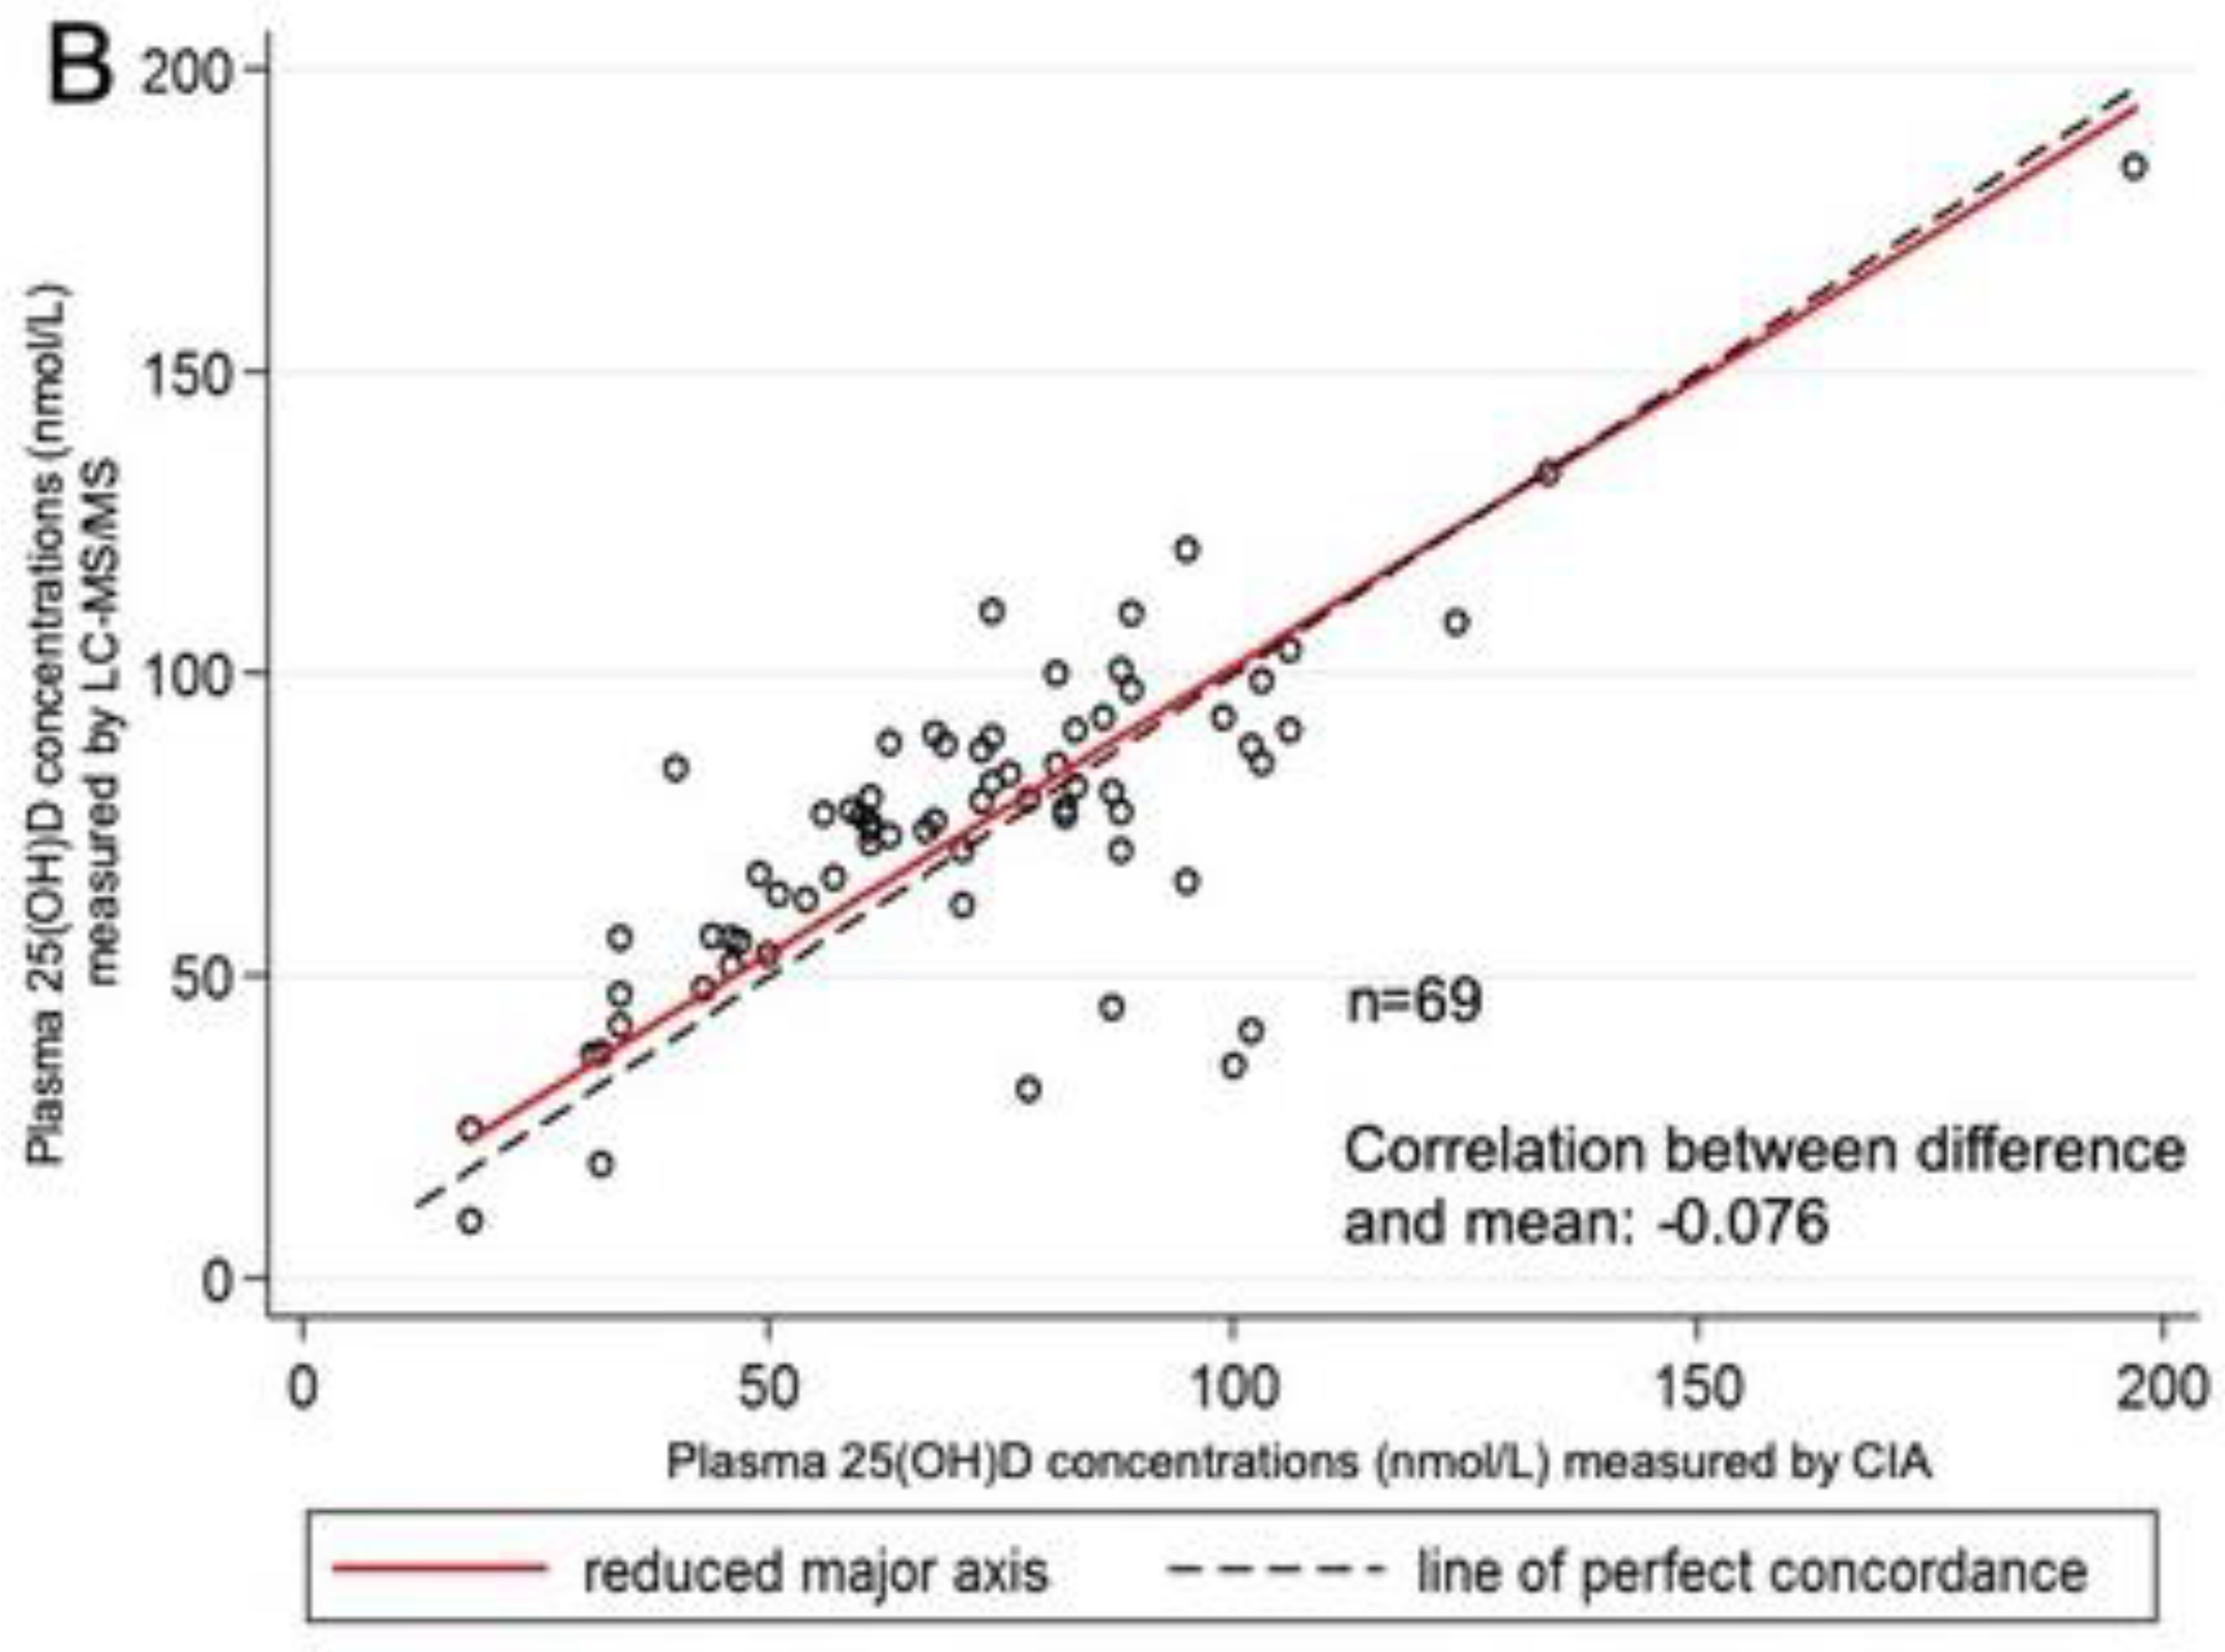
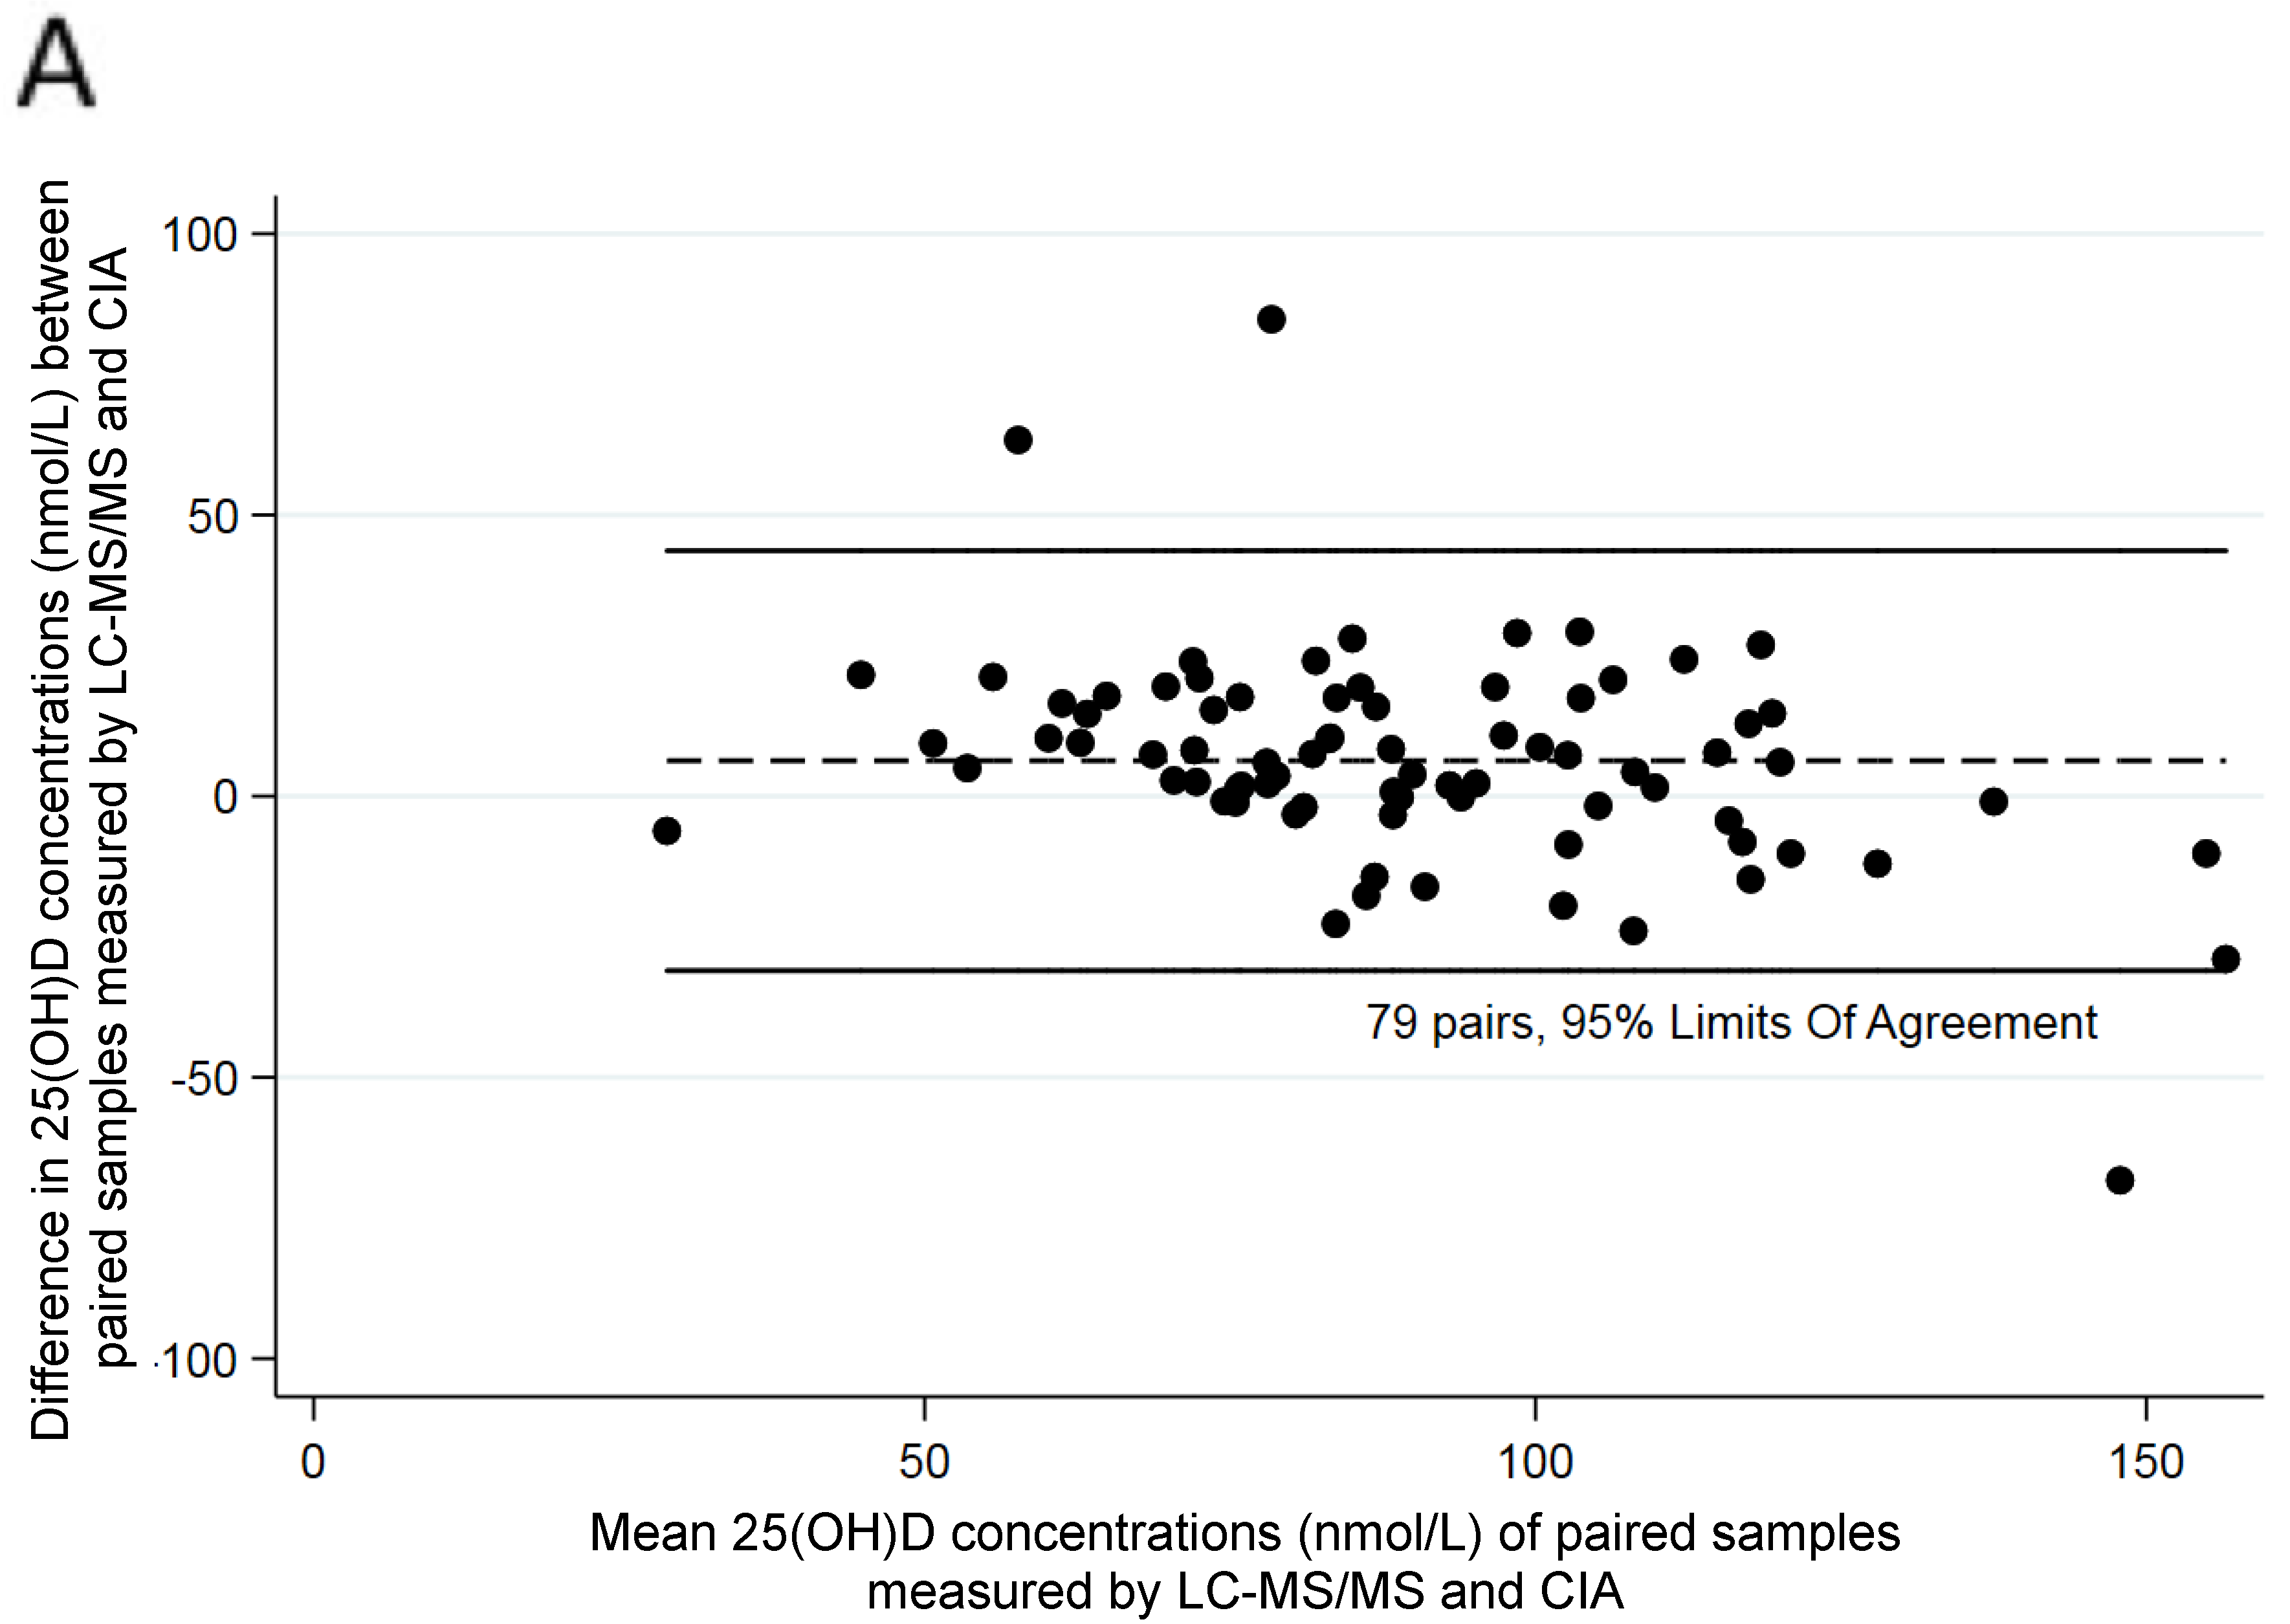
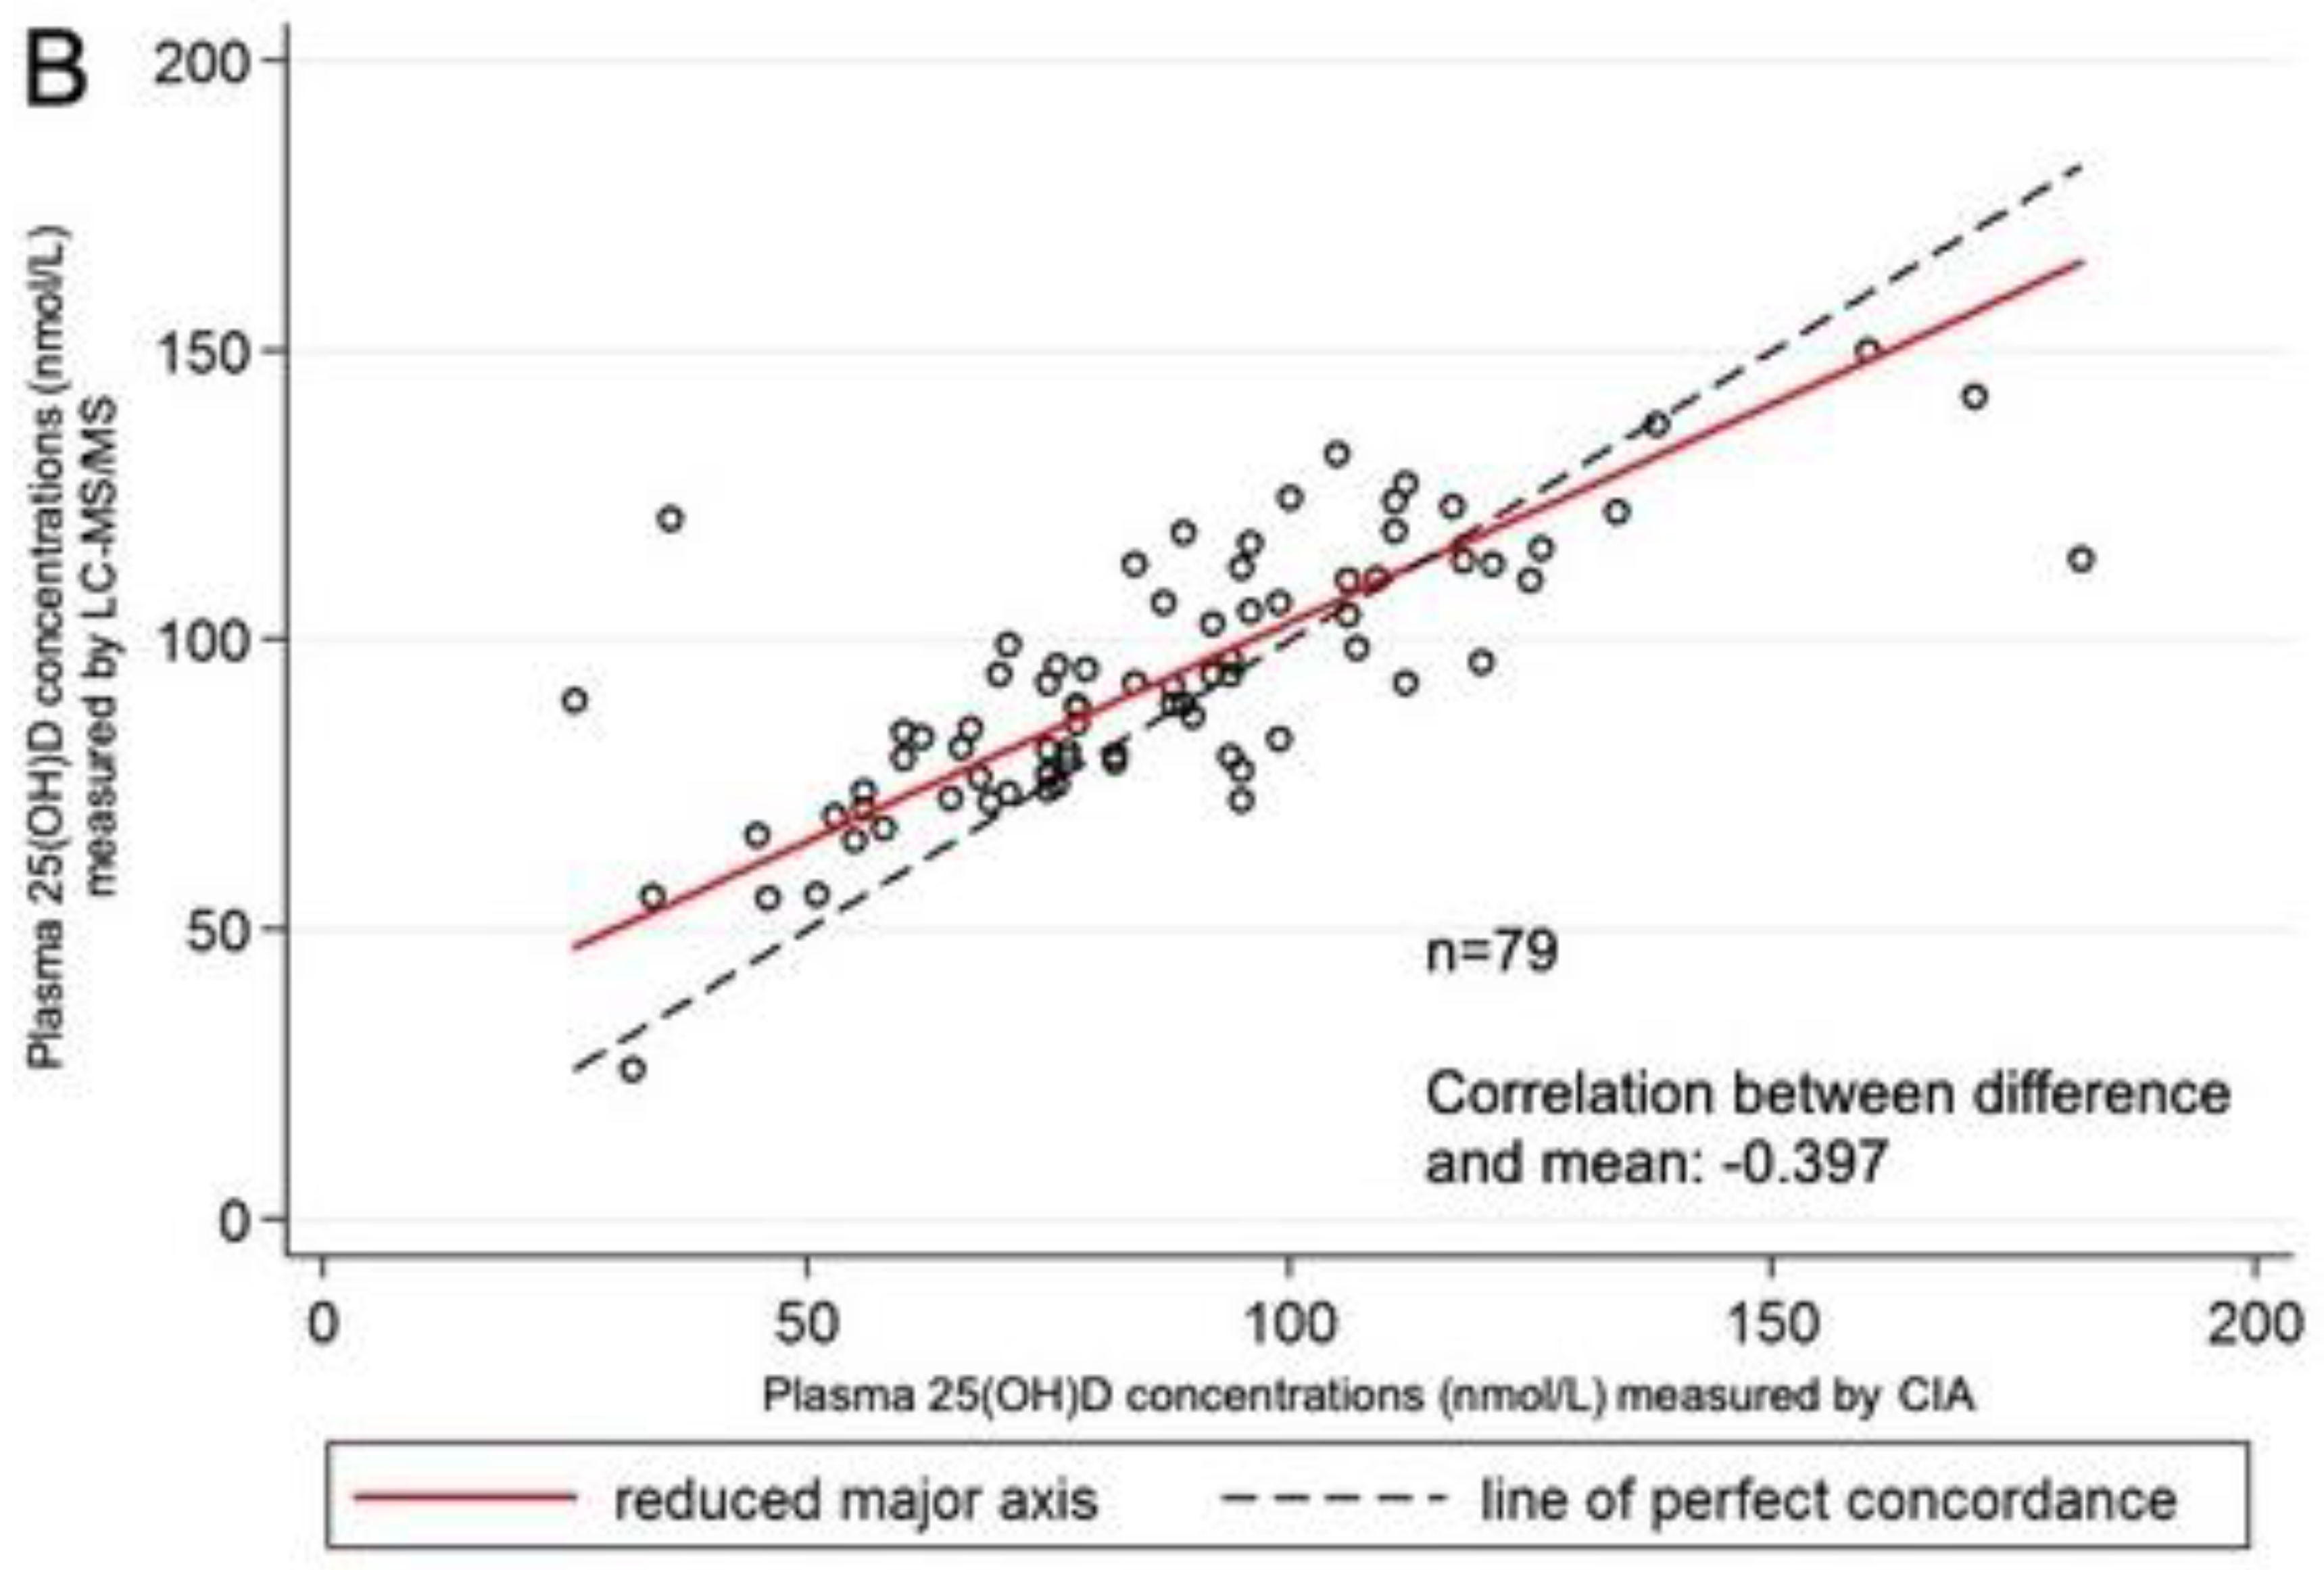
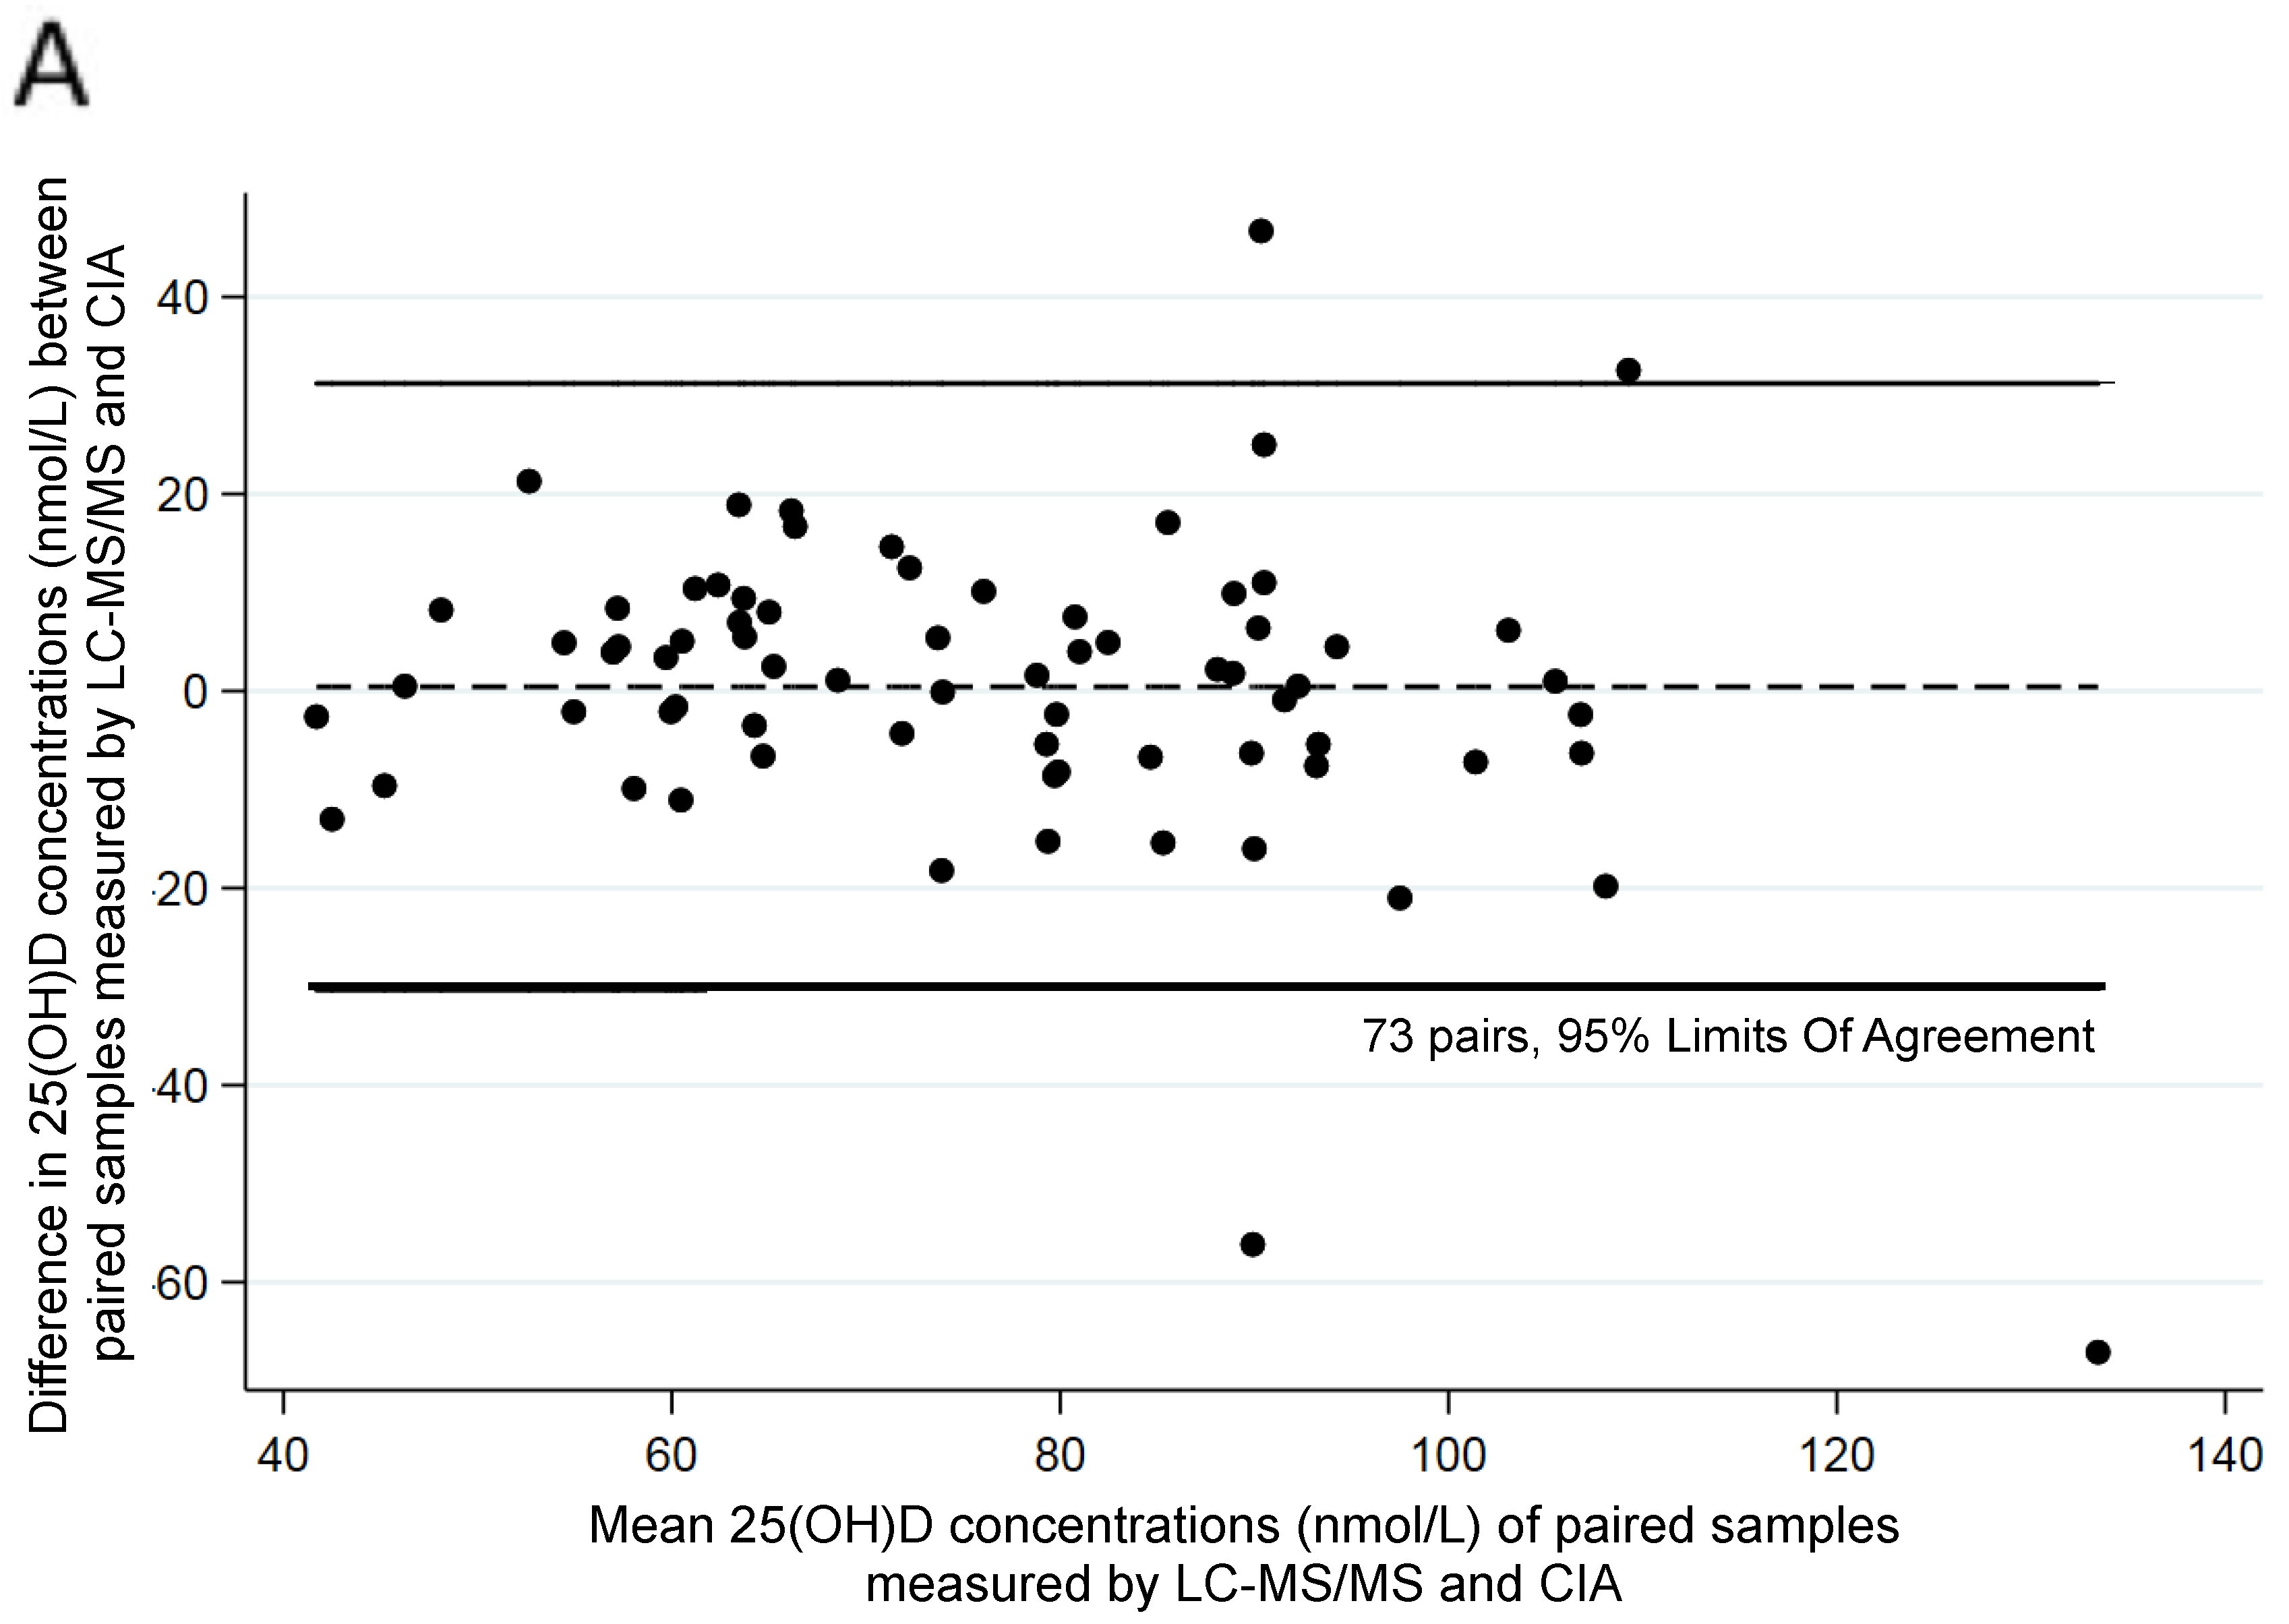
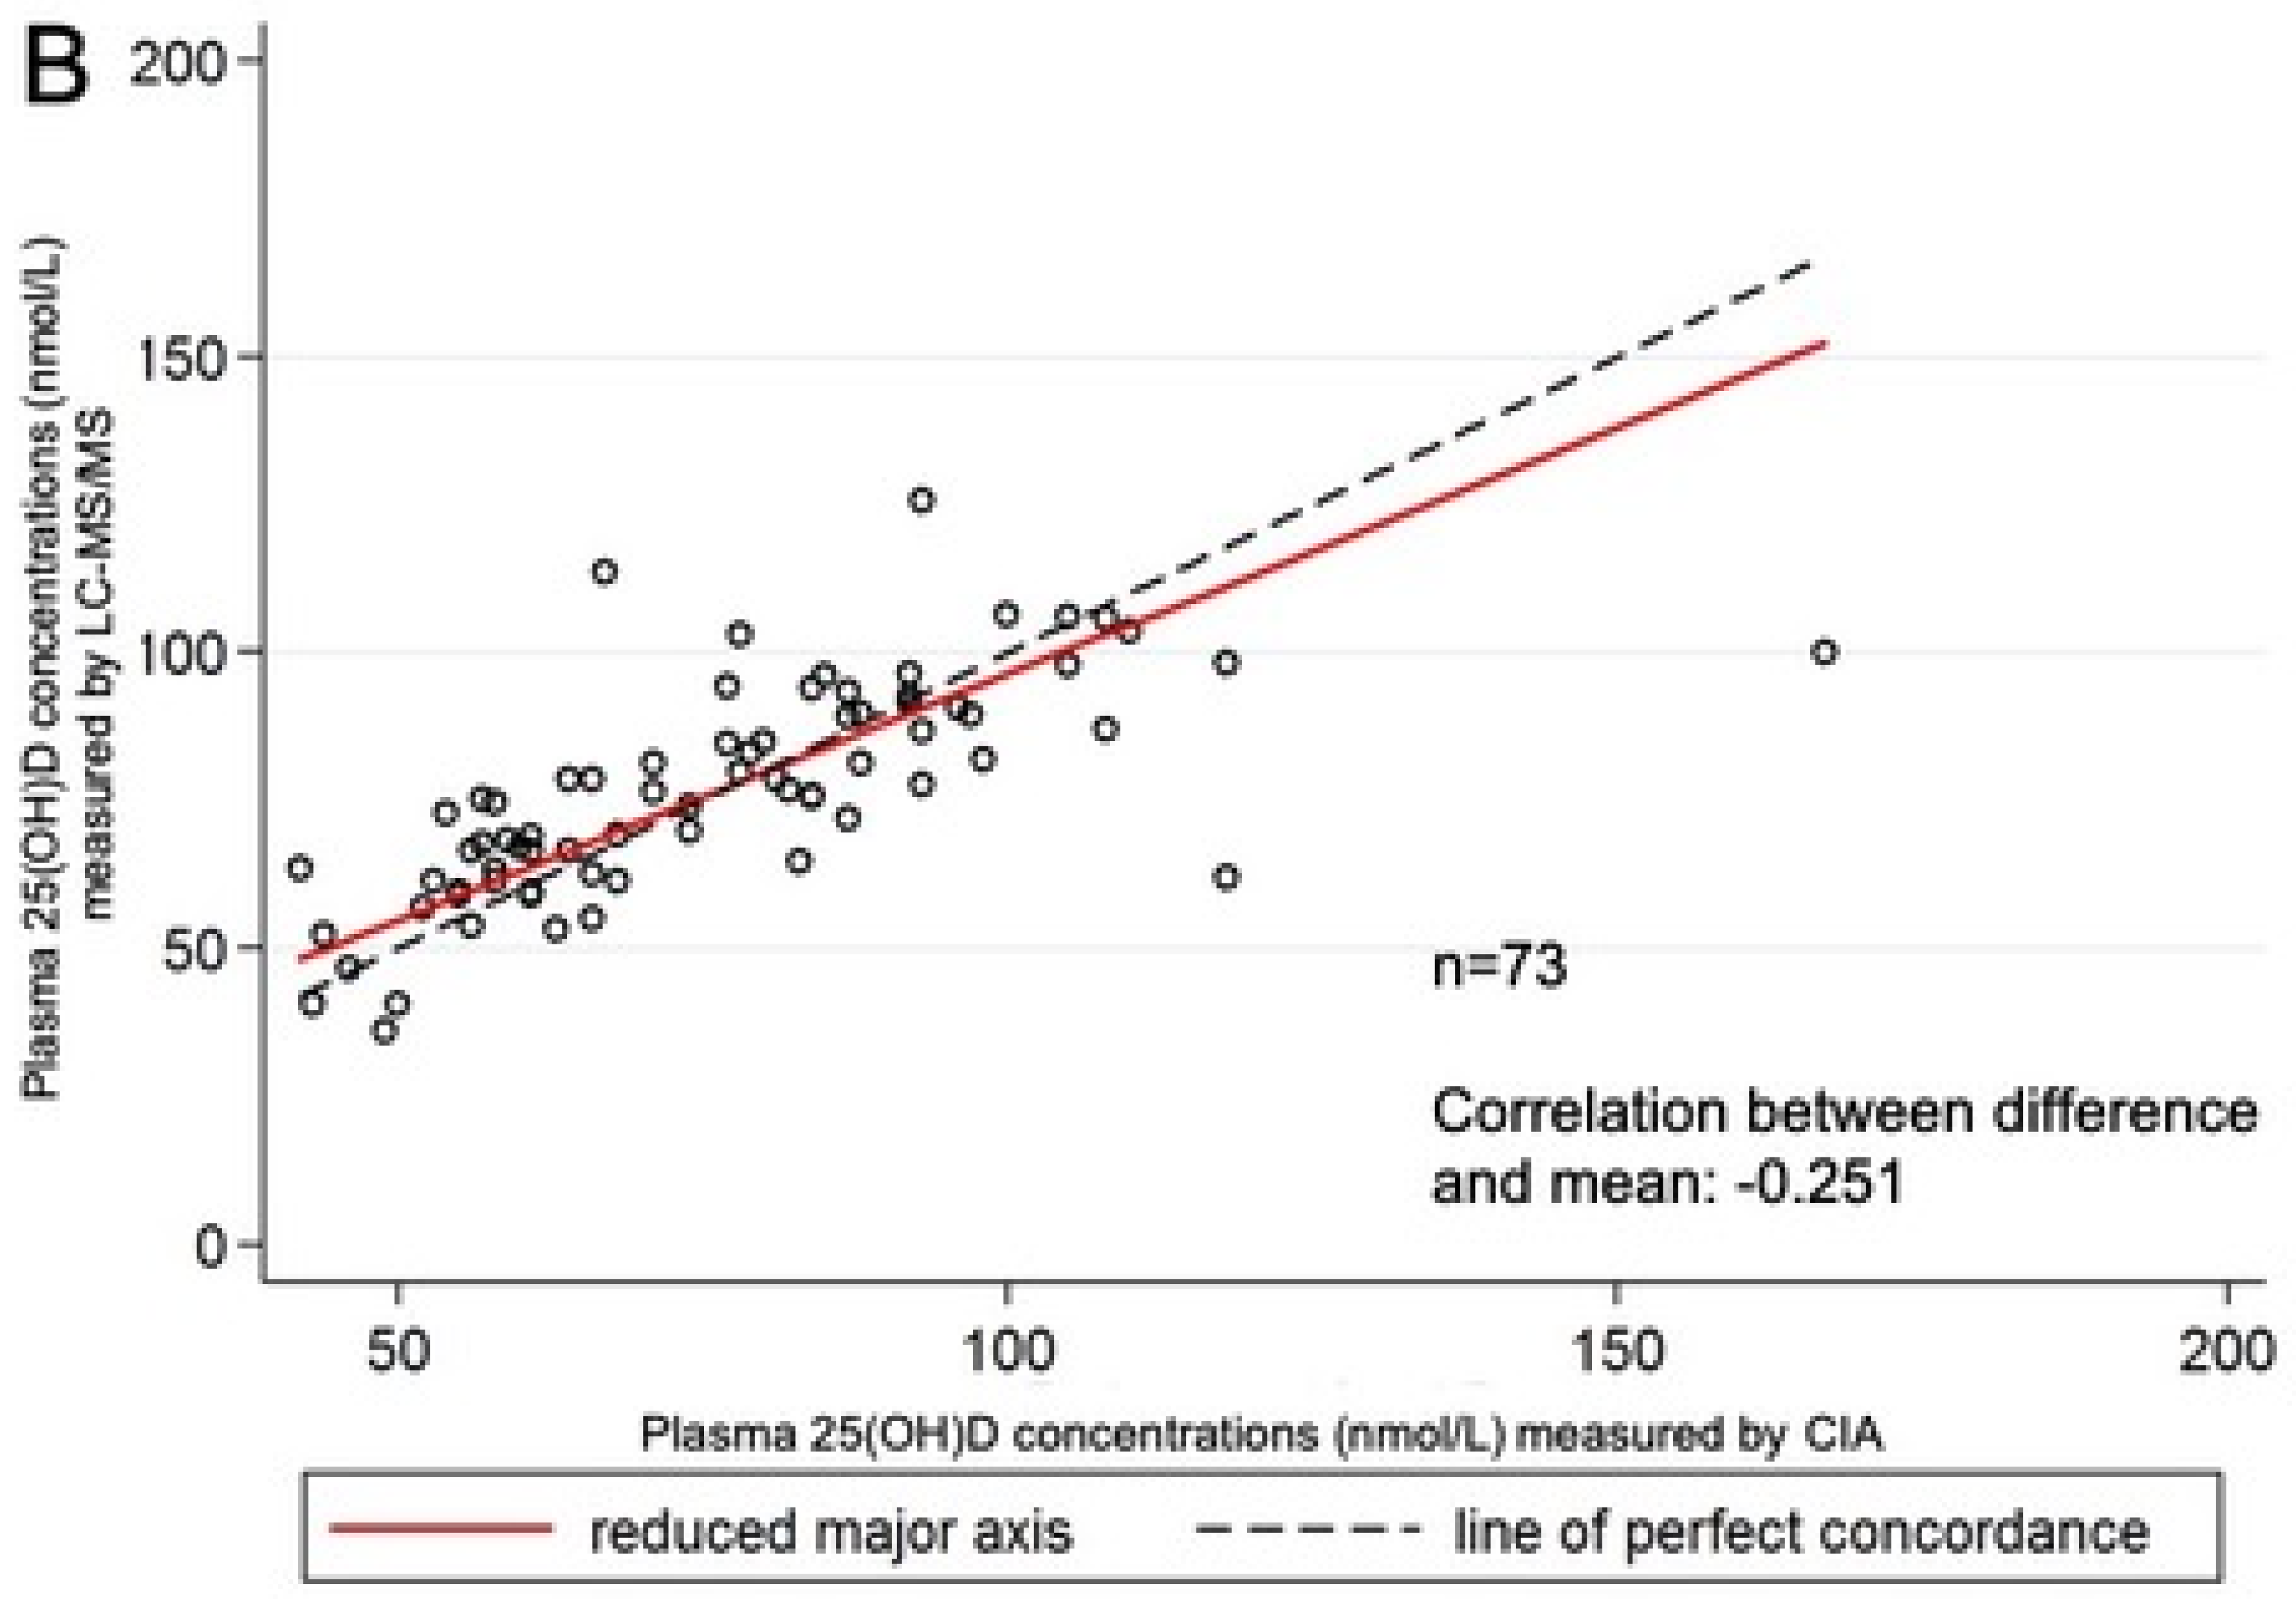
There was good agreement between assays at three months of age (Bland–Altman bias =2.63, correlation between difference and mean R = −0.076; Bradley–Blackwood F = 0.825; p = 0.443) (Figure 1) but not at six months of age (Bland–Altman bias= 6.316; R = −0.40; F = 12.32; p < 0.001) (Figure 2). There was agreement at 12 months of age (Bland–Altman bias= 0.433, R = −0.25; F = 2.41; p = 0.097) (Figure 3).
For each assay, we also determined the proportion of samples identified as below the cut-off point for vitamin D deficiency (25(OH)D < 50 nmol/L). Seven (10%) of the three-month-old infants were defined as vitamin D-deficient by CIA but not LC–MS/MS, and four (6%) were defined as deficient by LC–MS/MS but not CIA (Table 2). Among the 6- and 12-month-old infants, five and two infants, respectively, were deficient according to laboratory CIA but not LC–MS/MS. None of the 6- and 12-month-old infants were vitamin D-deficient according to LC–MS/MS. (Table 2).

4. Discussion

This study compared the two major 25(OH)D assays currently in use (immunoassay and LC–MS/MS) for analysing plasma 25(OH)D concentrations in the same cohort of 3-, 6-, and 12-month-old infants. We found that inter-assay variation differed by age. Overall, there was agreement at 3 and 12 months, but not at 6 months of age. On an individual basis, measurements around the cut-off point for vitamin D deficiency (25(OH)D < 50 nmol/L) differed between assays. At three months of age, 10% of the infants were defined as vitamin D-deficient by CIA but not LC–MS/MS, and 6% were defined as deficient by LC–MS/MS but not CIA. Hence, such assay variability may lead to therapeutic consequences for younger infants, including errors in the determination of the need and dose of vitamin D supplementation to promote bone health.
Uniquely, we compared CIA and LC–MS/MS longitudinally in the first year of life and noticed an age difference in assay variability which is supported by a European study in older children and adults [6], suggesting that this finding may be influenced by age-related metabolic changes. The observed age difference in assay variability in our cohort may also be impacted by the actual 25(OH)D concentration, as other studies have observed more agreement for lower than for higher concentrations of 25(OH)D [24,38]. In our study, 25(OH)D concentrations were higher at 6 months than at 3 and 12 months of age, which could be explained by nutritional factors, such as changing from breastfeeding to vitamin D-enriched formulas. Further, vitamin D supplementation commenced in some infants at three months of age due to low vitamin D status, which likely resulted in higher plasma 25(OH)D concentrations at six months.
Potentially, it could be argued that the C3-epimer concentrations may have affected the outcome of the comparison between the two assays. However, in our study, C3-epimer concentrations were very similar at three and six months of age, although our results showed agreement between methods at three months of age but not at six months of age. Furthermore, looking at CIA, cross reactivity between 25(OH)D3 and the C3-epimer is known to be only minimal (1.3%). Hence, detection of the C3-epimer would not explain the missing agreement between the two assays at six months of age.
While our results are consistent with those of the previous small (n = 10) South Australian study on neonates [25], there are a number of points of distinction. Firstly, the South Australian study used an enzyme immunoassay for comparison with LC–MS/MS, while we compared the more commonly used CIA. Secondly, in the South Australian study, a capillary blood sample was collected for a newborn screening test, while we used venous blood samples from older infants. Thirdly, we analysed plasma 25(OH)D concentrations at three different time points through the first year of life, while the South Australian study only collected a single sample during the neonatal period. Hence, for the first time, we were able to track inter-assay differences in infancy longitudinally.
Using blood samples from children aged 9–11 years, an Iranian paediatric study compared a competitive protein-binding assay-based enzyme immunoassay (CPBA) with a high-pressure liquid chromatography (HPLC) method for measuring 25(OH)D concentrations [39]. They found that CPBA sensitivity and specificity were poor (44% and 61%, respectively) compared to HPLC. Although the results of this study cannot be directly compared to ours (different assays, ages, ethnicity and lower cut-off point for vitamin D deficiency at 12.5 nmol/L) [19,38], its findings nonetheless support that vitamin D determinations in infants are influenced by the assay used. A recent German study which includes children aged 1 to 17 years highlights how standardization has a substantial impact on estimates of vitamin D status. The authors concluded that standardization of clinical, research laboratory and commercial assays for 25(OH)D measurement is urgently required, supporting our findings that until then, researchers and clinicians need to be aware of the problems when using different assays [6].
Studies in adults also demonstrate inter-assay variability [17,19,24,38,40]. Due to differences in sample preparation and lack of standardization in calibration, there is also substantial variability between the same assay type in different laboratories [13,19,25,41,42]. Substantial variation was even observed using repeated measures of the same assay in the same laboratory [38].
Since accurate and reliable measures are essential for clinical indications for vitamin D supplementation, assay variability may have an influence on clinical decisions. Correct clinical decisions, while important at all ages, are particularly important in early childhood [43,44], a life stage when optimal bone health is crucial for gross motor development. Furthermore, there is growing evidence that vitamin D deficiency may have a long-lasting impact on immune and metabolic health. This highlights the need for reliable and standardized measurements and, if required, adequate vitamin D supplementation early in life [28]. Ideally, the same assay should be used longitudinally to monitor treatment responses.
Assay variability may also impact on research, since the use of different assays hinders pooling of results. A few randomized controlled trials have assessed the efficacy of daily drops of 400 IU vitamin D in the first year of life. However, different assays were used to quantify 25(OH)D: CIA [30,45], radioimmunoassay (RIA) [46] and LC–MS/MS [47], and only two of these studies referred to the use of an external quality assessment system [30,47].
Although efforts have been made to standardize 25(OH)D measurements in research and clinical settings [17,21,22,42], substantial variability in the measurement of 25(OH)D concentrations still occurs. In these instances, harmonising results to international standards by reanalysing a relatively small number of samples is suggested [24].
A strength of the present study is the analysis of sample pairs in the same cohort of infants at 3, 6 and 12 months of age. However, our study was a single-centre study with a limited number of analysed samples; therefore, results may not be generalizable. The inherent limitations of vitamin D assays must also be considered when comparing variability, including variations between and within methods carried out in different laboratories, by different operators, or using different reagent kit batches.

5. Conclusions

We have shown that age in infancy influences the variability between commonly used assays for measuring 25(OH)D concentrations. Physicians, researchers, laboratory technicians and authorities need to be aware of the current limitations when interpreting and comparing vitamin D values derived from different assays. Accurate measurement of circulating 25(OH)D concentrations is essential for indicating the need for vitamin D supplementation, which is particularly important in pregnancy, lactation and infancy, when optimal bone growth is of paramount importance. Reliable measurement is also crucial for research and public health initiatives, particularly for estimating the prevalence of vitamin D deficiency and for following participants longitudinally.

Author Contributions

K.R., L.J.B., D.J.P., S.L.P. and A.S. conceptualized the overarching research goals and aims; K.R. led the investigation; E.M.L. and M.W.C. provided the methodology and verified the results; A.J. and C.G. led the project administration and collection of data; K.R., A.S., A.J. and C.G. cleaned and curated the data; M.B. conducted the formal data analyses using statistical software, K.R., L.J.B. and A.S. prepared the original draft; A.J., C.G., M.B., M.W.C., E.M.L., D.J.P. and S.L.P. edited the original article. K.R., D.J.P., S.L.P. and A.S. acquired funding for this study. All authors have read and agreed to the published version of the manuscript.

Funding

This study was supported by the Telethon New Children’s Hospital Research Fund, WA, Australia; Asthma Foundation of Western Australia; Ddrops Company, Woodbridge, ON, Canada; and the Princess Margaret Hospital Foundation, WA, Australia.

Acknowledgments

We thank the families who participated, the research staff who supported the data collection, the staff at the Princess Margaret Hospital Research Pharmacy and the staff at PathWest laboratory at Sir Charles Gairdner Hospital. M.W.C. is affiliated to Metabolomics Australia, University of Western Australia, Perth, Australia. This study was supported by infrastructure funding from the Western Australian State Government in partnership with the Australian Federal Government, through Bioplatforms Australia and the National Collaborative Research Infrastructure Strategy (NCRIS).

Conflicts of Interest

The authors declare no conflict of interest.

References

  1. Jones, A.P.; Rueter, K.; Siafarikas, A.; Lim, E.M.; Prescott, S.L.; Palmer, D.J. 25-hydroxyvitamin D status of pregnant women is associated with the use of antenatal vitamin supplements and ambient ultraviolet radiation. J. Dev. Orig. Health Dis. 2016, 7, 350–356. [Google Scholar] [CrossRef] [PubMed]
  2. Souberbielle, J.C.; Body, J.J.; Lappe, J.M.; Plebani, M.; Shoenfeld, Y.; Wang, T.J.; Bischoff-Ferrari, H.A.; Cavalier, E.; Ebeling, P.R.; Fardellone, P.; et al. Vitamin D and musculoskeletal health, cardiovascular disease, autoimmunity and cancer: Recommendations for clinical practice. Autoimmun. Rev. 2010, 9, 709–715. [Google Scholar] [CrossRef] [PubMed] [Green Version]
  3. von Hurst, P.R.; Stonehouse, W.; Coad, J. Vitamin D supplementation reduces insulin resistance in South Asian women living in New Zealand who are insulin resistant and vitamin D deficient—A randomised, placebo-controlled trial. Br. J. Nutr. 2010, 103, 549–555. [Google Scholar] [CrossRef] [PubMed] [Green Version]
  4. Holick, M.F. Vitamin D deficiency. N. Engl. J. Med. 2007, 357, 266–281. [Google Scholar] [CrossRef] [PubMed]
  5. Yousef, S.; Elliott, J.; Manuel, D.; Colman, I.; Papadimitropoulos, M.; Hossain, A.; Leclair, N.; Wells, G.A. Study protocol: Worldwide comparison of vitamin D status of immigrants from different ethnic origins and native-born populations—A systematic review and meta-analysis. Syst. Rev. 2019, 8, 211. [Google Scholar] [CrossRef] [PubMed]
  6. Rabenberg, M.; Scheidt-Nave, C.; Busch, M.; Thamm, M.; Rieckmann, N.; Durazo-Arvizu, R.; Dowling, K.; Škrabáková, Z.; Cashman, K.; Sempos, C.; et al. Implications of standardization of serum 25-hydroxyvitamin D data for the evaluation of vitamin D status in Germany, including a temporal analysis. BMC Public Health 2018, 18, 845. [Google Scholar] [CrossRef] [PubMed]
  7. De Rui, M.; Toffanello, E.D.; Veronese, N.; Zambon, S.; Bolzetta, F.; Sartori, L.; Musacchio, E.; Corti, M.C.; Baggio, G.; Crepaldi, G.; et al. Vitamin D deficiency and leisure time activities in the elderly: Are all pastimes the same? PLoS ONE 2014, 9, e94805. [Google Scholar] [CrossRef]
  8. Al-Othman, A.; Al-Musharaf, S.; Al-Daghri Nasser, M.; Krishnaswamy, S.; Yusuf Deqa, S.; Alkharfy Khalid, M.; Al-Saleh, Y.; Al-Attas Omar, S.; Alokail Majed, S.; Moharram, O.; et al. Effect of physical activity and sun exposure on vitamin D status of Saudi children and adolescents. BMC Pediatr. 2012, 12, 92. [Google Scholar] [CrossRef] [Green Version]
  9. Colotta, F.; Jansson, B.; Bonelli, F. Modulation of inflammatory and immune responses by vitamin D. J. Autoimmun. 2017, 85, 78–97. [Google Scholar] [CrossRef]
  10. Swannell, C. Supplement Vitamin D rather than test. MJA InSight 2016, 1, 1. [Google Scholar]
  11. Grant, W.B.; Cross, H.S.; Garland, C.F.; Gorham, E.D.; Moan, J.; Peterlik, M.; Porojnicu, A.C.; Reichrath, J.; Zittermann, A. Estimated benefit of increased vitamin D status in reducing the economic burden of disease in western Europe. Prog. Biophys. Mol. Biol. 2009, 99, 104–113. [Google Scholar] [CrossRef] [PubMed]
  12. Farrell, C.J.; Herrmann, M. Determination of vitamin D and its metabolites. Best Pract. Res. Clin. Endocrinol. Metab. 2013, 27, 675–688. [Google Scholar] [CrossRef] [PubMed]
  13. Jones, K.S.; Schoenmakers, I.; Bluck, L.J.; Ding, S.; Prentice, A. Plasma appearance and disappearance of an oral dose of 25-hydroxyvitamin D2 in healthy adults. Br. J. Nutr. 2012, 107, 1128–1137. [Google Scholar] [CrossRef] [PubMed] [Green Version]
  14. Bailey, D.; Veljkovic, K.; Yazdanpanah, M.; Adeli, K. Analytical measurement and clinical relevance of vitamin D3 C3-epimer. Clin. Biochem. 2013, 46, 190–196. [Google Scholar] [CrossRef] [PubMed]
  15. Yazdanpanah, M.; Bailey, D.; Walsh, W.; Wan, B.; Adeli, K. Analytical measurement of serum 25-OH-vitamin D3, 25-OH-vitamin D2 and their C3-epimers by LC-MS/MS in infant and pediatric specimens. Clin. Biochem. 2013, 46, 1264–1271. [Google Scholar] [CrossRef] [PubMed]
  16. Singh, R.J.; Taylor, R.L.; Reddy, G.S.; Grebe, S.K.G. C-3 epimers can account for a significant proportion of total circulating 25-hydroxyvitamin D in infants, complicating accurate measurement and interpretation of vitamin D status. J. Clin. Endocrinol. Metab. 2006, 91, 3055–3061. [Google Scholar] [CrossRef] [PubMed] [Green Version]
  17. Sempos, C.T.; Vesper, H.W.; Phinney, K.W.; Thienpont, L.M.; Coates, P.M.; Vitamin, D.S.P. Vitamin D status as an international issue: National surveys and the problem of standardization. Scand. J. Clin. Lab. Invest 2012, 243, 32–40. [Google Scholar]
  18. Mineva, E.M.; Schleicher, R.L.; Chaudhary-Webb, M.; Maw, K.L.; Botelho, J.C.; Vesper, H.W.; Pfeiffer, C.M. A candidate reference measurement procedure for quantifying serum concentrations of 25-hydroxyvitamin D3 and 25-hydroxyvitamin D2 using isotope-dilution liquid chromatography-tandem mass spectrometry. Anal. Bioanal. Chem. 2015, 407, 5615–5624. [Google Scholar] [CrossRef]
  19. Black, L.J.; Anderson, D.; Clarke, M.W.; Ponsonby, A.L.; Lucas, R.M. Ausimmune Investigator Group. Analytical bias in the measurement of serum 25-hydroxyvitamin D concentrations impairs assessment of vitamin D status in clinical and research settings. PLoS ONE 2015, 10, e0135478. [Google Scholar] [CrossRef]
  20. Ross, A.C.; Manson, J.E.; Abrams, S.A.; Aloia, J.F.; Brannon, P.M.; Clinton, S.K.; Durazo-Arvizu, R.A.; Gallagher, J.C.; Gallo, R.L.; Jones, G.; et al. The 2011 Dietary Reference Intakes for Calcium and Vitamin D: What dietetics practitioners need to know. J. Am. Diet. Assoc. 2011, 111, 524–527. [Google Scholar] [CrossRef]
  21. Carter, G.D.; Berry, J.L.; Gunter, E.; Jones, G.; Jones, J.C.; Makin, H.L.; Sufi, S.; Wheeler, M.J. Proficiency testing of 25-hydroxyvitamin D (25-OHD) assays. J. Steroid Biochem. Mol. Biol. 2010, 121, 176–179. [Google Scholar] [CrossRef] [PubMed]
  22. Cashman, K.D.; Kiely, M.; Kinsella, M.; Durazo-Arvizu, R.A.; Tian, L.; Zhang, Y.; Lucey, A.; Flynn, A.; Gibney, M.J.; Vesper, H.W.; et al. Evaluation of Vitamin D Standardization Program protocols for standardizing serum 25-hydroxyvitamin D data: A case study of the program’s potential for national nutrition and health surveys. Am. J. Clin. Nutr. 2013, 97, 1235–1242. [Google Scholar] [CrossRef] [PubMed] [Green Version]
  23. Jones, G. Interpreting vitamin D assay results: Proceed with caution. Clin. J. Am. Soc. Nephrol. 2015, 10, 331–334. [Google Scholar] [CrossRef] [PubMed] [Green Version]
  24. Berry, D.J.; Dutton, J.; Fraser, W.D.; Jarvelin, M.R.; Hypponen, E. Harmonization study between LC-MS/MS and Diasorin RIA for measurement of 25-hydroxyvitamin D concentrations in a large population survey. J. Clin. Lab. Anal. 2017, 31, e22049. [Google Scholar] [CrossRef] [PubMed]
  25. Thomas, S.D.; Fudge, A.N.; Whiting, M.; Coates, P.S. The correlation between third-trimester maternal and newborn-serum 25-hydroxy-vitamin D in a selected South Australian group of newborn samples. BMJ Open 2011, 1, e000236. [Google Scholar] [CrossRef] [PubMed] [Green Version]
  26. Gallo, S.; Comeau, K.; Agellon, S.; Vanstone, C.; Sharma, A.; Jones, G.; L’Abbe, M.; Khamessan, A.; Weiler, H.; Rodd, C. Methodological issues in assessing plasma 25-hydroxyvitamin D concentration in newborn infants. Bone 2014, 61, 186–190. [Google Scholar] [CrossRef] [PubMed]
  27. Moy, R.J.; McGee, E.; Debelle, G.D.; Mather, I.; Shaw, N.J. Successful public health action to reduce the incidence of symptomatic vitamin D deficiency. Arch. Dis. Child. 2012, 97, 952–954. [Google Scholar] [CrossRef]
  28. Berti, C.; Agostoni, C.; Davanzo, R.; Hypponen, E.; Isolauri, E.; Meltzer, H.M.; Steegers-Theunissen, R.P.; Cetin, I. Early-life nutritional exposures and lifelong health: Immediate and long-lasting impacts of probiotics, vitamin D., and breastfeeding. Nutr. Rev. 2017, 75, 83–97. [Google Scholar] [CrossRef]
  29. Moon, R.J.; Curtis, E.M.; Cooper, C.; Davies, J.H.; Harvey, N.C. Vitamin D supplementation: Are multivitamins sufficient? Arch. Dis. Child. 2019. [Google Scholar] [CrossRef]
  30. Rueter, K.; Jones, A.P.; Siafarikas, A.; Lim, E.M.; Bear, N.; Noakes, P.S.; Prescott, S.L.; Palmer, D.J. Direct infant UV light exposure is associated with eczema and immune development. J. Allergy Clin. Immunol. 2019, 143, 1012–1020. [Google Scholar] [CrossRef] [Green Version]
  31. Phinney, K.W.; Bedner, M.; Tai, S.S.; Vamathevan, V.V.; Sander, L.C.; Sharpless, K.E.; Wise, S.A.; Yen, J.H.; Schleicher, R.L.; Chaudhary-Webb, M.; et al. Development and certification of a standard reference material for vitamin D metabolites in human serum. Anal. Chem. 2012, 84, 956–962. [Google Scholar] [CrossRef] [PubMed] [Green Version]
  32. Cavalier, E.; Lukas, P.; Bekaert, A.-C.; Carlisi, A.; Le Goff, C.; Delanaye, P.; Souberbielle, J.-C. Analytical and clinical validation of the new Abbot Architect 25(OH)D assay: Fit for purpose? Clin. Chem. Lab. Med. 2017, 55, 378–384. [Google Scholar] [CrossRef] [PubMed]
  33. Clarke, M.W.; Tuckey, R.C.; Gorman, S.; Holt, B.J.; Hart, P.H. Optimized 25-hydroxyvitamin D analysis using liquid–liquid extraction with 2D separation with LC/MS/MS detection, provides superior precision compared to conventional assays. Metabolomics 2013, 9, 1031–1040. [Google Scholar] [CrossRef]
  34. Nowson, C.A.; McGrath, J.J.; Ebeling, P.R.; Haikerwal, A.; Daly, R.M.; Sanders, K.M.; Seibel, M.J.; Mason, R.S. Vitamin D and health in adults in Australia and New Zealand: A position statement. Med. J. Aust. 2012, 196, 686–687. [Google Scholar] [CrossRef]
  35. Australian Bureau of Statistics. 4364.0.55.006—Australian Health Survey: Biomedical Results for Nutrients, 2011–2012. Available online: http://www.abs.gov.au/ausstats/[email protected]/Lookup/4364.0.55.006Chapter2002011-12 (accessed on 30 August 2019).
  36. Holick, M.F.; Binkley, N.C.; Bischoff-Ferrari, H.A.; Gordon, C.M.; Hanley, D.A.; Heaney, R.P.; Murad, M.H.; Weaver, C.M. Endocrine Society. Evaluation, treatment, and prevention of vitamin D deficiency: An Endocrine Society clinical practice guideline. J. Clin. Endocrinol. Metab. 2011, 96, 1911–1930. [Google Scholar] [CrossRef] [Green Version]
  37. Paxton, G.A.; Teale, G.R.; Nowson, C.A.; Mason, R.S.; McGrath, J.J.; Thompson, M.J.; Siafarikas, A.; Rodda, C.P.; Munns, C.F. Vitamin D and health in pregnancy, infants, children and adolescents in Australia and New Zealand: A position statement. Med. J. Aust. 2013, 198, 142–143. [Google Scholar] [CrossRef] [Green Version]
  38. Lai, J.K.; Lucas, R.M.; Banks, E.; Ponsonby, A.L. Ausimmune Investigator Group. Variability in vitamin D assays impairs clinical assessment of vitamin D status. Intern. Med. J. 2012, 42, 43–50. [Google Scholar] [CrossRef] [Green Version]
  39. Zahedi Rad, M.; Neyestani, T.R.; Nikooyeh, B.; Shariatzadeh, N.; Kalayi, A.; Khalaji, N.; Gharavi, A. Competitive protein-binding assay-based enzyme-immunoassay method, compared to high-pressure liquid chromatography, has a very lower diagnostic value to detect vitamin D deficiency in 9–12 years children. Int. J. Prev. Med. 2015, 6, 67. [Google Scholar]
  40. Lai, J.K.; Lucas, R.M.; Clements, M.S.; Roddam, A.W.; Banks, E. Hip fracture risk in relation to vitamin D supplementation and serum 25-hydroxyvitamin D levels: A systematic review and meta-analysis of randomised controlled trials and observational studies. BMC Public Health 2010, 10, 331. [Google Scholar] [CrossRef] [Green Version]
  41. Carter, G.D. Accuracy of 25-hydroxyvitamin D assays: Confronting the issues. Curr. Drug Targets 2011, 12, 19–28. [Google Scholar] [CrossRef]
  42. Hollis, B.W. Assessment of vitamin D status and definition of a normal circulating range of 25-hydroxyvitamin D. Curr. Opin. Endocrinol. Diabetes Obes. 2008, 15, 489–494. [Google Scholar] [CrossRef] [PubMed]
  43. Ozdemir, A.A.; Ercan Gundemir, Y.; Kucuk, M.; Yildiran Sarici, D.; Elgormus, Y.; Cag, Y.; Bilek, G. Vitamin D deficiency in pregnant women and their infants. J. Clin. Res. Pediatr. Endocrinol. 2018, 10, 44–50. [Google Scholar] [CrossRef] [PubMed]
  44. Saraf, R.; Morton, S.M.; Camargo, C.A., Jr.; Grant, C.C. Global summary of maternal and newborn vitamin D status—A systematic review. Matern Child Nutr. 2016, 12, 647–668. [Google Scholar] [CrossRef] [PubMed]
  45. Alonso, A.; Rodriguez, J.; Carvajal, I.; Prieto, M.A.; Rodriguez, R.M.; Perez, A.M.; Cepeda, A.; Nuno, F.; Santos, F. Collaborative Group on Prophylaxis with Vitamin D in Asturias. Prophylactic vitamin D in healthy infants: Assessing the need. Metabolism 2011, 60, 1719–1725. [Google Scholar] [CrossRef]
  46. Ziegler, E.E.; Nelson, S.E.; Jeter, J.M. Vitamin D supplementation of breastfed infants: A randomized dose-response trial. Pediatr. Res. 2014, 76, 177–183. [Google Scholar] [CrossRef]
  47. Gallo, S.; Comeau, K.; Vanstone, C.; Agellon, S.; Sharma, A.; Jones, G.; L’abbe, M.; Khamessan, A.; Rodd, C.; Weiler, H. Effect of different dosages of oral vitamin D supplementation on vitamin D status in healthy, breastfed infants: A randomized trial. JAMA 2013, 309, 1785–1792. [Google Scholar] [CrossRef] [Green Version]
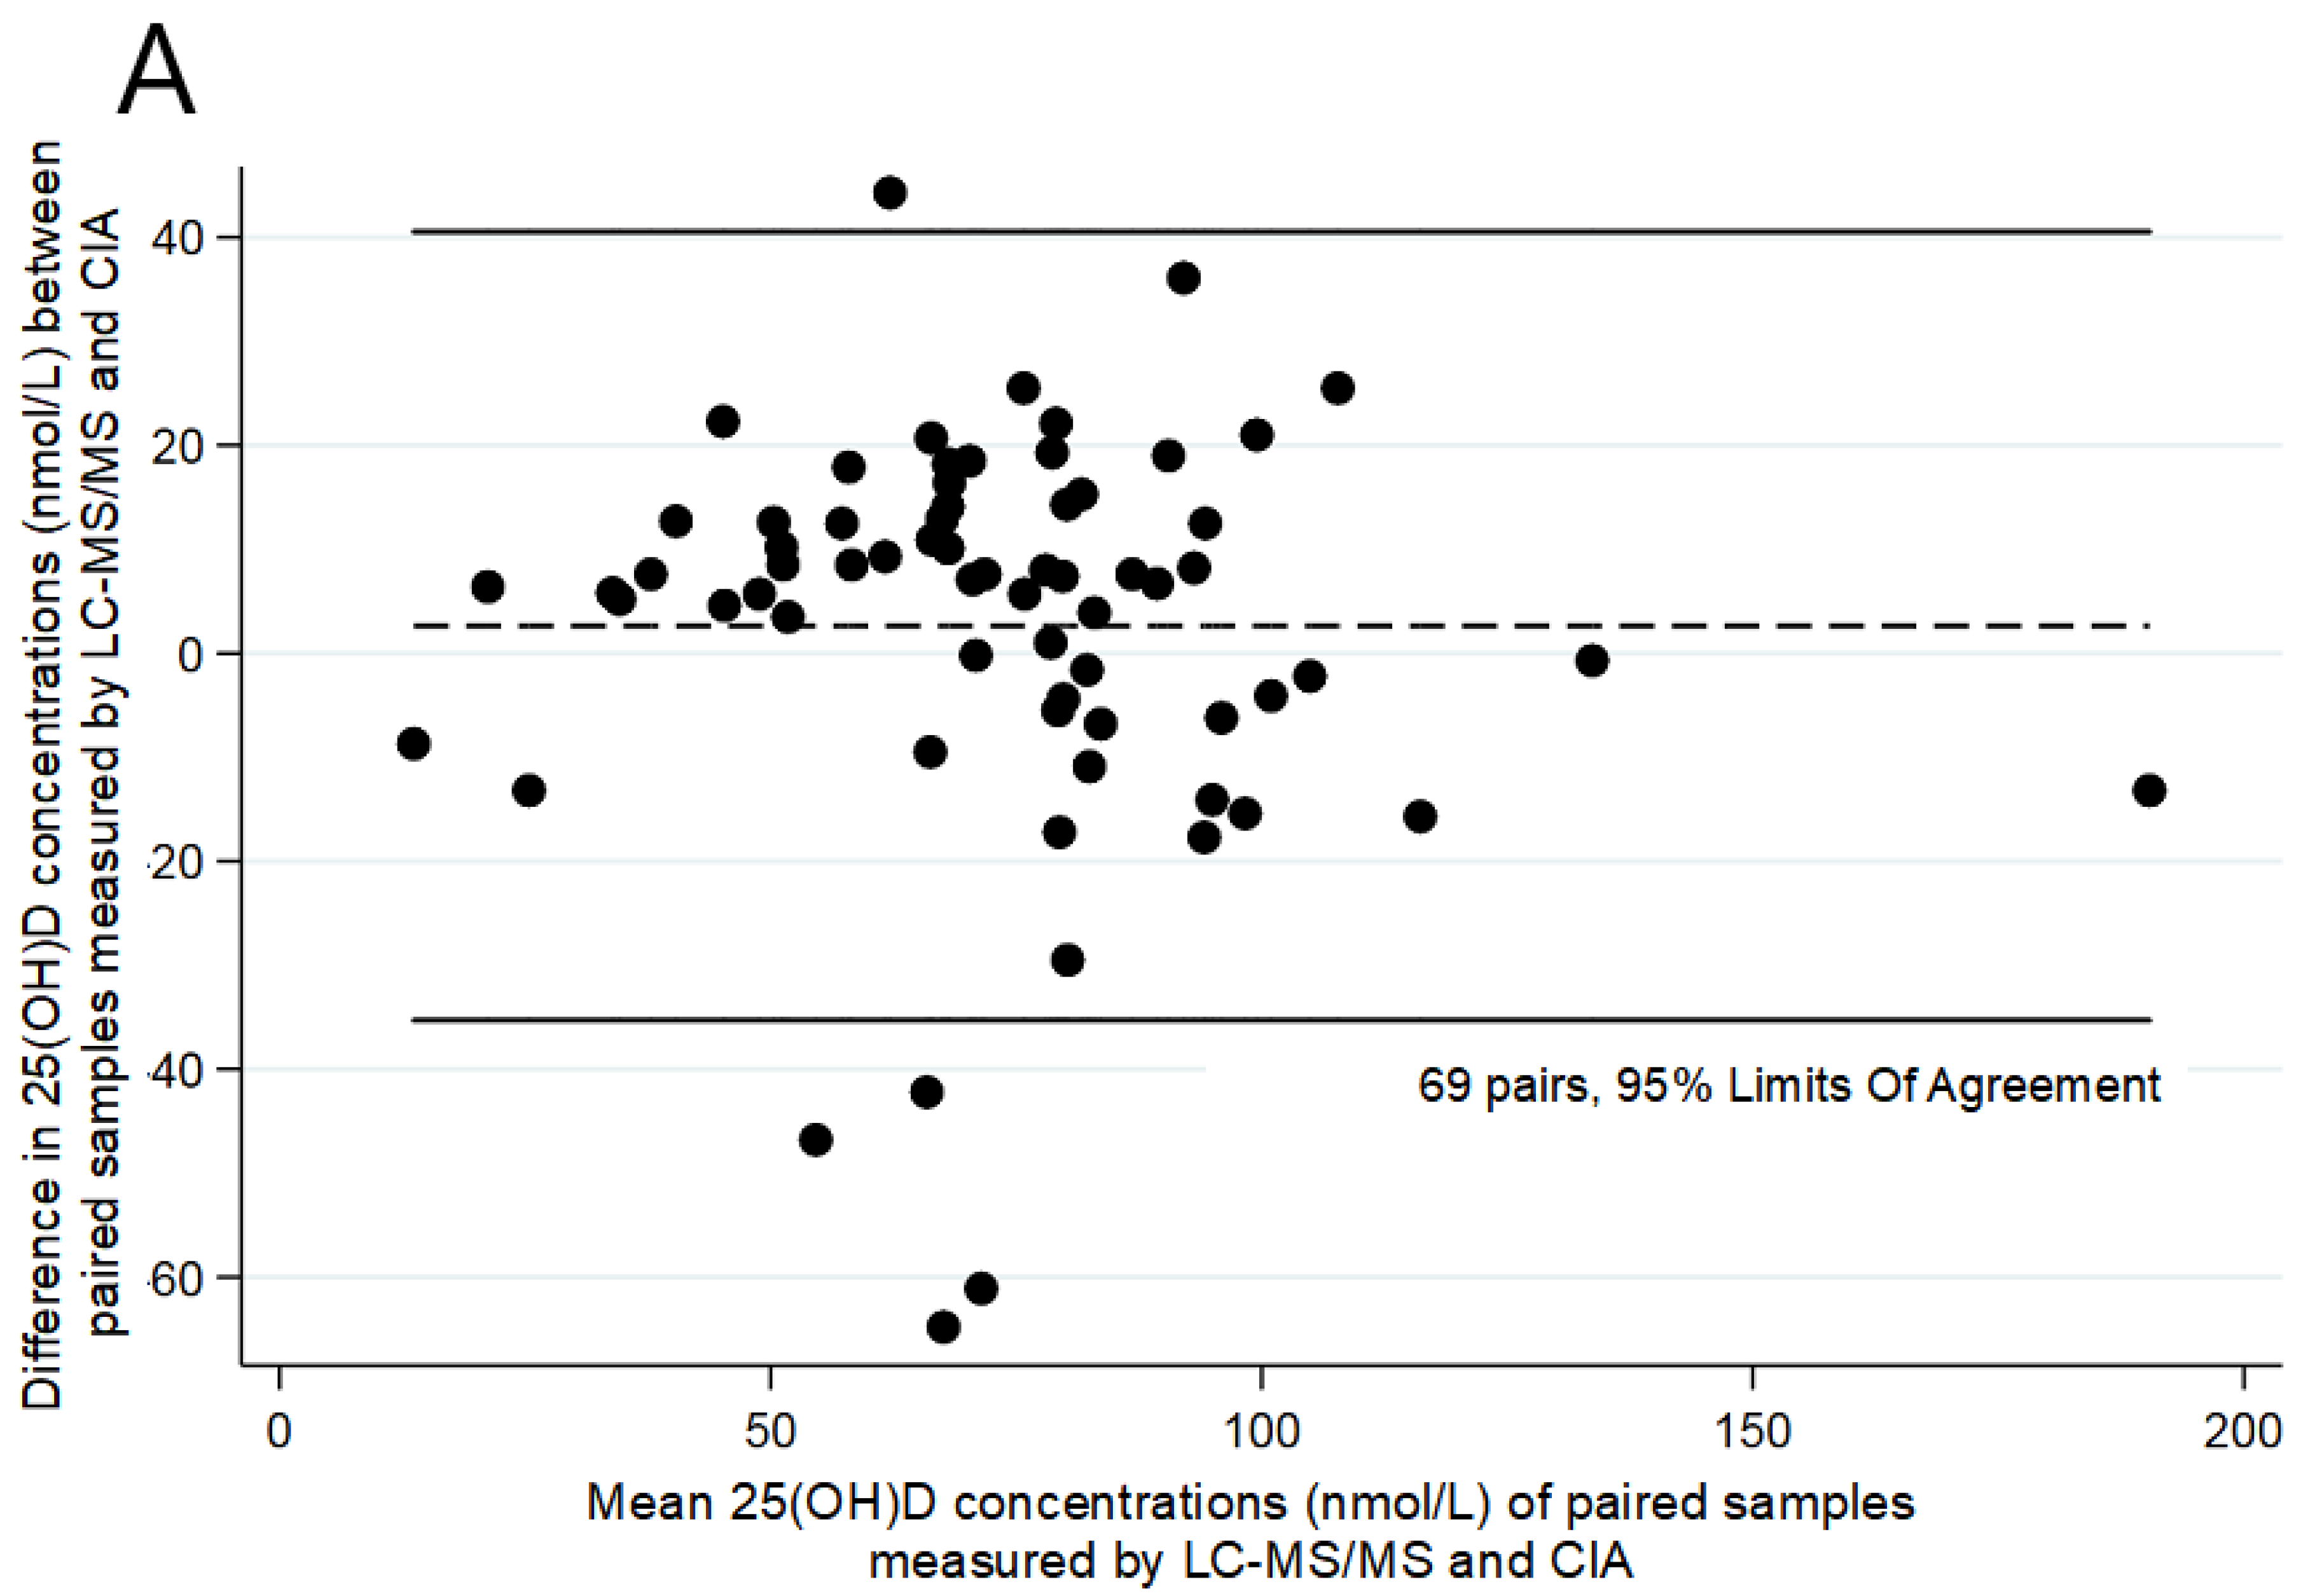
Figure 1. Comparison of 25(OH)D concentrations in paired samples at three months of age using two different assays: (A) Bland–Altman plot; (B) Concordance analysis; 25(OH)D, 25-hydroxyvitamin D; Lin’s correlation = 0.760 (0.659–0.860, p < 0.001).
Ijerph 17 00412 g001aIjerph 17 00412 g001b
Figure 2. Comparison of assays in paired samples at six months of age: (A) Difference between two parallel analyses using Bland–Altman plots; (B) Concordance analysis; Lin’s correlation = 0.710 (0.610–0.810, p < 0.001).
Ijerph 17 00412 g002aIjerph 17 00412 g002b
Figure 3. Comparison of assays in paired samples at 12 months of age: (A) Difference between two parallel analyses using Bland–Altman plots; (B) Concordance analysis; Lin’s correlation = 0.694 (0.578–0.811, p < 0.001).
Ijerph 17 00412 g003aIjerph 17 00412 g003b
Table 1. Descriptive statistics for plasma 25(OH)D concentrations reported by chemiluminescent immunoassay (CIA) and liquid chromatography–tandem mass spectrometry (LC–MS/MS).
AssaynRange (nmol/L)Mean (nmol/L)SD (nmol/L)Mean (SD) Difference between Laboratories
Age: 3 months
CIA6918.00–97.0072.1628.81
LC–MS/MS
C3-epimer
699.30–183.80
2.40–33.00
74.79
11.11
27.43
7.40
+2.63 (19.35)
Age: 6 months
CIA7926.00–182.0086.9129.29
LC–MS/MS
C3-epimer
7925.80–149.80
2.60–36.00
93.23
10.92
22.18
7.32
+6.32 (19.04)
Age: 12 months
CIA7342.00–167.0076.1921.83
LC–MS/MS
C3-epimer
7336.00–125.60
1.80–16.20
76.62
4.53
18.19
2.56
+0.43 (15.71)
SD, standard deviation.
Table 2. Individual plasma 25(OH)D concentrations of infants with inconsistent measurements at the cut-off point for vitamin D deficiency comparing CIA and LC–MS/MS data.
AgeCIA (nmol/L)LC–MS/MS (nmol/L)
3 months40 *84.3 (9 )
46 *56.2 (3.6 )
44 *56.6 (6.9 )
49 *66.9 (15 )
49 *53.5 (2.6 )
34 *56.3 (5.3 )
46 *51.7 (4.3 )
7831.2 * (4.0 )
10240.9 * (3.4 )
8935.2 * (3.6 )
8744.8 * (2.4 )
6 months36 *120.8 (2.7 )
34 *55.6 (4.4 )
46 *55.4 (3.8 )
45 *66.2 (4.8 )
26 *89.3 (10.6 )
12 months44 *52.2 (2.4 )
42 *63.3 (3.0 )
* Below the cut-off point for vitamin D deficiency (25(OH)D <50 nmol/L); including C3-epimeric form.