Season, Terrestrial Ultraviolet Radiation, and Markers of Glucose Metabolism in Children Living in Perth, Western Australia


Abstract

1. Introduction
2. Methods
2.1. Study Population
2.2. Physical Examination and Weight Classification
2.3. Markers of Glucose Metabolism
2.4. Season and Daily Terrestrial UVR
2.5. Statistical Analyses
3. Results
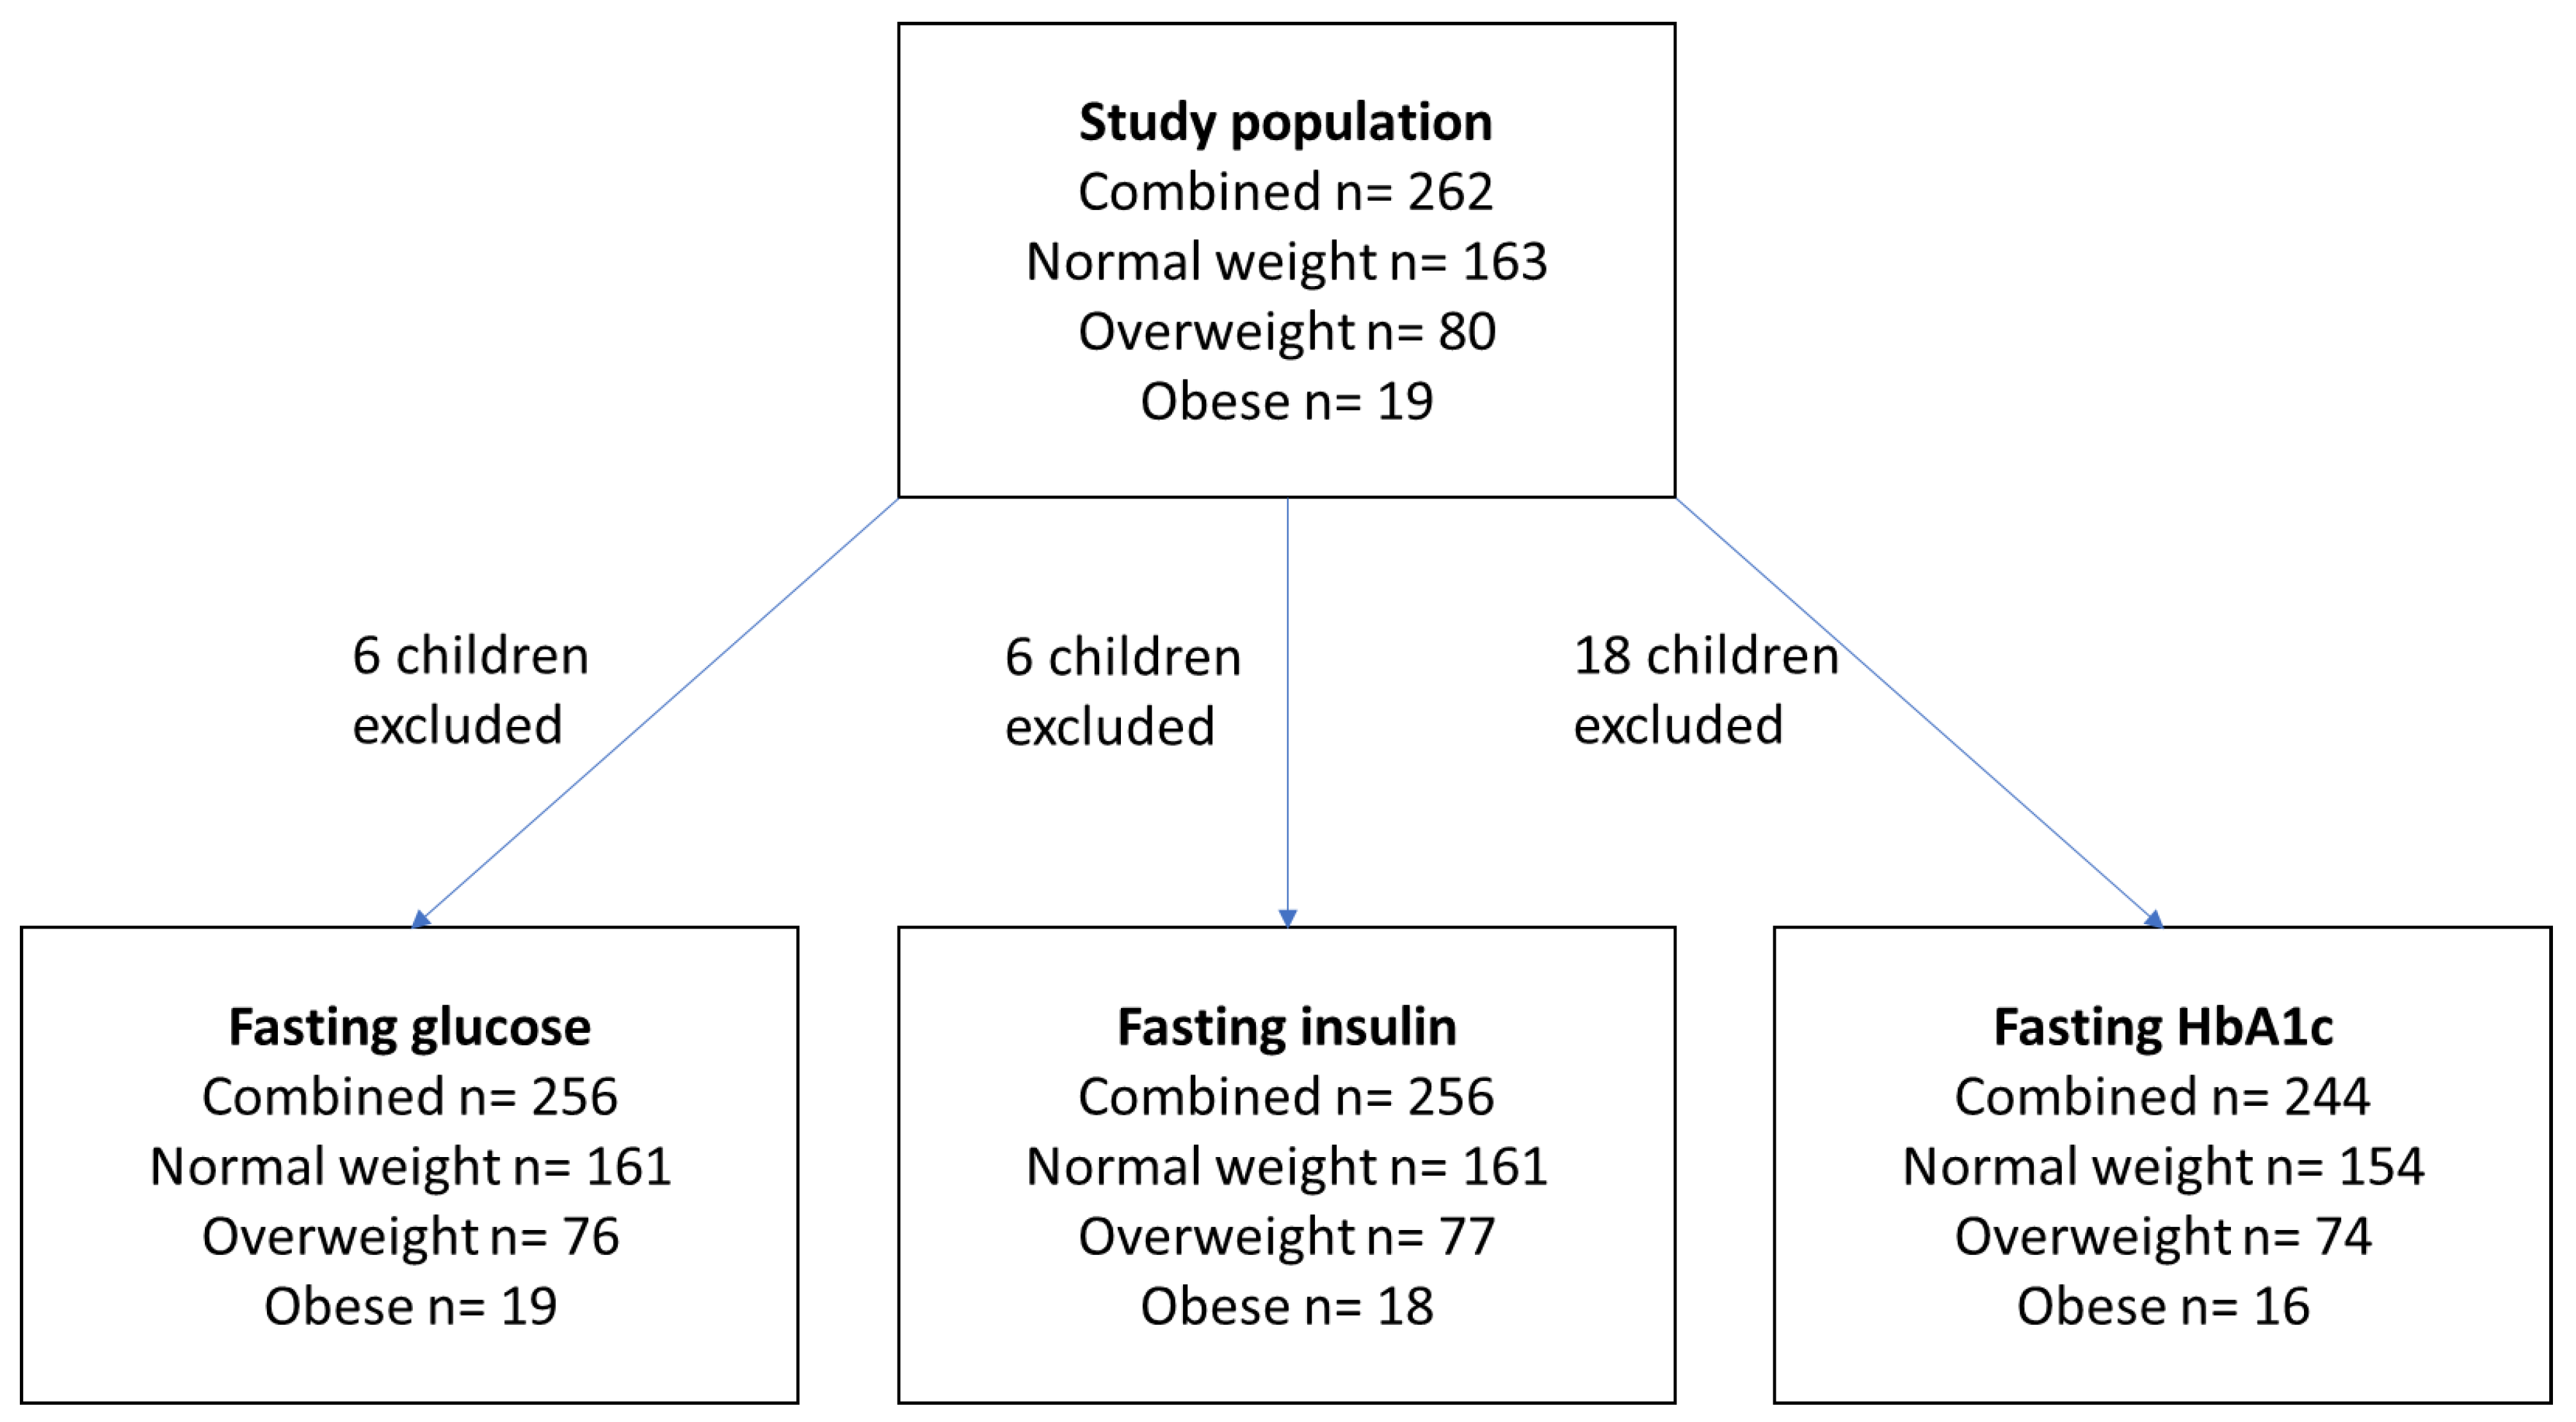
3.1. Population
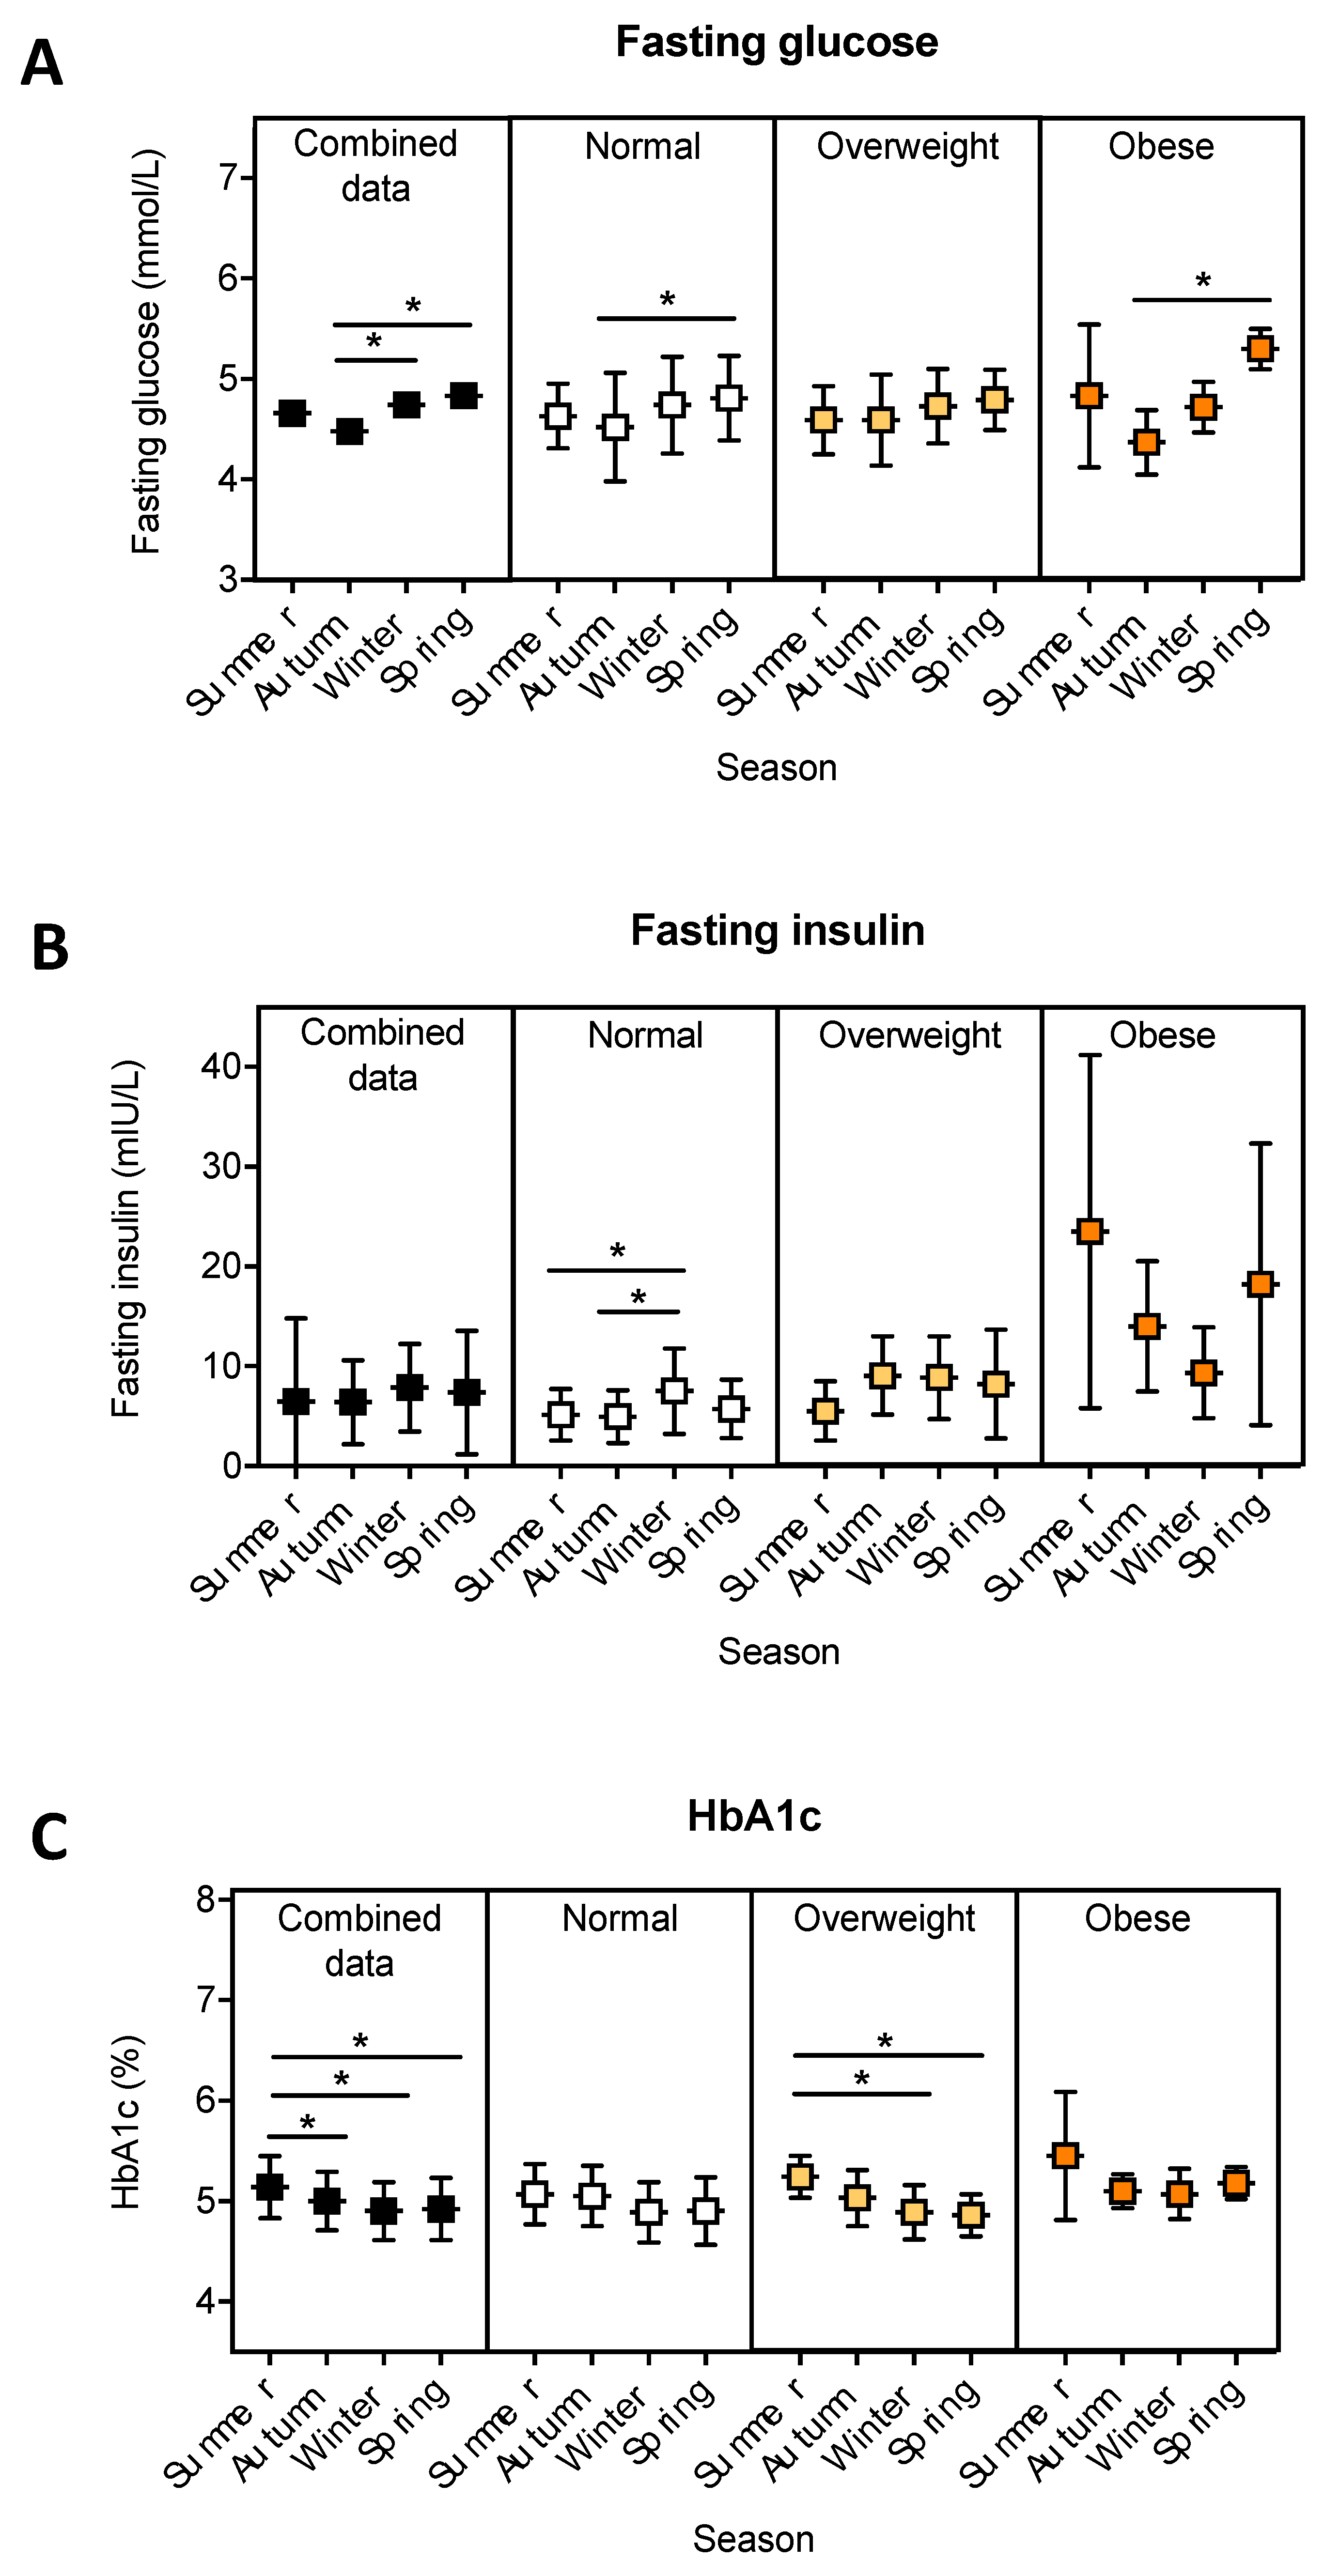
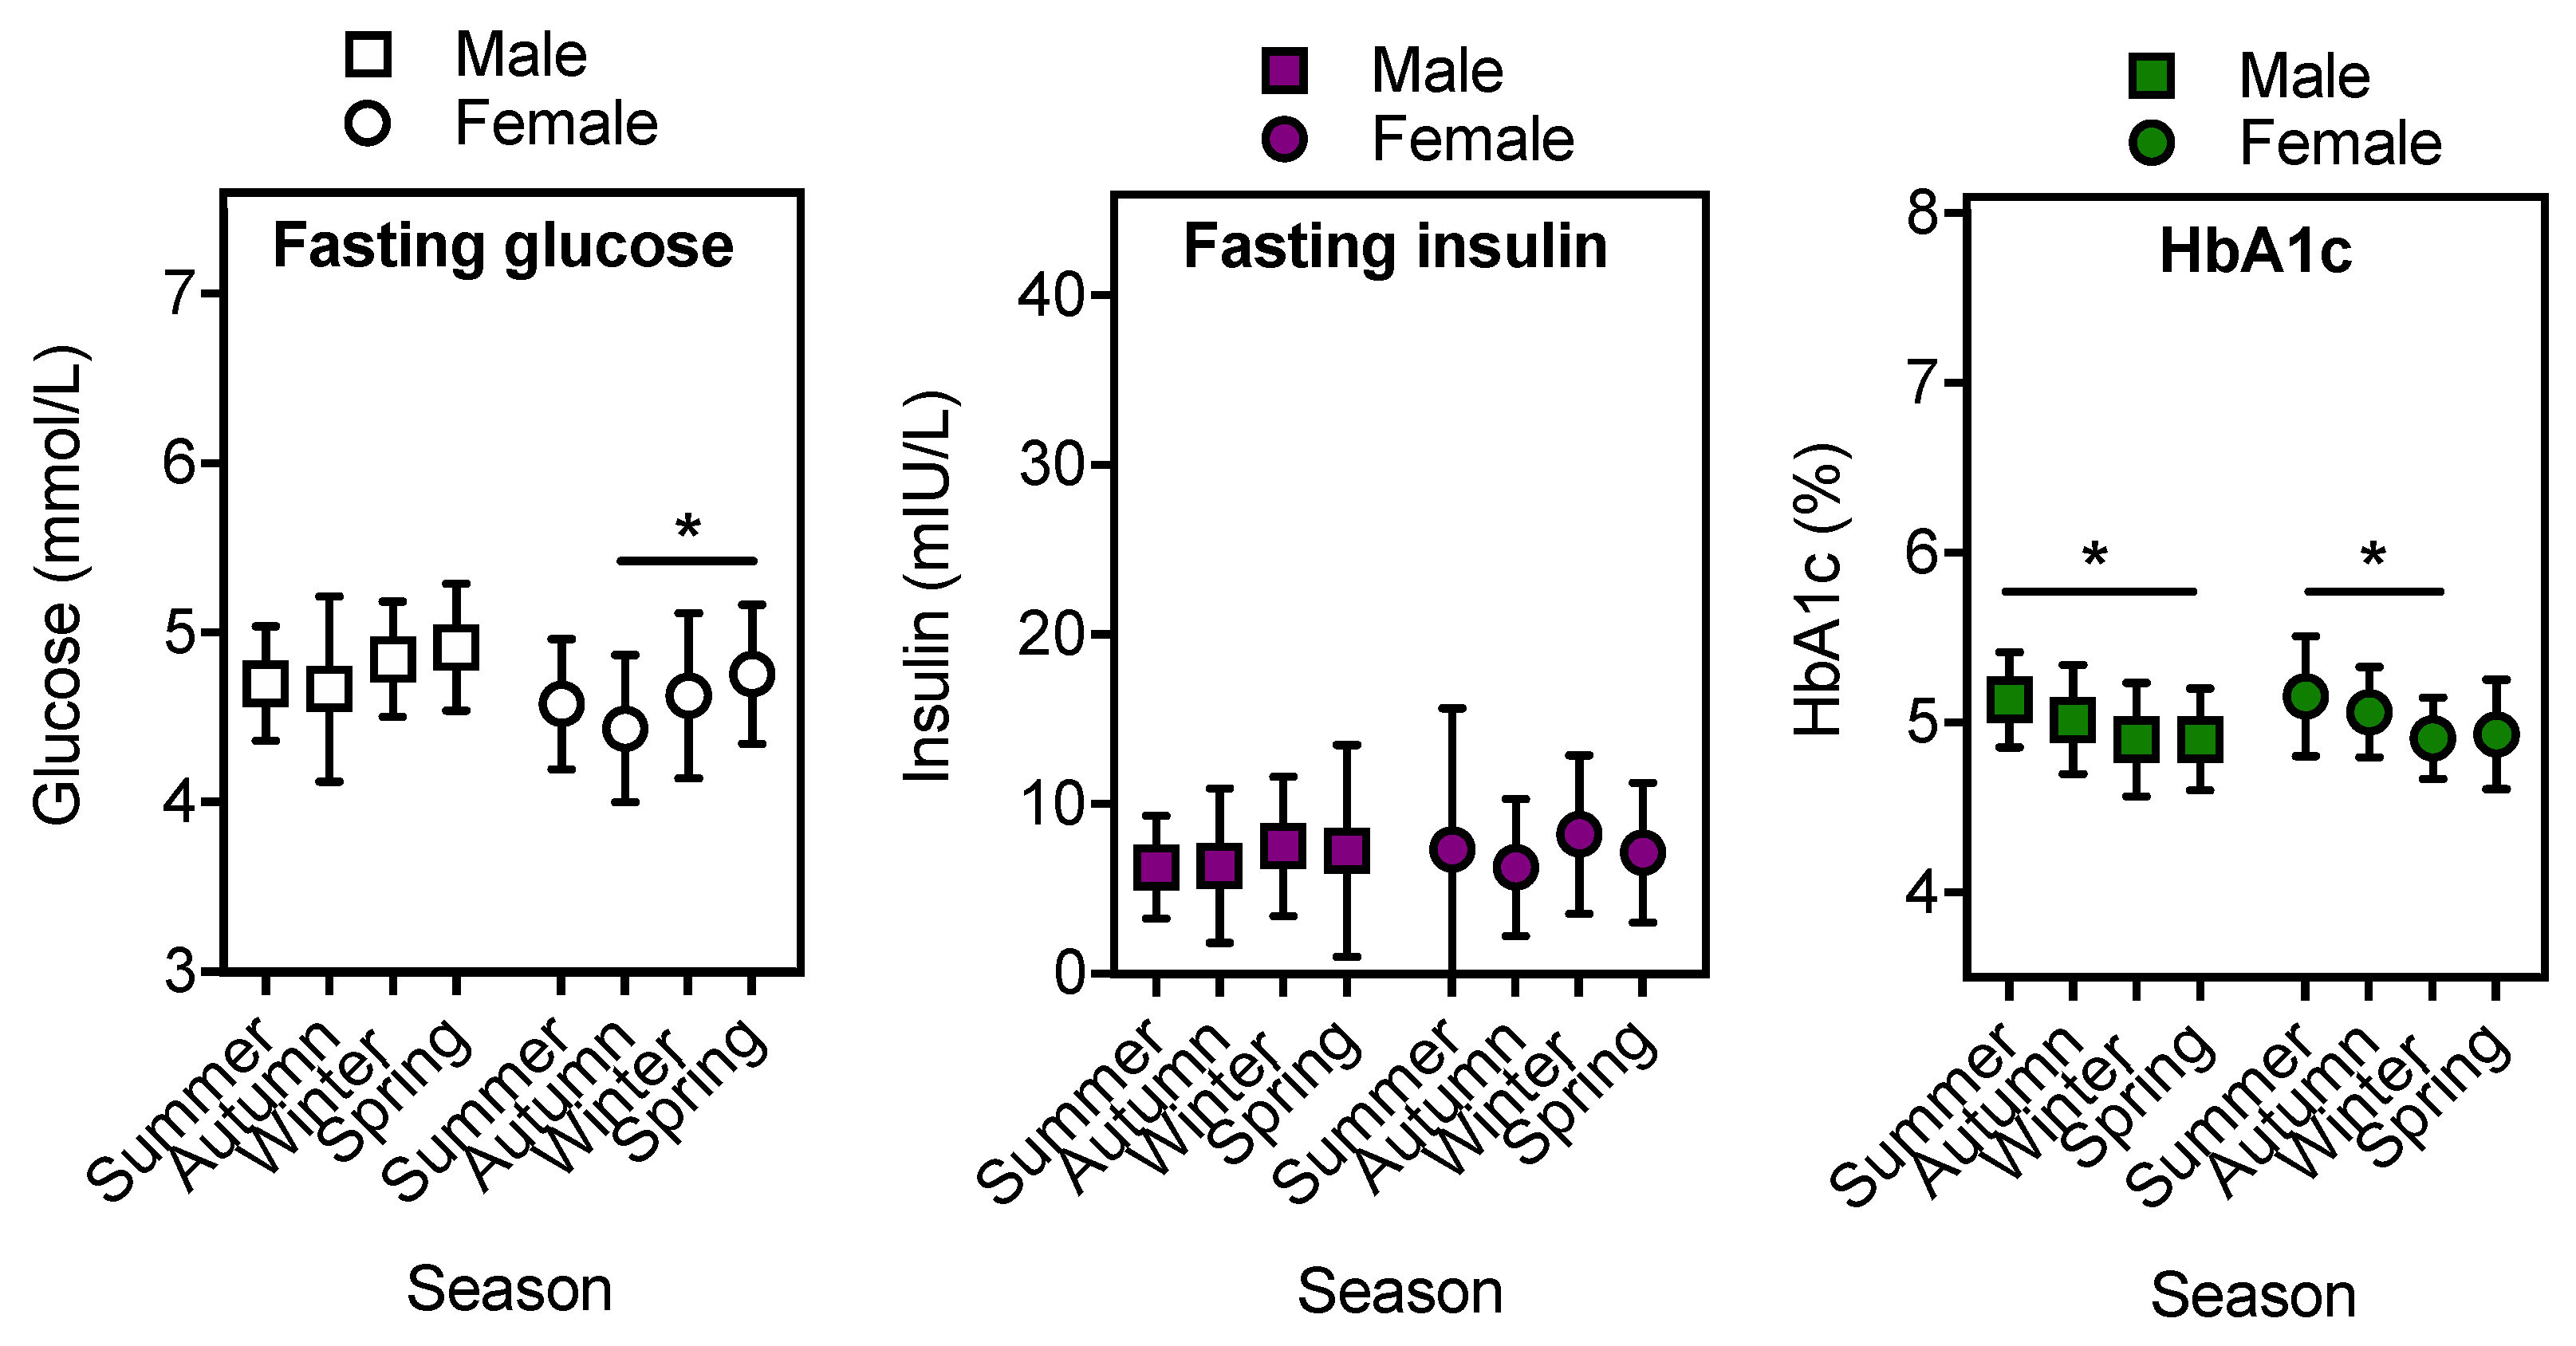
3.2. The Relationship between Season and Fasting Blood Glucose, Insulin and HbA1c.
3.3. Terrestrial UVR and Fasting Glucose, Insulin and HbA1c.
4. Discussion
5. Conclusions
Author Contributions
Funding
Acknowledgments
Conflicts of Interest
Abbreviations
References
- Nolan, C.J.; Damm, P.; Prentki, M. Type 2 diabetes across generations: From pathophysiology to prevention and management. Lancet 2011, 378, 169–181. [Google Scholar] [CrossRef]
- Wilmot, E.; Idris, I. Early onset type 2 diabetes: Risk factors, clinical impact and management. Ther. Adv. Chronic Dis. 2014, 5, 234–244. [Google Scholar] [CrossRef] [PubMed]
- Haynes, A.; Kalic, R.; Cooper, M.; Hewitt, J.K.; Davis, E.A. Increasing incidence of type 2 diabetes in Indigenous and non-Indigenous children in Western Australia, 1990–2012. Med. J. Aust. 2016, 204, 303. [Google Scholar] [CrossRef] [PubMed]
- Australian Institute of Health and Welfare. Type 2 Diabetes in Australia’s Children and Young People: A Working Paper. Available online: https://www.aihw.gov.au/reports/diabetes/type-2-diabetes-children-young-people/contents/summary (accessed on 29 July 2019).
- Kao, K.T.; Sabin, M.A. Type 2 diabetes mellitus in children and adolescents. Aust. Fam. Phys. 2016, 45, 401–406. [Google Scholar]
- Tremblay, M.; LeBlanc, A.G.; Kho, M.E.; Saunders, T.J.; Larouche, R.; Colley, R.C.; Goldfield, G.; Connor Gorber, S. Systematic review of sedentary behaviour and health indicators in school-aged children and youth. Int. J. Behav. Nutr. Phys. Act. 2011, 8, 98. [Google Scholar] [CrossRef] [PubMed]
- Shore-Lorenti, C.; Brennan, S.L.; Sanders, K.M.; Neale, R.E.; Lucas, R.M.; Ebeling, P.R. Shining the light on Sunshine: A systematic review of the influence of sun exposure on type 2 diabetes mellitus-related outcomes. Clin. Endocrinol. (Oxf.) 2014, 81, 799–811. [Google Scholar] [CrossRef]
- Geldenhuys, S.; Hart, P.H.; Endersby, R.; Jacoby, P.; Feelisch, M.; Weller, R.B.; Matthews, V.; Gorman, S. Ultraviolet radiation suppresses obesity and symptoms of metabolic syndrome independently of vitamin D in mice fed a high-fat diet. Diabetes 2014, 63, 3759–3769. [Google Scholar] [CrossRef]
- D’Orazio, J.; Jarrett, S.; Amaro-Ortiz, A.; Scott, T. UV radiation and the skin. Int. J. Mol. Sci. 2013, 14, 12222–12248. [Google Scholar] [CrossRef]
- Gikas, A.; Sotiropoulos, A.; Pastromas, V.; Papazafiropoulou, A.; Apostolou, O.; Pappas, S. Seasonal variation in fasting glucose and HbA1c in patients with type 2 diabetes. Prim. Care Diabetes 2009, 3, 111–114. [Google Scholar] [CrossRef]
- Tseng, C.L.; Brimacombe, M.; Xie, M.; Rajan, M.; Wang, H.; Kolassa, J.; Crystal, S.; Chen, T.C.; Pogach, L.; Safford, M. Seasonal patterns in monthly hemoglobin A1c values. Am. J. Epidemiol. 2005, 161, 565–574. [Google Scholar] [CrossRef]
- Mavri, A.; Guzic-Salobir, B.; Salobir-Pajnic, B.; Keber, I.; Stare, J.; Stegnar, M. Seasonal variation of some metabolic and haemostatic risk factors in subjects with and without coronary artery disease. Blood Coagul. Fibrinolysis 2001, 12, 359–365. [Google Scholar] [CrossRef] [PubMed]
- Rose, G. Seasonal variation in blood pressure in man. Nature 1961, 189, 235. [Google Scholar] [CrossRef] [PubMed]
- Al-Tamer, Y.Y.; Al-Hayali, J.M.; Al-Ramadhan, E.A. Seasonality of hypertension. J. Clin. Hypertens. (Greenwich) 2008, 10, 125–129. [Google Scholar] [CrossRef]
- Chung, S.J.; Lee, Y.A.; Hong, H.; Kang, M.J.; Kwon, H.J.; Shin, C.H.; Yang, S.W. Inverse relationship between vitamin D status and insulin resistance and the risk of impaired fasting glucose in Korean children and adolescents: The Korean National Health and Nutrition Examination Survey (KNHANES) 2009–2010. Public Health Nutr. 2014, 17, 795–802. [Google Scholar] [CrossRef] [PubMed]
- Hirschler, V.; Maccallini, G.; Aranda, C.; Fernando, S.; Molinari, C. Association of vitamin D with glucose levels in indigenous and mixed population Argentinean boys. Clin. Biochem. 2013, 46, 197–201. [Google Scholar] [CrossRef]
- Pittas, A.G.; Dawson-Hughes, B.; Sheehan, P.; Ware, J.H.; Knowler, W.C.; Aroda, V.R.; Brodsky, I.; Ceglia, L.; Chadha, C.; Chatterjee, R.; et al. Vitamin D Supplementation and Prevention of Type 2 Diabetes. N. Engl. J. Med. 2019, 381, 520–530. [Google Scholar] [CrossRef] [PubMed]
- He, S.; Yu, S.; Zhou, Z.; Wang, C.; Wu, Y.; Li, W. Effect of vitamin D supplementation on fasting plasma glucose, insulin resistance and prevention of type 2 diabetes mellitus in non-diabetics: A systematic review and meta-analysis. Biomed. Rep. 2018, 8, 475–484. [Google Scholar] [CrossRef]
- Bell, L.M.; Curran, J.A.; Byrne, S.; Roby, H.; Suriano, K.; Jones, T.W.; Davis, E.A. High incidence of obesity co-morbidities in young children: A cross-sectional study. J. Paediatr. Child Health 2011, 47, 911–917. [Google Scholar] [CrossRef]
- Australian Bureau of Meteorology. Climate Statistics for Australian Locations. Available online: http://www.bom.gov.au/climate/averages/tables/cw_009034_All.shtml (accessed on 29 July 2019).
- Cole, T.J.; Flegal, K.M.; Nicholls, D.; Jackson, A.A. Body mass index cut offs to define thinness in children and adolescents: International survey. BMJ 2007, 335, 194. [Google Scholar] [CrossRef]
- Lucas, R.M.; Neale, R.E.; Madronich, S.; McKenzie, R.L. Are current guidelines for sun protection optimal for health? Exploring the evidence. Photochem. Photobiol. Sci. 2018, 17, 1956–1963. [Google Scholar] [CrossRef]
- Li, S.; Zhou, Y.; Williams, G.; Jaakkola, J.J.; Ou, C.; Chen, S.; Yao, T.; Qin, T.; Wu, S.; Guo, Y. Seasonality and temperature effects on fasting plasma glucose: A population-based longitudinal study in China. Diabetes Metab. 2016, 42, 267–275. [Google Scholar] [CrossRef] [PubMed]
- Suarez, L.; Barrett-Connor, E. Seasonal variation in fasting plasma glucose levels in man. Diabetologia 1982, 22, 250–253. [Google Scholar] [CrossRef] [PubMed]
- Behall, K.M.; Scholfield, D.J.; Hallfrisch, J.G.; Kelsay, J.L.; Reiser, S. Seasonal variation in plasma glucose and hormone levels in adult men and women. Am. J. Clin. Nutr. 1984, 40, 1352–1356. [Google Scholar] [CrossRef] [PubMed]
- Fahlen, M.; Oden, A.; Bjorntorp, P.; Tibblin, G. Seasonal influence on insulin secretion in man. Clin. Sci. 1971, 41, 453–458. [Google Scholar] [CrossRef] [PubMed]
- Chen, S.H.; Chuang, S.Y.; Lin, K.C.; Tsai, S.T.; Chou, P. Community-based study on summer-winter difference in insulin resistance in Kin-Chen, Kinmen, Taiwan. J. Chin. Med. Assoc. 2008, 71, 619–627. [Google Scholar] [CrossRef]
- Levy-Marchal, C.; Arslanian, S.; Cutfield, W.; Sinaiko, A.; Druet, C.; Marcovecchio, M.L.; Chiarelli, F.; ESPE-LWPES-ISPAD-APPES-APEG-SLEP-JSPE; Insulin Resistance in Children Consensus Conference Group. Insulin resistance in children: Consensus, perspective, and future directions. J. Clin. Endocrinol. Metab. 2010, 95, 5189–5198. [Google Scholar] [CrossRef]
- Little, R.R.; Sacks, D.B. HbA1c: How do we measure it and what does it mean? Curr. Opin. Endocrinol. Diabetes Obes. 2009, 16, 113–118. [Google Scholar] [CrossRef]
- Gerstl, E.M.; Rabl, W.; Rosenbauer, J.; Grobe, H.; Hofer, S.E.; Krause, U.; Holl, R.W. Metabolic control as reflected by HbA1c in children, adolescents and young adults with type-1 diabetes mellitus: Combined longitudinal analysis including 27,035 patients from 207 centers in Germany and Austria during the last decade. Eur. J. Pediatr. 2008, 167, 447–453. [Google Scholar] [CrossRef]
- Haynes, A.; Bower, C.; Bulsara, M.K.; Jones, T.W.; Davis, E.A. Continued increase in the incidence of childhood Type 1 diabetes in a population-based Australian sample (1985–2002). Diabetologia 2004, 47, 866–870. [Google Scholar] [CrossRef]
- King, L.; Xiang, F.; Swaminathan, A.; Lucas, R.M. Measuring sun exposure in epidemiological studies: Matching the method to the research question. J. Photochem. Photobiol. B 2015, 153, 373–379. [Google Scholar] [CrossRef]


| Demographic Data | Combined Data | Normal Weight | Overweight | Obese |
|---|---|---|---|---|
| Total (n, %) | 262 | 163, 62 | 80, 31 | 19, 7 |
| Age2 | 9.7 ± 1.8 | 9.6 ± 1.9 | 9.8 ± 1.7 | 10.1 ± 1.5 |
| Males (n, %) | 122, 47 | 79, 48 | 30, 38 | 13, 68 |
| Females (n, %) | 140, 53 | 84, 52 | 50, 63 | 6, 32 |
| Glycaemic data (mean ± SD) | Combined data | Normal weight | Overweight | Obese |
| Fasting glucose 2 (mmol/L) | 4.7 ± 0.5 | 4.7 ± 0.5 | 4.7 ± 0.4 | 4.7 ± 0.5 |
| Fasting insulin 2 (mU/L) | 7.2 ± 5.0 | 6.0 ± 3.5 | 8.1 ± 4.3 | 14.7 ± 10.2 |
| HbA1c 2 (%) | 5.0 ± 0.3 | 5.0 ± 0.3 | 5.0 ± 0.3 | 5.2 ± 0.3 |
| Daily terrestrial UVR3 (SED 1) | Combined data | Normal weight | Overweight | Obese |
| Past week 2 | 26.5 ± 15.6 | 27.3 ± 16.1 | 24.8 ± 14.5 | 27.6 ± 16.7 |
| Past 2 weeks 2 | 26.6 ± 15.4 | 27.1 ± 15.4 | 25.7 ± 15.5 | 26.9 ± 15.9 |
| Past 4 weeks 2 | 27.0 ± 15.6 | 27.3 ± 15.5 | 26.6 ± 16.0 | 26.7 ± 15.0 |
| Past 3 months 2 | 30.2 ± 16.0 | 30.1 ± 15.5 | 31.0 ± 17.4 | 28.3 ± 13.6 |
| Past 6 months 2 | 34.6 ± 12.6 | 34.2 ± 12.7 | 35.9 ± 12.7 | 32.9 ± 12.0 |
| Daily terrestrial UVR 3 (SED) | Summer | Autumn | Winter | Spring |
| 59 ± 10.6 | 27 ± 12.6 | 13 ± 4.3 | 37 ± 12.8 |
| A. Fasting Blood Glucose (mmol/L). | |||||
|---|---|---|---|---|---|
| Terrestrial UVR (SED) | Combined n = 256 | Normal Weight n = 161 | Overweight n = 76 | Obese n = 19 | |
| Previous week | ß ± SE | −0.003 ± 0.002 | −0.003 ± 0.002 | −0.006 ± 0.003 | 0.008 ± 0.007 |
| p-value (r) | 0.057 (−0.119) | 0.094 (−0.132) | 0.076 (−0.205) | 0.296 (0.253) | |
| Previous 2 weeks | ß ± SE | −0.004 ± 0.002 | −0.004 ± 0.002 | -0.006 ± 0.003 | 0.007 ± 0.007 |
| p-value (r) | 0.036 (−0.131) | 0.066 (−0.145) | 0.113 (−0.183) | 0.601 (0.128) | |
| Previous 4 weeks | ß ± SE | −0.005 ± 0.002 | −0.005 ± 0.002 | −0.007 ± 0.003 | 0.004 ± 0.007 |
| p-value (r) | 0.016 (−0.151) | 0.036 (−0.165) | 0.095 (−0.193) | 0.735 (0.0832) | |
| Previous 3 months | ß ± SE | −0.007 ± 0.002 | −0.007 ± 0.002 | −0.007 ± 0.003 | −0.010 ± 0.007 |
| p-value (r) | 0.0003 (−0.226) | 0.003 (−0.234) | 0.100 (−0.19) | 0.117 (−0.372) | |
| Previous 6 months | ß ± SE | −0.009 ± 0.002 | −0.008 ± 0.003 | −0.007 ± 0.004 | −0.026 ± 0.007 |
| p-value (r) | <0.0001 (−0.281) | 0.0006 (−0.269) | 0.069 (−0.210) | 0.002 (−0.672) | |
| B. Fasting insulin (mU/L). | |||||
| Terrestrial UVR (SED) | Combined n = 256 | Normal Weight n = 161 | Overweight n = 77 | Obese n = 18 | |
| Previous week | ß ± SE | −0.026 ± 0.020 | −0.045 ± 0.017 | −0.071 ± 0.033 | 0.240 ± 0.140 |
| p-value (r) | 0.003 (−0.185) | 0.014 (−0.193) | 0.031 (−0.246) | 0.117 (0.383) | |
| Previous 2 weeks | ß ± SE | −0.027 ± 0.020 | −0.048 ± 0.017 | −0.064 ± 0.031 | 0.26 ± 0.15 |
| p-value (r) | 0.003 (−0.186) | 0.009 (−0.206) | 0.024 (−0.257) | 0.145 (0.358) | |
| Previous 4 weeks | ß ± SE | −0.033 ± 0.020 | −0.054 ± 0.017 | −0.059 ± 0.030 | 0.24 ± 0.15 |
| p-value (r) | 0.0007 (−0.208) | 0.002 (−0.242) | 0.030 (−0.247) | 0.117 (0.383) | |
| Previous 3 months | ß ± SE | −0.046 ± 0.020 | −0.059 ± 0.017 | −0.039 ± 0.028 | 0.076 ± 0.17 |
| p-value (r) | 0.004 (−0.177) | 0.005 (−0.220) | 0.319 (−0.115) | 0.449 (0.190) | |
| Previous 6 months | ß ± SE | −0.046 ± 0.025 | −0.039 ± 0.022 | −0.006 ± 0.039 | −0.20 ± 0.20 |
| p-value (r) | 0.126 (−0.095) | 0.084 (−0.137) | 0.798 (0.030) | 0.575 (−0.142) | |
| Terrestrial UVR (SED) | Combined n=244 | Normal Weight n = 154 | Overweight n = 74 | Obese n = 16 | |
|---|---|---|---|---|---|
| Previous week | ß ± SE | 0.002 ± 0.001 | 0.001 ± 0.002 | 0.004 ± 0.002 | 0.006 ± 0.004 |
| p-value (r) | 0.062 (0.120) | 0.294 (0.085) | 0.084 (0.202) | 0.539 (0.165) | |
| Previous 2 weeks | ß ± SE | 0.002 ± 0.001 | 0.001 ± 0.002 | 0.004 ± 0.002 | 0.006 ± 0.004 |
| p-value (r) | 0.027 (0.142) | 0.204 (0.103) | 0.086 (0.201) | 0.450 (0.202) | |
| Previous 4 weeks | ß ± SE | 0.003 ± 0.001 | 0.002 ± 0.002 | 0.004 ± 0.002 | 0.006 ± 0.005 |
| p-value (r) | 0.020 (0.149) | 0.127 (0.124) | 0.084 (0.202) | 0.607 (0.138) | |
| Previous 3 months | ß ± SE | 0.003 ± 0.001 | 0.003 ± 0.002 | 0.004 ± 0.002 | 0.002 ± 0.006 |
| p-value (r) | 0.003 (0.191) | 0.035 (0.170) | 0.013 (0.288) | 0.968 (0.011) | |
| Previous 6 months | ß ± SE | 0.003 ± 0.002 | 0.003 ± 0.002 | 0.005 ± 0.003 | −0.007 ± 0.006 |
| p-value (r) | 0.044 (0.129) | 0.097 (0.134) | 0.062 (0.218) | 0.339 (−0.254) | |
© 2019 by the authors. Licensee MDPI, Basel, Switzerland. This article is an open access article distributed under the terms and conditions of the Creative Commons Attribution (CC BY) license (http://creativecommons.org/licenses/by/4.0/).
Share and Cite
Clarke, C.L.; Bell, L.M.; Gies, P.; Henderson, S.; Siafarikas, A.; Gorman, S. Season, Terrestrial Ultraviolet Radiation, and Markers of Glucose Metabolism in Children Living in Perth, Western Australia. Int. J. Environ. Res. Public Health 2019, 16, 3734. https://doi.org/10.3390/ijerph16193734
Clarke CL, Bell LM, Gies P, Henderson S, Siafarikas A, Gorman S. Season, Terrestrial Ultraviolet Radiation, and Markers of Glucose Metabolism in Children Living in Perth, Western Australia. International Journal of Environmental Research and Public Health. 2019; 16(19):3734. https://doi.org/10.3390/ijerph16193734
Chicago/Turabian StyleClarke, Catherine L., Lana M. Bell, Peter Gies, Stuart Henderson, Aris Siafarikas, and Shelley Gorman. 2019. "Season, Terrestrial Ultraviolet Radiation, and Markers of Glucose Metabolism in Children Living in Perth, Western Australia" International Journal of Environmental Research and Public Health 16, no. 19: 3734. https://doi.org/10.3390/ijerph16193734
APA StyleClarke, C. L., Bell, L. M., Gies, P., Henderson, S., Siafarikas, A., & Gorman, S. (2019). Season, Terrestrial Ultraviolet Radiation, and Markers of Glucose Metabolism in Children Living in Perth, Western Australia. International Journal of Environmental Research and Public Health, 16(19), 3734. https://doi.org/10.3390/ijerph16193734