Exploring the Space of Possibilities in Cascading Disasters with Catastrophe Dynamics


Abstract
1. Introduction
2. Materials and Methods
2.1. Catastrophe Dynamics
2.2. Historical Data Encoding
3. Results
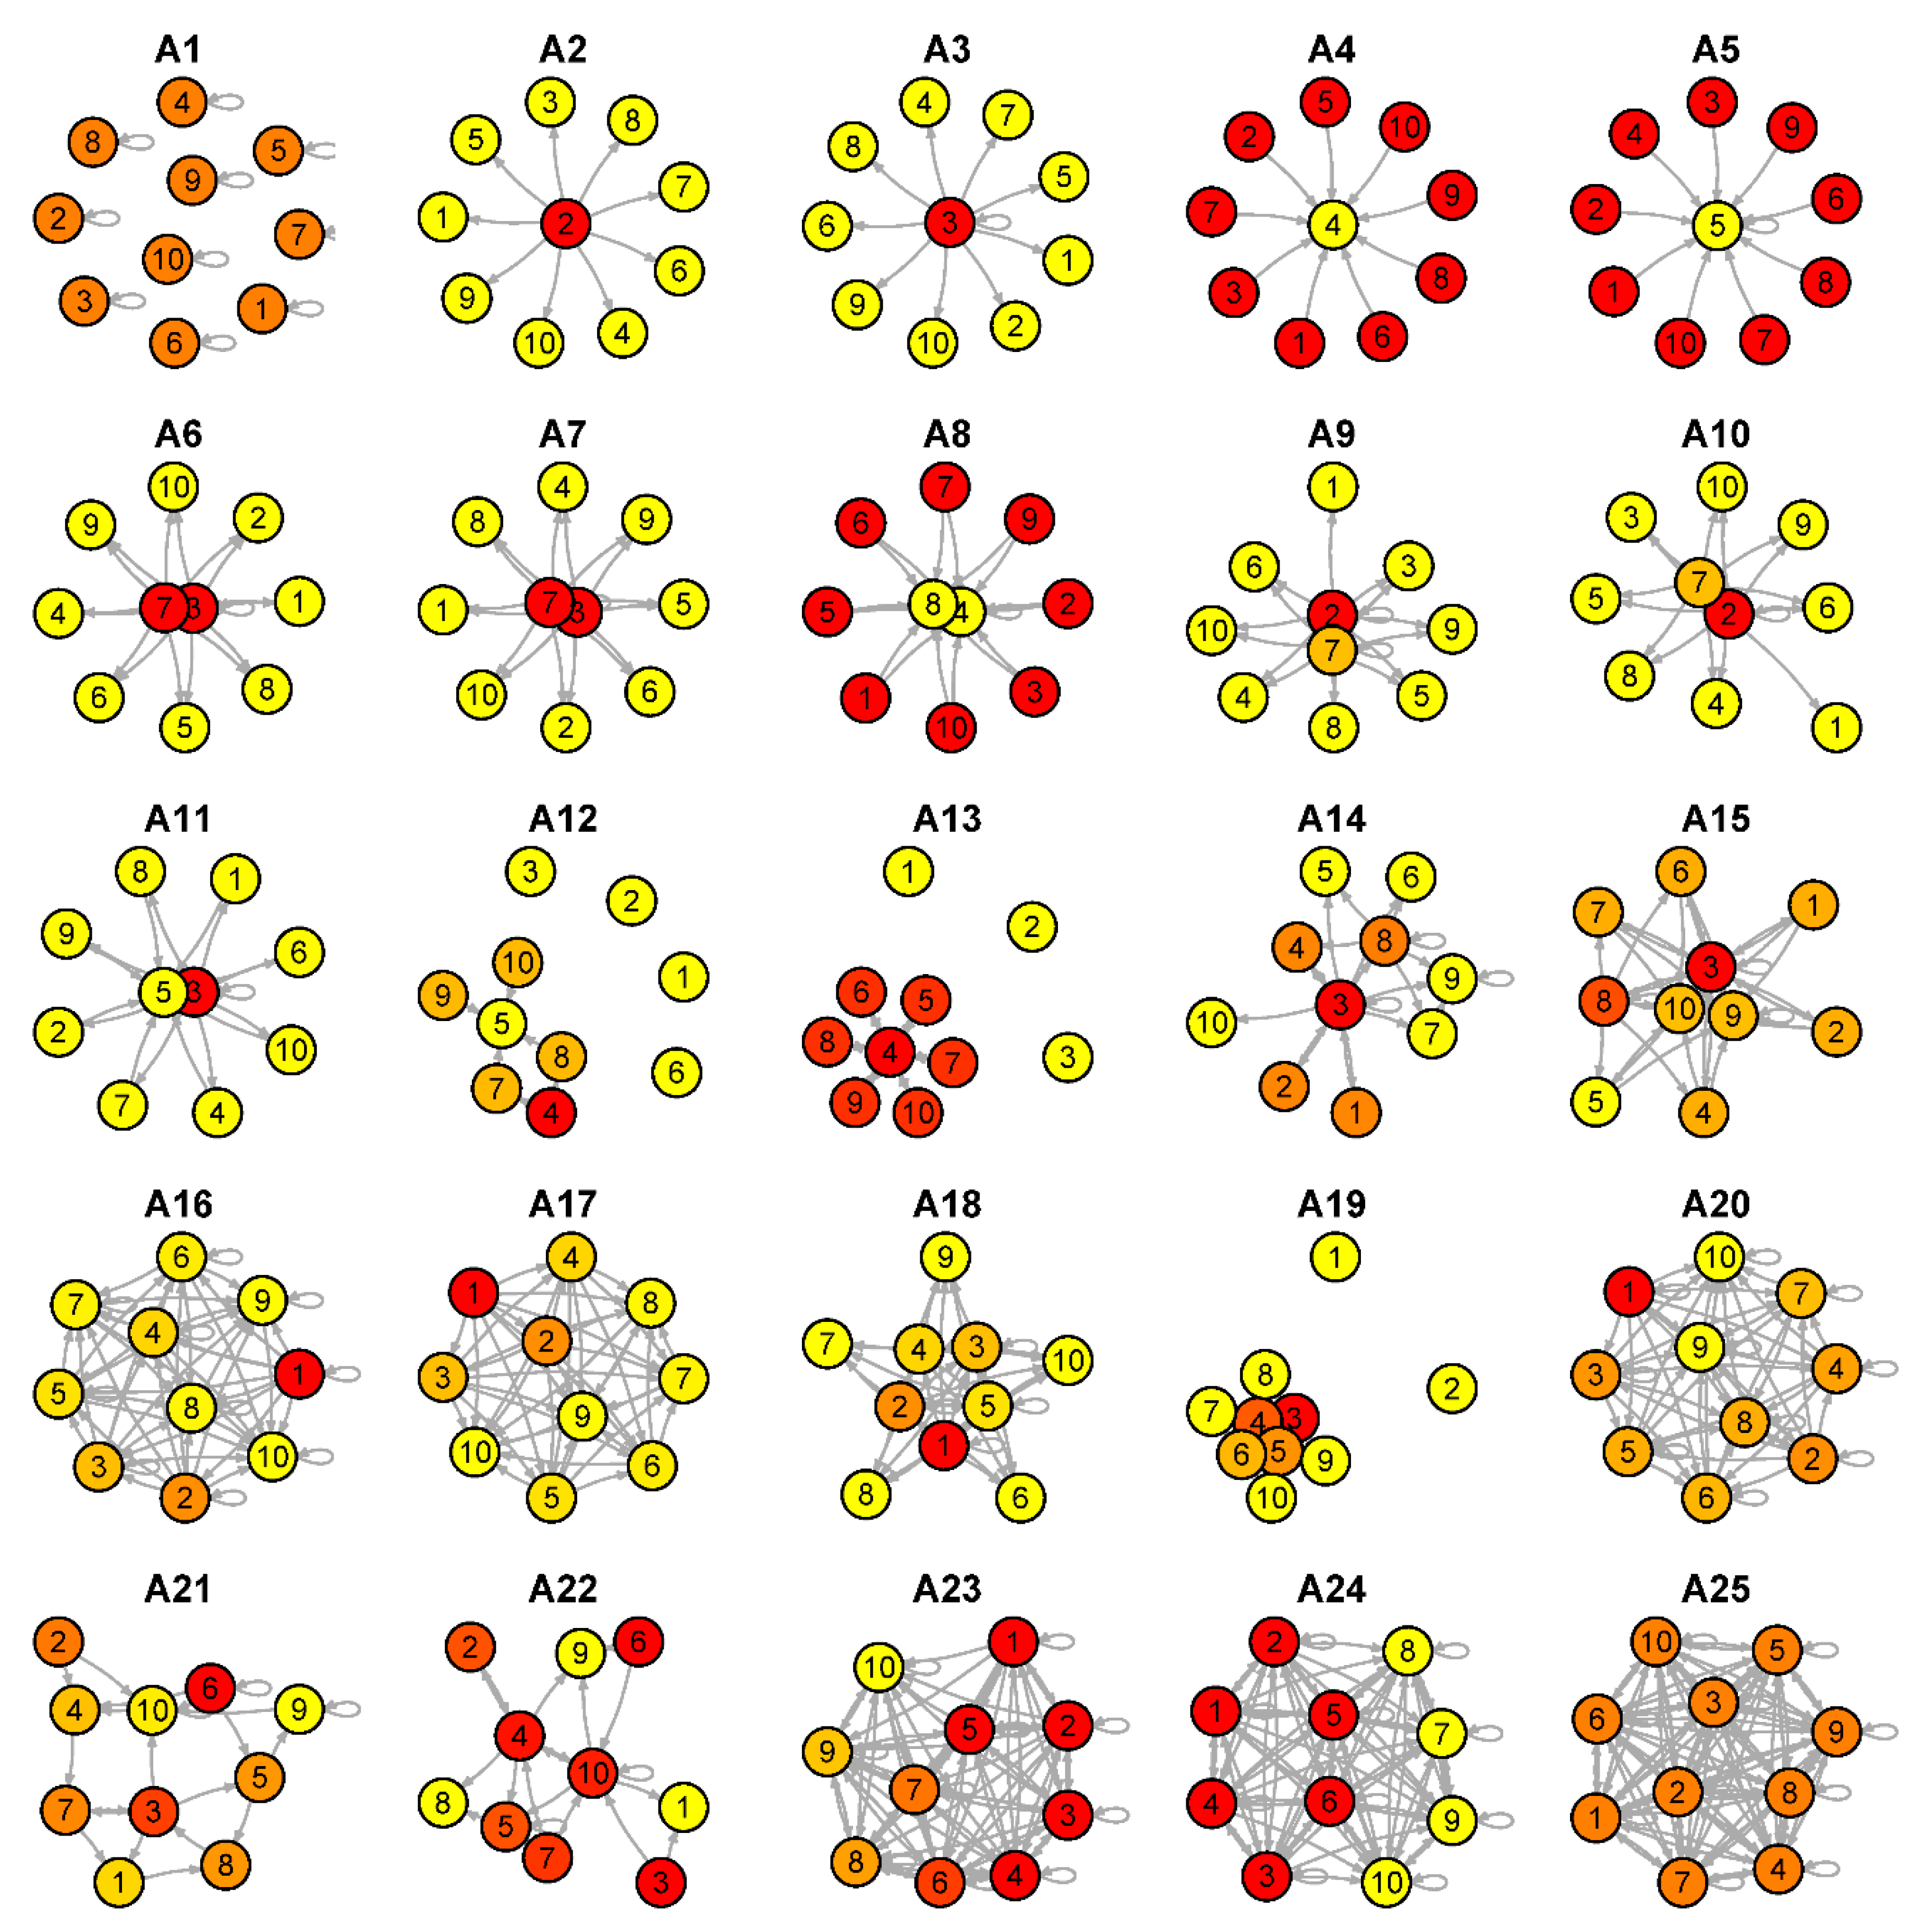
3.1. Topological Characteristics of Cascading Effects
3.2. Application to Cascading Disasters Based on Historical Data
4. Limitations and Future Directions
4.1. Incompleteness Issues in Historical Data
4.2. Beyond One-to-One Links
4.3. The Temporal Evolution of Cascading Phenomena
4.4. The Concept of Unit Time in the Current Framework
5. Conclusions
Author Contributions
Funding
Acknowledgments
Conflicts of Interest
Appendix A
- 2011 Tohoku earthquake, Japan: “the main quake triggered a massive, destructive tsunami [...] The violent shock {led} to subsidence of about 1.2 m [and] potentially more severe flood risk [...] in the future” [40] (p. 35); “Several nuclear power plants and thermal power plants were heavily damaged [...] causing outages”; earthquake and tsunami affected the transportation system, ruined farmland, caused decline in global automobile production, and significant fluctuations in the global financial markets [40] (p. 36); “the cooling system of the first nuclear power plant in Fukushima also stopped working because of the impact of the tsunami [...] the nuclear accident gradually became a level 7 nuclear event” [40] (pp. 37–38).
- 2008 Wenchuan earthquake, China: “Landslides and rock avalanches triggered by the earthquake produced 257 landslide lakes” [41] (p. 209); “Sudden landslide dam failure and resulting outburst floods were common” [41] (p. 210); “landslides and rock falls [...] hampered search and rescue operations due to blocked access routes” [42] (p. 243); “The Wenchuan earthquake caused extensive damage to and outage of electric-power, gas and water-supply systems, forcing many industrial plants to interrupt production” [42] (p. 246); “fertiliser plants [...] heavily damaged and are reported to have resulted in significant ammonia, sulphuric acid and other releases [as well as] breathing difficulties” [42] (p. 247); “Over 138,000 businesses were damaged during the earthquake, leading to extensive business interruption” [43] (p. 1); “The train, including 13 tank cars filled with gasoline, derailed and burst into flames Monday in Gansu province when the quake cut a major rail line” [44]
- 2004 Sumatra earthquake, Indonesia: “earthquake generated the most devastating tsunami [...] More deaths are possible due to poor sanitation” [45] (p. 543); “The unstable faultline triggered powerful aftershocks” [45] (p. 544); “The Indian Ocean tsunami severely affected tourism and fishing infrastructure [, also] utilities and lifelines; transportation networks; and communication” [45] (p. 551); “salt water contaminated drinking water supplies and farm fields” [45] (p. 553); “Two volcanic eruptions [...] that followed the disastrous M9.3 earthquake [...] raise the question of whether there eruptions were triggered by the earthquake. Here we present new evidence to suggest [so]” [46] (p. 539).
- 1994 Northridge earthquake, USA: “additional effect of the rock falls and rosk slides in the Santa Susana Mountains was an outbreak of valley fever (coccidioidomycosis), which can only be contracted by inhaling airborne dust containing the fungal spores that cause the disease” [33] (p. S331).
- 1923 Kanto earthquake, Japan: “the force of the earthquake had broken water pipes, it was impossible for fire fighters to control the outbreak of fires” [31] (p. 880); “rumours alleged that ‘Koreans detonated bombs which caused the fires’ [...] some vigilantes turned violent and began actively hunting and killing innocent Koreans” [31] (p. 882); “In the wake of the earthquake, [...] the government considered the psychological aspects of reinvigorating not just Tokyo, but the entire nation. In order to reach the nation on an ideological level and ‘renew people’s minds’ [...] for counteracting undesirable social trends” [31] (p. 891); “Public utilities, including running water, and waste removal services were slow to recover [following the earthquake]. As a result sanitary conditions deteriorated rapidly [...] Water-borne infectious diseases spread rapidly [...] (typhoid and dysentery)” [47] (p. 107); ‘Yokohama Burning: The Deadly 1923 Earthquake and Fire that Helped Forge the Path to World War II’ [48].
- 1906 San Francisco earthquake, USA: “Most of the damage was not done by the tremor itself [...] but by the fires that followed [...] The combination of close quarters, highly flammable building materials, and earthquake-damaged water mains hampered the efforts of firefighters” [49] (p. 7); “The quake’s impact manifested itself in international gold flows [which] threatened the fixed sterling-dollar exchange rate, leading the Bank of England to raise interest rates and discriminate against American finance bills [and] resulting contraction pushed the United States into recession, setting the stage for the 1907 Panic” [49] (p. 1).
- 2010 Eyjafjallajokull volcanic eruption, Iceland: “A substantial proportion of the world’s air traffic descended into disorder [...] Airlines suffered heavy losses and some went bankrupt” [50] (p. 7).
- 2002 Stromboli volcanic eruption, Italy: “The 2002 Stromboli tsunami was a tidal wave caused by a volcanic eruption [...] The first landslide was around 13:15 [...] The event also forced the Civil Protection to close the island to the tourists” [51].
- 1783 Laki volcanic eruption, Iceland: “People complained that the haze [triggered by the eruption] caused weakness, shortness of breath, and throbbing of the heart [...] Lethal sickness in the grazing livestock [...] in mass deaths [...] livelihood on farming and fishing, the disastrous effects of the eruption led to a famine [...] sulfur smelling haze caused sickness in humans [...] troublesome headaches, respiratory difficulties, and asthma attacks [...] dramatic temperature changes over a period of several hours” [52] (pp. 13-14); “The cold and harsh summer in 1783 was attributed to the presence of the volcanic haze [...] Severe drought was reported [...] The arrival of spring thaw raised the water of all major rivers in central and south Europe to such a degree that floods caused enormous property damage” [52] (pp. 15-16); “These events contributed significantly to an increase of poverty and famine that may have contributed to the French Revolution in 1789” [53].
- 1963 Vajont landslide, Italy: “The mountainside collapsed [...] Blocking the gorge to depths of as much as 400 m, the landslide traveled to 140 m up the opposite bank [...] Having washed back and forth along both sides of the valley, a wave of water overtopped the dam” [54] (p. 23).
- 2011 Thailand floods: “In addition to affected farmland, seven industrial parks were inundated [...] Due to the damage to these industrial parks, the manufacturing sector contributed to 8.6% of the decline of the real GDP” [55] (p. 259); “The decrease in production impacted the sales for the trade partners to which manufactured cars in Thailand are exported” [55] (p. 262).
- 2017 Hurricane Harvey, USA: “The record-breaking rainfall produced by Hurricane Harvey resulted in catastrophic and prolonged impacts on Houston’s transportation infrastructure, inundating entire neighborhoods and rendering them inaccessible to emergency response services” [26] (p. 1).
- 2012 Hurricane Sandy, USA: “most damage resulted from storm surge in New York City during Sandy. The indirect damage due to business interruption resulted primarily from interconnected risks within infrastructures [...] caused extensive damage to electric transmission and distribution infrastructures [...] also damaged the region’s petroleum infrastructures [...] The loss of the electricity and fuel sectors propagated to other sectors. Gas stations in New Jersey could not operate because of the outage. Three health care facilities in Manhattan and Brooklyn had to emergently evacuate all patients due to the outage [...] The collapse of power utilities and petroleum infrastructures triggered failures in other infrastructure systems, such as health care facilities, public transportation systems, the supply of necessities and emergency facilities” [56] (p. 134).
- 2005 Hurricane Katrina, USA: “Hurricane Katrina makes landfall [...] levee breaches in New Orleans, allowing the waters of Lake Pontchartrain to flood the city. Communications fail completely as electrical stations and cell phone base stations are flooded; radio frequencies are overloaded or incompatible for response agencies [...] Food, water, medical care, security are scarce. Reports of violence, looting break out [...] Lifeline systems - water, communications, transportation, electrical power, sanitary sewers, gas distribution systems - are inoperable” [57] (p. 506).
- Great 2008 Chinese Ice Storm: “trains were stranded [...] The disaster damaged 82,000 km of roads across the country. The rain and snowfall lead to the cancelation of 3840 flights across China [...] With all transportation systems frozen, supply chains of energy, food, and other vital goods were broken. Coal reserves reached emergency levels. Power plants had to be shut down. Food shortages occurred [...] The consumer price index nationwide increased by 34%” [58] (p. 339).
- 1977 New York City lightning: “looting and arson [...] accounted for almost one half of the total economic costs associated with the blackout [...] The New York airports were ordered closed at 9:57 p.m., only minutes after the power failure [...] Rescue units were hampered by the inability to obtain fuel dispensed by electric pumps [...] Several other important hospital operations were hampered as a result of key activities not supported by emergency power [...] The sequence of events that began with a lightning stroke at 8:37 p.m. on July 13, 1977” [59] (pp. 44-46).
- Syrian 2006-2010 drought: “When a severe drought began in 2006/2007, the agricultural system in the northeastern ‘bread basket’ region [...] collapsed [...] between 2007 and 2008, drought was a main factor in the unprecedented rise in Syrian food prices [...] increase in nutrition-related diseases [and] mass migration of rural farming families to urban areas ensued [...] The rapidly growing urban peripheries of Syria, marked by illegal settlements, overcrowding, poor infrastructure, unemployment, and crime, were neglected... We conclude that human influences on the climate change [leading to the drought] are implicated in the current Syrian conflict” [60] (pp. 3241–3242).
- 2019-2020 Australian bushfires: “The air quality index [...] hit 2552 or more than 12 times the hazardous level of 200” [61] “The severity of the crisis has prompted widespread interruptions such as highway closures, production stoppages, power outages, as well as flight cancellations and delays - all of which inevitably cause significant disruptions to logistics activity” [62]
- 2020 COVID-19 pandemics: “A global crash in demand from hotels and restaurants has seen prices of agricultural commodities drop by 20%” [15] (p. 185); “Capital market has also been affected. In the US, the S&P 500 [...], the Dow Jones Industrial Average and the Nasdaq fell dramatically [...] The COVID-19 pandemic has caused an unprecedented challenge for healthcare systems worldwide” [15] (pp. 187–188); “Lockdown and social distancing measures to prevent spread of COVID-19 have heightened fears of increased levels of domestic violence” [15] (p. 190); “Concerns regarding potential neurological complications of COVID-19 are being increasingly reported [...] 39 (31%) of 125 patients presented with altered mental status” [63] (p. 1).
- 1989 geomagnetic storm, Canada: “The power blackout due to the March 1989 magnetic storm caused direct costs of tens of millions of dollars to Hydro-Québec because of damage to equipment and loss of sales. However, estimates of lost GDP for Québec are many times that” [36] (p. 549).
- 1986 Basel fire, Switzerland: “The majority of the approximately 1250 t of stored chemicals was destroyed in the fire, but large quantities were introduced into the atmosphere, into the Rhine River through runoff of the fire-fighting water, and into the soil and groundwater at the site” [Giger, 2009] (p. S98); “As a precautionary measure, operations at drinking water utilities along the Rhine had to be temporarily suspended” [64] (p. S98).
- 1986 Chernobyl nuclear disaster, Ukraine: “Immediately following the accident at Chernobyl, humans exposed to high-level radiation suffered from acute radiation sickness [...] Most of the long-term consequences of the Chernobyl disaster stem from the inhalation and ingestion of radionuclides generated by the explosion and nuclear fire” [65] (p. 200); “The genetic consequences of radioactive contamination by the fallout to agricultural crops after the accident at the Chernobyl NPP in 1986 has been studied [...] Analysis of genetic variability in three sequential generations of rye and wheat revealed increased cytogenetic damage in plants exposed” [66] (p. 155).
- 1984 Bhopal chemical industrial accident: “The Bhopal Gas Leak, India 1984 is the largest chemical industrial accident ever. 520,000 persons were exposed to the gases, and up to 8000 died during the first weeks” [67] (p. 1); “The gases immediately affected trees [...] vegetable crops all showed signs of being badly affected” [67] (p. 5, sec. 7.3.6); “75 percent of the workforce was incapable of work, mainly because of breathlessness” [67] (p. 1, sec. 8.5.2); “The day after the leakage, several thousand Bhopal residents tried to storm the factory” [67] (p. 1, sec. 8.6.1); “Communications came to a stop. Key-persons for train and public transports were missing [...] With shops and markets closed, the prices of food went up [...] large protests to the withdrawal of free distribution of rations were organised. This resulted in police violence and arrests” [67] (p. 3, sec. 8.6.2).
- 2003 electrical blackout, Italy: “the electrical blackout that affected much of Italy on 28 September 2003: the shutdown of power stations directly led to the failure of nodes in the Internet communication network, which in turn caused further breakdowns of power stations” [30] (p. 1025).
- 2003 Northeast Blackout, USA: “The blackout caused major disruptions to many facets of life. Commuters stood trapped in subways for hours, restaurants and grocery stores dispensed masses of unprotected perishable food, cars waiting for gas backed up in lines stretching around city blocks, and households had to manage without water service” [69] (p. 184).
- 1992 Los Angeles riots, USA: “The number of fires does not reflect the total number of businesses lost to fire [...] The mini-malls proved to be frequent targets of the disturbance. In addition to injuries and arson damage, the Los Angeles Police Department (LAPD) reported 3330 burglaries [...] A Korean radio station called for Korean vigilantes to patrol the streets [...] Unique to the Los Angeles situation was the manner in which health and fire personnel delivered services during the unrest. Their speed and effectiveness were hampered by their need of police protection” [70] (p. 266).
- 2001 9/11 terrorist attacks, USA: “the direct BI losses were only $12 billion [...] reduction in air travel and related tourism [...] the impact of 9/11 on growth is significant with approximatively a negative 0.5 percentage point impact on GDP per capita growth” [71] (pp. 5–6); “The effective fixing of the meaning of the September 11 attacks in terms of the “War on Terror” substantially circumscribed political debate, and we explain why this discourse became dominant. The Bush administration then capitalized on the existing portrait of Saddam Hussein to bind Iraq tightly into the War on Terror and thereby silence leading Democrats and legitimate the war” [72] (p. 409).
Appendix B


References
- Helbing, D. Globally networked risks and how to respond. Nature 2013, 497, 51–59. [Google Scholar] [CrossRef]
- Gill, J.C.; Malamud, B.D. Reviewing and visualizing the interactions of natural hazards. Rev. Geophys. 2014, 52, 680–722. [Google Scholar] [CrossRef]
- Xu, L.; Meng, X.; Xu, X. Natural hazard chain research in China: A review. Nat. Hazards 2014, 70, 1631–1659. [Google Scholar] [CrossRef]
- Mignan, A.; Scolobig, A.; Sauron, A. Using reasoned imagination to learn about cascading hazards: A pilot study. Disaster Prev. Manag. 2016, 25, 329–344. [Google Scholar] [CrossRef]
- Daniell, J.E.; Schaefer, A.M.; Wenzel, F. Losses Associated with Secondary Effects in Earthquakes. Front. Built Environ. 2017, 3, 30. [Google Scholar] [CrossRef]
- Kumasaki, M.; Hara, T.; Nakajima, N.; Wada, Y.; Makino, R. The classification of physical effects from natural hazards for Natech risk assessment based on a Japanese database. J. Loss Prev. Process Ind. 2017, 50, 308–316. [Google Scholar] [CrossRef]
- Zuccaro, G.; De Gregorio, D.; Leone, M.F. Theoretical model for cascading effects analyses. Int. J. Disaster Risk Reduct. 2018, 30, 199–215. [Google Scholar] [CrossRef]
- AghaKouchak, A.; Huning, L.S.; Chiang, F.; Sadegh, M.; Vahedifard, F.; Mazdiyasni, O.; Moftakhari, H.; Mallakpour, I. How do natural hazards cascade to cause disasters? Nature 2018, 561, 458–460. [Google Scholar] [CrossRef]
- Komendantova, N.; Mrzyglocki, R.; Mignan, A.; Khazai, B.; Wenzel, F.; Patt, A.; Fleming, K. Multi-hazard and multi-risk decision-support tools as a part of participatory risk governance: Feedback from civil protection stakeholders. Int. J. Disaster Risk Reduct. 2014, 8, 50–67. [Google Scholar] [CrossRef]
- Mignan, A.; Komendantova, N.; Scolobig, A.; Fleming, K. Multi-Risk Assessment and Governance. In Handbook of Disaster Risk Reduction & Management; Chapter 14; Madu, C.N., Kuei, C.-H., Eds.; World Scientific Publishing: Singapore, 2017; pp. 357–381. [Google Scholar] [CrossRef]
- Scolobig, A.; Komendantova, N.; Mignan, A. Mainstreaming Multi-Risk Approaches into Policy. Geosciences 2017, 7, 129. [Google Scholar] [CrossRef]
- Mignan, A.; Danciu, L.; Giardini, D. Reassessment of the Maximum Fault Rupture Length of Strike-Slip Earthquakes and Inference on Mmax in the Anatolian Peninsula, Turkey. Seismol. Res. Lett. 2015, 86, 890–900. [Google Scholar] [CrossRef]
- Marano, K.D.; Wald, D.J.; Allen, T.I. Global earthquake casualties due to secondary effects: A quantitative analysis for improving rapid loss analysis. Nat. Hazards 2010, 52, 319–328. [Google Scholar] [CrossRef]
- Argyroudis, S.A.; Fotopoulou, S.; Karafagka, S.; Pitiliakis, K.; Selva, J.; Salzano, E.; Basco, A.; Crowley, H.; Rodrigues, D.; Matos, J.P.; et al. A risk-based multi-level stress test methodology: Application to six critical non-nuclear infrastructures in Europe. Nat. Hazards 2020, 100, 595–633. [Google Scholar] [CrossRef]
- Nicola, M.; Alsafi, Z.; Sohrabi, C.; Kerwan, A.; Al-Jabir, A.; Iosifidis, C.; Agha, M.; Agha, R. The socio-economic implications of the coronavirus pandemic (COVID-19): A review. Int. J. Surg. 2020, 78, 185–193. [Google Scholar] [CrossRef]
- Tang, P.; Xia, Q.; Wang, Y. Addressing cascading effects of earthquakes in urban areas from network perspective to improve disaster mitigation. Int. J. Disaster Risk Reduct. 2019, 35, 10165. [Google Scholar] [CrossRef]
- Mignan, A.; Danciu, L.; Giardini, D. Considering large earthquake clustering in seismic risk analysis. Nat. Hazards 2018, 91, 149–172. [Google Scholar] [CrossRef]
- Helbing, D.; Kühnert, C. Assessing interaction networks with applications to catastrophe dynamics and disaster management. Phys. A 2003, 328, 584–606. [Google Scholar] [CrossRef]
- Mignan, A.; Wiemer, S.; Giardini, D. The quantification of low-probability-high-consequences events: Part I. A generic multi-risk approach. Nat. Hazards 2014, 73, 1999–2022. [Google Scholar] [CrossRef]
- Lorenz, H.W. Catastrophe Theory and Economic Dynamics. In Nonlinear Dynamical Economics and Chaotic Motion; Chapter 7.3; Springer: Berlin/Heidelberg, Germany, 1993; pp. 233–243. [Google Scholar]
- Strook, D.W. An Introduction to Markov Processes, 2nd ed.; Springer: Berlin/Heidelberg, Germany, 2014; p. 203. [Google Scholar]
- Matos, J.; Mignan, A.; Schleiss, A. Vulnerability of large dams considering hazard interactions: Conceptual application of the Generic Multi-Risk framework. In Proceedings of the 13th ICOLD Benchmark Workshop on the Numerical Analysis of Dams, Lausanne, Switzerland, 9–11 September 2015; pp. 285–292. [Google Scholar]
- Freeman, L.C. Centrality in Social Networks Conceptual Clarification. Soc. Netw. 1978, 1, 215–239. [Google Scholar] [CrossRef]
- Wang, Z.; Broccardo, M.; Mignan, A.; Sornette, D. The dynamics of entropy in the COVID-19 outbreaks. Nonlinear Dyn. 2020. In Press. [Google Scholar] [CrossRef]
- Fang, C.; Marle, F.; Zio, E.; Bocquet, J.-C. Network theory-based analysis of risk interactions in large engineering projects. Reliab. Eng. Syst. Saf. 2012, 106, 1–10. [Google Scholar] [CrossRef]
- Gori, A.; Gidaris, I.; Elliott, J.R.; Padgett, J.; Loughran, K.; Bedient, P.; Panakkal, P.; Juan, A. Accessibility and Recovery Assessment of Houston’s Roadway Network due to Fluvial Flooding during Hurricane Harvey. Nat. Hazards Rev. 2020, 21, 04020005. [Google Scholar] [CrossRef]
- Rocha, J.C.; Peterson, G.; Bodin, Ö.; Levin, S. Cascading regime shifts within and across scales. Science 2018, 362, 1379–1383. [Google Scholar] [CrossRef] [PubMed]
- van Aalst, M.K. The impacts of climate change on the risk of natural disasters. Disasters 2006, 30, 5–18. [Google Scholar] [CrossRef]
- Bostrom, N. Existential risks: Analyzing human extinction scenarios and related risks. J. Evol. Technol. 2002, 9, 1–36. [Google Scholar]
- Buldyrev, S.V.; Parshani, R.; Paul, G.; Stanley, H.E.; Havlin, S. Catastrophic cascade of failures in interdependent networks. Nature 2010, 464, 1025–1028. [Google Scholar] [CrossRef]
- Borland, J. Capitalising on Catastrophe: Reinvigorating the Japanese State with Moral Values through Education following the 1923 Great Kantô Earthquake. Mod. Asian Stud. 2006, 40, 875–907. [Google Scholar] [CrossRef]
- Keeley, J.E.; Safford, H.; Fotheringham, C.J.; Franklin, J.; Moritz, M. The 2007 Southern California Wildfires: Lessons in Complexity. J. For. 2009, 107, 287–296. [Google Scholar]
- Harp, E.L.; Jibson, R.W. Landslides Triggered by the 1994 Northridge, California, Earthquake. Bull. Seismol. Soc. Am. 1996, 86, S319–S332. [Google Scholar]
- Tainter, J.A. Collapse of Complex Societies, reprint ed.; Cambridge University Press: Cambridge, UK, 1990; p. 264. [Google Scholar]
- Muir-Wood, R.; Mignan, A. A Phenomenological Reconstruction of the Mw9 November 1st 1755 Earthquake Source. In The 1755 Lisbon Earthquake: Revisited; Mendes-Victor, L.A., Oliveira, C.S., Azevedo, J., Ribeiro, A., Eds.; Springer: Dordrecht, The Netherlands, 2009; Volume 7, pp. 121–146. [Google Scholar] [CrossRef]
- Boteler, D.H. Geomagnetic Hazards to Conducting Networks. Nat. Hazards 2003, 28, 537–561. [Google Scholar] [CrossRef]
- Mignan, A.; Grossi, P.; Muir-Wood, R. Risk assessment of Tunguska-type airbursts. Nat. Hazards 2011, 56, 869–880. [Google Scholar] [CrossRef][Green Version]
- Woo, G.; Mignan, A. Counterfactual Analysis of Runaway Earthquakes. Seismol. Res. Lett. 2018, 89, 2266–2273. [Google Scholar] [CrossRef]
- Kolokoltsov, V.N. Nonlinear Markov Processes and Kinetic Equations; Cambridge Tracts in Mathematics, Cambridge University Press: Cambridge, UK, 2010; p. 394. [Google Scholar]
- Norio, O.; Ye, T.; Kajitani, Y.; Shi, P.; Tatano, H. The 2011 Eastern Japan Great Earthquake Disaster: Overview and Comments. Int. J. Disaster Risk Sci. 2011, 2, 34–42. [Google Scholar] [CrossRef]
- Cui, P.; Zhu, Y.; Han, Y.; Chen, X.; Zhuang, J. The 12 May Wenchuan earthquake-induced landslide lakes: Distribution and preliminary risk evaluation. Landslides 2009, 6, 209–223. [Google Scholar] [CrossRef]
- Krausmann, E.; Cruz, A.M.; Affeltranger, B. The impact of the 12 May 2008 Wenchuan earthquake on industrial facilities. J. Loss Prev. Process Ind. 2010, 23, 242–248. [Google Scholar] [CrossRef]
- Paterson, E.; del Re, D.; Wang, Z. The 2008 Wenchuan Earthquake: Risk Management Lessons and Implications; Risk Management Solutions, Inc.: Newark, CA, USA, 2008; p. 15. [Google Scholar]
- Fox News. Available online: https://www.foxnews.com/story/china-earthquake-derailed-freight-train-which-caught-fire (accessed on 11 August 2020).
- Levy, J.K.; Gopalakrishnan, C. Promoting Disaster-resilient Communities: The Great Sumatra-Andaman Earthquake of 26 December 2004 and the Resulting Indian Ocean Tsunami. Int. J. Water Resour. Dev. 2005, 21, 543–559. [Google Scholar] [CrossRef]
- Walter, T.R.; Amelung, F. Volcanic eruptions following M ≥ 9 megathrust earthquakes: Implications for the Sumatra-Andaman volcanoes. Geology 2007, 35, 539–542. [Google Scholar] [CrossRef]
- Nagashima, T. Sewage disposal and typhoid fever: The case of Tokyo 1912–1940. Ann. Démogr. Hist. 2004, 108, 105–117. [Google Scholar] [CrossRef]
- Hammer, J. Yokohama Burning: The Deadly 1923 Earthquake and Fire that Helped Forge the Path to World War II; Free Press: New York, NY, USA, 2011; p. 336. [Google Scholar]
- Odell, K.; Weidenmier, M.D. Real Shock, Monetary Aftershock: The 1906 San Francisco Earthquake and the Panic of 1907. In Claremont Colleges Working Papers in Economics; Leibniz Information Centre for Economics: Kiel, Germany, 2001; Volume 7, p. 22. [Google Scholar]
- Lund, K.A.; Benediktsson, K. Inhabiting a risky earth, the Eyjafjallajökull eruption in 2010 and its impacts. Anthropol. Today 2011, 27, 6–9. [Google Scholar] [CrossRef]
- Stromboli Tsunami. 2002. Available online: https://en.wikipedia.org/wiki/2002_Stromboli_tsunami (accessed on 11 August 2020).
- Thordarson, T.; Self, S. Atmospheric and environmental effects of the 1783–1784 Laki eruption: A review and reassessment. J. Geophys. Res. 2003, 108, 7–29. [Google Scholar] [CrossRef]
- Causes of the French Revolution. Available online: https://en.wikipedia.org/wiki/Causes_of_the_French_Revolution (accessed on 11 August 2020).
- Kilburn, C.R.J.; Petley, D.N. Forecasting giant, catastrophic slope collapse: Lessons from Vajont, Northern Italy. Geomorphology 2003, 54, 21–32. [Google Scholar] [CrossRef]
- Haraguchi, M.; Lall, U. Flood risks and impacts: A case study of Thailand’s floods in 2011 and research questions for supply chain decision making. Int. J. Disaster Risk Reduct. 2015, 14, 256–272. [Google Scholar] [CrossRef]
- Haraguchi, M.; Kim, S. Critical infrastructure interdependence in New York City during Hurricane Sandy. Int. J. Disaster Resil. Built Environ. 2016, 7, 133–143. [Google Scholar] [CrossRef]
- Comfort, L.K. Cities at risk: Hurricane Katrina and the drowning of New Orleans. Urban Aff. Rev. 2006, 41, 501–516. [Google Scholar] [CrossRef]
- Xie, W.; Li, N.; Li, C.; Wu, J.-D.; Hu, A.; Hao, X. Quantifying cascading effects triggered by disrupted transportation due to the Great 2008 Chinese Ice Storm: Implications for disaster risk management. Nat. Hazards 2014, 70, 337–352. [Google Scholar] [CrossRef]
- Sugarman, R. Power/energy: New York City’s blackout: A $350 million drain: Ripple effects off the July 13, 1977, lightning stroke cost the public dearly in lost property, services, end income. IEEE Spectr. 1978, 15, 44–46. [Google Scholar] [CrossRef]
- Kelley, C.P.; Mohtadi, S.; Cane, M.A.; Seager, R.; Kushnir, Y. Climate change in the Fertile Crescent and implications of the recent Syrian drought. Proc. Natl. Acad. Sci. USA 2015, 112, 3241–3246. [Google Scholar] [CrossRef]
- Australian Bushfire Season. 2019–2020. Available online: https://en.wikipedia.org/wiki/2019%E2%80%9320_Australian_bushfire_season (accessed on 11 August 2020).
- If Australia’s Bushfires Are the New Normal, How Should Companies Manage Risks? Available online: https://lot.dhl.com/if-australias-bushfires-are-the-new-normal-how-should-companies-manage-risks/ (accessed on 11 August 2020).
- Varatharaj, A.; Thomas, N.; Ellul, M.; Davies, N.; Pollak, T.; Tenorio, E.; Sultan, M.; Easton, A.; Breen, G.; Zandi, M.; et al. Neurological and neuropsychiatric complications of COVID-19 in 153 patients: A UK-wide surveillance study. Lancet Psychiatry 2020. [Google Scholar] [CrossRef]
- Giger, W. The Rhine red, the fish dead—The 1986 Schweizerhalle disaster, a retrospect and long-term impact assessment. Environ. Sci. Pollut. Res. 2009, 16, S98–S111. [Google Scholar] [CrossRef]
- Moller, A.P.; Mousseau, T.A. Biological consequences of Chernobyl: 20 years on. Trends Ecol. Evol. 2006, 21, 200–207. [Google Scholar] [CrossRef]
- Geraskin, S.A.; Dikarev, V.G.; Zyablitskaya, Y.Y.; Oudalova, A.A.; Spirin, Y.V.; Alexakhin, R.M. Genetic consequences of radioactive contamination by the Chernobyl fallout to agricultural crops. J. Environ. Radioact. 2003, 66, 155–169. [Google Scholar] [CrossRef]
- Eckerman, I. The Bhopal Saga-Causes and Consequences of the World’s Largest Industrial Disaster; Universities Press: Hyderabad, India, 2005; p. 283. [Google Scholar]
- Homberger, E.; Reggiani, G.; Sambeth, J.; Wipf, H.K. The Seveso accident: Its nature extent and consequences. Ann. Occup. Hyg. 1979, 22, 327–368. [Google Scholar] [PubMed]
- Anderson, C.W.; Santos, J.R.; Haimes, Y.Y. A Risk-based Input-Output Methodology for Measuring the Effects of the August 2003 Northeast Blackout. Econ. Syst. Res. 2007, 19, 183–204. [Google Scholar] [CrossRef]
- Evans, C.A. Public Health Impact of the 1992 Los Angeles Civil Unrest. Public Health Rep. 1993, 108, 265–272. [Google Scholar]
- Rose, A.Z.; Blomberg, S.B. Total Economic Consequences of Terrorist Attacks: Insights from 9/11. Peace Econ. Peace Sci. Public Policy 2010, 16, 1–12. [Google Scholar] [CrossRef]
- Krebs, R.R.; Lobasz, J.K. Fixing the Meaning of 9/11: Hegemony, Coercion, and the Road to War in Iraq. Secur. Stud. 2007, 16, 409–451. [Google Scholar] [CrossRef]


| ID | Peril | Including |
|---|---|---|
| NATURAL | ||
| Geological and Geomorphological | ||
| EQ | Earthquake | Shaking, fault rupture, ground displacement, subsidence |
| VE | Volcanic eruption | Explosive or effusive |
| MS | Mass slide | Landslide, rockfall, avalanche, mudslide, liquefaction |
| Hydrological | ||
| FL | Flood | River flooding, tsunami, storm surge, flash flood |
| Meteorological | ||
| WS | Windstorm | Tropical cyclone, extratropical windstorm, winter storm, tornado |
| OS | Other storm | Rainstorm, hailstorm, thunderstorm (lightning), ice storm, snowstorm, sandstorm, haze |
| EW | Extreme weather | Drought, heat wave, frost, extreme temperature gradient |
| Biophysical and Ecological | ||
| WF | Wildfire | Bushfire, forest fire |
| DI | Disease | Outbreak, epidemic, pandemic |
| Extraterrestrial | ||
| AI | Asteroid impact | Asteroid or comet, impact or air blast |
| GS | Geomagnetic storm | N/A |
| ANTHROPOGENIC (Accidental or Malicious) | ||
| Technological | ||
| FI | Fire | N/A |
| CF | Critical infrastructure failure | Explosion, toxic release (chemical, radioactive), water release (dam/levee break, overtopping) |
| NF | Critical network failure | In transportation, water and gas, electricity blackout, cyber-attack |
| Economical | ||
| BI | Business interruption | In industry, agriculture, tourism, etc. |
| EC | Economic crisis | Recession, depression, financial crisis, hyperinflation |
| Social | ||
| SU | Social unrest | Riot, strike, vandalism, looting |
| HD | Healthcare degradation | No rescue, security or access to hospital, unsanitary conditions, starvation (famine) |
| CO | Conflict | War, revolt, revolution, terrorism |
| Catastrophe 1 | Observed Cascading Effects 2 | Proposed Encoding 3 |
|---|---|---|
| NATURAL TRIGGER | ||
| Earthquake (EQ) as initial trigger | ||
| 2011 Tohoku, JP | EQ → great tsunami → nuclear disaster → blackouts, global nuclear energy turn-around ⇒ decline in global automobile production ⇒ significant fluctuations in global financial markets | (EQ, FL); (FL, CF); (CF, NF); (CF, BI) |
| 2008 Wenchuan, CN | EQ → landslides → landslide lakes → downstream flooding EQ → energy networks outage → industrial production interrupted EQ → derailments → tanks collapse → fire EQ → landslides → roads damaged → rescues delayed EQ → chemical plant failure (toxic release) → health issues EQ → many businesses damaged | (EQ, MS); (MS, FL); (FL; FL); (EQ, NF); (NF, BI); (NF; CF); (CF, FI); (MS, NF); (NF, HD); (EQ, CF); (CF, DI); (EQ, BI) |
| 2004 Sumatra, ID | EQ → tsunami → poor sanitation, lifelines ↓, tourism, fishing and farming ↓ EQ → great aftershocks EQ → volcanic eruption | (EQ, FL); (FL, NF); (FL, HD); (FL, BI); (EQ, EQ); (EQ, VE) |
| 1994 Northridge, US | EQ → landslide → Valley Fever outbreak | (EQ, MS); (MS, DI) |
| 1923 Kanto, JP | EQ → water network ↓ → fires → social unrest (Koreans attacked on false rumors) EQ → water network ↓ → unsanitary conditions → typhoid and dysentery ⇒ ideological, political and societal reforms ⇒ World War II | (EQ, NF); (NF, FI); (FI, SU); (NF, HD); (HD, DI) |
| 1906 San Francisco, US | EQ → water and gas network ↓ → fires ⇒ 1907 Financial Panic | (EQ, NF); (NF, FI) |
| Volcanic eruption (VE) as initial trigger | ||
| 2010 Eyjafjallajokull, IS | VE → air travel disruption → airline bankruptcies | (VE, NF); (NF, BI) |
| 2002 Stromboli, IT | VE → collapse of volcano side → tsunami → island closed to tourism | (VE, MS); (MS, FL); (FL, BI) |
| 1783 Laki, IS | VE → extreme weather fluctuations → agriculture ↓ VE → poisonous cloud → sickness VE → poisonous cloud → agriculture ↓ (cattle mass death, scorched vegetation) → famine ⇒ climate change, 1789 French Revolution | (VE, EW); (EW, BI); (VE, OS); (OS, DI); (OS, BI); (BI, HD) |
| Mass slide (MS) as initial trigger | ||
| 1963 Vajont, IT | MS → tsunami on artificial lake → dam overtopping | (MS, FL); (FL; CF) |
| Flood (FL) as initial trigger | ||
| 2011 Thailand | FL → manufacturing sector ↓ → GDP ↓ FL → manufacturing sector ↓ → supply chain ↓ → international import sector ↓ → GDP ↓ | (FL, BI); (BI, ES); (BI, NF); (NF, BI) |
| Windstorm (WS) as initial trigger | ||
| 2017 Hurricane Harvey, US | WS → rainfall event → fluvial inundation → transportation network ↓ → emergency response service ↓ | (WS, OS); (OS, FL); (FL, NF); (NF, HD) |
| 2012 Hurricane Sandy, US | WS → storm surge → electric network ↓ → health care facility evacuated WS → storm surge → power plants ↓ → electric network ↓ → other lifelines and supply chains ↓ | (WS, FL); (FL, NF); (NF; HD); (FL, BI); (BI, NF); (NF, NF) |
| 2005 Hurricane Katrina, US | WS → storm surge → levee failure → business interruptions WS → storm surge → levee failure → electrical cell phone stations ↓ → rescue, medical care, security scarce → violence and looting | (WS, FL); (FL; CF); (CF, BI); (CF, NF); (NF, HD); (HD, SU) |
| Other storm (OS) as initial trigger | ||
| 2008 southern China ice storm, CN | OS → roads, trains and flights ↓ → supply chains of energy and food ↓ → power plants shut down, food shortage ⇒ consumer price index ↑ nationwide | (OS, NF); (NF, NF); (NF, BI); (NF, HD) |
| 1977 New York City thunderstorm, USA | OS → blackout → airports closed, rescue units and hospital operations hampered OS → blackout → looting and arson → fires → businesses damaged | (OS, NF); (NF, NF); (NF, HD); (NF; SU); (SU, FI); (FI, BI) |
| Extreme weather (EW) as initial trigger | ||
| 2006–2010 Syrian drought, SY | EW → crop failure → malnutrition → diseases EW → crop failure → food price ↑ → violence ⇒ 2011-present Syrian civil war | (EW, BI); (BI, HD); (HD, DI); (BI, ES); (ES, SU) |
| Wildfire (WF) as initial trigger | ||
| 2019–2020 bushfires, AU | WF → further bushfires WF → transportation and production ↓ → logistics, tourism ↓ WF → smoke-related diseases | (WF, WF); (WF, NF); (WF, BI); (NF, BI); (BI, BI); (WF, DI) |
| Disease (DI) as initial trigger | ||
| 2020 COVID-19 | DI → healthcare system ↓ DI → travel restriction → tourism, energy, manufacturing sectors ↓ → GDP ↓, financial crisis DI → travel restriction → tourism ↓ → agriculture sector ↓ DI → travel restriction → domestic violence DI → secondary diseases | (DI, HD); (DI, NF); (NF, BI); (BI, ES); (BI, BI); (NF, SU); (DI, DI) |
| Asteroid impact (AI) as initial trigger | ||
| 1908 Tunguska, RU | AI → large fires ignited near ground zero AI → hurricane-force winds | (AI, WF); (AI, WS) |
| Geomagnetic storm (GS) as initial trigger | ||
| 1989 Québec, CA | GS → power blackouts → loss of sales → GDP loss | (GS, NF); (NF, BI); (BI, ES) |
| ANTHROPOGENIC TRIGGER | ||
| Fire (FI) as initial trigger | ||
| 1986 Basel, CH | FI → chemicals released → water supply suspended | (FI, CF); (CF, NF) |
| Critical infrastructure failure (CF) as initial trigger | ||
| 1986 Chernobyl, UA | CF → radiation-related diseases, agricultural crops ↓ CF → nuclear fire | (CF, DI); (CF, BI); (CF, FI) |
| 1984 Bhopal, IN | CF → gas-related diseases → workforce incapable of work, food supply shortages → food price ↑, transportation ↓ CF → vegetable crops affected, protests and violence | (CF, DI); (DI, BI); (BI, ES); (BI, NF); (CF, BI); (CF, SU) |
| 1976 Seveso, IT | CF → chemical lesions, contaminated crops | (CF, DI); (CF, BI) |
| Network failure (NF) as initial trigger | ||
| 2003 blackout, IT | NF → Internet network ↓ → further power stations breakdown | (NF, NF); (NF, NF) |
| 2003 blackout, US | NF → subway and water systems ↓, perishable food lost at restaurants and stores | (NF, NF); (NF, BI) |
| Social unrest (SU) as initial trigger | ||
| 1992 Los Angeles riot, US | SU → Fires → number of businesses lost SU → “mini-malls” destroyed, burglaries and vigilantes, health and fire service hampered | (SU, FI); (FI, BI); (SU, BI); (SU, SU); (SU, HD) |
| Conflict (CO) as initial trigger | ||
| 11 September 2001 terrorist attack, US | CO → business (World Trade Center, airlines, tourism) ↓ → slight decrease in GDP CO → “War on Terror”, 2003 US/Iraq war | (CO, BI); (BI, ES); (CO, CO) |
© 2020 by the authors. Licensee MDPI, Basel, Switzerland. This article is an open access article distributed under the terms and conditions of the Creative Commons Attribution (CC BY) license (http://creativecommons.org/licenses/by/4.0/).
Share and Cite
Mignan, A.; Wang, Z. Exploring the Space of Possibilities in Cascading Disasters with Catastrophe Dynamics. Int. J. Environ. Res. Public Health 2020, 17, 7317. https://doi.org/10.3390/ijerph17197317
Mignan A, Wang Z. Exploring the Space of Possibilities in Cascading Disasters with Catastrophe Dynamics. International Journal of Environmental Research and Public Health. 2020; 17(19):7317. https://doi.org/10.3390/ijerph17197317
Chicago/Turabian StyleMignan, Arnaud, and Ziqi Wang. 2020. "Exploring the Space of Possibilities in Cascading Disasters with Catastrophe Dynamics" International Journal of Environmental Research and Public Health 17, no. 19: 7317. https://doi.org/10.3390/ijerph17197317
APA StyleMignan, A., & Wang, Z. (2020). Exploring the Space of Possibilities in Cascading Disasters with Catastrophe Dynamics. International Journal of Environmental Research and Public Health, 17(19), 7317. https://doi.org/10.3390/ijerph17197317