Infrastructural Aspects of Rain-Related Cascading Disasters: A Systematic Literature Review


Abstract
:1. Introduction
1.1. Challenges for Analysing Cascading Disaster Linkages
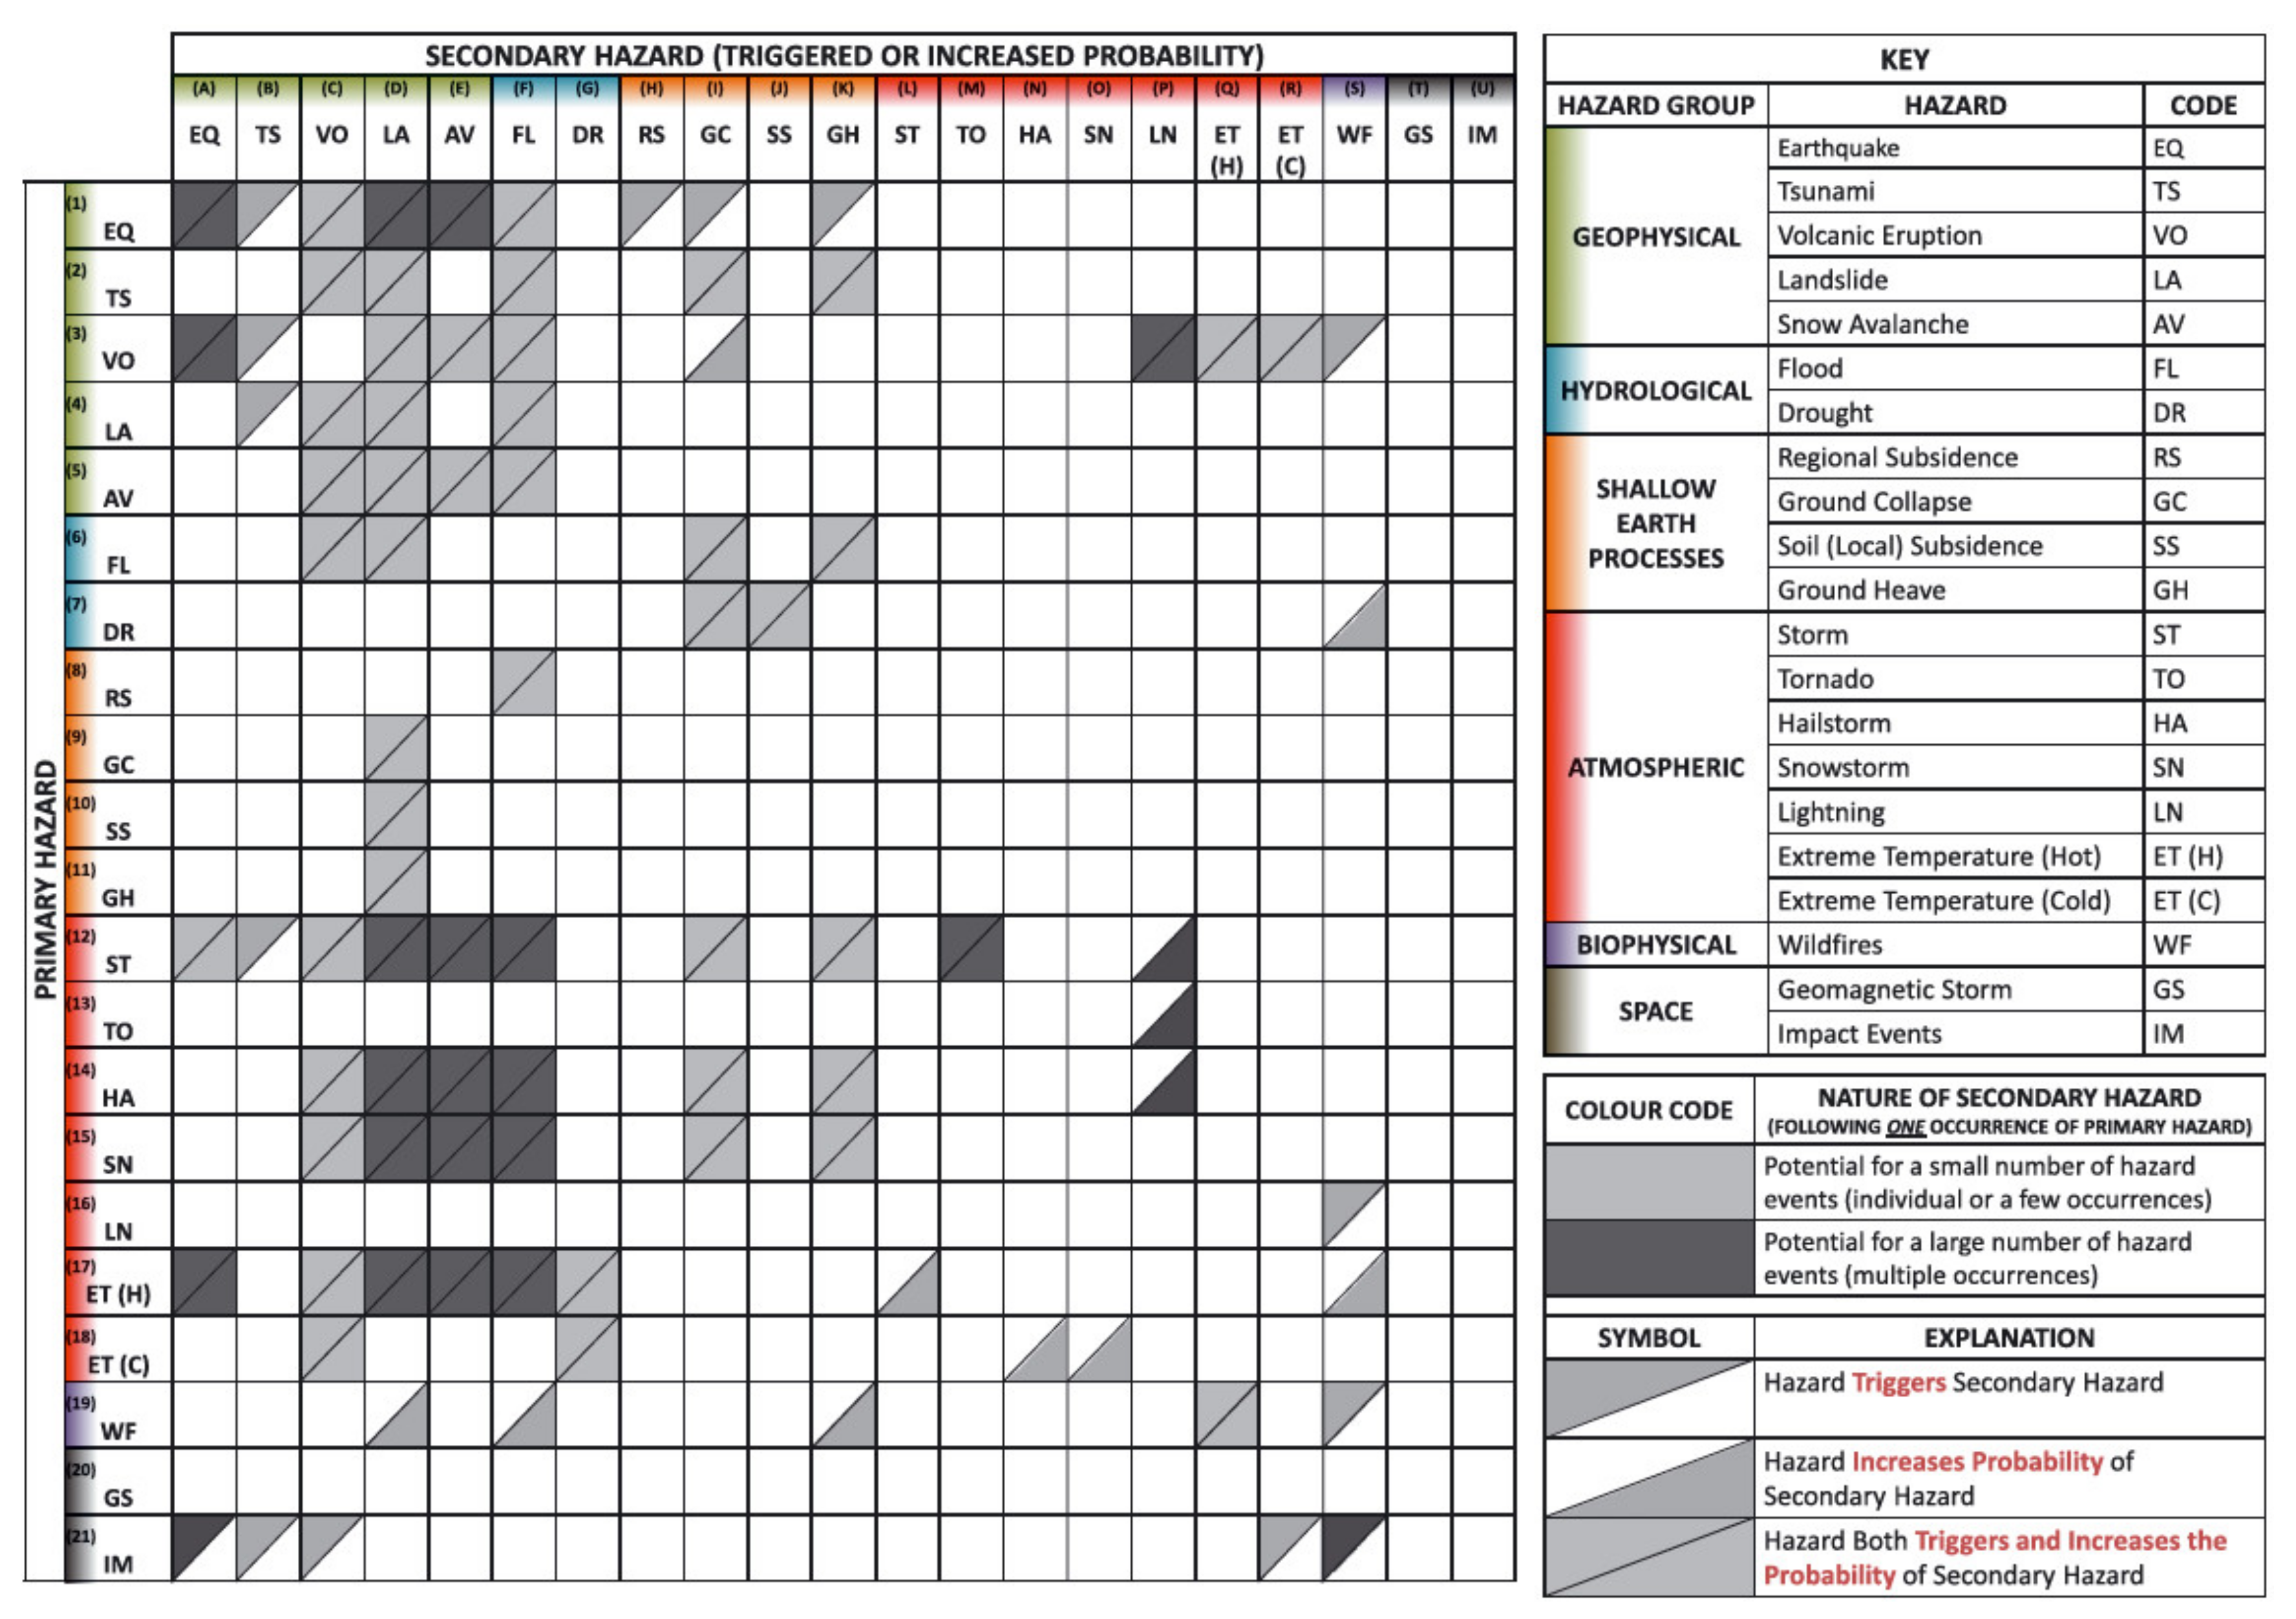
1.2. Cascading Disaster Models Derived from Literature Reviews
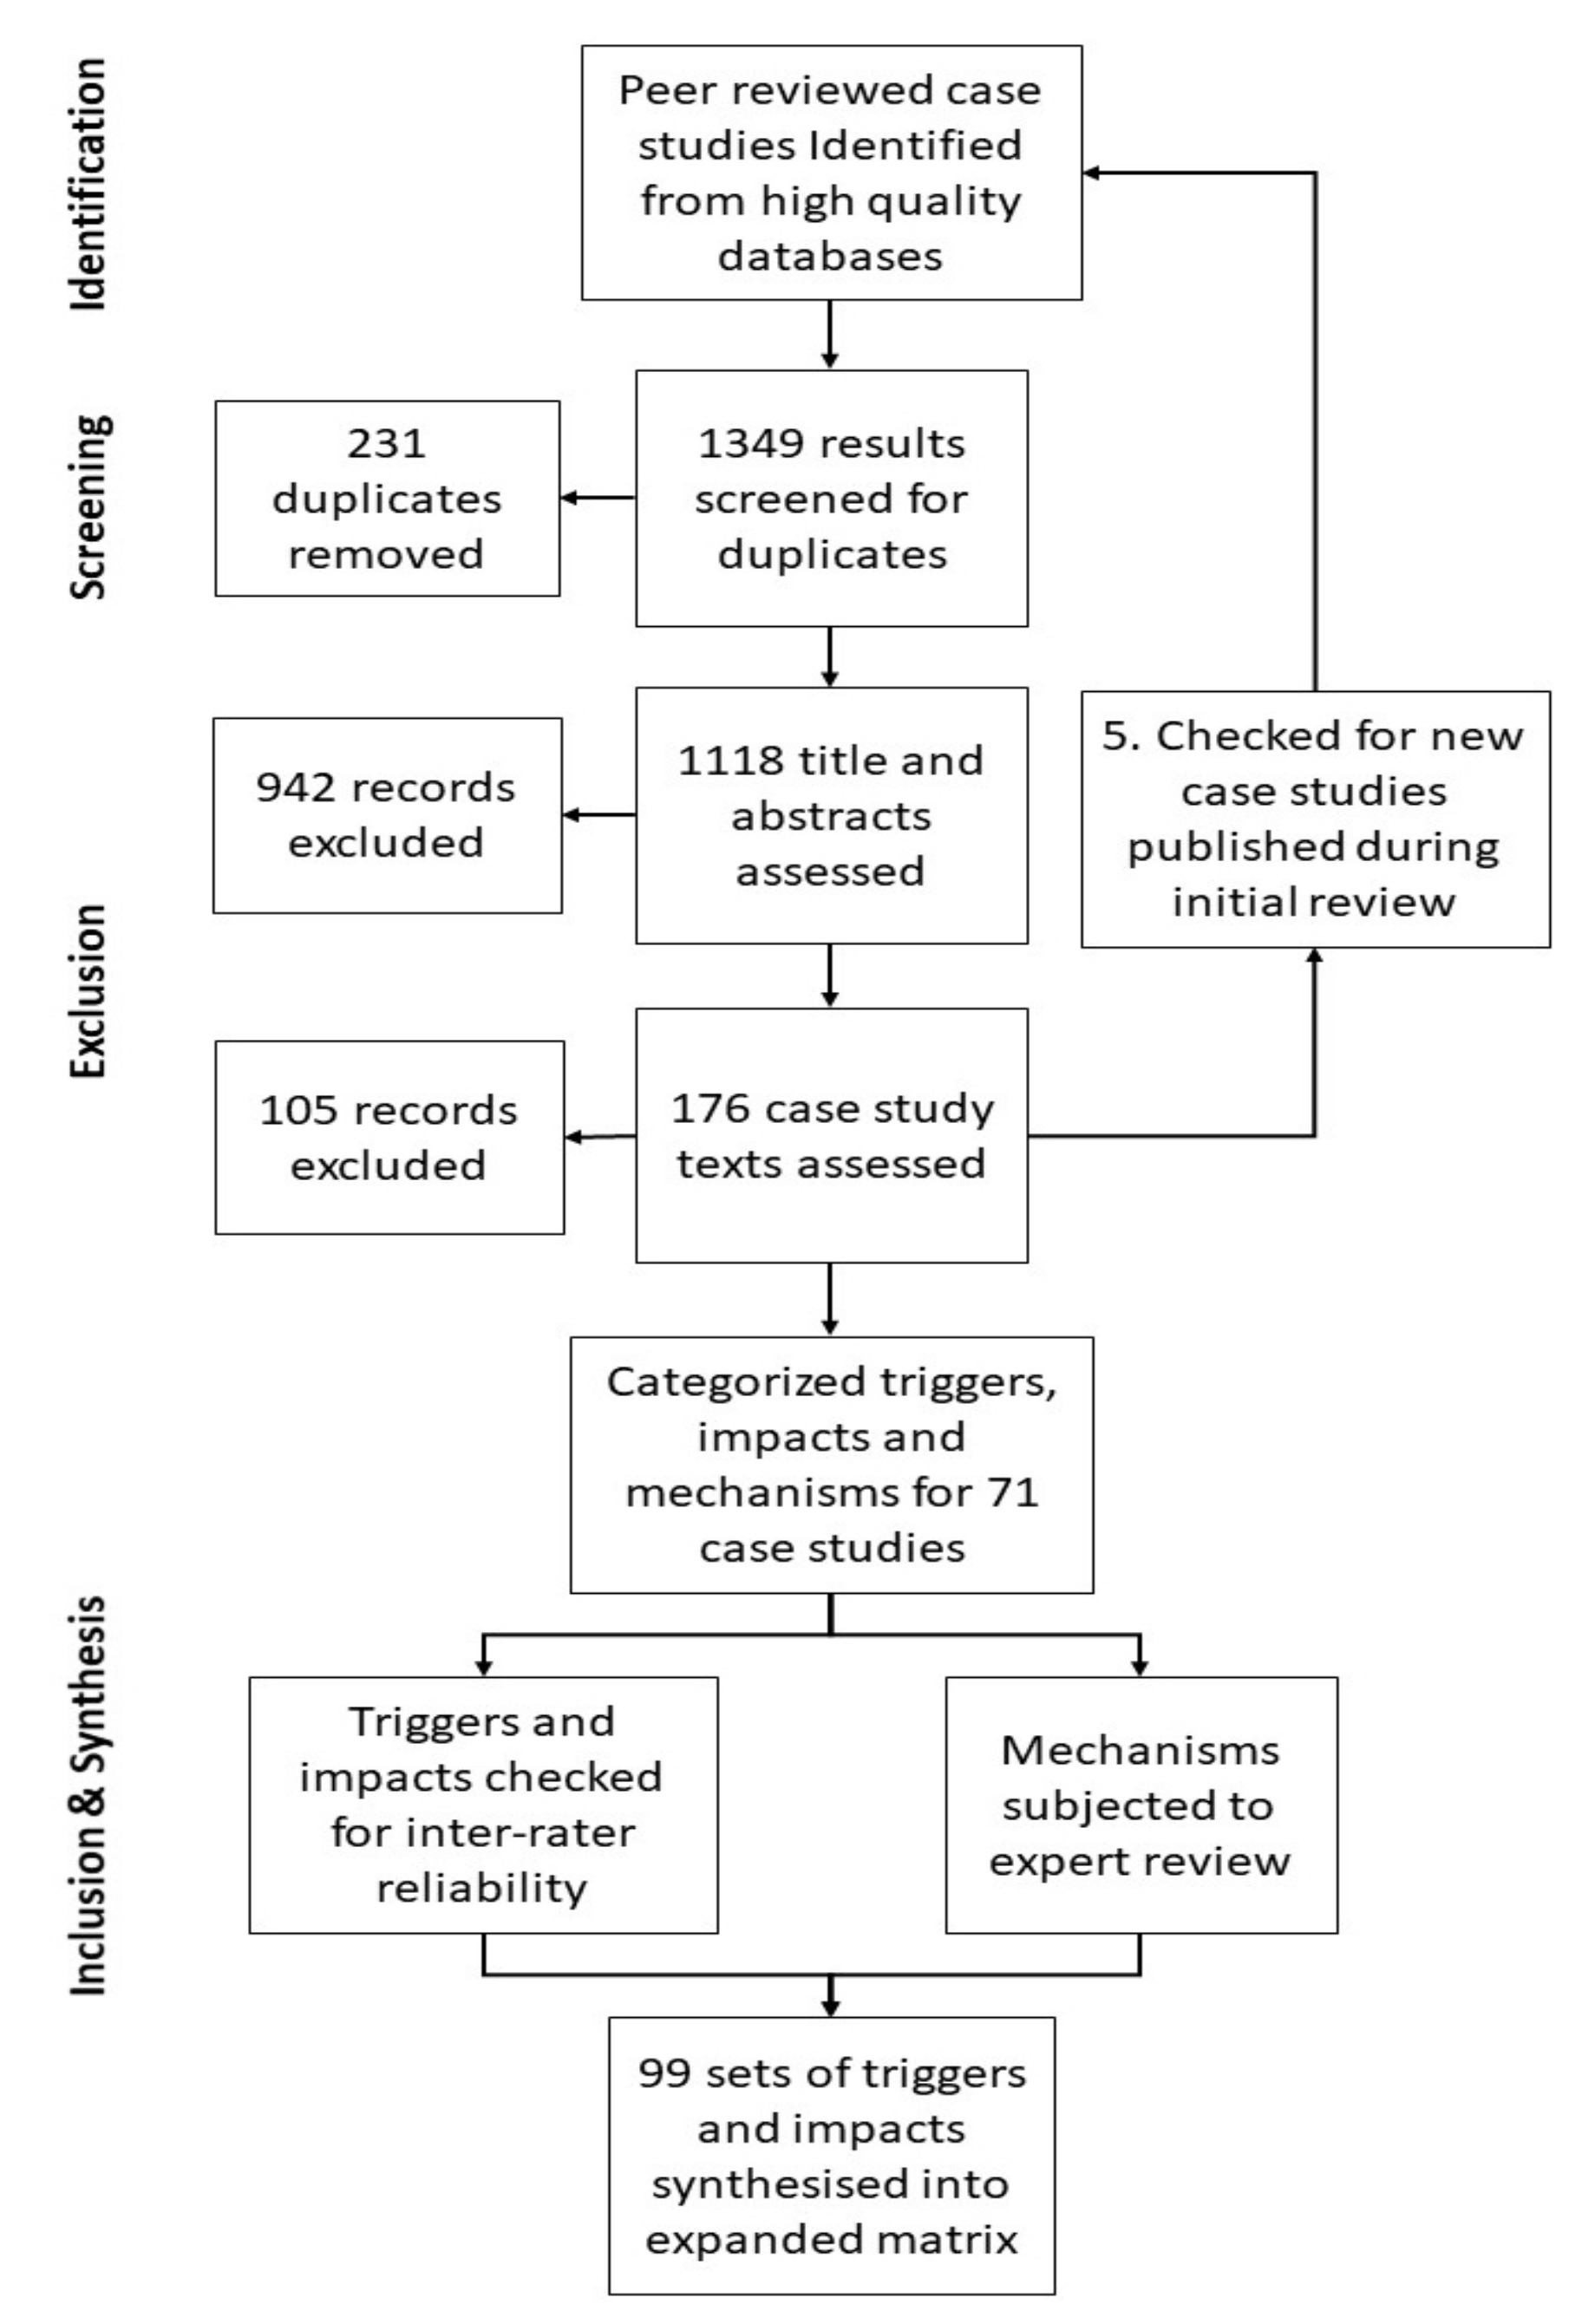
2. Methods
Definitions
- Avalanche: The downslope displacement of surface materials (predominantly ice and snow) under gravitational forces.
- Ground Collapse: Rapid, downward vertical movement of the ground surface into a void.
- Ground Heave: The sudden or gradual, upward vertical movement of the ground surface.
- Landslide: The downslope displacement of surface materials (predominantly rock and soil) under gravitational forces.
- Flood: The inundation of typically dry land with water.
- Storm: A significant perturbation of the atmospheric system, often involving heavy precipitation and violent winds.
- Tornado: A violently rotating column of air pendant (normally) from a cumulonimbus cloud and in contact with the surface of the Earth.
- Agriculture: Land developed for farming crops or livestock. Effectively critical for subsidence communities or settings characterized by low food security.
- Buildings: Any private or public building that does not form part of other infrastructure categories.
- Electricity: Stationary structures built for the generation and supply of electricity.
- Oil & Gas: Stationary structures developed for the collection, refinement, and supply of oil or gas.
- Railway: Stationary structures built for the transit of trains across the land, and bridges built for the transit of trains.
- Roads: Stationary structures built for the transit of motor vehicles across the land, and bridges built for motor vehicle transit.
- Telecommunications: Stationary structures built for the transmission of communications, including wired and mobile telephones.
- Water Supply: Stationary structures developed to supply potable water for consumption.
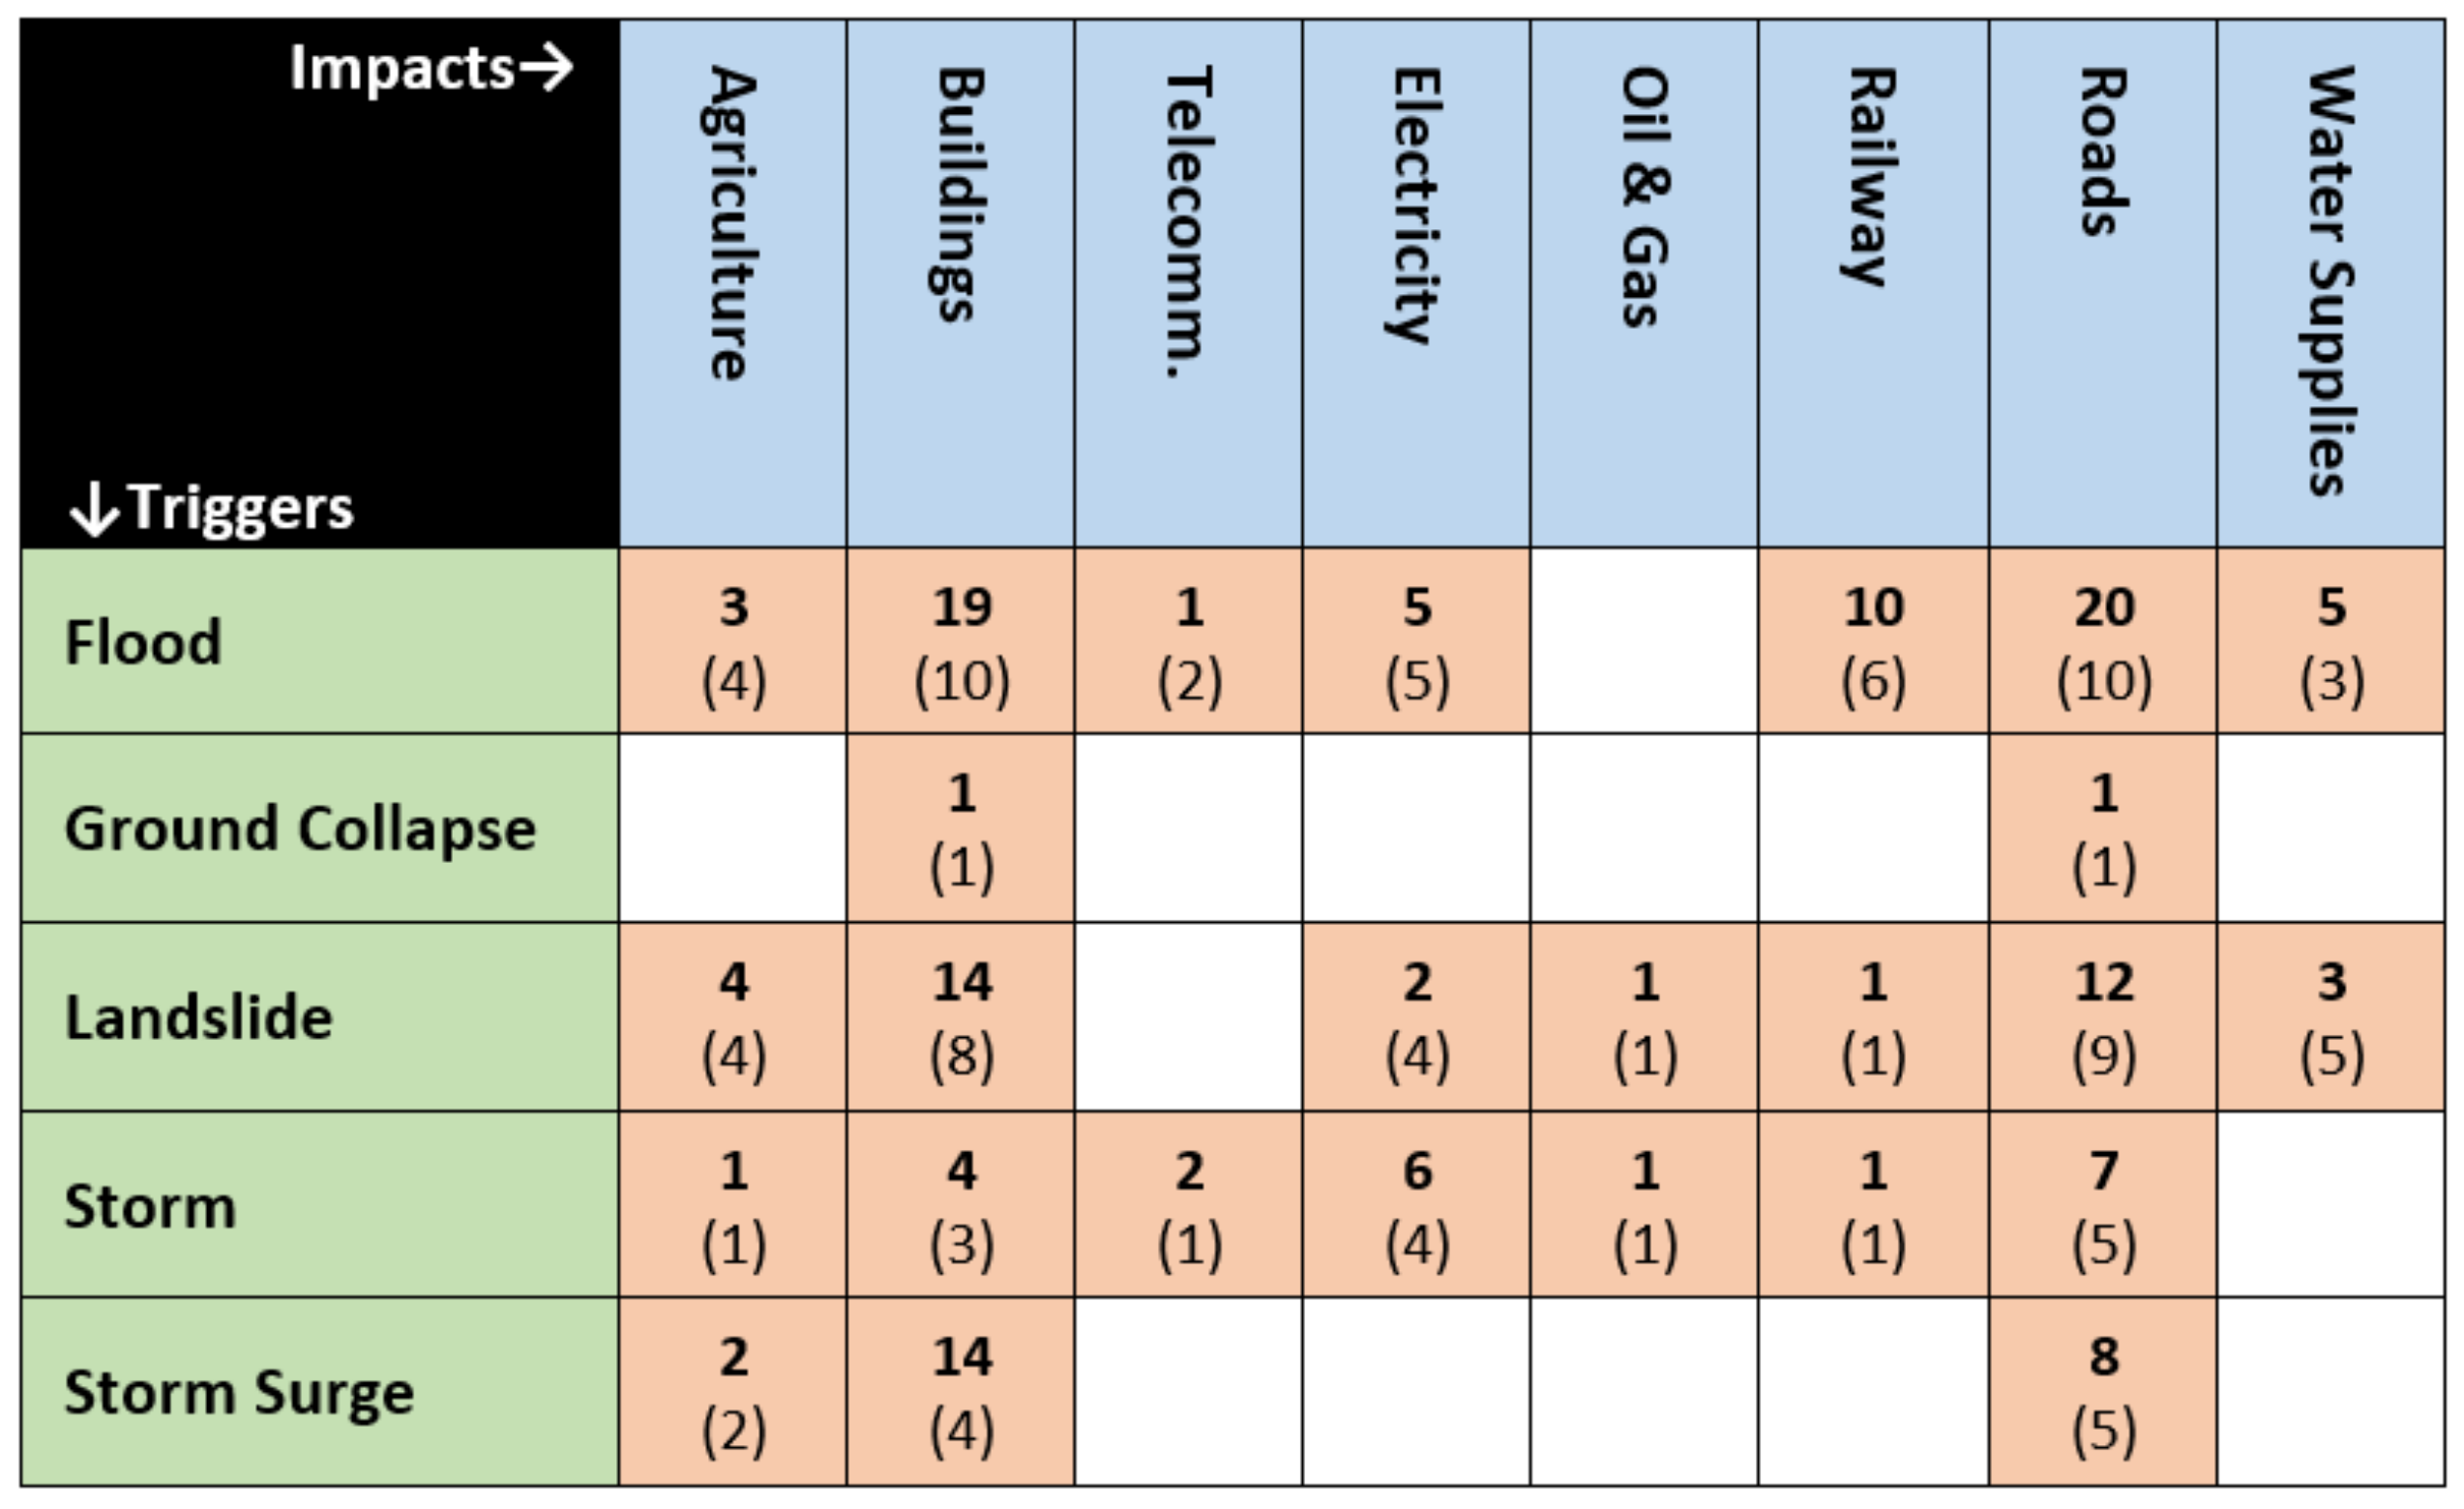
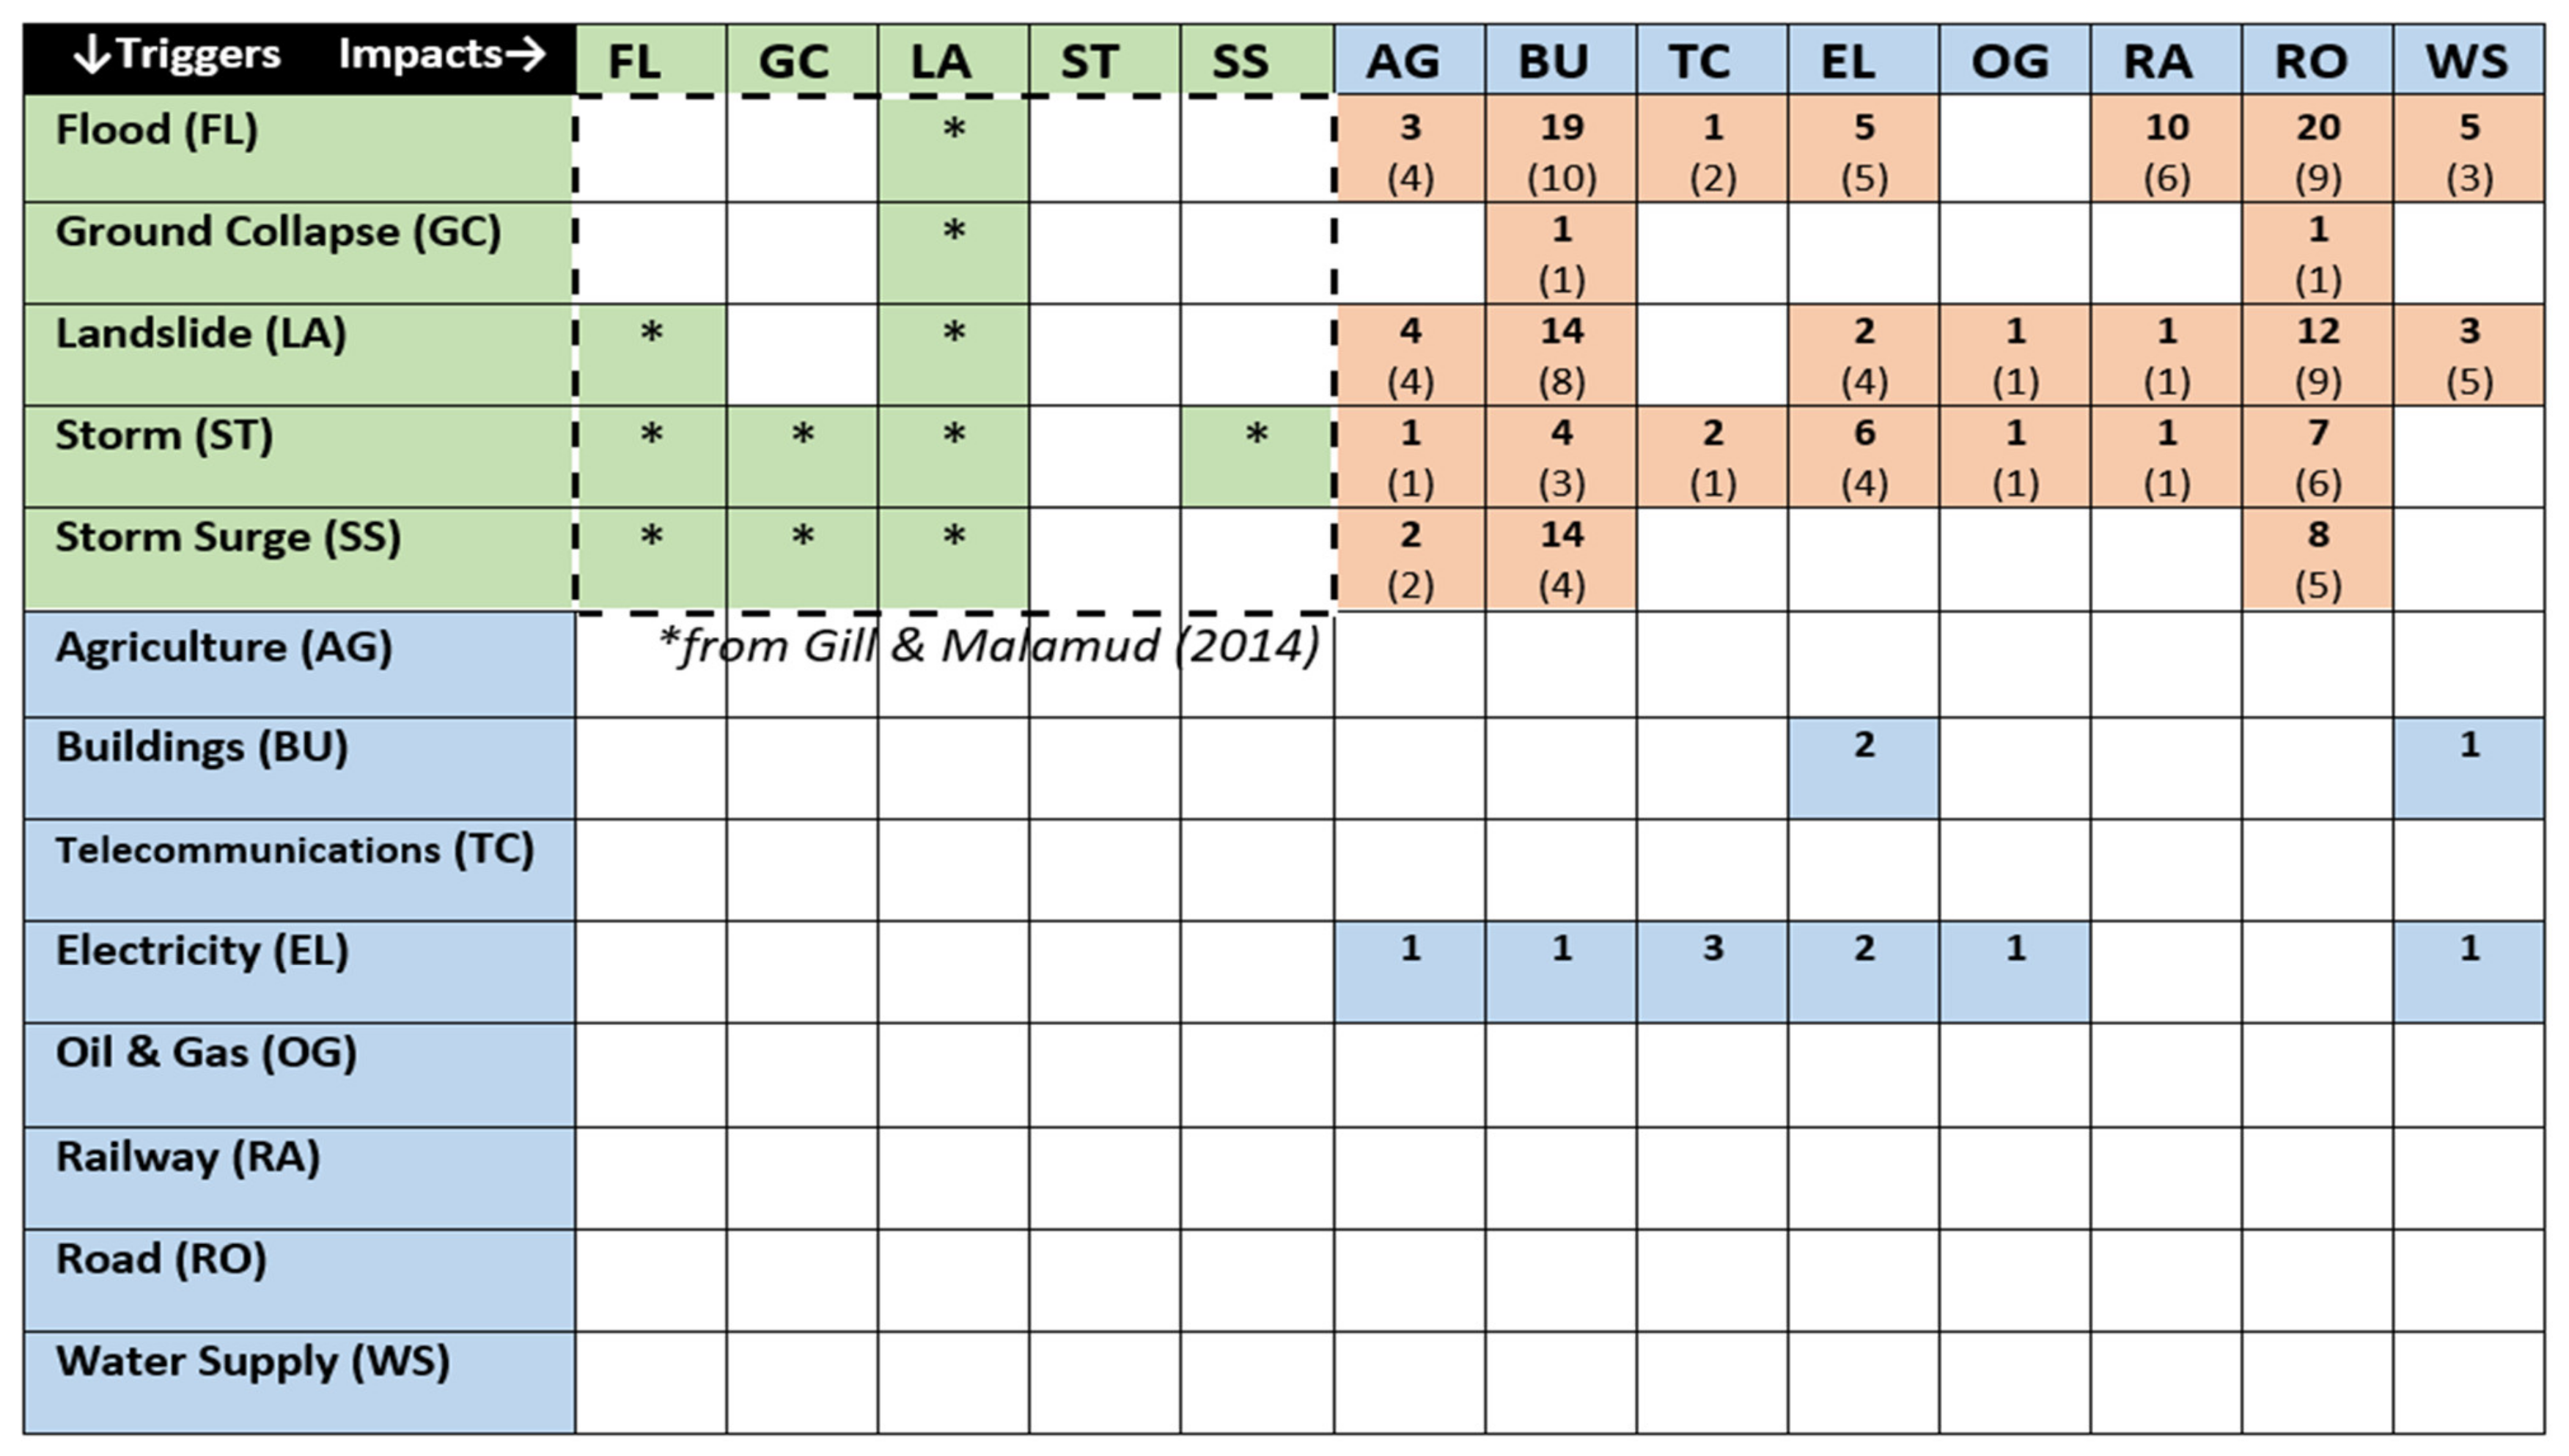
3. Results
4. Discussion
5. Conclusions
Author Contributions
Funding
Acknowledgments
Conflicts of Interest
Appendix A

| Event Cases | Trigger | Magnitude | CI Type | Impacts | Impact Scale | Impact Duration |
|---|---|---|---|---|---|---|
| Central Indus Basin Floods, Muzaffargarh, Pakistan, July 2010 | Flood | Approx. 1.04 ft/s peak discharge | Agriculture | Cotton, rice and sugarcane crops destroyed | 106 ha | 3 weeks |
| Unnamed Event, Garhwal Himalaya, India, June 2013 | Flood | River gradient increase to 68 m/km | Agriculture | Destroyed | 17 ha of farmland | Not specified |
| Unnamed Event, Garhwal Himalaya, India, June 2013 | Flood | River level increase of >30 m | Agriculture | Destroyed | 3.3 × 10⁶ km of farmland | Not specified |
| Madeira River Floods, Madeira River, Brazil, April 2014 | Flood | 20 m rise in river level, above normal level | Buildings | Damaged | 0.65 km2 of urban area, containing 27 public buildings | Not specified |
| Unnamed Event, Garhwal Himalaya, India, June 2013 | Flood | River level increase of approximately 32 m | Buildings | Destroyed | >10 shops, four houses, two hotels, one big temple, one large motor workshop | Not specified |
| Hurricane Harvey Houston, USA, August 2017 | Flood | Not specified | Buildings | Hospital closed | 1 hospital | 4 days |
| Tropical Storm Allison, Texas, USA, June 2001 | Flood | 425 m3s 765 m3s flow rate | Buildings | Damaged | 1 hospital | Not specified |
| Unnamed event, Zêzere Valley, Portugal, 1993 | Flood | Not specified | Buildings | Damaged | 1 hotel | Not specified |
| Unnamed event, Sirwolte, Switzerland, September 1993 | Flood | 150,000 m3 of water from glacier lake breach. 400 m3/s or 320 m3/s peak discharge | Buildings | Destroyed | 1 house | Not specified |
| Unnamed event, New York City, USA, June 2003 | Flood | Not specified | Buildings | Damaged | 1 house | Not specified |
| Unnamed event, Altai, Russia, Autumn 2013 | Flood | 8,000,000 km2 | Buildings | Damaged | 12,643 houses, 402 social facilities | Not specified |
| Unnamed Event, Chia, Colombia, April–May 2011 | Flood | 100-year event | Buildings | Houses inundated | 1455 urban plots | Not specified |
| Central Indus Basin Floods, Muzaffargarh, Pakistan, July 2010 | Flood | Approx. 1.04 ft/s peak discharge | Buildings | Houses fully to partially damaged | 1491 houses in flooded area, at a cost of USD 586,642 for replacement or repair | Not specified |
| Unnamed Event, Garhwal Himalaya, India, June 2013 | Flood | River gradient increase to 68 m/km | Buildings | Buried | 2.3 × 10⁴ m2 village | Not specified |
| Unnamed Event, Altay, China, Spring 2007 | Flood | Covering 386.39 km2 | Buildings | Damaged | 2375 households and 6388 rooms | Not specified |
| Unnamed Event, Garhwal Himalaya, India, June 2013 | Flood | River level increase of >30 m | Buildings | Destroyed | 3 large hotels | Not specified |
| Unnamed event, New York City, USA, January 1999 | Flood | 76mm/h of rainfall | Buildings | Inundated to within 152.4 mm of ceilings | 30 block residential area | Not specified |
| Unnamed event, Carlisle, UK, January 2005 | Flood | Average depth of 1.79 m | Buildings | Damaged | 322,950 m2 | Not specified |
| Tropical Storm Allison, Texas, USA, June 2001 | Flood | 425 m3s 765 m3s flow rate | Buildings | Damaged | 4 hospitals | Up to 5 weeks |
| Unnamed event, Eilenberg, Germany, August 2002 | Flood | Average depth of 1.91 m | Buildings | Damaged | 529,725 m2 | Not specified |
| Tropical Storm Allison, Texas, USA, June 2001 | Flood | 425 m3s 765 m3s flow rate | Buildings | Damaged | 6 hospitals | Up to 5 weeks |
| Unnamed event, Outer Carpathian, Poland, August 2014 | Flood | 2.5 above floodplain terrace, with flow of between 1.6 and 2.0 ms−1 | Buildings | Damaged | 70 farm buildings | Not specified |
| Unnamed event, Eilenburg, Germany, August 2002 | Flood | 3 m deep urban inundation | Buildings | Damaged | 765 buildings | Not specified |
| Unnamed Event, Garhwal Himalaya, India, June 2013 | Flood | Not specified | Buildings | Buried | Entire town | Not specified |
| Unnamed Event, Garhwal Himalaya, India, June 2013 | Flood | River gradient increase to 243 m/km | Buildings | Destroyed | Entire village | Not specified |
| Unnamed Event, Garhwal Himalaya, India, June 2013 | Flood | ~2.09 × 10⁶ m3 of debris flow | Buildings | Destroyed | Entire village | Not specified |
| Unnamed Event, Garhwal Himalaya, India, June 2013 | Flood | River level increase of 50 m | Buildings | Destroyed | Entire village | Not specified |
| Unnamed Event, Garhwal Himalaya, India, June 2013 | Flood | River level increase of 30–40 m | Buildings | Destroyed | Lower part of Govindghat village | Not specified |
| Unnamed event, Martell Valley, Italy, August 1987 | Flood | 300–500 m3 of water released from reservoir | Buildings | Houses, industrial and agricultural buildings damaged or demolished and swept away | Mainly affected three villages | Not specified |
| Cartago Floods, Cartago City, Costa Rica, October 1871 | Flood | More than 2 m of debris flow, leaving up to 1 m of mud | Buildings | Damaged and destroyed | More than 120 houses | Not specified |
| Unnamed Event, Garhwal Himalaya, India, June 2013 | Flood | Approx. 15–20 m rise in river level | Buildings | Destroyed | Various settlements | Not specified |
| Unnamed Event, Jushui Basin, Japan, July 2017 | Flood | Mainly between 0 to 2 m deep | Buildings | Water-logged houses | Yellow Lake community | 4 days |
| Martell Valley, Italy, August 1987 | Flood | 300–500 m3 of water released from reservoir | Communications | Significantly damaged | 1 village | Not specified |
| Central Indus Basin Floods, Muzaffargarh, Pakistan, July 2010 | Flood | Approx. 1.04 ft/s peak discharge | Electricity | Power poles damaged | 30 power poles, at a cost of USD 50,000 | Not specified |
| Tropical Storm Allison, Texas, USA, June 2001 | Flood | 425 m3s 765 m3s flow rate, causing up to 12 m of flooding | Electricity | Power cut | 4 hospitals | Up to 4 days |
| Unnamed Event, Garhwal Himalaya, India, June 2013 | Flood | River level increase of >30 m | Electricity | Destroyed | Hydropower plant | Not specified |
| Unnamed Event, Garhwal Himalaya, India, June 2013 | Flood | Not specified | Electricity | Destroyed | Hydropower plant | Not specified |
| Unnamed Event, Garhwal Himalaya, India, June 2013 | Flood | River level increase of approximately 32 m | Electricity | Filled up | 1 hydropower plant | Not specified |
| Unnamed event, Martell Valley, Italy, August 1987 | Flood | 300–500 m3 of water released from reservoir | Electricity | Significantly damaged telephone network | 1 village | Not specified |
| Unnamed Event, Garhwal Himalaya, India, June 2013 | Flood | River gradient increase to 243 m/km | Electricity | Buried | Powerhouse | Not specified |
| Unnamed event, March River Flood, Austria, 2006 | Flood | Average flow of 108 m3 s−1, peak flow of 1400 m3 s−1 | Railway | Damaged | >10 km of track | Not specified |
| Unnamed Event, Austria, June 2013 | Flood | From up to 300 mm or rainfall, leading to a more than 100-year discharge rate | Railway | Destroyed | 1 bridge | Not specified |
| Unnamed Event, Vorarlberg, Austria, 1995 | Flood | Not specified | Railway | Derailment causing 3 deaths and 17 severe injuries | 1 train | Not specified |
| Central Europe Floods, Germany, 2013 | Flood | Not specified | Railway | Closed and interrupted | 75 track sections | Service disruptions of up to 5 months |
| Unnamed Event, Norrala, Sweden, August 2013 | Flood | 90 mm of rain in 3 h | Railway | Tunnel blocked | 1 4 km tunnel | 1 day |
| Unnamed event, New York City, USA, June 2003 | Flood | Not specified | Railway | Closed | Several subway lines | Not specified |
| Unnamed event, Västra Götaland, Sweden, August 2014 | Flood | Not specified | Railway | Embankment damaged | Up to 20 mm of embankment at 2 sites | Not specified |
| Unnamed Event, Xiqu, China, June 2012 | Flood | 100 m length and 210 m of debris flow | Roads | Destroyed highway section | >200 m of highway pavement | Not specified |
| Unnamed event, Värmland, Sweden, August 2014 | Flood | From maximum 87 mm/day rainfall | Roads | Closed | 1 highway | Not specified |
| Unnamed Event, Altay, China, Spring 2007 | Flood | Covering 386.39 km2 | Roads | Damaged | 102 km | Not specified |
| Unnamed Event, Haitong, China, June 2012 | Flood | Not specified | Roads | Barrier lake formed | 160 m of subgrade | Not specified |
| Unnamed Event, Tianmo, China, July 2009 | Flood | Not specified | Roads | Sub-grade destroyed | 1 km | Not specified |
| Unnamed event, New York City, USA, June 2003 | Flood | Not specified | Roads | Blocked by up to 3 m of water | 2 intersections | Not specified |
| Unnamed event, Acre State, Brazil, 2014 | Flood | Not specified | Roads | Highway blocked | 22 municipalities | 60 days |
| Unnamed event, Piedmont, Italy, April–June 2013 | Flood | 20 debris flows | Roads | Road wall collapse, jammed bridges, other damage | 3700 km2 area withabout 420,000 inhabitants | Not specified |
| Unnamed Event, Garhwal Himalaya, India, June 2013 | Flood | River level increase of >30 m | Roads | Destroyed | 400 m | Not specified |
| Unnamed event, Russian Far East, Russia, Autumn 2013 | Flood | 8,000,000 km2 | Roads | Flooded and damaged | 4346 km | 8 weeks |
| Unnamed Event, Garhwal Himalaya, India, June 2013 | Flood | ~15–20 m rise in river level | Roads | Blocked | 4 m diameter tunnel | Not specified |
| Unnamed Event, Xiqu, China, June 2012 | Flood | From barrier lake with average width of 60 m and average depth of 5–6 m | Roads | Destroyed highway section | 500 m of highway pavement | Not specified |
| Unnamed Event, Garhwal Himalaya, India, June 2013 | Flood | River level increase of approximately 30 m | Roads | Destroyed | 5 km | Not specified |
| Unnamed Event, Garhwal Himalaya, India, June 2013 | Flood | River gradient increase to 243 m/km | Roads | Destroyed | 80 km | Not specified |
| Unnamed Event, Xiqu, China, June 2012 | Flood | 22 simultaneous debris flows | Roads | Interrupted Sichuen-Tibet Highway, with 100 vehicles and at least 300 people trapped | Eight sections of highway | 10 days until highway restored |
| Tropical Storm Erika, Dominica, August 2015 | Flood | Up to 400 mm of rain within four hours | Roads | Blocked | Main road | At least 3 years |
| Unnamed event, Zêzere Valley, Portugal, October 2005 | Flood | 34 debris flows | Roads | Closed | National Highway | Not specified |
| Unnamed event, Västra Götaland, Sweden, August 2014 | Flood | Not specified | Roads | Bridge destroyed | One 5 m span bridge | Not specified |
| Hurricane Harvey Houston, USA, August 2017 | Flood | Not specified | Roads | Blocked | One highway, 200 road sections | 4 days |
| Martell Valley, Italy, August 1987 | Flood | 300–500 m3 of water released from reservoir | Roads | Destroyed or buried | One village | Not specified |
| Unnamed Event, Calabria, Italy, 2009 to 2011 | Flood | Not specified | Roads | Interrupted transit | Several hamlets isolated | Not specified |
| Unnamed event, New York City, USA, June 2003 | Flood | Not specified | Roads | Closed | Several roads | Not specified |
| Unnamed event, Syracuse, USA, April 2011 | Flood | Not specified | Roads | Closed | Several roads | Several days |
| Unnamed Event, Tibet, China, June 1985 | Flood | Not specified | Roads | Closed | Sichuan-Tibet Highway | 7 months |
| Unnamed Event, Midui, China, July 1988 | Flood | Not specified | Roads | Interrupted | Sichuan-Tibet Highway | More than 6 months |
| Unnamed event, New York City, USA, January 1999 | Flood | 76 mm/h of rainfall | Roads | Inundated | Three neighbourhoo-ds | Not specified |
| Colorado Floods, Boulder County, USA, September 2013 | Flood | Resulting from more than 500 mm of rain | Roads | Blocked roads | Throughout City of Longmont | Not specified |
| Unnamed event, Västra Götaland, Sweden, August 2014 | Flood | Not specified | Roads | Closed | Two roads | Not specified |
| Tropical Storm Allison, Houston, USA, June 2001 | Flood | 425 m3s 765 m3s flow rate | Water | Disrupted | 1 hospital | Not specified |
| Central Indus Basin Floods, Muzaffargarh, Pakistan, July 2010 | Flood | Approx 1.04 ft/s peak discharge exceeding capacity of local barrages and dams. Century worst flood event, killing more than 1900 people | Water | Damaged canal network | 114 km of irrigation network | Not specified |
| Madeira River Floods, Madeira River, Brazil, April 2014 | Flood | 20 m rise in river level, above normal level | Water | Contaminated drinking water | 15% of municipal population | Not specified |
| Hurricane Matthew, Princeville, USA, October 2016 | Flood | Not specified | Water | Water treatment failed | City-wide | Not specified |
| Unnamed event, Martell Valley, Italy, August 1987 | Flood | 300–500 m3 of water released from reservoir | Water | Significantly damaged. | One village | Not specified |
| Unnamed event, Apulia, Italy, October 2005 | Flooding | 6.3 m impoundment | Railway | Damaged | 1 section of rail embankment | Not specified |
| Unnamed event, South-West Dieppe, France, December 2012 | Ground collapse | 100,000 m3 | Buildings | House on 40 m of cliff edge destroyed | 1 house | Not specified |
| Unnamed event, Northern Apennines, Italy, April 2004 | Landslide | 100’s of shallow landslides | Agriculture | Damaged | Not specified | 3 months |
| Unnamed events, Flanders, Belgium, n.d. | Landslide | Not specified | Agriculture | Damaged | Not specified | Not specified |
| Phojal Nalla Flood, Kullu District, India, August 1994 | Landslide | Not specified | Agriculture | Arable land lost | Not specified | Not specified |
| Bugobero Village Landslide, Bugobero, Uganda, December 1997 | Landslide | 100,000 m3 moved 2.5 km | Agriculture | Destroyed plantations | Not specified | Not specified |
| Unnamed event, Calabria, Italy, February 2010 | Landslide | Length of ~400 m, width of ~120 m, an area of ~4.8 ha, estimated volume of ~720,000 m3, mean slope gradient of ~17°, and 3 m scarp | Buildings | Destroyed and damaged | 1 petrol station and a number of houses | Not specified |
| Sextas Landslide, Tena Valley, Spain, Summer 2004 | Landslide | Not specified | Buildings | Damaged | 1 ski-field chair lift | Not specified |
| Unnamed Event, San Fratello, Italy, February 2010 | Landslide | 8–10 m surface rupture, landslide 1.8 km long | Buildings | Severely damaged and destroyed buildings including a church and school | 1 km2 | Not specified |
| Typhoon No. 23, Kansai, Japan, October 2004 | Landslide | 230 m long, including 23 m high reinforced earth wall | Buildings | Damaged | 1 warehouse | Not specified |
| Unnamed event, Teziutlán, Mexico, October 1999 | Landslide | Not specified | Buildings | Buried | Part of a village | Not specified |
| Sextas Landslide, Tena Valley, Spain, June 2008 | Landslide | 420 m long, 100 wide, with 35 m scarp | Buildings | Damaged | Snow cannon infrastructure | Not specified |
| Unnamed event, Flanders, Belgium, n.d. | Landslide | Not specified | Electricity | Damaged | 1 cable | Not specified |
| Central Europe Floods, Germany, 2013 | Landslide | Not specified | Railway | Closed and interrupted | 75 track sections | Service disruptions of up to 5 months |
| Unnamed event, Gimigliano, Italy, January 2010 | Landslide | Not specified | Roads | Destabilised | 1 bridge | Not specified |
| Hurricane Patricia, Colima, Mexico, October 2015 | Landslide | Not specified | Roads | Bridge destroyed | 1 bridge | Not specified |
| La Selva Landslide, Tena Valley, Spain, April 2009 | Landslide | 145 cm/year movement | Roads | Major damages | 1 road | Not specified |
| Unnamed event, Calabria, Italy, February 2010 | Landslide | Length of ~400 m, width of ~120 m, an area of ~4.8 ha, estimated volume of ~720,000 m3, mean slope gradient of ~17°, and 3 m scarp | Roads | Disrupted | 1 road | Not specified |
| Unnamed Event, San Fratello, Italy, February 2010 | Landslide | 8–10 m surface rupture, landslide 1.8 km long | Roads | Destroyed | 1 km2 | Not specified |
| Unnamed event, Piedmont, Italy, April–June 2013 | Landslide | 300 landslides | Roads | Road wall collapse, jammed bridges, other damage | 3700 km2 area withabout 420,000 inhabitants | Not specified |
| Unnamed Event, Rest and be Thankful, Scotland, December 2015 | Landslide | 100 m3 of earth movement | Roads | Barrier failed and slope instability, highway closed | Not specified | 7 days |
| Unnamed Event, ltmündener Wand, Germany, Winter 1974 | Landslide | Not specified | Roads | Highway blocked | On highway route | Not specified |
| Unnamed event, Peace River, Canada, May 2013 | Landslide | Not specified | Roads | Closed | One highway | Several months |
| Unnamed Event, Calabria, Italy, 2009 to 2011 | Landslide | Not specified | Roads | Interrupted transit | Several hamlets isolated | Not specified |
| Unnamed Event, San Fratello, Italy, February 2010 | Landslide | 8–10 m surface rupture, landslide 1.8 km long | Water | Damaged and destroyed drainpipes | 1 km2 | Not specified |
| Cyclone Sidr, Sarankhola Upazi, Bangladesh, November 2007 | Storm | Category 4 cyclone, with average wind speed of 237 km/h | Agriculture | Cropland destroyed | 0.65 million ha | Not specified |
| Cyclone Sidr, Sarankhola Upazi, Bangladesh, November 2007 | Storm | Category 4 cyclone, with average wind speed of 237 km/h | Buildings | Houses destroyed | 1.2 million | Not specified |
| Hurricane Sandy, Rockaway Peninsula, USA, October 2012 | Storm | Not specified | Buildings | Damaged | 16 of 46 primary health facilities | Not specified |
| Hurricane Sandy, Rockaway Peninsula, USA, October 2012 | Storm | Not specified. | Buildings | Damaged | 24 of 46 primary health facilities | Not specified |
| Hurricane Katrina, New Orleans, USA, August 2005 | Storm | Not specified | Buildings | Inundated | 80% of city | Not specified |
| Hurricane Irma, Florida, USA, September 2017 | Storm | Category 4 hurricane, with winds up to 119 kp/h and rainfall of up to 550 mm within 96 hours | Buildings | Severely damaged or destroyed | Most houses in Florida Keys County | Not specified |
| Hurricane Katrina, Gulf Coast, USA, August 2005 | Storm | Not specified | Communications | Damaged or collapsed | Entire Gulf Area | Not specified |
| Unnamed Event, Slovenia, January to February 2014 | Storm | Freezing rain of up to 150 mm/hr | Electricity | Power cut | 250,000 people | Not specified |
| Hurricane Irma, Florida, USA, September 2017 | Storm | Category 4 hurricane, with winds up to 119 kph and rainfall of up to 550 mm within 96 hours | Electricity | Power cut | 36% of Florida customers | 10 days |
| Unnamed Event, Northeast United States, n.d. | Storm | Not specified | Electricity | 22,700 MW of power supply interrupted | 380,000 customers | Not specified |
| Hurricane Katrina, Gulf Coast, USA, August 2005 | Storm | Not specified | Electricity | Damaged or collapsed | Entire Gulf Area | Not specified |
| Cyclone Phailin, Odisha, India, October 2013 | Storm | Category 5 hurricane, with sustained wind speeds up to 215 km/h | Electricity | Power cut | North and West of state, 1,500 MW of electricity transmission lost | 1 week |
| Cyclone Phailin, Odisha, India, October 2013 | Storm | Category 5 hurricane, with sustained wind speeds up to 215 km/h | Electricity | Rural power cut | Not specified | 1 month |
| Cyclone Phailin, Odisha, India, October 2013 | Storm | Category 5 hurricane, with sustained wind speeds up to 215 km/h | Electricity | Urban power cut | Not specified | 1 week |
| Hurricane Sandy, New Jersey and New York, USA, October 2012 | Storm | Wind gusts >120 kp/h, Approximately 1770 km storm diameter | Electricity | Disrupted | Not specified | More than 1 week |
| Hurricane Sandy, Connecticut, USA, October 2012 | Storm | Maximum wind speed of 16 m/s−1 | Electricity | Power cut | Over 500,000 customers | Up to 9 days |
| Unnamed event, Hua-Qing Highway, China, 2004 | Storm | Not specified | Roads | Disrupted | 1 highway | Not specified |
| Unnamed Event, Loch Insh, Scotland, December 2014 | Storm | Not specified | Roads | Embankment failed | 20 m, with a 10 m vertical face | Not specified |
| Typhoon Roke, Tokai, Japan, September 2011 | Storm | 496 mm of rain, with intensities up to 78 mm/h | Roads | Blocked | 333 locations | Not specified |
| Unnamed Event, Beijing, China, July 2012 | Storm | From >460 mm of rain in under 24 hours | Roads | Blocked | 63 roads | Not specified |
| Cyclone Sidr, Sarankhola Upazi, Bangladesh, November 2007 | Storm | Category 4 cyclone, with average wind speed of 237 km/h | Roads | Roads and embankments destroyed or damaged | 85% of region infrastructure | Not specified |
| Cyclone Sidr, Sarankhola Upazi, Bangladesh, November 2007 | Storm surge | Up to 5.18 m | Agriculture | Cropland destroyed | 0.65 million ha | Not specified |
| Odisha Super Typhoon, Odisha, India, October 1999 | Storm surge | Up to 60 km inland from 480 km of shoreline | Agriculture | Farmland rendered infertile | 200,000 ha | Not specified |
| Unnamed event, Solent, UK, March 2008 | Storm surge | 0.7 m of skew surge, flooding 7 km2 with up to 2.48 m of water | Buildings | Flooded and damaged | 150 buildings, including at least 30 houses, 100 caravans, and a ferry terminal | Not specified |
| Hurricane Katrina, New Orleans, USA, August 2005 | Storm surge | 7.3 to 8.5 m high | Buildings | Inundated | 80% of the city under 6m of water | 21 days |
| Hurricane Katrina, New Orleans, USA, August 2005 | Storm surge | Not specified | Buildings | Inundated | 80% of the city, including 228,000 housing units | Not specified |
| Unnamed event, Avarua, Cook Islands, December 1967 | Storm surge | Not specified | Buildings | Houses inundated | Affecting 270 residents | Not specified |
| Typhoon Haiyan, Tacloban City, Philippines, November 2013 | Storm surge | Not specified | Buildings | Destroyed | All wooden constructions on the coastline | Not specified |
| Cyclone Meena, Avarua, Cook Islands, February 2005 | Storm surge | Waves up to 14 m, surge reaching 360 m inland at 2 m above high tide mark | Buildings | Largely destroyed | Avarua Wharf | Not specified |
| Cyclone Sally, Avarua, Cook Islands, January 1987 | Storm surge | Waves 10 m higher than normal | Buildings | Heavily damaged | Avatiu Harbor | Not specified |
| Cyclone Sally, Avarua, Cook Islands, January 1987 | Storm surge | Waves 10 m higher than normal | Buildings | Damaged | Entire North Coast of Avarua | Not specified |
| Unnamed event, Avarua, Cook Islands, December 1831 | Storm surge | Not specified | Buildings | Destroyed | Half the town | Not specified |
| Unnamed event, Avarua, Cook Islands, February 1935 | Storm surge | 200 m incursion, to >30 m beyond high tide mark | Buildings | Inundated | Lowland settlement | Not specified |
| Unnamed event, Avarua, Cook Islands, February 1935 | Storm surge | 200 m incursion, to >30 m beyond high tide mark | Buildings | Hospital and other buildings damaged | Lowland settlement | Not specified |
| Cyclone Meena, Avarua, Cook Islands, February 2005 | Storm surge | Waves up to 14 m, surge reaching 360 m inland at 2 m above high tide mark | Buildings | Damaged | Much of North and Northwest coast | Not specified |
| Unnamed event, Ngatangiia, Cook Islands, January 1946 | Storm surge | Not specified | Buildings | Church wall destroyed | 1 church | Not specified |
| Cyclone Sally, Avarua, Cook Islands, January 1987 | Storm surge | Waves 10 m higher than normal | Buildings | Shops inundated | 1 commercial center | Not specified |
| Cyclone Sally, Avarua, Cook Islands, January 1987 | Storm surge | Waves 10 m higher than normal | Buildings | Buildings damaged | One commercial center | Not specified |
| Unnamed event, Avarua, Cook Islands, December 1967 | Storm surge | Not specified | Buildings | Damaged, buried | 1 hotel | Not specified |
| Cyclone Sally, Avarua, Cook Islands, January 1987 | Storm surge | Waves 10 m higher than normal | Buildings | Restaurant destroyed | 1 restaurant | Not specified |
| Cyclone Heta, Avarua, Cook Islands, January 2004 | Storm surge | 10 m waves | Buildings | Inundated | Several areas | Not specified |
| Cyclone Meena, Avarua, Cook Islands, February 2005 | Storm surge | Waves up to 14 m, surge reaching 360 m inland at 2 m above high tide mark | Buildings | Damaged | Several buildings | Not specified |
| Cyclone Nancy, Matavera, Cook Islands, February 2005 | Storm surge | Not specified | Buildings | Inundated | Several buildings | Not specified |
| Cyclone Nancy, Ngatangiia Harbour, Cook Islands, February 2005 | Storm surge | Not specified | Buildings | Damaged | Several buildings | Not specified |
| Unnamed event, Mid-Atlantic Coast, USA, 1962 | Storm surge | Not specified | Buildings | Destroyed urban structures | Up to 32 km inland | Not specified |
| Unnamed event, Solent, UK, March 2008 | Storm surge | 0.7 m of skew surge, flooding 7 km2 with up to 2.48 m of water | Roads | Flooded | 22 roads | Not specified |
| Cyclone Meena, Avarua, Cook Islands, February 2005 | Storm surge | Waves up to 14 m, surge reaching 360 m inland at 2 m above high tide mark | Roads | Damaged | 500 m of coast road | Not specified |
| Cyclone Sally, Avarua, Cook Islands, January 1987 | Storm surge | Waves 10 m higher than normal | Roads | Destroyed | 6 km of coastal road | Not specified |
| Cyclone Sidr, Sarankhola Upazi, Bangladesh, November 2007 | Storm surge | 1.5 m | Roads | Roads and embankments destroyed or damaged | 85% of regional infrastructure | Not specified |
| Unnamed event, Avarua, Cook Islands, December 1967 | Storm surge | Not specified | Roads | Eroded, buried | 1 coastal road | Not specified |
| Cyclone Heta, Avarua, Cook Islands, January 2004 | Storm surge | 10 m waves | Roads | Inundated and damaged | 1 seawall road | Not specified |
| Superstorm Sandy, New York, October 2012 | Storm surge | 4.3 m | Water | Damaged wastewater infrastructure | 560 million gallons of untreated sewerage released | Not specified |
References
- Linnenluecke, M.; Griffiths, A. Beyond adaptation: Resilience for business in light of climate change and weather extremes. Bus. Soc. 2010, 1, 1–35. [Google Scholar] [CrossRef]
- Gill, J.C.; Malamud, B.D. Reviewing and visualizing the interactions of natural hazards. Rev. Geophys. 2014, 52, 680–722. [Google Scholar] [CrossRef] [Green Version]
- Pescaroli, G.; Alexander, D. Understanding compound, interconnected, interacting, and cascading risks: A holistic framework. Risk Anal. 2018, 38, 2245–2257. [Google Scholar] [CrossRef] [PubMed]
- UNDRR. Global Assessment Report on Disaster Risk Reduction; United Nations Office for Disaster Risk Reduction (UNDRR): Geneva, Switzerland, 2019. [Google Scholar]
- Klemas, V.V. The role of remote sensing in predicting and determining coastal storm impacts. J. Coast. Res. 2009, 25, 1264–1275. [Google Scholar] [CrossRef] [Green Version]
- Santella, N.; Steinberg, L.J.; Aguirra, G.A. Empirical estimation of the conditional probability of Natech events within the United States. Risk Anal. 2011, 31, 951–968. [Google Scholar] [CrossRef]
- Forzieri, G.; Feyen, L.; Russo, S.; Vousdoukas, M.; Alfieri, L.; Outten, S.; Cid, A. Multi-hazard assessment in Europe under climate change. Clim. Change 2016, 137, 105–119. [Google Scholar] [CrossRef] [Green Version]
- Huggins, T.; Hill, S.; Peace, R.; Johnston, D. Extending ecological rationality: Catching the high balls of disaster management. In Proceedings of the ISCRAM Asia Pacific, Wellington, New Zealand, 5–7 November 2018; Stock, K., Ed.; Massey University: Palmerston North, New Zealand, 2018; pp. 295–309. [Google Scholar]
- Adnan, S.G.; Kreibich, H. An evaluation of disaster risk reduction (DRR) approaches for coastal delta cities: A comparative analysis. Nat. Hazards 2016, 83, 1257–1278. [Google Scholar] [CrossRef]
- Hillier, J.K.; Macdonald, N.; Leckebusch, G.C.; Stavrinides, A. Interactions between apparently ’primary’ weather-driven hazards and their cost. Environ. Res. Lett. 2015, 10. [Google Scholar] [CrossRef]
- Kelman, I. Disaster Mitigation Is Cost Effective. Available online: http://siteresources.worldbank.org/EXTNWDR2013/Resources/8258024-1352909193861/8936935-1356011448215/8986901-1380568255405/WDR14_bp_Disaster_Mitigation_is_Cost_Effective_Kelman.pdf (accessed on 26 May 2020).
- Huggins, T.J.; Chen, K.; Gong, W.; Yang, L. The razor in the waterfall: Using longitudinal data to sharpen the analysis of cascading disaster risk. In Proceedings of the 2019 International Conference on Resources and Environmental Research, Qingdao, China, 25–27 October 2019; Hong Kong Chemical, Biological & Environmental Engineering Society: Chengdu, China, 2020. [Google Scholar] [CrossRef]
- Kar-Purkayastha, I.; Clarke, M.; Murray, V. Dealing with disaster databases—What can we learn from health and systematic reviews? PLoS Curr. 2011, 30. [Google Scholar] [CrossRef]
- Khan, A.N.; Collins, A.E.; Qazi, F. Causes and extent of environmental impacts of landslide hazard in the Himalayan region: A case study of Murree, Pakistan. Nat. Hazards 2011, 57, 413–434. [Google Scholar] [CrossRef]
- Sokat, K.Y.; Dolinskaya, I.S.; Smilowitz, K.; Bank, R. Incomplete information imputation in limited data environments with application to disaster response. Eur. J. Oper. Res. 2018, 269, 466–485. [Google Scholar] [CrossRef]
- Oddo, P.C.; Ahamed, A.; Bolten, J.D. Socioeconomic impact evaluation for near real-time flood detection in the Lower Mekong River Basin. Hydrology 2018, 5, 23. [Google Scholar] [CrossRef] [Green Version]
- Swiss Re. Mind the Risk: A Global Ranking of Cities under Threat from Natural Disasters. Available online: https://media.swissre.com/documents/Swiss_Re_Mind_the_risk.pdf (accessed on 7 January 2019).
- Marzocchi, W.; Mastellone, M.; Di Ruocco, A.; Novelli, P.; Romeo, E.; Gasparini, P. Principles of Multi-Risk Assessment: Interactions Amongst Natural and Man-Induced Risks; European Commission Directorate-General for Research, Environment Directorate: Brussels, Belgium, 2009. [Google Scholar]
- Ramirez de la Huerga, M.; Bañuls Silvera, V.A.; Turoff, M. A CIA–ISM scenario approach for analysing complex cascading effects in Operational Risk Management. Eng. Appl. Artif. Intell. 2015, 46, 289–302. [Google Scholar] [CrossRef]
- Mignan, A.; Scolobig, A.; Sauron, A. Using reasoned imagination to learn about cascading hazards: A pilot study. Disaster Prev. Manag. 2016, 25, 329–344. [Google Scholar] [CrossRef] [Green Version]
- Schauwecker, S.; Gascón, E.; Park, S.; Ruiz-Villanueva, V.; Schwarb, M.; Sempere-Torres, D.; Rohrer, M. Anticipating cascading effects of extreme precipitation with pathway schemes—Three case studies from Europe. Environ. Int. 2019, 127, 291–304. [Google Scholar] [CrossRef] [PubMed]
- Kumasaki, M.; King, M.; Arai, M.; Yang, L. Anatomy of cascading natural disasters in Japan: Main modes and linkages. Nat. Hazards 2016, 80, 1425–1441. [Google Scholar] [CrossRef] [Green Version]
- Neri, M.; Le Cozannet, G.; Thierry, P.; Bignami, C.; Ruch, J. A method for multi-hazard mapping in poorly known volcanic areas: An example from Kanlaon (Philippines). Nat. Hazards Earth Syst. Sci. 2013, 13, 1929–1943. [Google Scholar] [CrossRef] [Green Version]
- Tarvainen, T.; Jarva, J.; Greiving, S. Spatial pattern of hazards and hazard interactions in Europe. In Natural and Technological Hazards and Risks Affecting the Spatial Development of European Regions; Schmidt-Thomé, P., Ed.; Geological Survey of Finland: Espoo, Finland, 2006; Volume 42, pp. 83–91. [Google Scholar]
- Kappes, M.S.; Keiler, M.; von Elverfeldt, K.; Glade, T. Challenges of analysing multi-hazard risk: A review. Nat. Hazards 2012, 64, 1925–1958. [Google Scholar] [CrossRef] [Green Version]
- Boaz, A.; Ashby, D.; Young, K. Systematic Reviews: What Have They Got to Offer for Evidence Based Policy and Practice: Working Paper 2; Economic and Social Research Council: Swindon, UK, 2002. [Google Scholar]
- Moher, D.; Liberati, A.; Tetzlaff, J.; Altman, D.G.; The PRISMA Group. Preferred reporting items for systematic reviews and meta-analyses: The PRISMA statement. Int. J. Surg. 2010, 8. [Google Scholar] [CrossRef] [Green Version]
- Ryan, B.J.; Franklin, R.C.; Burkle, F.M.; Watt, K.; Aitken, P.; Smith, E.C.; Leggat, P. Analyzing the impact of severe Tropical Cyclone Yasi on public health Infrastructure and the management of noncommunicable diseases. Prehosp. Disaster Med. 2014, 30, 28–37. [Google Scholar] [CrossRef]
- Tonn, G.L.; Guikema, S.D.; Ferreira, C.M.; Quiring, S.M. Hurricane Isaac: A longitudinal analysis of storm characteristics and power outage risks. Risk Anal. 2016, 36, 1936–1947. [Google Scholar] [CrossRef] [PubMed]
- Cuñado, J.; Ferreira, S. The macroeconomic impacts of natural disasters: New evidence from floods. In Proceedings of the Agricultural and Applied Economics Association 2011 Annual Meeting, Pittsburgh, PA, USA, 24–26 July 2011. [Google Scholar] [CrossRef]
- Turoff, M. An alternative approach to cross impact analysis. Technol. Forecast. Soc. Chang. 1972, 3, 309–339. [Google Scholar] [CrossRef]

| Criteria | Application |
|---|---|
| Follows a Protocol | Followed steps outlined in the Preferred Reporting Items for Systematic Reviews and Meta-Analyses (PRISMA) protocol [27]: Identification, Screening, Eligibility, Inclusion. |
| Answers a Research Question | Answered: 1. What are the infrastructural impacts resulting from rain-related hazards? 2. What are the mechanisms explaining how each impact was caused? |
| Appraises Research Quality | Reviewed academic journal articles, subject to relatively standardized peer review processes. All identified mechanisms subject to review from a disaster resilience and civil engineering expert. |
| Addresses as Much Research as Possible | Drew on more than 22,800 publications covered by Scopus and 21,177 covered by the Web of Science Core Collection. |
| Synthesizes Research Findings | Findings synthesized into a selective extension of a pre-existing matrix from Gill and Malamud [2]. |
| As Objective as Possible | Key parts of coding framework subject to inter-rater reliability testing. |
| Update in Order to Remain Relevant | All database searches updated within two weeks of initial review. |
| Year | Event | Location | Country |
|---|---|---|---|
| Not dated (n.d.) | Not named | Flanders | Belgium |
| n.d. | Not named | Northeast Area | USA |
| 1831 | Not named | Avarua | Cook Islands |
| 1871 | Cartago Floods | Cartago City | Costa Rica |
| 1935 | Not named | Avarua | Cook Islands |
| 1946 | Not named | Ngatangiia | Cook Islands |
| 1962 | Not named | Mid-Atlantic Coast | USA |
| 1967 | Not named | Avarua | Cook Islands |
| 1974 | Not named | ltmündener Wand | Germany |
| 1985 | Not named | Tibet | China |
| 1987 | Cyclone Sally | Avarua | Cook Islands |
| 1987 | Not named | Martell Valley | Italy |
| 1988 | Not named | Midui | China |
| 1993 | Not named | Zêzere Valley | Portugal |
| Not named | Sirwolte | Switzerland | |
| 1994 | Phojal Nalla Flood | Kullu District | India |
| 1995 | Not named | Vorarlberg | Austria |
| 1997 | Bugobero Village Landslide | Bugobero | Uganda |
| 1999 | Not named | New York City | USA |
| Not named | Teziutlán | Mexico | |
| Odisha Super Typhoon | Odisha | India | |
| 2001 | Tropical Storm Allison | Texas | USA |
| 2002 | Not named | Eilenberg | Germany |
| 2003 | Not named | New York City | USA |
| 2004 | Cyclone Heta | Avarua | Cook Islands |
| Not named | Hua-Qing Highway | China | |
| Not named | Northern Apennines | Italy | |
| Sextas Landslide | Tena Valley | Spain | |
| Typhoon No. 23 | Kansai | Japan | |
| 2005 | Cyclone Meena | Avarua | Cook Islands |
| Cyclone Nancy | Matavera | Cook Islands | |
| Ngatangiia Harbour | Cook Islands | ||
| Hurricane Katrina | Gulf Coast | USA | |
| New Orleans | USA | ||
| Not named | Apulia | Italy | |
| Not named | Zêzere Valley | Portugal | |
| Not named | Carlisle | UK | |
| 2006 | March River Flood | March River | Austria |
| 2007 | Cyclone Sidr | Sarankhola Upazi | Bangladesh |
| Not named | Altay | China | |
| 2008 | Not named | Solent | UK |
| Sextas Landslide | Tena Valley | Spain | |
| 2009 | La Selva Landslide | Tena Valley | Spain |
| Not named | Tianmo | China | |
| 2009 to 2011 | Not named | Calabria | Italy |
| 2010 | Central Indus Basin Floods | Muzaffargarh | Pakistan |
| Not named | Calabria | Italy | |
| Not named | Gimigliano | Italy | |
| Not named | San Fratello | Italy | |
| 2011 | Not named | Chia | Colombia |
| Not named | Syracuse | USA | |
| Typhoon Roke | Tokai, Japan | ||
| 2012 | Hurricane Sandy | Connecticut | USA |
| New Jersey | USA | ||
| New York | USA | ||
| 2012 | Not named | Beijing | China |
| Not named | Haitong | China | |
| Not named | Xiqu | China | |
| Not named | South-West Dieppe | France | |
| Superstorm Sandy | New York | USA | |
| 2013 | Central Europe Floods | Not specified | Germany |
| Colorado Floods | Boulder County | USA | |
| Cyclone Phailin | Odisha | India | |
| Not named | Not specified | Austria | |
| Not named | Peace River | Canada | |
| Not named | Garhwal Himalaya | India | |
| Not named | Piedmont | Italy | |
| Not named | Far East Russia | Russia | |
| Not named | Norrala | Sweden | |
| Typhoon Haiyan | Tacloban City | Philippines | |
| 2014 | Madeira River Floods | Madeira River | Brazil |
| Not named | Acre State | Brazil | |
| Not named | Outer Carpathian | Poland | |
| Not named | Loch Insh | Scotland | |
| Not named | Not specified | Slovenia | |
| Not named | Värmland | Sweden | |
| Not named | Västra Götaland | Sweden | |
| 2015 | Hurricane Patricia | Colima | Mexico |
| Not named | Rest and be Thankful | Scotland | |
| Tropical Storm Erika | Not Specified | Dominica | |
| 2016 | Hurricane Matthew | Princeville | USA |
| 2017 | Hurricane Harvey | Houston | USA |
| Hurricane Irma | Florida | USA | |
| Not named | Jushui Basin | Japan |
| Trigger | Impacted Infrastructure | Mechanisms |
|---|---|---|
| Flood | Agriculture | Blockage, Debris Transport, Erosion, Inundation |
| Buildings | Burying, Contamination, Debris Transport, Destabilization, Erosion, Force, Impact, Incision, Inundation, Scour | |
| Telecommunications | Impact, Scour | |
| Electricity | Burying, Debris Transport, Erosion, Force, Inundation | |
| Railway | Burying, Erosion, Force, Inundation, Subsidence, Undermining | |
| Roads | Burying, Debris Transport, Erosion, Force, Impact, Incision, Inundation, Scour, Sediment Transport, Subsidence | |
| Water Supply | Contamination, Debris Transport, Inundation | |
| Ground Collapse | Buildings | Subsidence |
| Roads | Subsidence | |
| Landslide | Agriculture | Burying, Erosion, Displacement, Subsidence |
| Buildings | Burying, Debris Transport, Erosion, Force, Impact, Settling, Subsidence, Translation | |
| Electricity | Displacement, Erosion, Force, Subsidence | |
| Oil & Gas | Displacement | |
| Railway | Sediment Transport | |
| Roads | Blockage, Burying, Debris Transport, Displacement, Erosion, Impact, Sediment Transport, Subsidence, Translation | |
| Water Supply | Displacement, Erosion, Force, Subsidence, Translation | |
| Storm | Agriculture | Inundation |
| Buildings | Inundation, Mold, Wind | |
| Telecommunications | Wind | |
| Electricity | Lightning, Snow Load, Tree Fall, Wind | |
| Oil & Gas | Wind | |
| Railway | Wind | |
| Roads | Erosion, Ice, Inundation, Tree Fall, Wind | |
| Storm Surge | Agriculture | Inundation, Salination |
| Buildings | Debris Transport, Erosion, Impact, Inundation | |
| Roads | Debris Transport, Erosion, Inundation, Scour, Undermining |
© 2020 by the authors. Licensee MDPI, Basel, Switzerland. This article is an open access article distributed under the terms and conditions of the Creative Commons Attribution (CC BY) license (http://creativecommons.org/licenses/by/4.0/).
Share and Cite
Huggins, T.J.; E, F.; Chen, K.; Gong, W.; Yang, L. Infrastructural Aspects of Rain-Related Cascading Disasters: A Systematic Literature Review. Int. J. Environ. Res. Public Health 2020, 17, 5175. https://doi.org/10.3390/ijerph17145175
Huggins TJ, E F, Chen K, Gong W, Yang L. Infrastructural Aspects of Rain-Related Cascading Disasters: A Systematic Literature Review. International Journal of Environmental Research and Public Health. 2020; 17(14):5175. https://doi.org/10.3390/ijerph17145175
Chicago/Turabian StyleHuggins, Thomas J., Feiyu E, Kangming Chen, Wenwu Gong, and Lili Yang. 2020. "Infrastructural Aspects of Rain-Related Cascading Disasters: A Systematic Literature Review" International Journal of Environmental Research and Public Health 17, no. 14: 5175. https://doi.org/10.3390/ijerph17145175
APA StyleHuggins, T. J., E, F., Chen, K., Gong, W., & Yang, L. (2020). Infrastructural Aspects of Rain-Related Cascading Disasters: A Systematic Literature Review. International Journal of Environmental Research and Public Health, 17(14), 5175. https://doi.org/10.3390/ijerph17145175