Relationship between Sprint Velocity and Peak Moment at Shoulder and Elbow in Elite Wheelchair Basketball Players

 , ,
, ,
Abstract
1. Introduction
2. Materials and Methods
2.1. Participants
2.2. Instrumentation
2.3. Design and Procedures
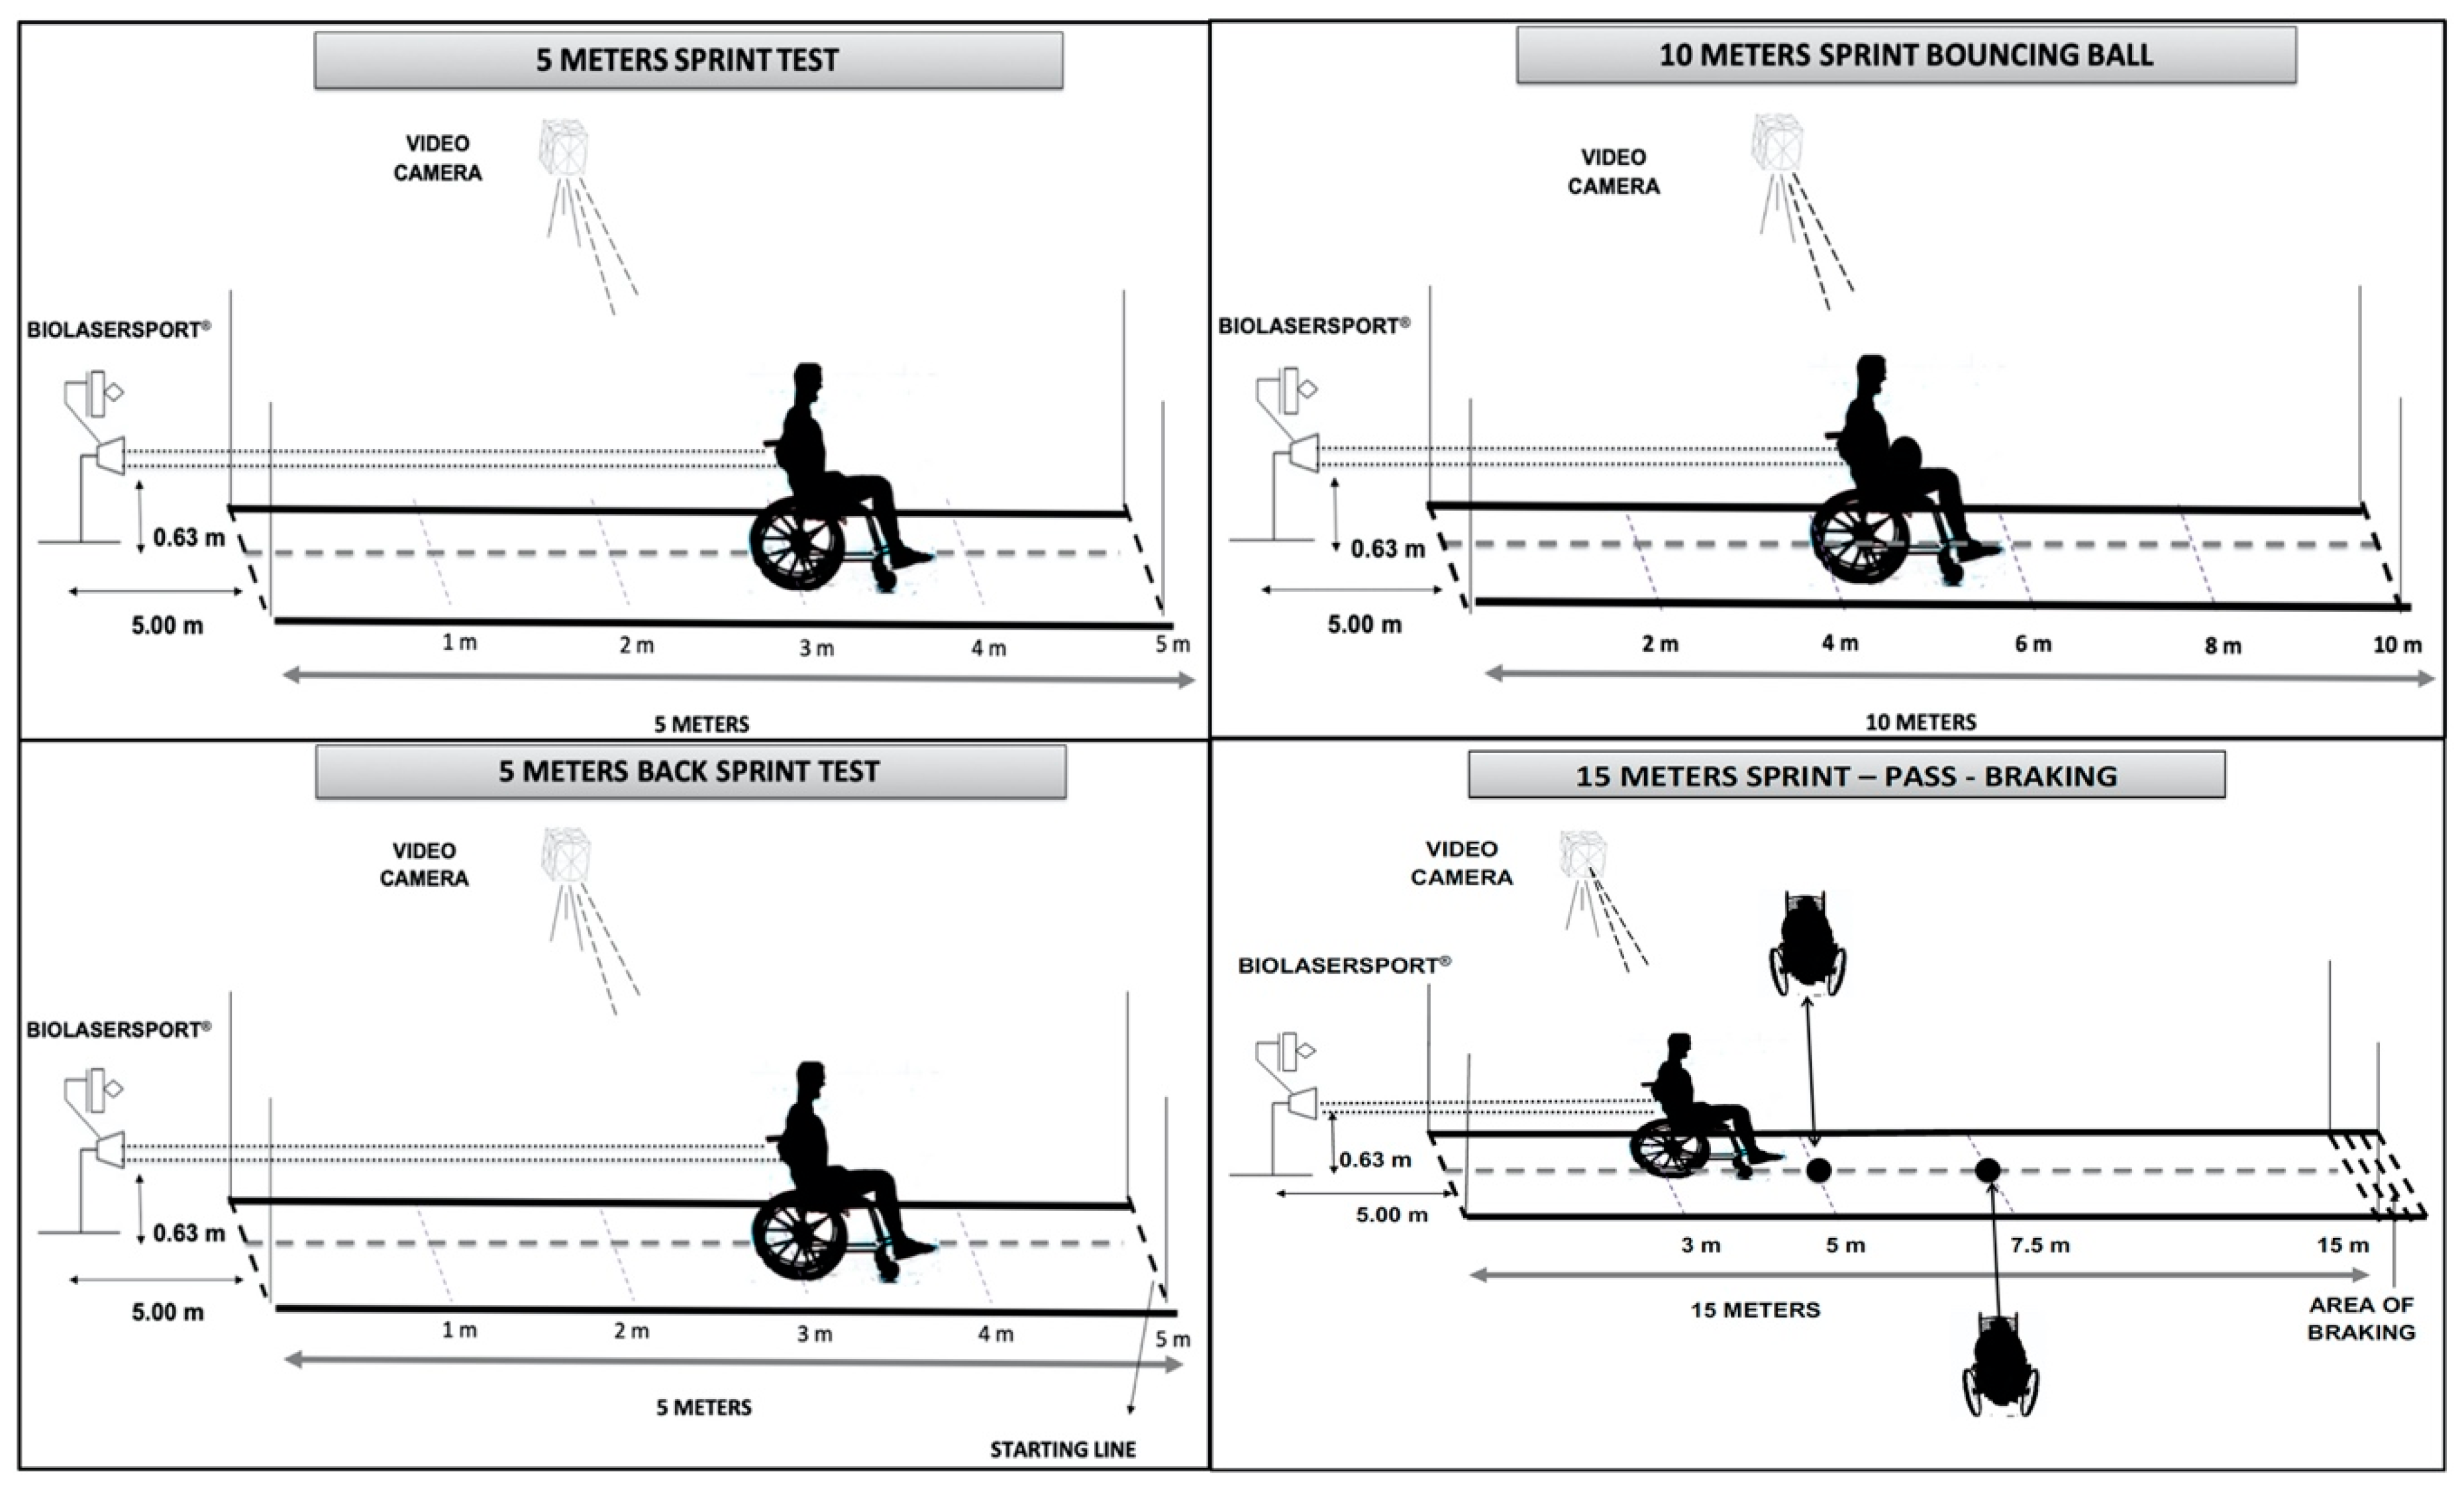
2.3.1. Field Sprint Tests
2.3.2. Isokinetic Testing
2.4. Statistical Analysis
3. Results
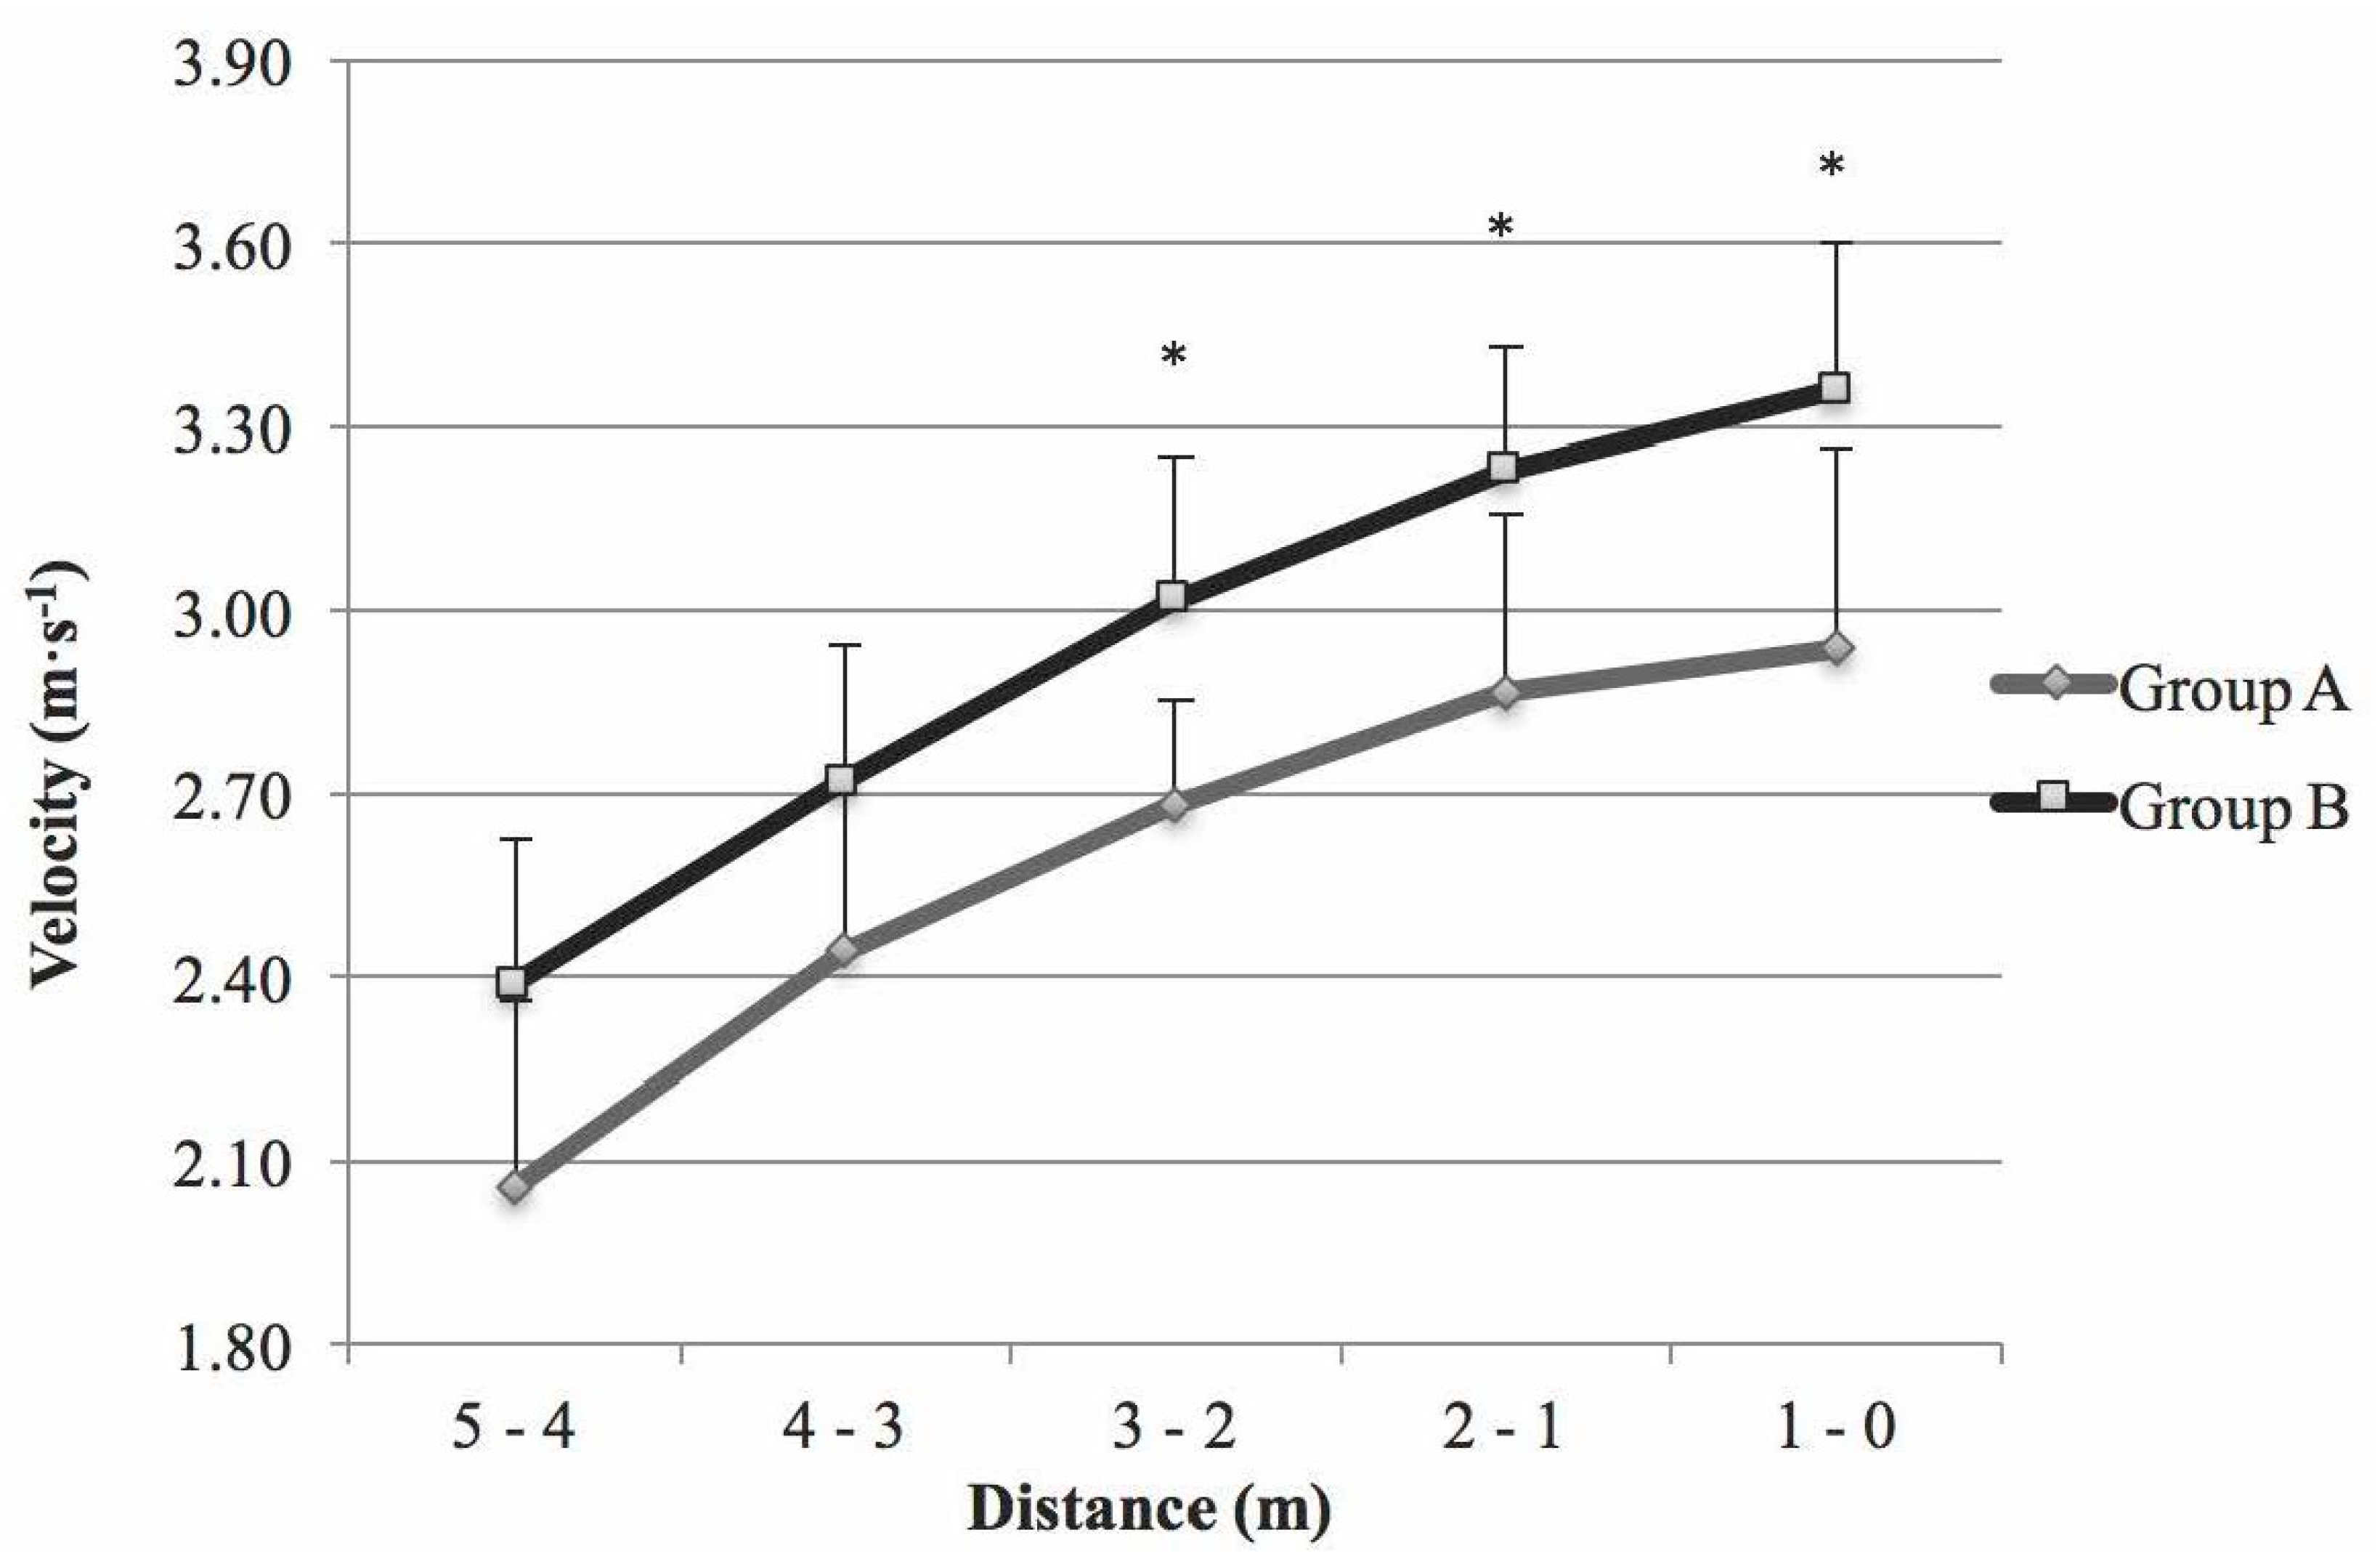
3.1. Field Sprint Tests
3.2. Isokinetic Test
3.3. Relationships between Peak Moment and Sprint Velocity
4. Discussion
5. Conclusions
Author Contributions
Funding
Acknowledgments
Conflicts of Interest
References
- Wang, Y.T.; Chen, S.; Limroongreungrat, W.; Change, L. Contributions of Selected Fundamental Factors to Wheelchair Basketball Performance. Med. Sci. Sports Exerc. 2005, 37, 130–137. [Google Scholar] [CrossRef] [PubMed]
- International Wheelchair Basketball Federation. International Wheelchair Basketball Federation Official Player Classification Manual; International Wheelchair Basketball Federation: Winnipeg, MB, Canada, 2014. [Google Scholar]
- International Paralympic Committee. IPC Athlete Classification Code; International Paralympic Committee: Bonn, Germany, 2015. [Google Scholar]
- Tweedy, S.M.; Vanlandewijck, Y.C. International Paralympic Committee Position Stand--Background and Scientific Principles of Classification in Paralympic Sport. Br. J. Sports Med. 2011, 45, 259–269. [Google Scholar] [CrossRef] [PubMed]
- Strohkendl, H.; International Wheelchair Basketball Federation; Thiboutot, A. The 50th Anniversary of Wheelchair Basketball; Waxmann: Muenster, Germany, 1996. [Google Scholar]
- van der Slikke, R.M.A.; Bregman, D.J.; Berger, M.A.; De Witte, A.M. The Future of Classification in Wheelchair Sports: Can Data Science and Technological Advancement Offer an Alternative Point of View? Int. J. Sport Physiol. 2018, 13, 742–749. [Google Scholar]
- Saltan, A.; Ankarali, H. The Role of Trunk Stabilization in Functional-Classification Levels in Wheelchair Basketball. J. Sport Rehab. 2017, 26, 287–293. [Google Scholar] [CrossRef] [PubMed]
- da Silva Santos, S.; Krishnan, C.; Alonso, A.C.; Greve, J.M.D. Trunk Function Correlates Positively with Wheelchair Basketball Player Classification. Am. J. Phys. Med. Rehab. 2017, 96, 101–108. [Google Scholar] [CrossRef]
- Seron, B.B.; Oliveira de Carvalho, E.M.; Greguol, M. Analysis of Physiological and Kinematic Demands of Wheelchair Basketball Games-A Review. J. Strength Cond. Res. 2019, 33, 1453–1462. [Google Scholar] [CrossRef] [PubMed]
- De Groot, S.; Balvers, I.J.; Kouwenhoven, S.M.; Janssen, T.W. Validity and Reliability of Tests Determining Performance-Related Components of Wheelchair Basketball. J. Sports Sci. 2012, 30, 879–887. [Google Scholar] [CrossRef]
- Molik, B.; Laskin, J.; Kosmol, A.; Marszałek, J.; Morgulec-Adamowicz, N.; Frick, T. Relationships between Anaerobic Performance, Field Tests, and Functional Level of Elite Female Wheelchair Basketball Athletes. Hum. Mov. 2013, 14, 366–371. [Google Scholar] [CrossRef]
- Vanlandewijck, Y.; Daly, D.; Theisen, D. Field Test Evaluation of Aerobic, Anaerobic, and Wheelchair Basketball Skill Performances. Int. J. Sports Med. 1999, 20, 548–554. [Google Scholar] [CrossRef]
- Ferro, A.; Villacieros, J.; Pérez-Tejero, J. Sprint Performance of Elite Wheelchair Basketball Players: Applicability of a Laser System for Describing the Velocity Curve. Adapt. Phys. Act. Q. 2016, 33, 358–373. [Google Scholar] [CrossRef]
- Marszałek, J.; Kosmol, A.; Morgulec-Adamowicz, N.; Mróz, A.; Gryko, K.; Klavina, A.; Skucas, K.; Navia, J.A.; Molik, B. Laboratory and Non-Laboratory Assessment of Anaerobic Performance of Elite Male Wheelchair Basketball Athletes. Front. Psychol. 2019, 10, 514. [Google Scholar] [CrossRef] [PubMed]
- Coutts, K.D. Peak Oxygen Uptake of Elite Wheelchair Athletes. Adapt. Phys. Act. Q. 1990, 7, 62–66. [Google Scholar] [CrossRef]
- De Lira, C.; Vancini, R.; Minozzo, F.; Sousa, B.; Dubas, J.; Andrade, M.; Steinberg, L.; Da Silva, A. Relationship between Aerobic and Anaerobic Parameters and Functional Classification in Wheelchair Basketball Players. Scand. J. Med. Sci. Sports 2010, 20, 638–643. [Google Scholar] [CrossRef]
- Rao, S.S.; Bontrager, E.L.; Gronley, J.; Newsam, C.J.; Perry, J. Three-Dimensional Kinematics of Wheelchair Propulsion. IEEE Trans. Rehabil. Eng. 1996, 4, 152–160. [Google Scholar] [CrossRef] [PubMed]
- Calmels, P.; Berthouze, S.; Barral, F.; Domenach, M.; Minaire, P. A Comparative Study of the Muscle Strength and Mass of the Arm Flexors and Extensors in Paraplegic and in Non Paraplegic Basketball Players. Spinal. Cord. 1992, 30, 509–516. [Google Scholar] [CrossRef][Green Version]
- Basar, S.; Ergün, N.; Yiğiter Bayramlar, K. A Comparative Study of Muscle Strength and Anaerobic Power of the Young National and National Junior Wheelchair Basketball Players. J. Phys. Med. Rehabil. 2013, 59, 325–329. [Google Scholar]
- Granados, C.; Yanci, J.; Badiola, A.; Iturricastillo, A.; Otero, M.; Olasagasti, J.; Bidaurrazaga-Letona, I.; Gil, S.M. Anthropometry and Performance in Wheelchair Basketball. J. Strength Cond. Res. 2015, 29, 1812–1820. [Google Scholar] [CrossRef] [PubMed]
- Vanlandewijck, Y.; Theisen, D.; Daly, D. Wheelchair Propulsion Biomechanics. Sports Med. 2001, 31, 339–367. [Google Scholar] [CrossRef]
- Williams, J.R. The Declaration of Helsinki and Public Health. Bull. World Health Organ. 2008, 86, 650–652. [Google Scholar] [CrossRef]
- Ferro, A.; Floria, P. Kinematic Analysis System in Real Time Fortraining and Sports Competitions. Patent ES2331170A1 (A61B 5/11-G01S 11/00), 2010. [Google Scholar]
- Ferro, A. BioLaserSport; Trademark No. 3019808; Official Bulletin of Industrial Property: Madrid, Spain, 2012. [Google Scholar]
- Ferro, A.; Floria, P.; Villacieros, J.; Aguado, R. Validity and Reliability of the Laser Sensor of BioLaserSport® System for the Analysis of the Running Velocity. Rev. Int. Cien. Deporte. 2012, 8, 357–370. [Google Scholar] [CrossRef]
- Edouard, P.; Calmels, P.; Degache, F. The Effect of Gravitational Correction on Shoulder Internal and External Rotation Strength. Isokinet. Exerc. Sci. 2009, 17, 35–39. [Google Scholar]
- Cohen, J. Statistical Power Analysis for the Behavioral Sciences; Academic Press: Cambridge, MA, USA, 2013. [Google Scholar]
- Vanlandewijck, Y.C.; Evaggelinou, C.; Daly, D.J.; Verellen, J.; Van Houtte, S.; Aspeslagh, V.; Hendrickx, R.; Piessens, T.; Zwakhoven, B. The Relationship between Functional Potential and Field Performance in Elite Female Wheelchair Basketball Players. J. Sports Sci. 2004, 22, 668–675. [Google Scholar] [PubMed]
- Molik, B.; Laskin, J.J.; Kosmol, A.; Skucas, K.; Bida, U. Relationship between Functional Classification Levels and Anaerobic Performance of Wheelchair Basketball Athletes. Res. Q. Exerc. Sport 2010, 81, 69–73. [Google Scholar] [PubMed]
- Shepherd, J.B.; James, D.A.; Espinosa, H.G.; Thiel, D.V.; Rowlands, D.D. A Literature Review Informing an Operational Guideline for Inertial Sensor Propulsion Measurement in Wheelchair Court Sports. Sports 2018, 6, 34. [Google Scholar] [CrossRef]
- Turbanski, S.; Schmidtbleicher, D. Effects of Heavy Resistance Training on Strength and Power in Upper Extremities in Wheelchair Athletes. J. Strength Cond Res. 2010, 24, 8–16. [Google Scholar]
- Nyland, J.; Robinson, K.; Caborn, D.; Knapp, E.; Brosky, T. Shoulder Rotator Torque and Wheelchair Dependence Differences of National Wheelchair Basketball Association Players. Arch. Phys. Med. Rehabil. 1997, 78, 358–363. [Google Scholar]


| Group | Age | Weight (Kg) | Height (m) | Disability | IWFB Classification | Experience (Years) |
|---|---|---|---|---|---|---|
| A | 23 | 48 | 1.75 | Paraplegia | 1 | 6 |
| A | 41 | 69 | 1.76 | Paraplegia | 1 | 19 |
| A | 39 | 78 | 1.84 | Paraplegia | 1.5 | 22 |
| A | 22 | 59 | 1.84 | Paraplegia | 2.5 | 5 |
| A | 23 | 72 | 1.75 | Paraplegia | 2.5 | 6 |
| B | 26 | 73 | 1.70 | Spina Bifida | 3 | 8 |
| B | 26 | 83 | 1.78 | Spina Bifida | 3 | 8 |
| B | 39 | 90 | 1.82 | Paraplegia | 3 | 21 |
| B | 28 | 52 | 1.71 | Spina Bifida | 3 | 10 |
| B | 23 | 75 | 1.86 | Amputation | 4 | 5 |
| B | 32 | 102 | 1.80 | Amputation | 4 | 17 |
| B | 37 | 87 | 1.88 | Amputation | 4 | 20 |
| Sample | 29.91 ± 7.27 | 75.66 ± 13.97 | 1.79 ± 0.05 | 12.25 ± 6.90 |
| Field Test (Vmax) (m/s) | Category | Mean | SD | SE | p | d |
|---|---|---|---|---|---|---|
| 5 m forward sprint (5F) | A | 3.79 | 0.20 | 0.09 | 0.08 | 0.4 |
| B | 3.98 | 0.14 | 0.05 | |||
| 10 m forward sprint with ball (10FB) | A | 4.03 | 0.31 | 0.14 | 0.461 | 0.21 |
| B | 4.16 | 0.29 | 0.11 | |||
| 5 m back sprint (5B) | A | 2.81 | 0.34 | 0.15 | 0.028 * | 0.63 |
| B | 3.06 | 0.30 | 0.11 | |||
| 15 m sprint-pass-braking (15PB) | A | 4.03 | 0.34 | 0.15 | 0.072 | 0.49 |
| B | 4.37 | 0.25 | 0.10 | |||
| Isokinetic testing PM (Nm) Dominant side (DS) | ||||||
| Internal shoulder rotation (ISR) 60°/s | A | 57.40 | 15.57 | 6.96 | 0.09 * | 0.71 |
| B | 87.57 | 16.39 | 6.19 | |||
| 180°/s | A | 51.00 | 21.67 | 9.69 | 0.018 * | 0.67 |
| B | 81.43 | 15.67 | 5.92 | |||
| External shoulder rotation (ESR) 180°/s | A | 39.40 | 12.93 | 5.78 | 0.151 | 0.42 |
| B | 52.57 | 15.40 | 5.82 | |||
| Elbow flexion (EF) 60°/s | A | 73.20 | 15.30 | 6.84 | 0.52 | 0.19 |
| B | 80.14 | 19.18 | 7.25 | |||
| 150°/s | A | 62.00 | 16.23 | 7.26 | 0.703 | 0.11 |
| B | 66.00 | 18.12 | 6.85 | |||
| Elbow extension (EE) 60°/s | A | 73.80 | 17.44 | 7.80 | 0.565 | 0.17 |
| B | 79.86 | 17.34 | 6.56 | |||
| 150°/s | A | 58.40 | 17.49 | 7.82 | 0.293 | 0.3 |
| B | 69.86 | 17.73 | 6.70 | |||
| Field Test | Vmax by Sections (m/s) | EF 60 °/s DS | EF 150 °/s DS | EE 150 °/s DS | EE 150 °/s NDS | ISR 60 °/s DS | ISR 180 °/s DS | ISR 180 °/s NDS | ESR 180 °/s DS | ESR 180 °/s NDS |
|---|---|---|---|---|---|---|---|---|---|---|
| Vmax0–1 | 0.672 * | 0.599 * | 0.587 * | |||||||
| Vmax1–2 | 0.676 * | 0.557 | 0.484 | |||||||
| 5F | Vmax2–3 | 0.775 ** | 0.689 * | 0.581 * | ||||||
| Vmax3–4 | 0.719 ** | 0.628 * | 0.562 | |||||||
| Vmax4–5 | 0.677 * | 0.579 * | 0.556 | |||||||
| Vmax5–4 | 0.411 | 0.481 | ||||||||
| Vmax4–3 | 0.485 | 0.443 | ||||||||
| 5B | Vmax3–2 | 0.646 * | 0.610 * | |||||||
| Vmax2–1 | 0.579 * | 0.509 | ||||||||
| Vmax1–0 | 0.621 * | 0.490 | ||||||||
| Vmax0–2 | 0.408 | 0.280 | 0.256 | 0.574 | 0.510 | 0.375 | 0.364 | |||
| Vmax2–4 | 0.523 | 0.528 | 0.470 | 0.675 * | 0.648 * | 0.556 | 0.589 * | |||
| 10FB | Vmax4–6 | 0.556 | 0.559 | 0.500 | 0.745 ** | 0.677 * | 0.606 * | 0.641 * | ||
| Vmax6–8 | 0.545 | 0.556 | 0.560 | 0.749 ** | 0.731 ** | 0.640 * | 0.650 * | |||
| Vmax8–10 | 0.644 * | 0.683 * | 0.634 * | 0.673 * | 0.643 * | 0.619 * | 0.635 * | |||
| Vmax0–3 | 0.594 * | 0.505 | 0.475 | 0.553 | 0.707 * | 0.638 * | 0.583 * | 0.584 * | 0.654 * | |
| 15PB | Vmax3–5 | 0.462 | 0.405 | 0.416 | 0.507 | 0.478 | 0.443 | 0.575 | 0.495 | 0.635 * |
| Vmax5–7.5 | 0.580 * | 0.582 * | 0.582 * | 0.536 | 0.650 * | 0.601 * | 0.522 | 0.547 | 0.574 | |
| Vmax7.5–15 | 0.742 ** | 0.660 * | 0.675 * | 0.719 ** | 0.744 ** | 0.777 ** | 0.659 * | 0.656 * | 0.668 * |
© 2020 by the authors. Licensee MDPI, Basel, Switzerland. This article is an open access article distributed under the terms and conditions of the Creative Commons Attribution (CC BY) license (http://creativecommons.org/licenses/by/4.0/).
Share and Cite
Villacieros, J.; Pérez-Tejero, J.; Garrido, G.; Grams, L.; López-Illescas, Á.; Ferro, A. Relationship between Sprint Velocity and Peak Moment at Shoulder and Elbow in Elite Wheelchair Basketball Players. Int. J. Environ. Res. Public Health 2020, 17, 6989. https://doi.org/10.3390/ijerph17196989
Villacieros J, Pérez-Tejero J, Garrido G, Grams L, López-Illescas Á, Ferro A. Relationship between Sprint Velocity and Peak Moment at Shoulder and Elbow in Elite Wheelchair Basketball Players. International Journal of Environmental Research and Public Health. 2020; 17(19):6989. https://doi.org/10.3390/ijerph17196989
Chicago/Turabian StyleVillacieros, Jorge, Javier Pérez-Tejero, Guadalupe Garrido, Lena Grams, África López-Illescas, and Amelia Ferro. 2020. "Relationship between Sprint Velocity and Peak Moment at Shoulder and Elbow in Elite Wheelchair Basketball Players" International Journal of Environmental Research and Public Health 17, no. 19: 6989. https://doi.org/10.3390/ijerph17196989
APA StyleVillacieros, J., Pérez-Tejero, J., Garrido, G., Grams, L., López-Illescas, Á., & Ferro, A. (2020). Relationship between Sprint Velocity and Peak Moment at Shoulder and Elbow in Elite Wheelchair Basketball Players. International Journal of Environmental Research and Public Health, 17(19), 6989. https://doi.org/10.3390/ijerph17196989