Different Movement Strategies in the Countermovement Jump Amongst a Large Cohort of NBA Players


Abstract
1. Introduction
2. Materials and Methods
2.1. Experimental Design
2.2. Subjects
2.3. Procedures
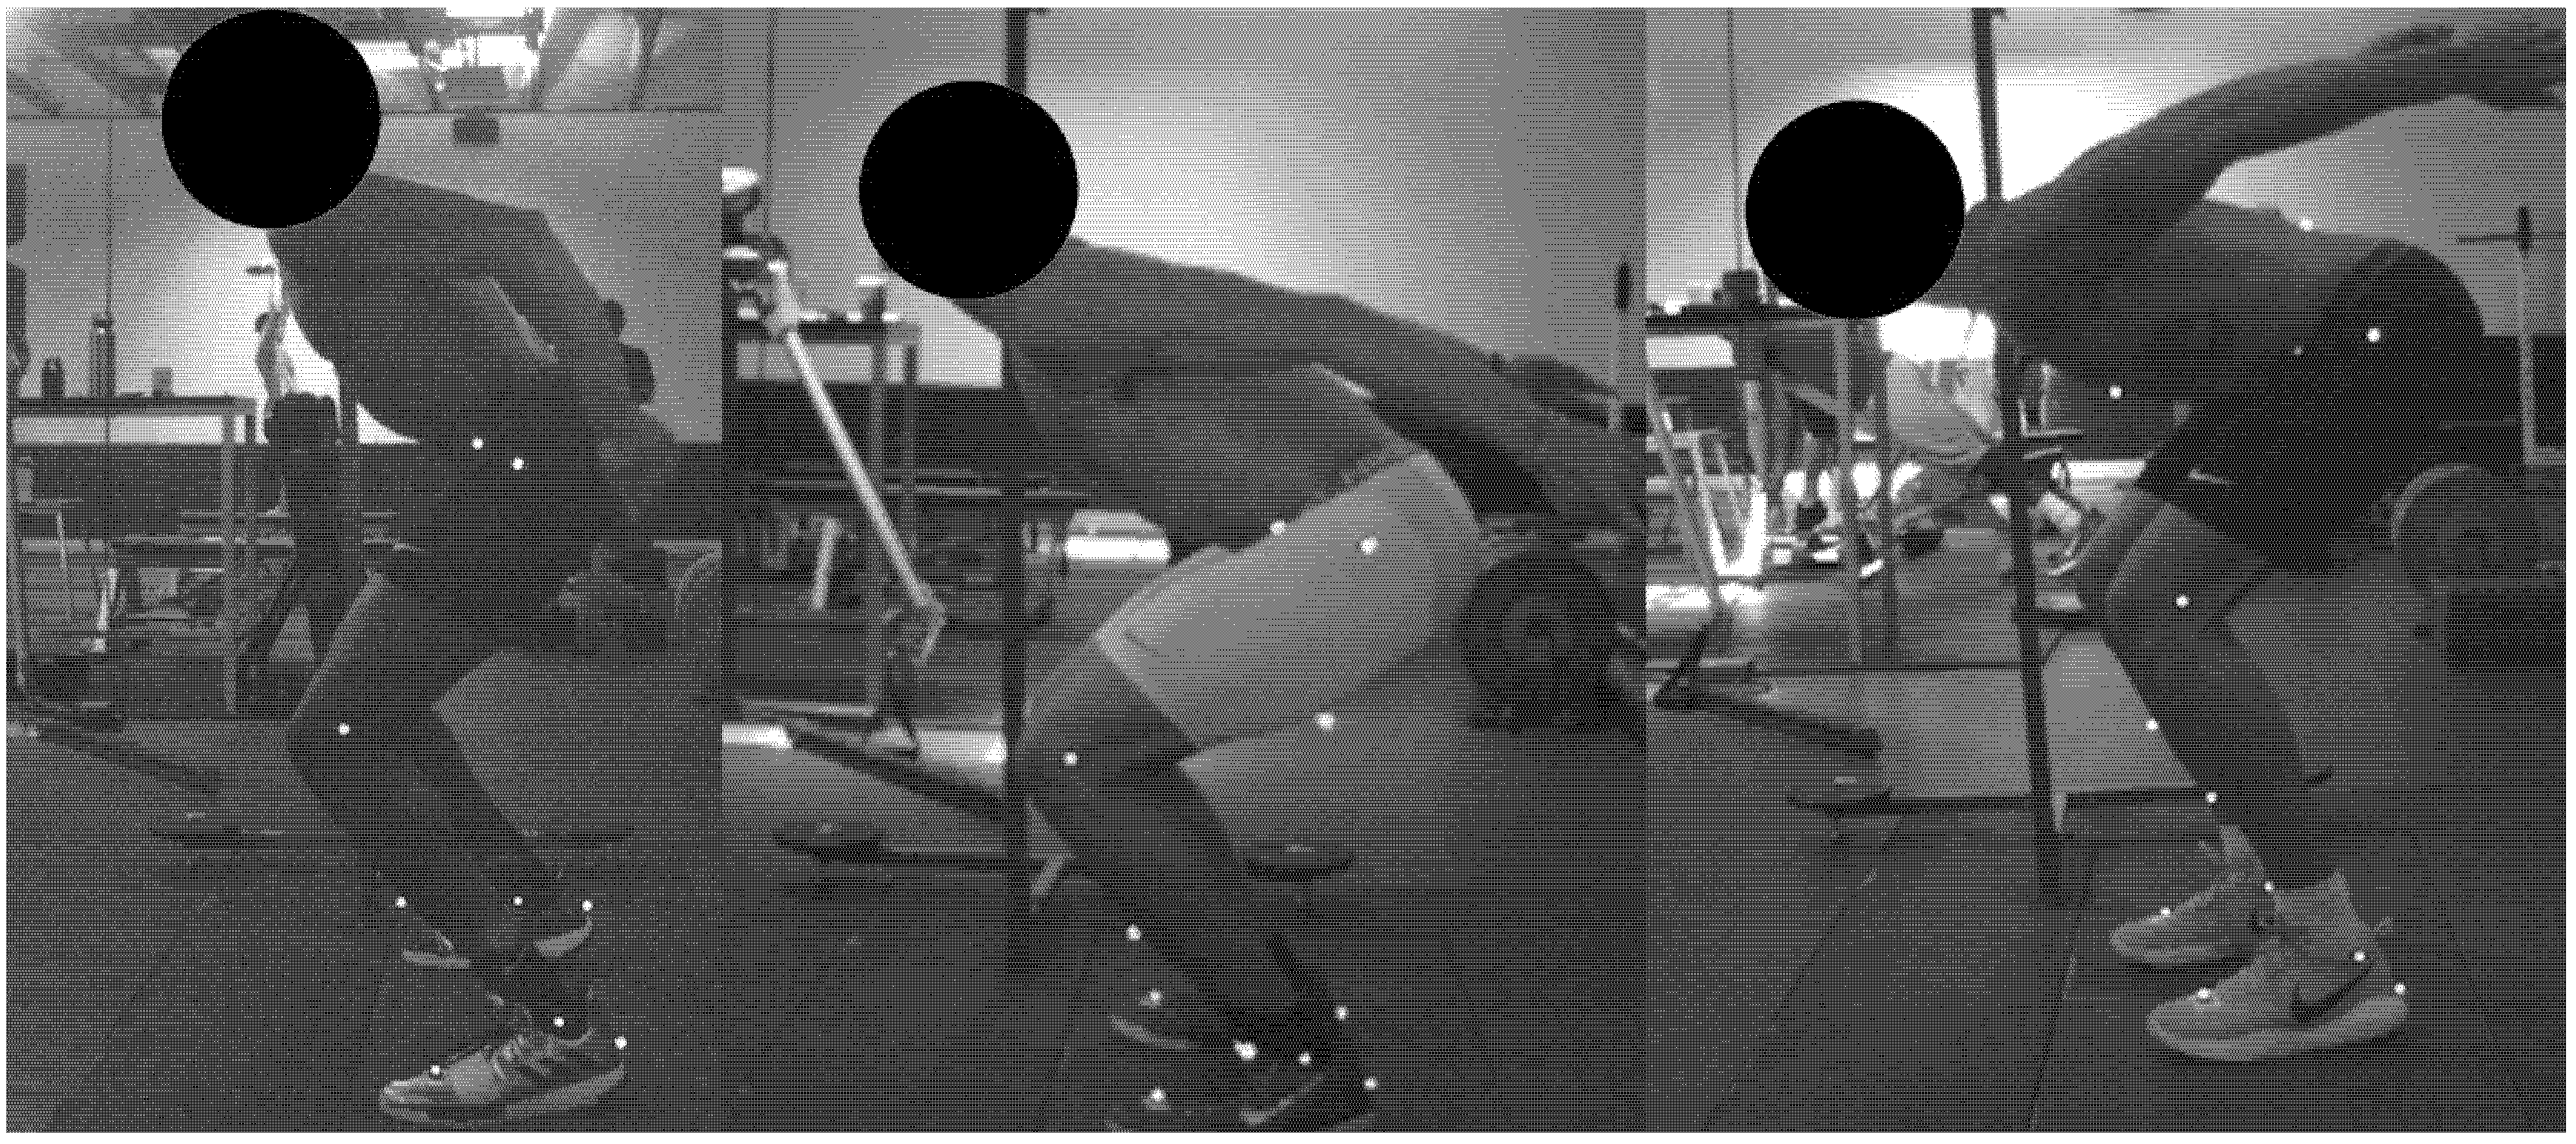
Data Analysis
2.4. Statistical Analysis
3. Results
3.1. Reliability
3.2. k-Means Cluster Analysis
3.3. One Way Analysis of Variance (ANOVA) Delta Flexion at Each Joint between Subgroups
3.4. One Way Analysis of Variance (ANOVA) Descriptive Characteristics between Clusters
3.5. One Way Analysis of Variance (ANOVA) Positional Distribution between Clusters
3.6. Stepwise Regression
4. Discussion
5. Conclusions
Author Contributions
Funding
Acknowledgments
Conflicts of Interest
References
- Ziv, G.; Lidor, R. Vertical jump in female and male basketball players-A review of observational and experimental studies. J. Sci. Med. Sports 2010, 13, 332–339. [Google Scholar] [CrossRef] [PubMed]
- Lockie, R.G.; Beljic, A.; Ducheny, S.C. Relationships between Playing Time and Selected NBA Combine Test Performance in Division I Mid-Major Basketball Players. Int. J. Exerc. Sci. 2020, 13, 583. [Google Scholar] [PubMed]
- Teramoto, M.; Cross, C.L.; Rieger, R.H.; Maak, T.G.; Willick, S.E. Predictive validity of national basketball association draft combine on future performance. J. Strength Cond. Res. 2018, 32, 396–408. [Google Scholar] [CrossRef] [PubMed]
- McMaster, D.T.; Gill, N.; Cronin, J.; McGuigan, M. A brief review of strength and ballistic assessment methodologies in sport. Sports Med. 2014, 44, 603–623. [Google Scholar] [CrossRef]
- McMahon, J.J.; Suchomel, T.J.; Lake, J.P.; Comfort, P. Understanding the key phases of the countermovement jump force-time curve. Strength Cond. J. 2018, 40, 96–106. [Google Scholar] [CrossRef]
- Bobbert, M.F.; Casius, L.J.R. Is the effect of a countermovement on jump height due to active state development? Med. Sci. Sports Exerc. 2005, 37, 440–446. [Google Scholar] [CrossRef]
- Markovic, G.; Jaric, S. Positive and negative loading and mechanical output in maximum vertical jumping. Med. Sci. Sports Exerc. 2007, 39, 1757–1764. [Google Scholar] [CrossRef]
- Markovic, S.; Mirkov, D.M.; Knezevic, O.M.; Jaric, S. Jump training with different loads: Effects on jumping performance and power output. Eur. J. Appl. Physiol. 2013, 113, 2511–2521. [Google Scholar] [CrossRef]
- Markovic, S.; Mirkov, D.M.; Nedeljkovic, A.; Jaric, S. Body size and countermovement depth confound relationship between muscle power output and jumping performance. Hum. Mov. Sci. 2014, 33, 203–210. [Google Scholar] [CrossRef]
- Cormie, P.; McGuigan, M.R.; Newton, R.U. Changes in the eccentric phase contribute to improved stretch-shorten cycle performance after training. Med. Sci. Sports Exerc. 2010, 42, 1731–1744. [Google Scholar] [CrossRef]
- Moran, K.A.; Wallace, E.S. Eccentric loading and range of knee joint motion effects on performance enhancement in vertical jumping. Hum. Mov. Sci. 2007, 26, 824–840. [Google Scholar] [CrossRef] [PubMed]
- Meylan, C.M.P.; Nosaka, K.; Green, J.P.; Cronin, J.B. Variability and influence of eccentric kinematics on unilateral vertical, horizontal, and lateral countermovement jump performance. J. Strength Cond. Res. 2010, 24, 840–845. [Google Scholar] [CrossRef] [PubMed]
- Mandic, R.; Jakovljevic, S.; Jaric, S. Effects of countermovement depth on kinematic and kinetic patterns of maximum vertical jumps. J. Electromyogr. Kinesiol. 2015, 25, 265–272. [Google Scholar] [CrossRef] [PubMed]
- Pérez-Castilla, A.; Rojas, F.J.; Gómez-Martínez, F.; García-Ramos, A. Vertical jump performance is affected by the velocity and depth of the countermovement. Sports Biomech. 2019. [Google Scholar] [CrossRef] [PubMed]
- Moir, G.; Button, C.; Glaister, M.; Stone, M.H. Influence of familiarization on the reliability of vertical jump and acceleration sprinting performance in physically active men. J. Strength Cond. Res. 2004, 18, 276–280. [Google Scholar]
- Kirby, T.J.; McBride, J.M.; Haines, T.L.; Dayne, A.M. Relative net vertical impulse determines jumping performance. J. Appl. Biomech. 2011, 27, 207–214. [Google Scholar] [CrossRef]
- Kipp, K.; Kiely, M.; Giordanelli, M.; Malloy, P.; Geiser, C. Joint- and subject-specific strategies in male basketball players across a range of countermovement jump heights. J. Sports Sci. 2020, 38, 652–657. [Google Scholar] [CrossRef]
- Dowling, J.J.; Vamos, L. Identification of Kinetic and Temporal Factors Related to Vertical Jump Performance. J. Appl. Biomech. 1993, 9, 95–110. [Google Scholar] [CrossRef]
- Lez-Badillo, J.J.; Marques, M.C. Relationship between kinematic factors and countermovement jump height in trained track and field athletes. J. Strength Cond. Res. 2010, 24, 3443–3447. [Google Scholar] [CrossRef]
- Raffalt, P.C.; Alkjær, T.; Simonsen, E.B. Intra- and inter-subject variation in lower limb coordination during countermovement jumps in children and adults. Hum. Mov. Sci. 2016, 46, 63–77. [Google Scholar] [CrossRef]
- Turner, A.N.; Jeffreys, I. The stretch-shortening cycle: Proposed mechanisms and methods for enhancement. Strength Cond. J. 2011, 32, 87–99. [Google Scholar] [CrossRef]
- Frühschütz, H.; Becker, L.; Russ, P.; Spitzenpfel, P. Evaluation of Markerless Tracking for Kinematics in Sport. In Proceedings of the 35th Conference of the International Society of Biomechanics in Sports, Cologne, Germany, 14–18 June 2017. [Google Scholar]
- Willson, J.D.; Binder-Macleod, S.; Davis, I.S. Lower extremity jumping mechanics of female athletes with and without patellofemoral pain before and after exertion. Am. J. Sports Med. 2008, 36, 1587–1596. [Google Scholar] [CrossRef] [PubMed]
- McErlain-Naylor, S.; King, M.; Pain, M.T.; Homa, G. Determinants of countermovement jump performance: A kinetic and kinematic analysis. J. Sports Sci. 2014, 32, 1805–1812. [Google Scholar] [CrossRef] [PubMed]
- Becker, R.A.; Chambers, J.M.; Wilks, A.R. The New S Language. Biometrics 1989, 45, 699. [Google Scholar] [CrossRef]
- Baumgartner, T.A.; Chung, H. Confidence limits for intraclass reliability coefficients. Meas. Phys. Educ. Exerc. Sci. 2001, 5, 179–188. [Google Scholar] [CrossRef]
- Oddsson, L.; Terauds, J.; Gowitzke, B.; Holt, L. What factors determine vertical jumping height. In Biomechanics of Sports V; Hellenic Sports Research Institute: Athens, Greece, 1989; pp. 393–401. [Google Scholar]
- Vanezis, A.; Lees, A. A biomechanical analysis of good and poor performers of the vertical jump. Ergonomics 2005. [Google Scholar] [CrossRef] [PubMed]
- Lake, J.; McMahon, J. Within-Subject Consistency of Unimodal and Bimodal Force Application during the Countermovement Jump. Sports 2018, 6, 143. [Google Scholar] [CrossRef] [PubMed]
- Richter, C.; O’Connor, N.E.; Marshall, B.; Moran, K. Clustering vertical ground reaction force curves produced during countermovement jumps. J. Biomech. 2014, 47, 2385–2390. [Google Scholar] [CrossRef] [PubMed]
- Richter, C.; O’Connor, N.E.; Marshall, B.; Moran, K. Analysis of characterizing phases on waveforms: An application to vertical jumps. J. Appl. Biomech. 2014, 30, 316–321. [Google Scholar] [CrossRef]


| Cluster | n | Delta Ankle Dorsi Flexion (°) | Delta Knee Flexion (°) | Delta Hip Flexion (°) |
|---|---|---|---|---|
| 1 | 77 | 13.1 *,+ ± 3.7 | 40.9 *,+ ± 7.8 | 25.9 *,+ ± 9.71 |
| 2 | 49 | 21.4 #,+ ± 3.2 | 59.7 #,+ ± 7.2 | 50.0 # ± 13.7 |
| 3 | 52 | 14.5 #,* ± 2.6 | 50.7 #,* ± 6.6 | 54.7 # ± 12.4 |
| Total | 178 | 15.8 ± 4.8 | 48.9 ± 10.7 | 41.0 ± 17.7 |
| Cluster | Plantar Flex Velo (m·s−1) | Knee Ext Velo (m·s−1) | Hip Ext Velo (m·s−1) | Rel Con Force (Fz·kg−1) | Rel Brk Force (Fz·kg−1) |
|---|---|---|---|---|---|
| 1 | 737.68 ± 93.65 | 813.98 * ± 56.78 | 499.24 * ± 83.20 | 30.79 *,+ ± 3.05 | 22.69 + ± 4.34 |
| 2 | 760.87 ± 87.06 | 853.97 # ± 67.55 | 548.08 # ± 90.56 | 27.71 # ± 2.93 | 21.75 + ± 3.12 |
| 3 | 730.09 ± 93.21 | 826.67 ± 62.31 | 515.07 ± 83.91 | 28.42 # ± 2.49 | 19.92 #,* ± 3.01 |
| Total | 741.85 ± 92.55 | 828.70 ± 63.69 | 517.31 ± 87.82 | 29.25 ± 3.17 | 21.62 ± 3.85 |
| Cluster | Net Rel Impulse (N·s·kg−1) | TMT (s) | Height (cm) | Weight (kg) | CMJ Height (cm) |
| 1 | 3.27 ± 0.33 | 0.72 * ± 0.18 | 199.97 ± 8.08 | 99.45 ± 11.49 | 68.60 ± 6.55 |
| 2 | 3.26 ± 0.38 | 0.93 # ± 0.22 | 198.63 ± 7.46 | 97.11 ± 11.98 | 70.47 ± 9.17 |
| 3 | 3.19 ± 0.29 | 0.98 ± 0.22 | 202.18 ± 7.86 | 101.52 ± 11.50 | 67.31 ± 6.35 |
| Total | 3.24 ± 0.33 | 0.85 ± 0.24 | 200.25 ± 7.96 | 99.41 ± 11.75 | 68.74 ± 7.41 |
| Cluster | n | Guards Total | Guards % | Forwards Total | Forwards % | Centers Total | Center % |
|---|---|---|---|---|---|---|---|
| 1 | 77 | 39 | 50.65 | 26 | 33.77 | 12 | 15.58 |
| 2 | 49 | 28 | 57.14 | 16 | 32.65 | 5 | 10.20 |
| 3 | 52 | 16 | 30.77 | 24 | 46.15 | 12 | 23.08 |
| Total | 178 | 82 | 46.07 | 67 | 37.64 | 29 | 16.29 |
| Cluster | Con Rel Force | Knee Ext Velo | Max Knee Flex * | Knee Ext Accel | Height * | Max Plantar Flex * | PAKT | R2 | |
|---|---|---|---|---|---|---|---|---|---|
| 1 | 0.3 | 0.46 | 0.49 | 0.54 | 0.57 | 0.61 | 0.63 | 0.63 | |
| Cluster | Knee Ext Velo | Con Rel Force | Max Plantar Flex | Knee Ext Accel | Height * | PHKT | PTT Dorsi * | Delta Knee Flex | R2 |
| 2 | 0.39 | 0.56 | 0.67 | 0.71 | 0.79 | 0.81 | 0.83 | 0.88 | 0.88 |
| Cluster | Knee Ext Velo | Max Knee Ext * | Con Rel Force | Height * | Ankle ROM * | Hip ROM | Knee Ext Accel | PTT Dorsi * | R2 |
| 3 | 0.36 | 0.5 | 0.6 | 0.64 | 0.69 | 0.72 | 0.76 | 0.78 | 0.78 |
| Total | Knee Ext Velo | Con Rel Force | Max Knee Flex * | Max Plantar Flex * | Height * | Max Hip Flexion | R2 | ||
| 0.34 | 0.49 | 0.57 | 0.61 | 0.66 | 0.69 | 0.69 |
© 2020 by the authors. Licensee MDPI, Basel, Switzerland. This article is an open access article distributed under the terms and conditions of the Creative Commons Attribution (CC BY) license (http://creativecommons.org/licenses/by/4.0/).
Share and Cite
Rauch, J.; Leidersdorf, E.; Reeves, T.; Borkan, L.; Elliott, M.; Ugrinowitsch, C. Different Movement Strategies in the Countermovement Jump Amongst a Large Cohort of NBA Players. Int. J. Environ. Res. Public Health 2020, 17, 6394. https://doi.org/10.3390/ijerph17176394
Rauch J, Leidersdorf E, Reeves T, Borkan L, Elliott M, Ugrinowitsch C. Different Movement Strategies in the Countermovement Jump Amongst a Large Cohort of NBA Players. International Journal of Environmental Research and Public Health. 2020; 17(17):6394. https://doi.org/10.3390/ijerph17176394
Chicago/Turabian StyleRauch, Jacob, Eric Leidersdorf, Trent Reeves, Leah Borkan, Marcus Elliott, and Carlos Ugrinowitsch. 2020. "Different Movement Strategies in the Countermovement Jump Amongst a Large Cohort of NBA Players" International Journal of Environmental Research and Public Health 17, no. 17: 6394. https://doi.org/10.3390/ijerph17176394
APA StyleRauch, J., Leidersdorf, E., Reeves, T., Borkan, L., Elliott, M., & Ugrinowitsch, C. (2020). Different Movement Strategies in the Countermovement Jump Amongst a Large Cohort of NBA Players. International Journal of Environmental Research and Public Health, 17(17), 6394. https://doi.org/10.3390/ijerph17176394