The Association between Temporomandibular Disorder and Sleep Apnea—A Nationwide Population-Based Cohort Study

 ,
,  ,
, 

Abstract
:1. Introduction
2. Materials and Methods
2.1. Study Design
2.2. Data Sources
2.3. Ethical Consideration
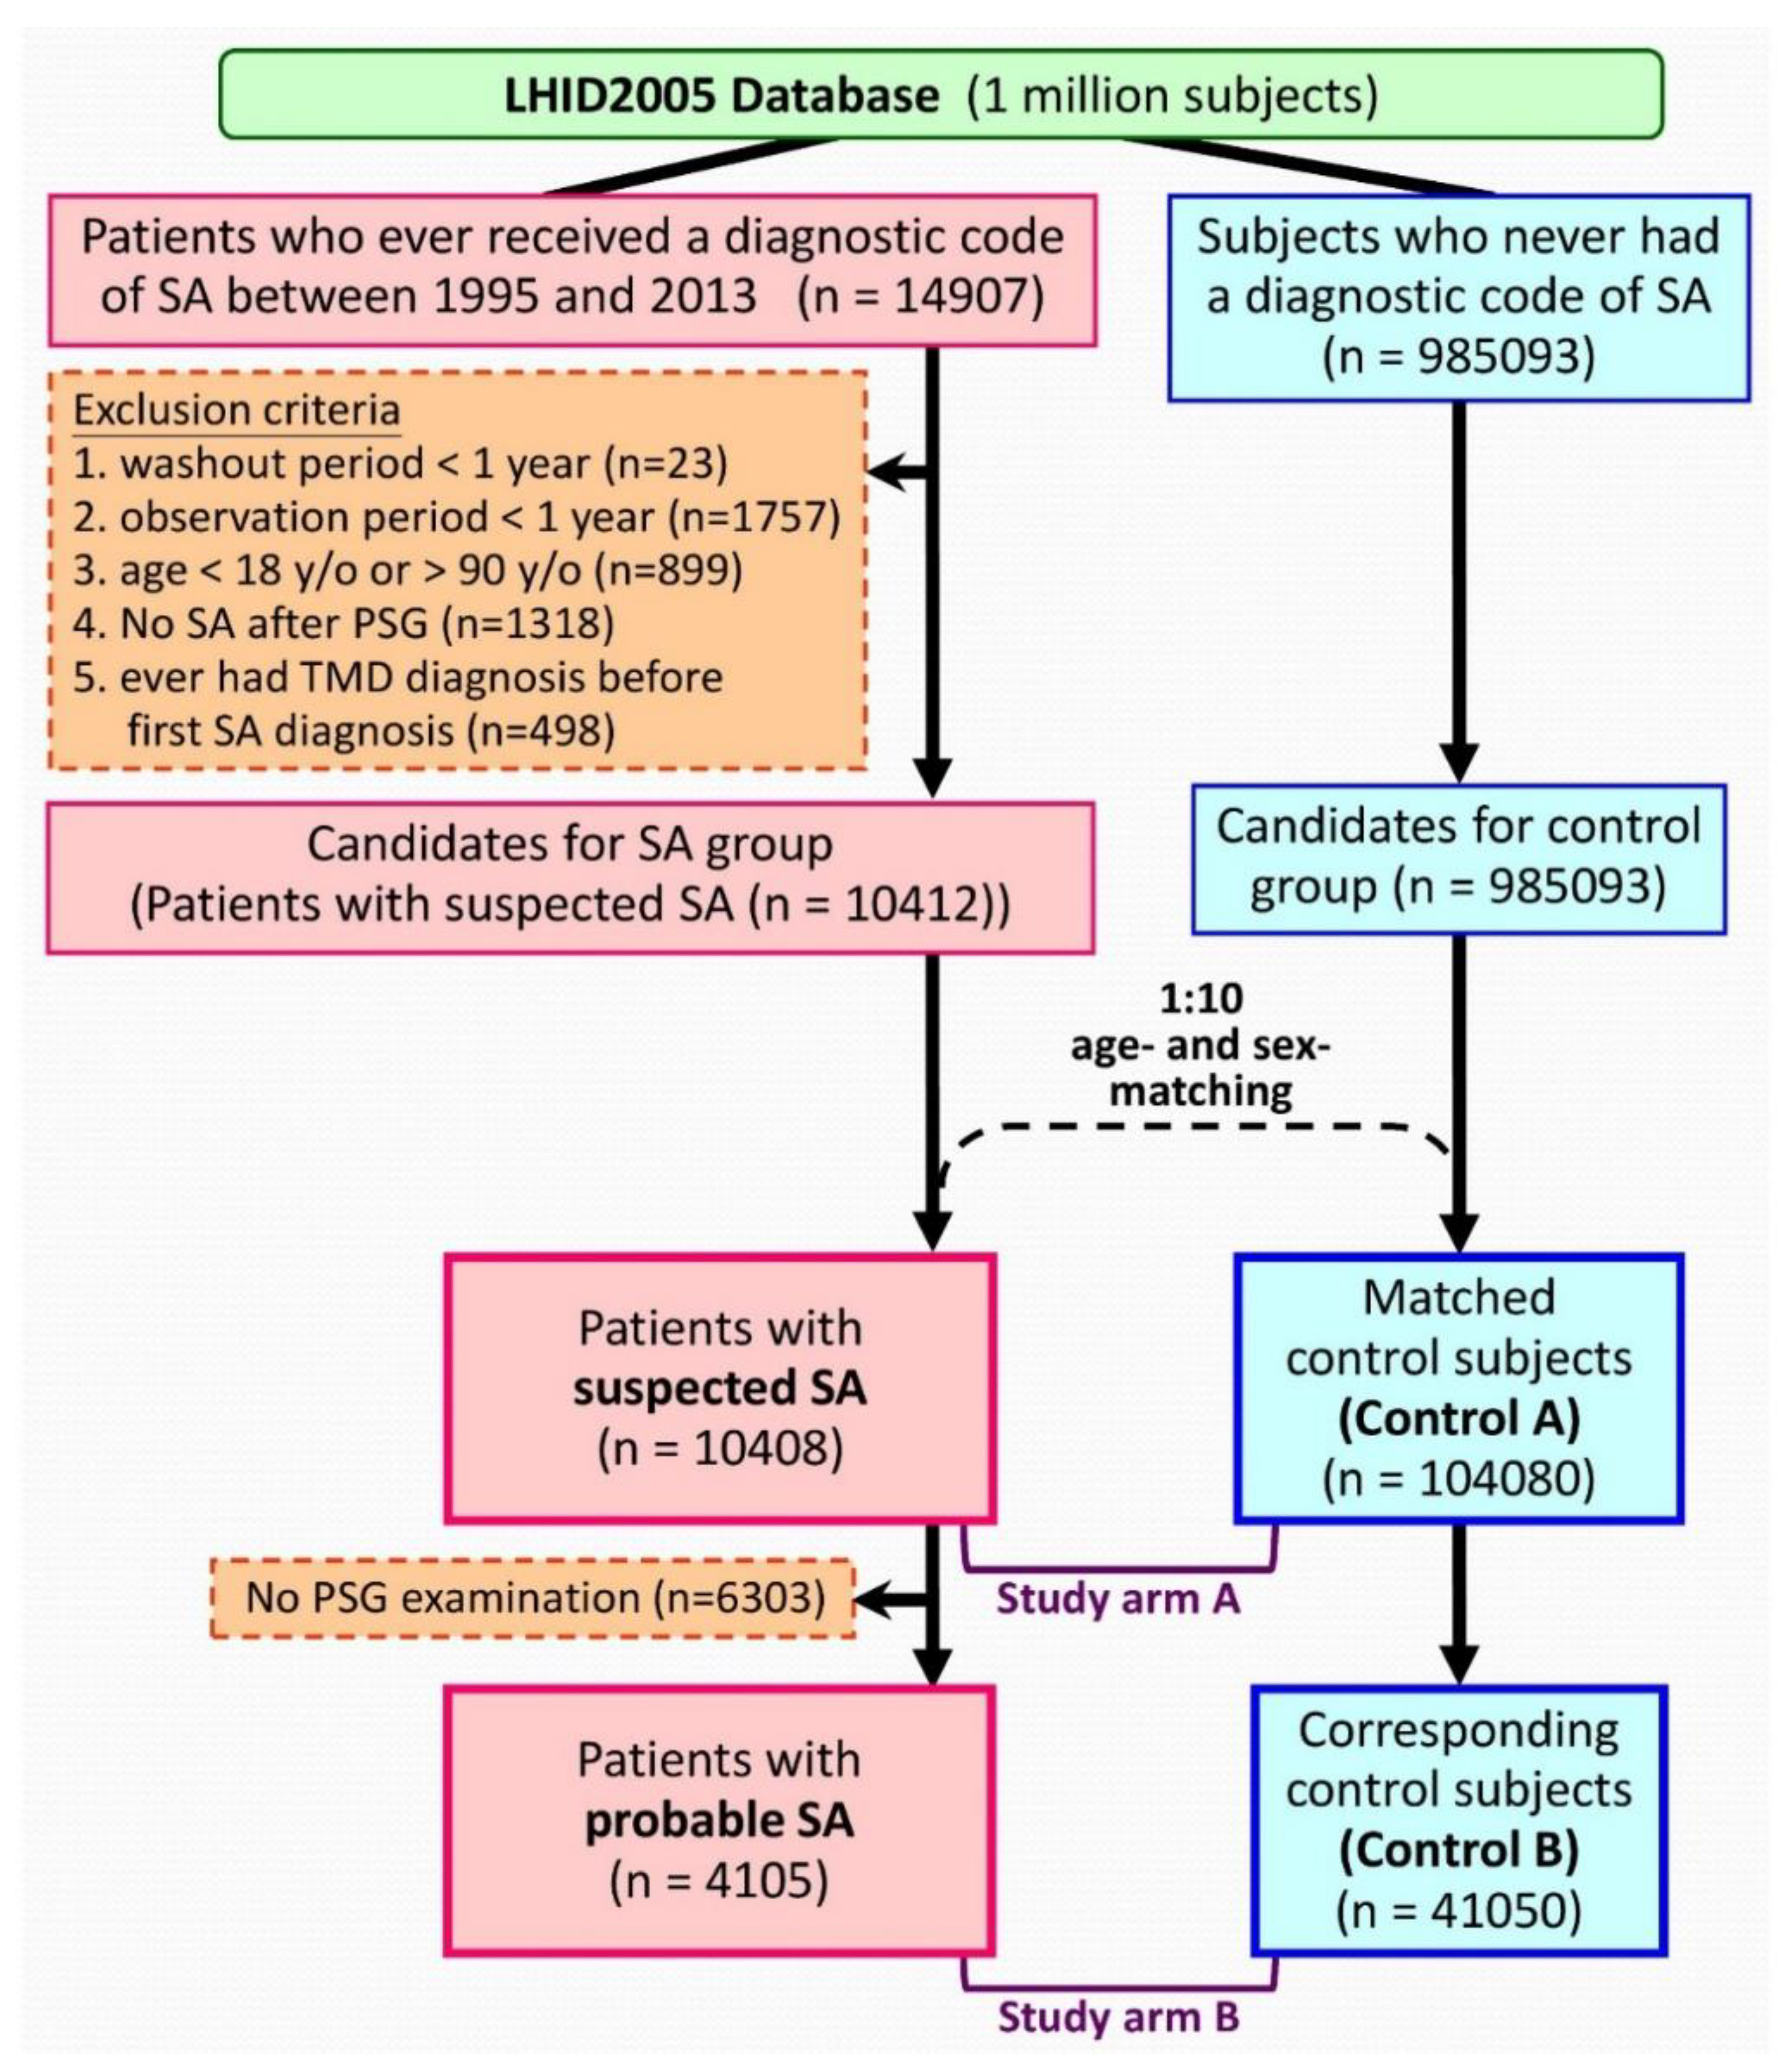
2.4. Sleep Apnea Cohorts
2.5. Control Cohorts
2.6. Definitions of Variables
2.7. Statistical Analysis
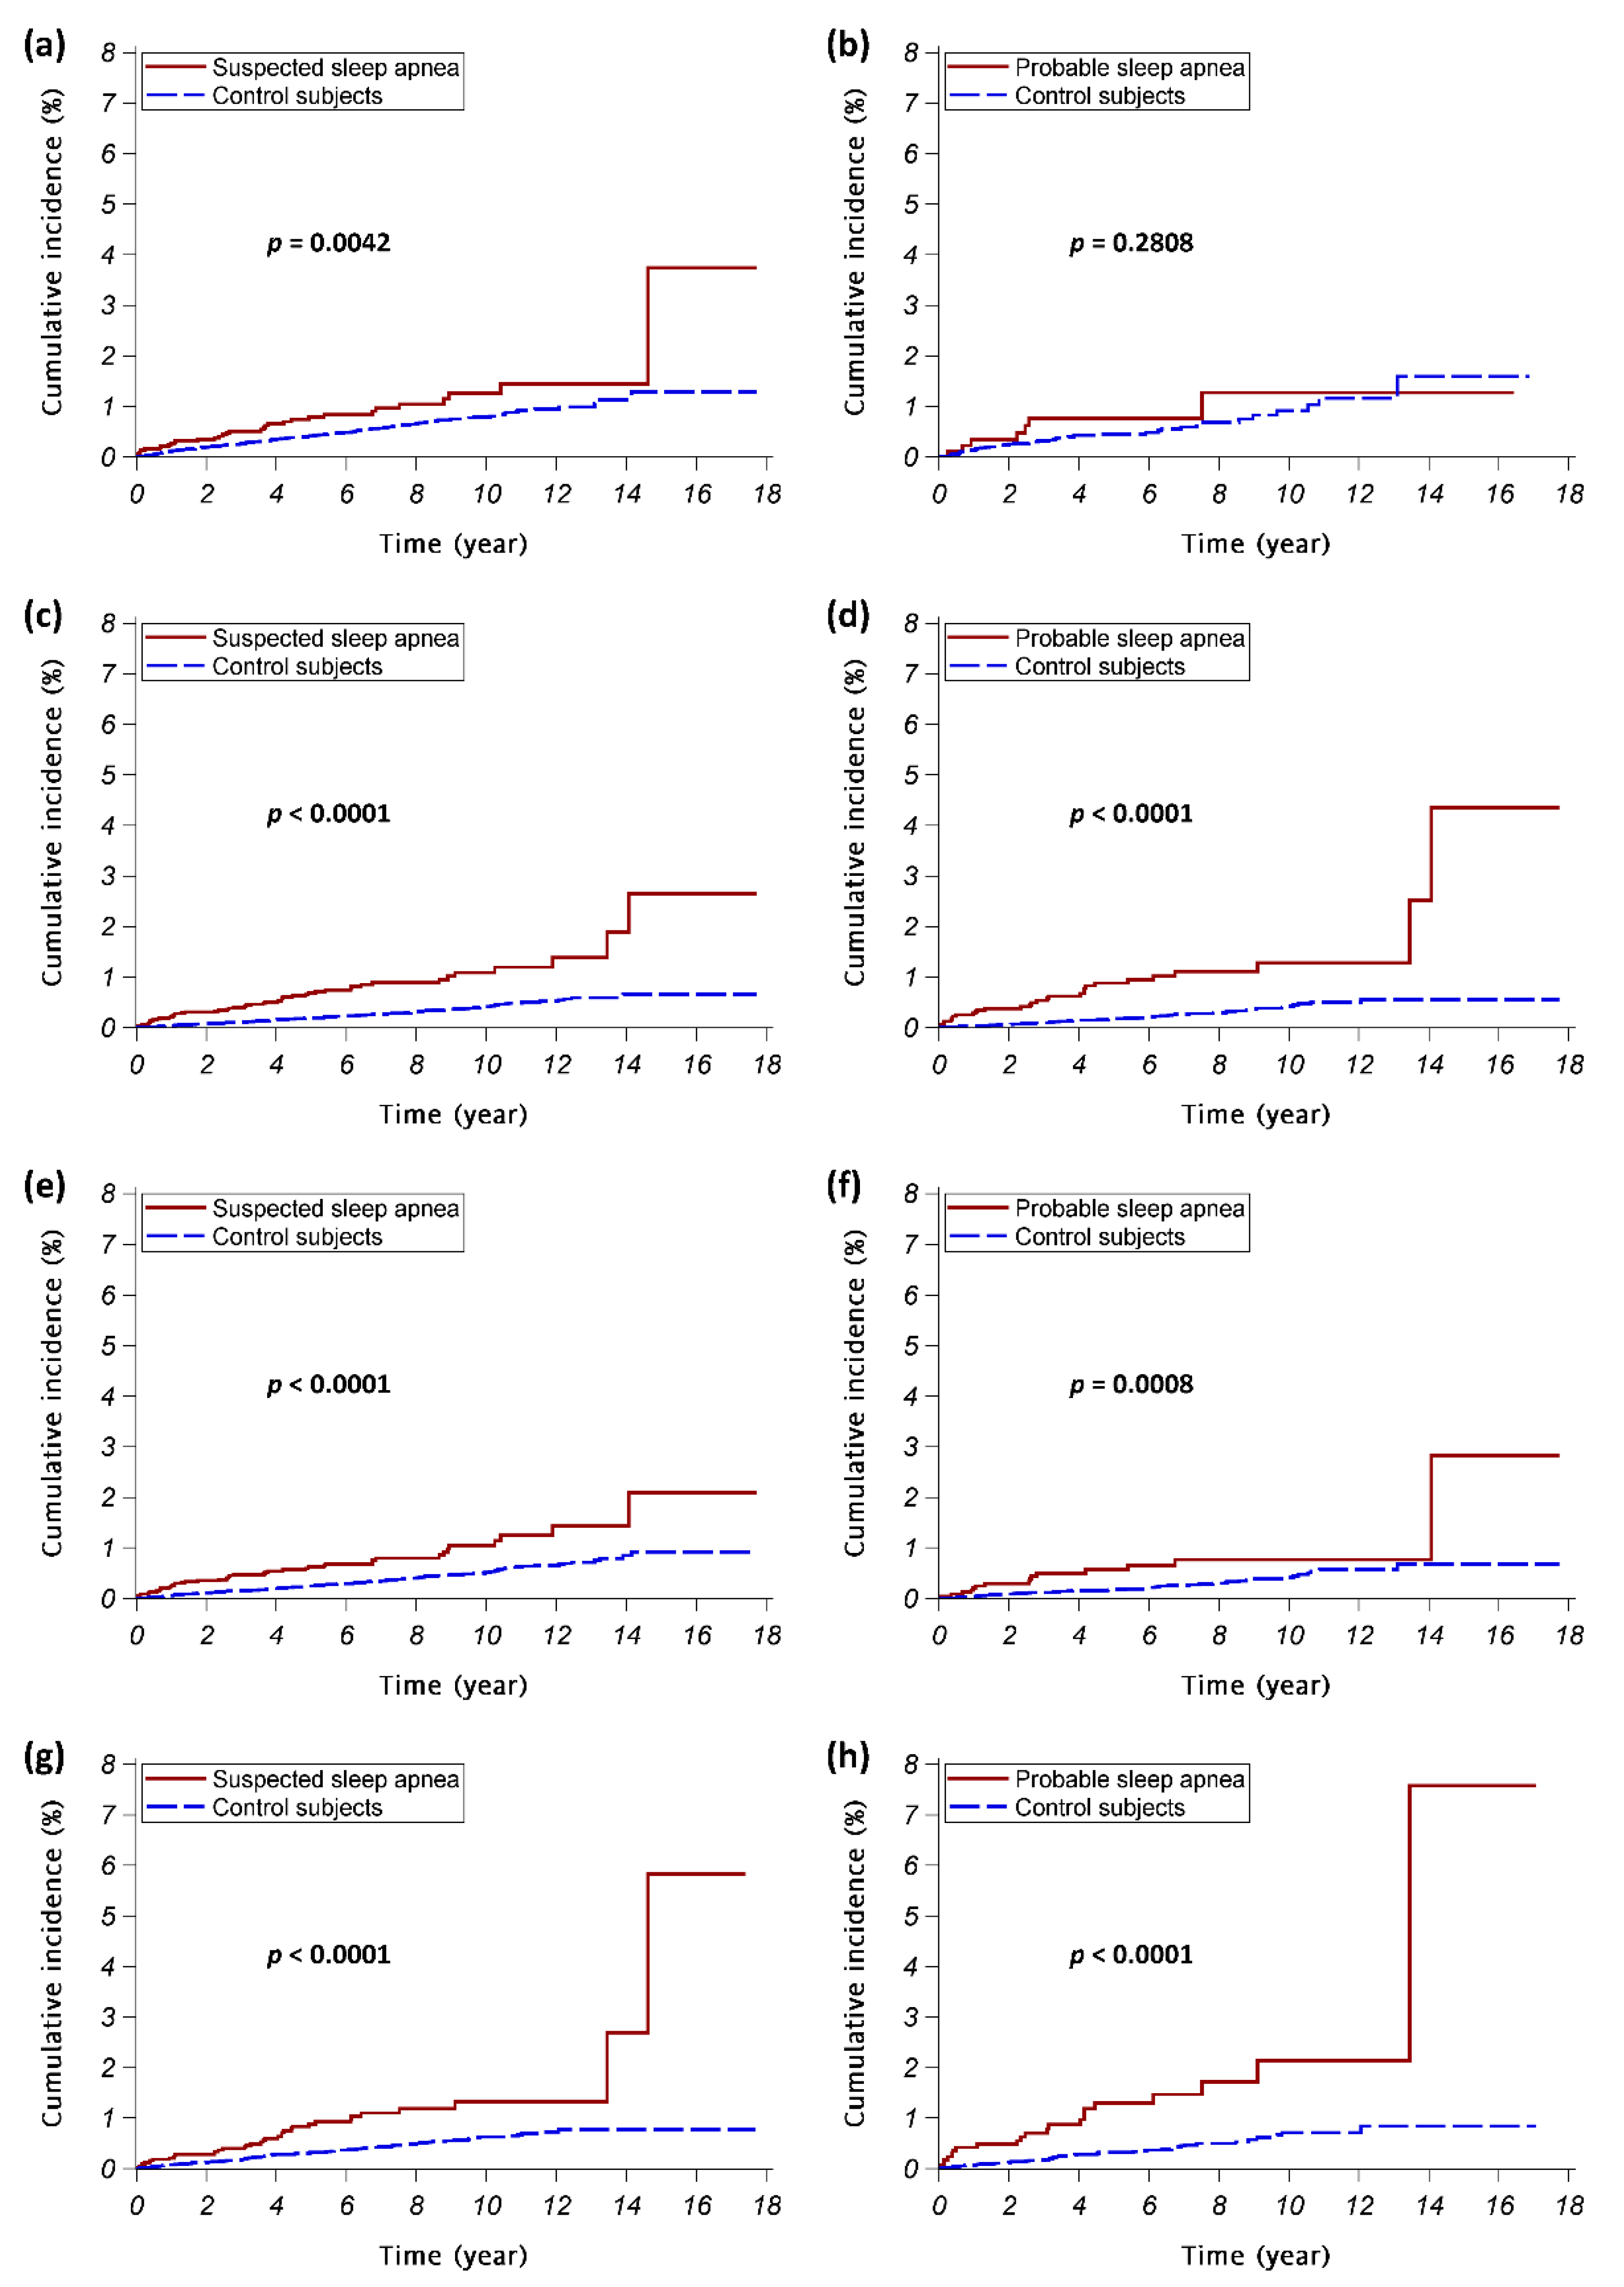
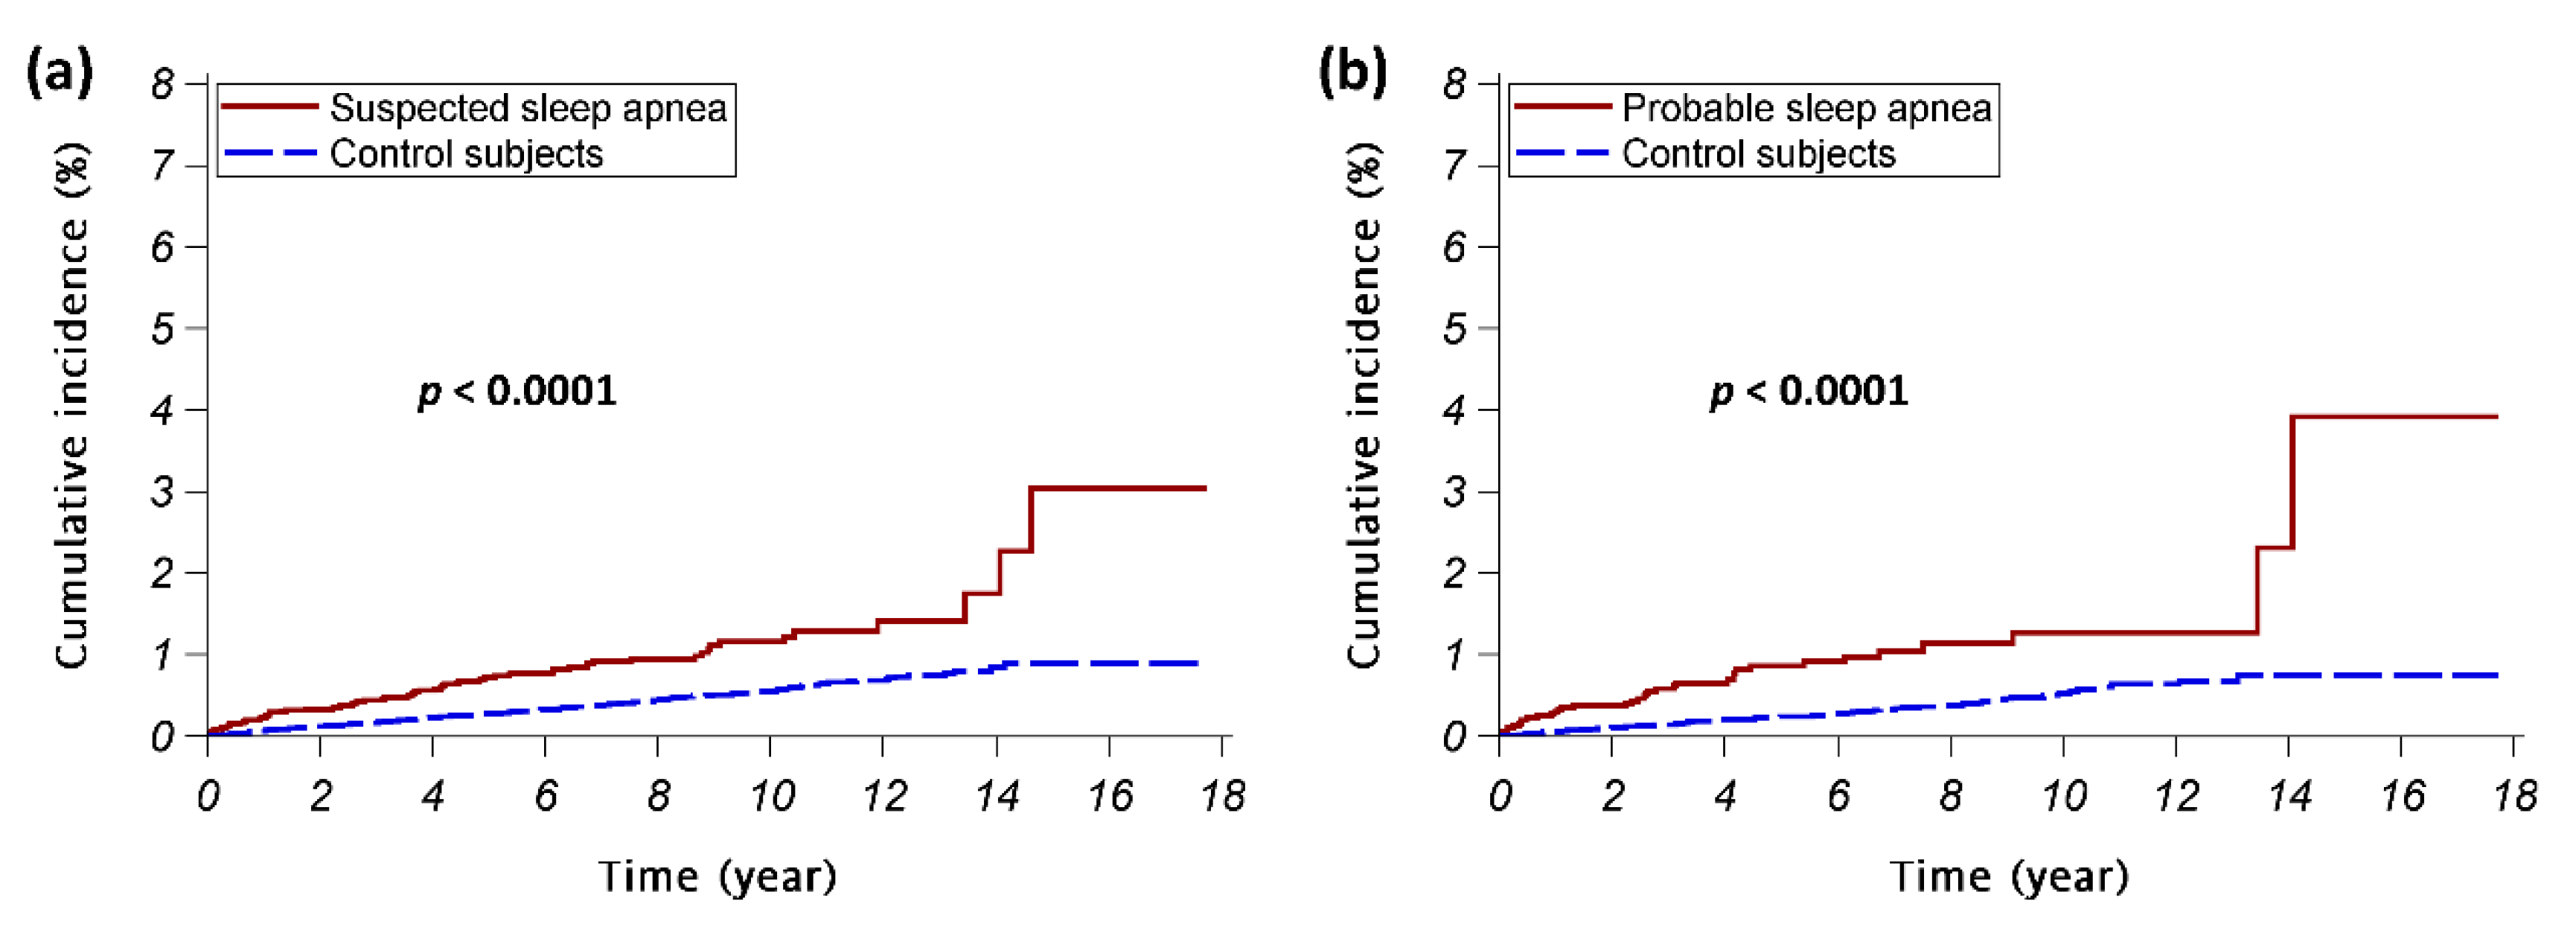
3. Results
4. Discussion
5. Conclusions
Author Contributions
Funding
Conflicts of Interest
Abbreviations
| CCI | Charlson Comorbidity Index |
| CI | confidence interval |
| CSA | central sleep apnea |
| HR | hazard ratio |
| IR | incident rate |
| IRR | incidence rate ratio |
| NHI | National Health Insurance |
| OSA | obstructive sleep apnea |
| PSG | polysomnography |
| SA | sleep apnea |
| TMD | temporomandibular disorders |
Appendix A

| Variables | Study Arm A (Suspected SA vs. Control A) | Study Arm B (Probable SA vs. Control B) | ||
|---|---|---|---|---|
| HR [95% CI] | p-Value | HR [95% CI] | p-Value | |
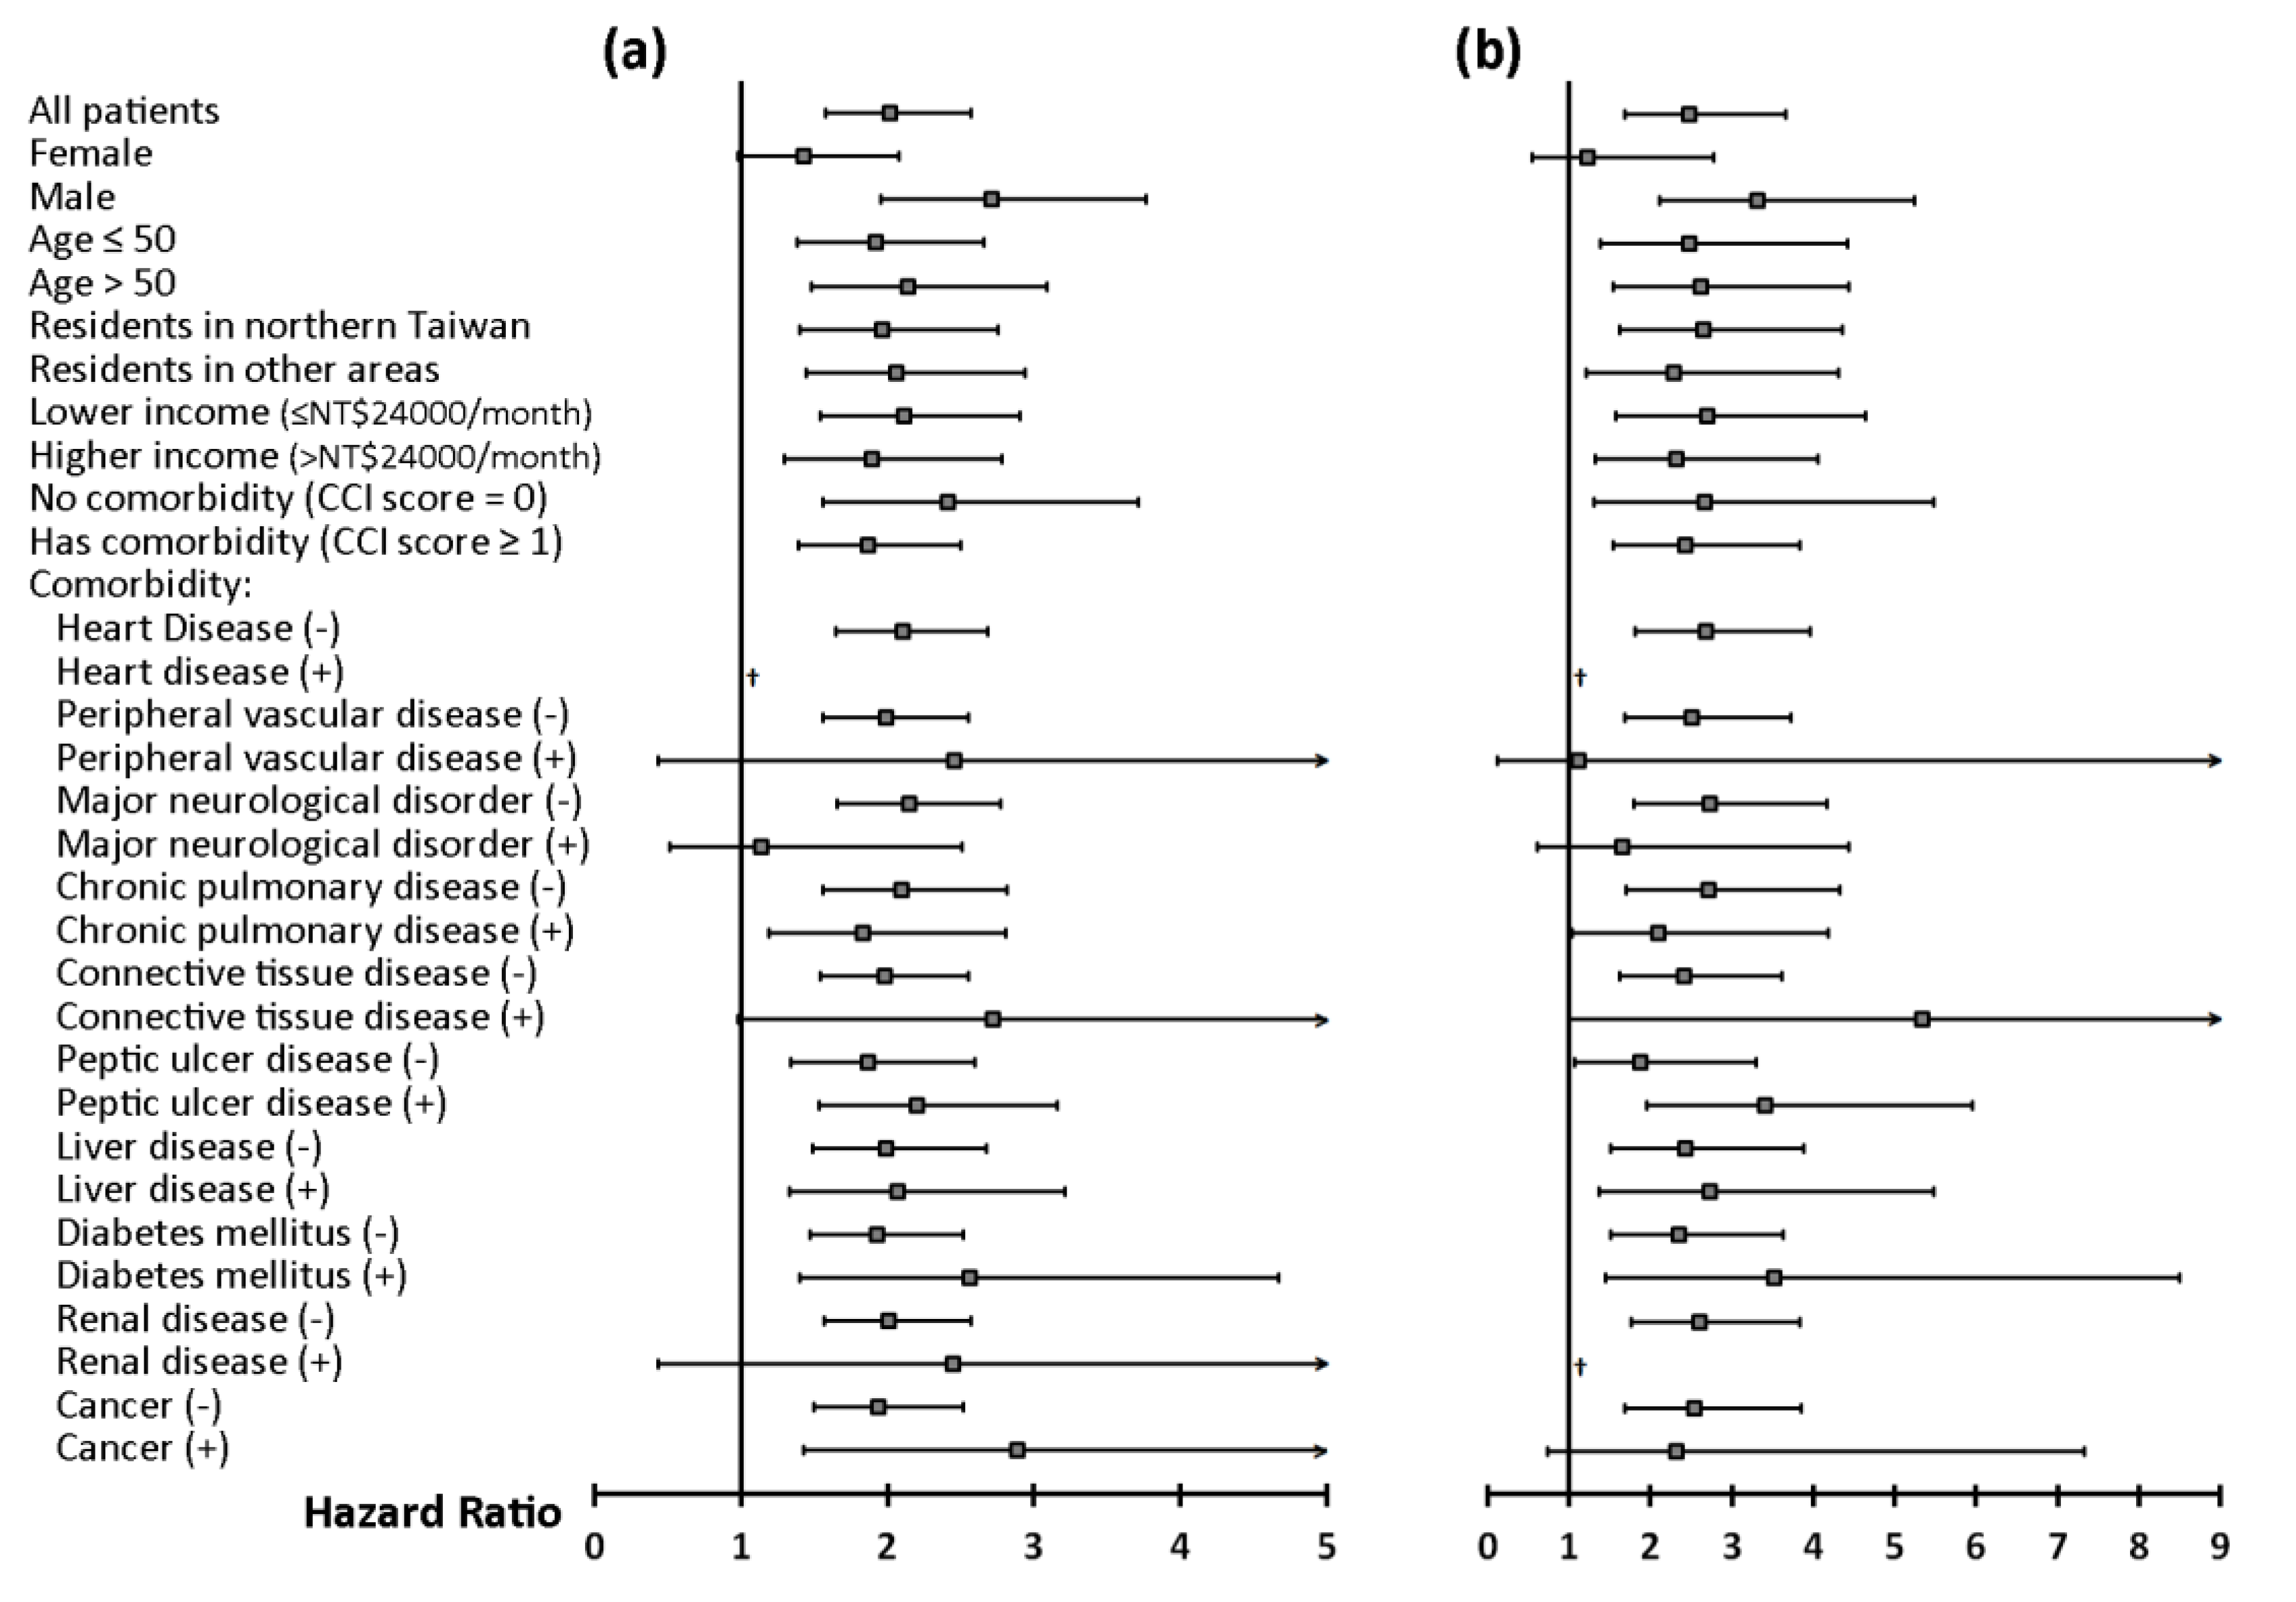
| SA patients vs. Control subjects | 2.0 [1.6–2.6] | <0.0001 | 2.5 [1.7–3.7] | <0.0001 |
| Male vs. female | 0.6 [0.5–0.7] | <0.0001 | 0.5 [0.4–0.7] | 0.0003 |
| Age > 50 vs. Age ≤ 50 | 0.9 [0.8–1.2] | 0.6055 | 1.3 [0.9–1.8] | 0.1564 |
| Residency (Northern Taiwan vs. Other areas) | 1.0 [0.9–1.3] | 0.6775 | 1.2 [0.9–1.7] | 0.2368 |
| Higher income (>NT$24,000) vs. lower income (≤NT$24,000) | 1.2 [1.0–1.4] | 0.1276 | 1.4 [1.0–1.9] | 0.0611 |
| Presence of underlying diseases: | ||||
| Heart disease | 0.6 [0.3–1.1] | 0.0840 | 0.8 [0.3–2.1] | 0.6785 |
| Peripheral vascular disease | 1.3 [0.6–2.6] | 0.5297 | 2.4 [1.0–5.5] | 0.0448 |
| Major neurological disorder | 1.1 [0.8–1.5] | 0.6464 | 1.4 [0.9–2.4] | 0.1701 |
| Chronic pulmonary disease | 1.2 [0.9–1.5] | 0.1304 | 1.1 [0.7–1.6] | 0.7958 |
| Connective tissue disease | 1.6 [1.0–2.6] | 0.0609 | 1.8 [0.8–3.8] | 0.1538 |
| Peptic ulcer disease | 1.7 [1.4–2.1] | <0.0001 | 1.7 [1.2–2.5] | 0.0032 |
| Liver disease | 1.4 [1.1–1.7] | 0.0084 | 1.2 [0.8–1.7] | 0.4586 |
| Diabetes mellitus | 1.1 [0.8–1.5] | 0.5360 | 1.2 [0.7–1.9] | 0.4809 |
| Renal disease | 0.3 [0.1–0.7] | 0.0060 | 0.4 [0.1–1.2] | 0.1035 |
| Cancer | 2.0 [1.4–2.8] | 0.0001 | 2.3 [1.3–3.9] | 0.0031 |
References
- Schiffman, E.; Ohrbach, R.; Truelove, E.; Look, J.; Anderson, G.; Goulet, J.P.; List, T.; Svensson, P.; Gonzalez, Y.; Lobbezoo, F.; et al. Diagnostic criteria for temporomandibular disorders (dc/tmd) for clinical and research applications: Recommendations of the international rdc/tmd consortium network* and orofacial pain special interest groupdagger. J. Oral Facial Pain Headache 2014, 28, 6–27. [Google Scholar] [CrossRef] [PubMed]
- Poveda Roda, R.; Bagan, J.V.; Diaz Fernandez, J.M.; Hernandez Bazan, S.; Jimenez Soriano, Y. Review of temporomandibular joint pathology. Part i: Classification, epidemiology and risk factors. Med. Oral Patol. Oral Cir. Bucal. 2007, 12, 292–298. [Google Scholar]
- Liao, C.H.; Chang, C.S.; Chang, S.N.; Lane, H.Y.; Lyu, S.Y.; Morisky, D.E.; Sung, F.C. The risk of temporomandibular disorder in patients with depression: A population-based cohort study. Community Dent. Oral Epidemiol. 2011, 39, 525–531. [Google Scholar] [CrossRef]
- Oral, K.; Bal Kucuk, B.; Ebeoglu, B.; Dincer, S. Etiology of temporomandibular disorder pain. Agri 2009, 21, 89–94. [Google Scholar]
- Lin, C.Y.; Chung, C.H.; Chu, H.Y.; Chen, L.C.; Tu, K.H.; Tsao, C.H.; Wu, Y.T.; Chien, W.C. Prevalence of temporomandibular disorders in rheumatoid arthritis and associated risk factors: A nationwide study in taiwan. J. Oral Facial Pain Headache 2017, 31, e29–e36. [Google Scholar] [CrossRef] [PubMed]
- Sanders, A.E.; Essick, G.K.; Fillingim, R.; Knott, C.; Ohrbach, R.; Greenspan, J.D.; Diatchenko, L.; Maixner, W.; Dubner, R.; Bair, E.; et al. Sleep apnea symptoms and risk of temporomandibular disorder: Oppera cohort. J. Dent. Res. 2013, 92, 70S–77S. [Google Scholar] [CrossRef]
- Slade, G.D.; Ohrbach, R.; Greenspan, J.D.; Fillingim, R.B.; Bair, E.; Sanders, A.E.; Dubner, R.; Diatchenko, L.; Meloto, C.B.; Smith, S.; et al. Painful temporomandibular disorder: Decade of discovery from oppera studies. J. Dent. Res. 2016, 95, 1084–1092. [Google Scholar] [CrossRef] [Green Version]
- Chen, C.M.; Tsai, M.J.; Wei, P.J.; Su, Y.C.; Yang, C.J.; Wu, M.N.; Hsu, C.Y.; Hwang, S.J.; Chong, I.W.; Huang, M.S. Erectile dysfunction in patients with sleep apnea—A nationwide population-based study. PLoS ONE 2015, 10, e0132510. [Google Scholar] [CrossRef] [Green Version]
- Myers, K.A.; Mrkobrada, M.; Simel, D.L. Does this patient have obstructive sleep apnea? The rational clinical examination systematic review. JAMA 2013, 310, 731–741. [Google Scholar] [CrossRef]
- Chou, K.T.; Huang, C.C.; Chen, Y.M.; Su, K.C.; Shiao, G.M.; Lee, Y.C.; Chan, W.L.; Leu, H.B. Sleep apnea and risk of deep vein thrombosis: A non-randomized, pair-matched cohort study. Am. J. Med. 2012, 125, 374–380. [Google Scholar] [CrossRef]
- Chou, P.S.; Chang, W.C.; Chou, W.P.; Liu, M.E.; Lai, C.L.; Liu, C.K.; Ku, Y.C.; Tsai, S.J.; Chou, Y.H.; Chang, W.P. Increased risk of benign prostate hyperplasia in sleep apnea patients: A nationwide population-based study. PLoS ONE 2014, 9, e93081. [Google Scholar] [CrossRef] [Green Version]
- Gronewold, J.; Haensel, R.; Kleinschnitz, C.; Frohnhofen, H.; Hermann, D.M. Sleep-disordered breathing in hospitalized geriatric patients with mild dementia and its association with cognition, emotion and mobility. Int. J. Environ. Res. Public Health 2019, 16, 863. [Google Scholar] [CrossRef] [Green Version]
- Arzt, M.; Young, T.; Finn, L.; Skatrud, J.B.; Bradley, T.D. Association of sleep-disordered breathing and the occurrence of stroke. Am. J. Respir. Crit. Care Med. 2005, 172, 1447–1451. [Google Scholar] [CrossRef] [Green Version]
- Reichmuth, K.J.; Austin, D.; Skatrud, J.B.; Young, T. Association of sleep apnea and type ii diabetes: A population-based study. Am. J. Respir. Crit. Care Med. 2005, 172, 1590–1595. [Google Scholar] [CrossRef] [Green Version]
- Smith, M.T.; Wickwire, E.M.; Grace, E.G.; Edwards, R.R.; Buenaver, L.F.; Peterson, S.; Klick, B.; Haythornthwaite, J.A. Sleep disorders and their association with laboratory pain sensitivity in temporomandibular joint disorder. Sleep 2009, 32, 779–790. [Google Scholar] [CrossRef] [Green Version]
- Wu, C.Y.; Chen, Y.J.; Ho, H.J.; Hsu, Y.C.; Kuo, K.N.; Wu, M.S.; Lin, J.T. Association between nucleoside analogues and risk of hepatitis b virus-related hepatocellular carcinoma recurrence following liver resection. JAMA 2012, 308, 1906–1914. [Google Scholar] [CrossRef] [Green Version]
- Wu, K.L.; Kuo, C.Y.; Tsai, Y.C.; Hung, J.Y.; Sheu, C.C.; Yang, C.J.; Hsu, C.Y.; Wu, M.N.; Tsai, M.J. CHADS2, CHA2DS2ASc, and new ABCD scores predict the risk of peripheral arterial disease in patients with sleep apnea. J. Clin. Med. 2019, 8, 188. [Google Scholar] [CrossRef] [Green Version]
- Lin, S.L.; Wu, S.L.; Ko, S.Y.; Yen, C.Y.; Chiang, W.F.; Yang, J.W. Temporal relationship between dysthymia and temporomandibular disorder: A population-based matched case-control study in taiwan. BMC Oral Health 2017, 17, 50. [Google Scholar] [CrossRef] [Green Version]
- Deyo, R.A.; Cherkin, D.C.; Ciol, M.A. Adapting a clinical comorbidity index for use with icd-9-cm administrative databases. J. Clin. Epidemiol. 1992, 45, 613–619. [Google Scholar] [CrossRef]
- Collesano, V.; Segu, M.; Masseroli, C.; Manni, R. Temporomandibular disorders and sleep disorders: Which relationship? Minerva Stomatol. 2004, 53, 661–668. [Google Scholar]
- Moldofsky, H. Sleep and pain. Sleep Med. Rev. 2001, 5, 385–396. [Google Scholar] [CrossRef] [Green Version]
- Cunali, P.A.; Almeida, F.R.; Santos, C.D.; Valdrighi, N.Y.; Nascimento, L.S.; Dal’Fabbro, C.; Tufik, S.; Bittencourt, L.R. Prevalence of temporomandibular disorders in obstructive sleep apnea patients referred for oral appliance therapy. J. Orofac. Pain 2009, 23, 339–344. [Google Scholar]
- Dubrovsky, B.; Raphael, K.G.; Lavigne, G.J.; Janal, M.N.; Sirois, D.A.; Wigren, P.E.; Nemelivsky, L.V.; Klausner, J.J.; Krieger, A.C. Polysomnographic investigation of sleep and respiratory parameters in women with temporomandibular pain disorders. J. Clin. Sleep Med. 2014, 10, 195–201. [Google Scholar] [CrossRef] [Green Version]
- Talley, R.L. Tmj and osa are sisters. Cranio 2019, 37, 273–274. [Google Scholar] [CrossRef] [Green Version]
- Bair, E.; Gaynor, S.; Slade, G.D.; Ohrbach, R.; Fillingim, R.B.; Greenspan, J.D.; Dubner, R.; Smith, S.B.; Diatchenko, L.; Maixner, W. Identification of clusters of individuals relevant to temporomandibular disorders and other chronic pain conditions: The OPPERA study. Pain 2016, 157, 1266–1278. [Google Scholar] [CrossRef]
- Dewan, N.A.; Nieto, F.J.; Somers, V.K. Intermittent hypoxemia and osa: Implications for comorbidities. Chest 2015, 147, 266–274. [Google Scholar] [CrossRef] [Green Version]
- Park, J.W.; Chung, J.W. Inflammatory cytokines and sleep disturbance in patients with temporomandibular disorders. J. Oral Facial Pain Headache 2016, 30, 27–33. [Google Scholar] [CrossRef]
- Doufas, A.G.; Tian, L.; Padrez, K.A.; Suwanprathes, P.; Cardell, J.A.; Maecker, H.T.; Panousis, P. Experimental pain and opioid analgesia in volunteers at high risk for obstructive sleep apnea. PLoS ONE 2013, 8, e54807. [Google Scholar] [CrossRef]
- Randerath, W.J.; Verbraecken, J.; Andreas, S.; Bettega, G.; Boudewyns, A.; Hamans, E.; Jalbert, F.; Paoli, J.R.; Sanner, B.; Smith, I.; et al. Non-cpap therapies in obstructive sleep apnoea. Eur. Respir. J. 2011, 37, 1000–1028. [Google Scholar] [CrossRef] [Green Version]
- Marklund, M. Subjective versus objective dental side effects from oral sleep apnea appliances. Sleep Breath. 2020, 24, 111–117. [Google Scholar] [CrossRef] [Green Version]
- Merrill, R.L. Temporomandibular disorder pain and dental treatment of obstructive sleep apnea. Dent. Clin. North. Am. 2012, 56, 415–431. [Google Scholar] [CrossRef]
- Perez, C.V.; de Leeuw, R.; Okeson, J.P.; Carlson, C.R.; Li, H.F.; Bush, H.M.; Falace, D.A. The incidence and prevalence of temporomandibular disorders and posterior open bite in patients receiving mandibular advancement device therapy for obstructive sleep apnea. Sleep Breath. 2013, 17, 323–332. [Google Scholar] [CrossRef]
- Doff, M.H.; Veldhuis, S.K.; Hoekema, A.; Slater, J.J.; Wijkstra, P.J.; de Bont, L.G.; Stegenga, B. Long-term oral appliance therapy in obstructive sleep apnea syndrome: A controlled study on temporomandibular side effects. Clin. Oral Investig. 2012, 16, 689–697. [Google Scholar] [CrossRef]
- Martynowicz, H.; Gac, P.; Brzecka, A.; Poreba, R.; Wojakowska, A.; Mazur, G.; Smardz, J.; Wieckiewicz, M. The relationship between sleep bruxism and obstructive sleep apnea based on polysomnographic findings. J. Clin. Med. 2019, 8, 1653. [Google Scholar] [CrossRef] [Green Version]
- Contreras, E.F.R.; Fernandes, G.; Ongaro, P.C.J.; Campi, L.B.; Goncalves, D.A.G. Systemic diseases and other painful conditions in patients with temporomandibular disorders and migraine. Braz. Oral Res. 2018, 32, e77. [Google Scholar] [CrossRef] [Green Version]
- Ferreira, C.L.; Silva, M.A.; Felicio, C.M. Signs and symptoms of temporomandibular disorders in women and men. Codas 2016, 28, 17–21. [Google Scholar] [CrossRef]
- Bischoff-Ferrari, H.A.; Dietrich, T.; Orav, E.J.; Hu, F.B.; Zhang, Y.; Karlson, E.W.; Dawson-Hughes, B. Higher 25-hydroxyvitamin d concentrations are associated with better lower-extremity function in both active and inactive persons aged > or = 60 y. Am. J. Clin. Nutr. 2004, 80, 752–758. [Google Scholar] [CrossRef]
- Demir, C.Y.; Ersoz, M.E. Biochemical changes associated with temporomandibular disorders. J. Int. Med. Res. 2019, 47, 765–771. [Google Scholar] [CrossRef] [Green Version]
- Chen, C.H.; Liu, L.K.; Chen, M.J.; Lee, W.J.; Lin, M.H.; Peng, L.N.; Chen, L.K. Associations between vitamin d deficiency, musculoskeletal health, and cardiometabolic risk among community-living people in taiwan: Age and sex-specific relationship. Medicine 2018, 97, e13886. [Google Scholar] [CrossRef]
| Variables | Study Arm A | Study Arm B | ||||
|---|---|---|---|---|---|---|
| Suspected SA | Control A | p-Value | Probable SA | Control B | p-Value | |
| N | 10,408 | 104,080 | 4105 | 41,050 | ||
| Sex, n (%) | ||||||
| Female | 3823 (37%) | 38,230 (37%) | 894 (22%) | 8940 (22%) | ||
| Male | 6585 (63%) | 65,850 (63%) | 3211 (78%) | 32,110 (78%) | ||
| Age (year), mean ± SD | 47.8 ± 14.9 | 47.8 ± 14.9 | 47.6 ± 13.3 | 47.6 ± 13.3 | ||
| Age (year), n (%) | ||||||
| ≤40 | 3531 (34%) | 35,310 (34%) | 1298 (32%) | 12,980 (32%) | ||
| 40 < age ≤ 50 | 2574 (25%) | 25,740 (25%) | 1139 (28%) | 11,390 (28%) | ||
| >50 | 4303 (41%) | 43,030 (41%) | 1668 (41%) | 16,680 (41%) | ||
| Residency | <0.0001 | <0.0001 | ||||
| Northern Taiwan | 5605 (54%) | 52,331 (50%) | 2330 (57%) | 20,771 (51%) | ||
| Other areas | 4803 (46%) | 51,749 (50%) | 1775 (43%) | 20,279 (49%) | ||
| Monthly income (NT$), median (IQR) | 21,900 (1249–42,000) | 21,900 (1249–36,300) | <0.0001 | 26,400 (1249–43,900) | 21,900 (1249–42,000) | <0.0001 |
| Monthly income (NT$), n (%) | <0.0001 | <0.0001 | ||||
| ≤24000 | 6031 (58%) | 65,840 (63%) | 2022 (49%) | 24,501 (60%) | ||
| >24000 | 4377 (42%) | 38,240 (37%) | 2083 (51%) | 16,549 (40%) | ||
| CCI score, mean ± SD | 1.7 ± 2.1 | 1.1 ± 1.7 | <0.0001 | 1.8 ± 2 | 1 ± 1.6 | <0.0001 |
| CCI score, n (%) | <0.0001 | <0.0001 | ||||
| =0 | 3419 (33%) | 54,800 (53%) | 1287 (31%) | 21,585 (53%) | ||
| =1 | 2642 (25%) | 23,116 (22%) | 1039 (25%) | 9407 (23%) | ||
| ≥2 | 4347 (42%) | 26,164 (25%) | 1779 (43%) | 10,058 (25%) | ||
| Underlying diseases, n (%) | ||||||
| Heart disease | 599 (6%) | 3030 (3%) | <0.0001 | 238 (6%) | 992 (2%) | <0.0001 |
| Myocardial infarction | 157 (2%) | 819 (1%) | <0.0001 | 69 (2%) | 314 (1%) | <0.0001 |
| Congestive heart failure | 486 (5%) | 2467 (2%) | <0.0001 | 190 (5%) | 768 (2%) | <0.0001 |
| Peripheral vascular disease | 204 (2%) | 1386 (1%) | <0.0001 | 71 (2%) | 523 (1%) | 0.0146 |
| Major neurological disorder | 1306 (13%) | 7425 (7%) | <0.0001 | 547 (13%) | 2530 (6%) | <0.0001 |
| Cerebral Vascular disease | 1230 (12%) | 6954 (7%) | <0.0001 | 522 (13%) | 2395 (6%) | <0.0001 |
| Dementia | 136 (1%) | 870 (1%) | <0.0001 | 49 (1%) | 217 (1%) | <0.0001 |
| Hemiplegia | 111 (1%) | 891 (1%) | 0.028 | 40 (1%) | 312 (1%) | 0.1365 |
| Chronic pulmonary disease | 3427 (33%) | 20,451 (20%) | <0.0001 | 1407 (34%) | 7764 (19%) | <0.0001 |
| Connective tissue disease | 360 (3%) | 1954 (2%) | <0.0001 | 131 (3%) | 665 (2%) | <0.0001 |
| Peptic ulcer disease | 3633 (35%) | 23,157 (22%) | <0.0001 | 1431 (35%) | 8976 (22%) | <0.0001 |
| Liver disease | 2715 (26%) | 16,206 (16%) | <0.0001 | 1188 (29%) | 6786 (17%) | <0.0001 |
| Diabetes mellitus | 1544 (15%) | 10,849 (10%) | <0.0001 | 649 (16%) | 4212 (10%) | <0.0001 |
| Renal disease | 593 (6%) | 3339 (3%) | <0.0001 | 238 (6%) | 1266 (3%) | <0.0001 |
| Cancer | 668 (6%) | 4119 (4%) | <0.0001 | 236 (6%) | 1534 (4%) | <0.0001 |
| Variables | Study Arm A | Study Arm B | ||||||||||||||||||
|---|---|---|---|---|---|---|---|---|---|---|---|---|---|---|---|---|---|---|---|---|
| Suspected SA | Control A | Crude IRR [95% CI] | Adjusted IRR [95% CI] | Probable SA | Control B | Crude IRR [95% CI] | Adjusted IRR [95% CI] | |||||||||||||
| N | TMD | PY | IR | N | TMD | PY | IR | N | TMD | PY | IR | N | TMD | PY | IR | |||||
| Whole study population | 10,408 | 184 | 62,825.7 | 2.9 | 104,080 | 715 | 634,918.6 | 1.1 | 2.3 [2.2–2.5] *** | 2.0 [1.9–2.1] *** | 4105 | 66 | 23,204.8 | 2.8 | 41,050 | 239 | 232,345.4 | 1.0 | 3.1 [2.9–3.4] *** | 2.5 [2.3–2.7] *** |
| Stratified analyses | ||||||||||||||||||||
| Sex | ||||||||||||||||||||
| Female | 3823 | 88 | 23,241.7 | 3.8 | 38,230 | 363 | 236,432.3 | 1.5 | 1.7 [1.5–1.9] *** | 1.4 [1.3–1.6] *** | 894 | 16 | 4716.4 | 3.4 | 8940 | 76 | 47,813.4 | 1.6 | 1.5 [1.3–1.9] *** | 1.2 [1.0–1.5] * |
| Male | 6585 | 96 | 39,584.0 | 2.4 | 65,850 | 352 | 398,486.3 | 0.9 | 3.1 [2.9–3.3] *** | 2.7 [2.6–2.9] *** | 3211 | 50 | 18,488.5 | 2.7 | 32,110 | 163 | 184,532.0 | 0.9 | 4.1 [3.8–4.5] *** | 3.4 [3.1–3.7] *** |
| Age | ||||||||||||||||||||
| ≤50 | 6105 | 100 | 38,558.2 | 2.6 | 61,050 | 415 | 389,170.4 | 1.1 | 2.3 [2.1–2.4] *** | 1.9 [1.8–2.1] *** | 2437 | 37 | 14,314.6 | 2.6 | 24,370 | 130 | 143,405.1 | 0.9 | 2.5 [2.3–2.8] *** | 2.5 [2.2–2.8] *** |
| >50 | 4303 | 84 | 24,267.6 | 3.5 | 43,030 | 300 | 245,748.2 | 1.2 | 2.4 [2.3–2.7] *** | 2.1 [2.0–2.3] *** | 1668 | 29 | 8890.3 | 3.3 | 16,680 | 109 | 88,940.4 | 1.2 | 3.7 [3.3–4.1] *** | 2.6 [2.3–3.0] *** |
| Residents in | ||||||||||||||||||||
| Northern Taiwan | 5605 | 103 | 33,394.5 | 3.1 | 52,331 | 377 | 317,999.4 | 1.2 | 2.3 [2.1–2.5] *** | 2.0 [1.8–2.1] *** | 2330 | 40 | 13,652.2 | 2.9 | 20,771 | 135 | 116,551.1 | 1.2 | 3.1 [2.8–3.5] *** | 2.7 [2.4–3.0] *** |
| Other areas | 4803 | 81 | 29,431.2 | 2.8 | 51,749 | 338 | 316,919.2 | 1.1 | 2.4 [2.2–2.6] *** | 2.1 [1.9–2.2] *** | 1775 | 26 | 9552.7 | 2.7 | 20,279 | 104 | 115,794.3 | 0.9 | 3.0 [2.6–3.4] *** | 2.3 [2.0–2.6] *** |
| Monthly income | ||||||||||||||||||||
| ≤NT$24,000 | 6031 | 101 | 36,318.0 | 2.8 | 65,840 | 424 | 398,259.6 | 1.1 | 2.5 [2.3–2.6] *** | 2.1 [2.0–2.3] *** | 2022 | 32 | 111,75.7 | 2.9 | 24,501 | 127 | 135,874.1 | 0.9 | 3.8 [3.4–4.2] *** | 2.7 [2.4–3.0] *** |
| NT$24,000 | 4377 | 83 | 26,507.8 | 3.1 | 38,240 | 291 | 236,659.0 | 1.2 | 2.2 [2.0–2.4] *** | 1.9 [1.8–2.1] *** | 2083 | 34 | 12,029.2 | 2.8 | 16,549 | 112 | 96,471.3 | 1.2 | 2.5 [2.2–2.8] *** | 2.3 [2.1–2.6] *** |
| Comorbidity | ||||||||||||||||||||
| No (CCI score = 0) | 3419 | 53 | 23,465.9 | 2.3 | 54,800 | 307 | 364,963.6 | 0.8 | 2.5 [2.3–2.7] *** | 2.4 [2.2–2.7] *** | 1287 | 20 | 8271.1 | 2.4 | 21,585 | 103 | 132,653.4 | 0.8 | 3.1 [2.7–3.5] *** | 2.7 [2.4–3.1] *** |
| Yes (CCI score ≥1) | 6989 | 131 | 39,359.8 | 3.3 | 49,280 | 408 | 269,955.0 | 1.5 | 2.0 [1.8–2.1] *** | 1.9 [1.7–2.0] *** | 2818 | 46 | 14,933.7 | 3.1 | 19,465 | 136 | 99,692.1 | 1.4 | 2.6 [2.4–2.9] *** | 2.4 [2.2–2.7] *** |
| Variables | Suspected SA Patients | Probable SA Patients | ||||||
|---|---|---|---|---|---|---|---|---|
| Maximal Model | Reduced Model * | Maximal Model | Reduced Model * | |||||
| HR [95% CI] | p-Value | HR [95% CI] | p-Value | HR [95% CI] | p-Value | HR [95% CI] | p-Value | |
| Sex (male vs. female) | 1.0 [0.6–1.5] | 0.9027 | 1.4 [0.6–3.3] | 0.4233 | ||||
| Age > 50 (vs. Age ≤ 50) | 1.0 [0.6–1.7] | 0.8622 | 1.8 [0.8–3.8] | 0.1289 | ||||
| Residency in northern Taiwan (vs. in other areas) | 1.0 [0.7–1.6] | 0.9741 | 1.3 [0.6–2.6] | 0.4782 | ||||
| Higher income (>NT$24,000) (vs. lower income) | 1.0 [0.6–1.5] | 0.9131 | 0.9 [0.5–1.8] | 0.8036 | ||||
| Presence of underlying diseases (vs. absence of the diseases): | ||||||||
| Heart disease | † | † | ||||||
| Peripheral vascular disease | 2.1 [0.7–6.9] | 0.2112 | 2.6 [0.6–11.5] | 0.1924 | ||||
| Major neurological disorder | 0.6 [0.3–1.4] | 0.2387 | 0.8 [0.3–2.2] | 0.7341 | ||||
| Chronic pulmonary disease | 1.0 [0.6–1.7] | 0.8444 | 0.7 [0.3–1.5] | 0.3687 | ||||
| Connective tissue disease | 2.1 [0.9–4.9] | 0.0948 | 2.3 [0.7–8.0] | 0.1742 | ||||
| Peptic ulcer disease | 2.0 [1.2–3.1] | 0.0056 | 2.0 [1.3–3.2] | 0.0017 | 2.7 [1.3–5.6] | 0.0081 | 3.1 [1.6–6.1] | 0.0010 |
| Liver disease | 1.4 [0.8–2.2] | 0.2191 | 1.2 [0.6–2.4] | 0.6526 | ||||
| Diabetes mellitus | 1.4 [0.8–2.6] | 0.2388 | 1.7 [0.7–3.8] | 0.2247 | ||||
| Renal disease | 0.3 [0.1–1.4] | 0.1267 | † | |||||
| Cancer | 2.5 [1.3–4.7] | 0.0056 | 2.4 [1.3–4.4] | 0.0065 | 2.0 [0.7–5.5] | 0.1790 | ||
© 2020 by the authors. Licensee MDPI, Basel, Switzerland. This article is an open access article distributed under the terms and conditions of the Creative Commons Attribution (CC BY) license (http://creativecommons.org/licenses/by/4.0/).
Share and Cite
Wu, J.-H.; Lee, K.-T.; Kuo, C.-Y.; Cheng, C.-H.; Chiu, J.-Y.; Hung, J.-Y.; Hsu, C.-Y.; Tsai, M.-J. The Association between Temporomandibular Disorder and Sleep Apnea—A Nationwide Population-Based Cohort Study. Int. J. Environ. Res. Public Health 2020, 17, 6311. https://doi.org/10.3390/ijerph17176311
Wu J-H, Lee K-T, Kuo C-Y, Cheng C-H, Chiu J-Y, Hung J-Y, Hsu C-Y, Tsai M-J. The Association between Temporomandibular Disorder and Sleep Apnea—A Nationwide Population-Based Cohort Study. International Journal of Environmental Research and Public Health. 2020; 17(17):6311. https://doi.org/10.3390/ijerph17176311
Chicago/Turabian StyleWu, Ju-Hui, Kun-Tsung Lee, Chia-Yu Kuo, Chih-Hung Cheng, Jih-Yu Chiu, Jen-Yu Hung, Chung-Yao Hsu, and Ming-Ju Tsai. 2020. "The Association between Temporomandibular Disorder and Sleep Apnea—A Nationwide Population-Based Cohort Study" International Journal of Environmental Research and Public Health 17, no. 17: 6311. https://doi.org/10.3390/ijerph17176311
APA StyleWu, J.-H., Lee, K.-T., Kuo, C.-Y., Cheng, C.-H., Chiu, J.-Y., Hung, J.-Y., Hsu, C.-Y., & Tsai, M.-J. (2020). The Association between Temporomandibular Disorder and Sleep Apnea—A Nationwide Population-Based Cohort Study. International Journal of Environmental Research and Public Health, 17(17), 6311. https://doi.org/10.3390/ijerph17176311