Comparing the Trail Users with Trail Non-Users on Physical Activity, Sleep, Mood and Well-Being Index


Abstract
:1. Introduction
2. Methods
2.1. Trail User and Non-User Probability Sampling Process
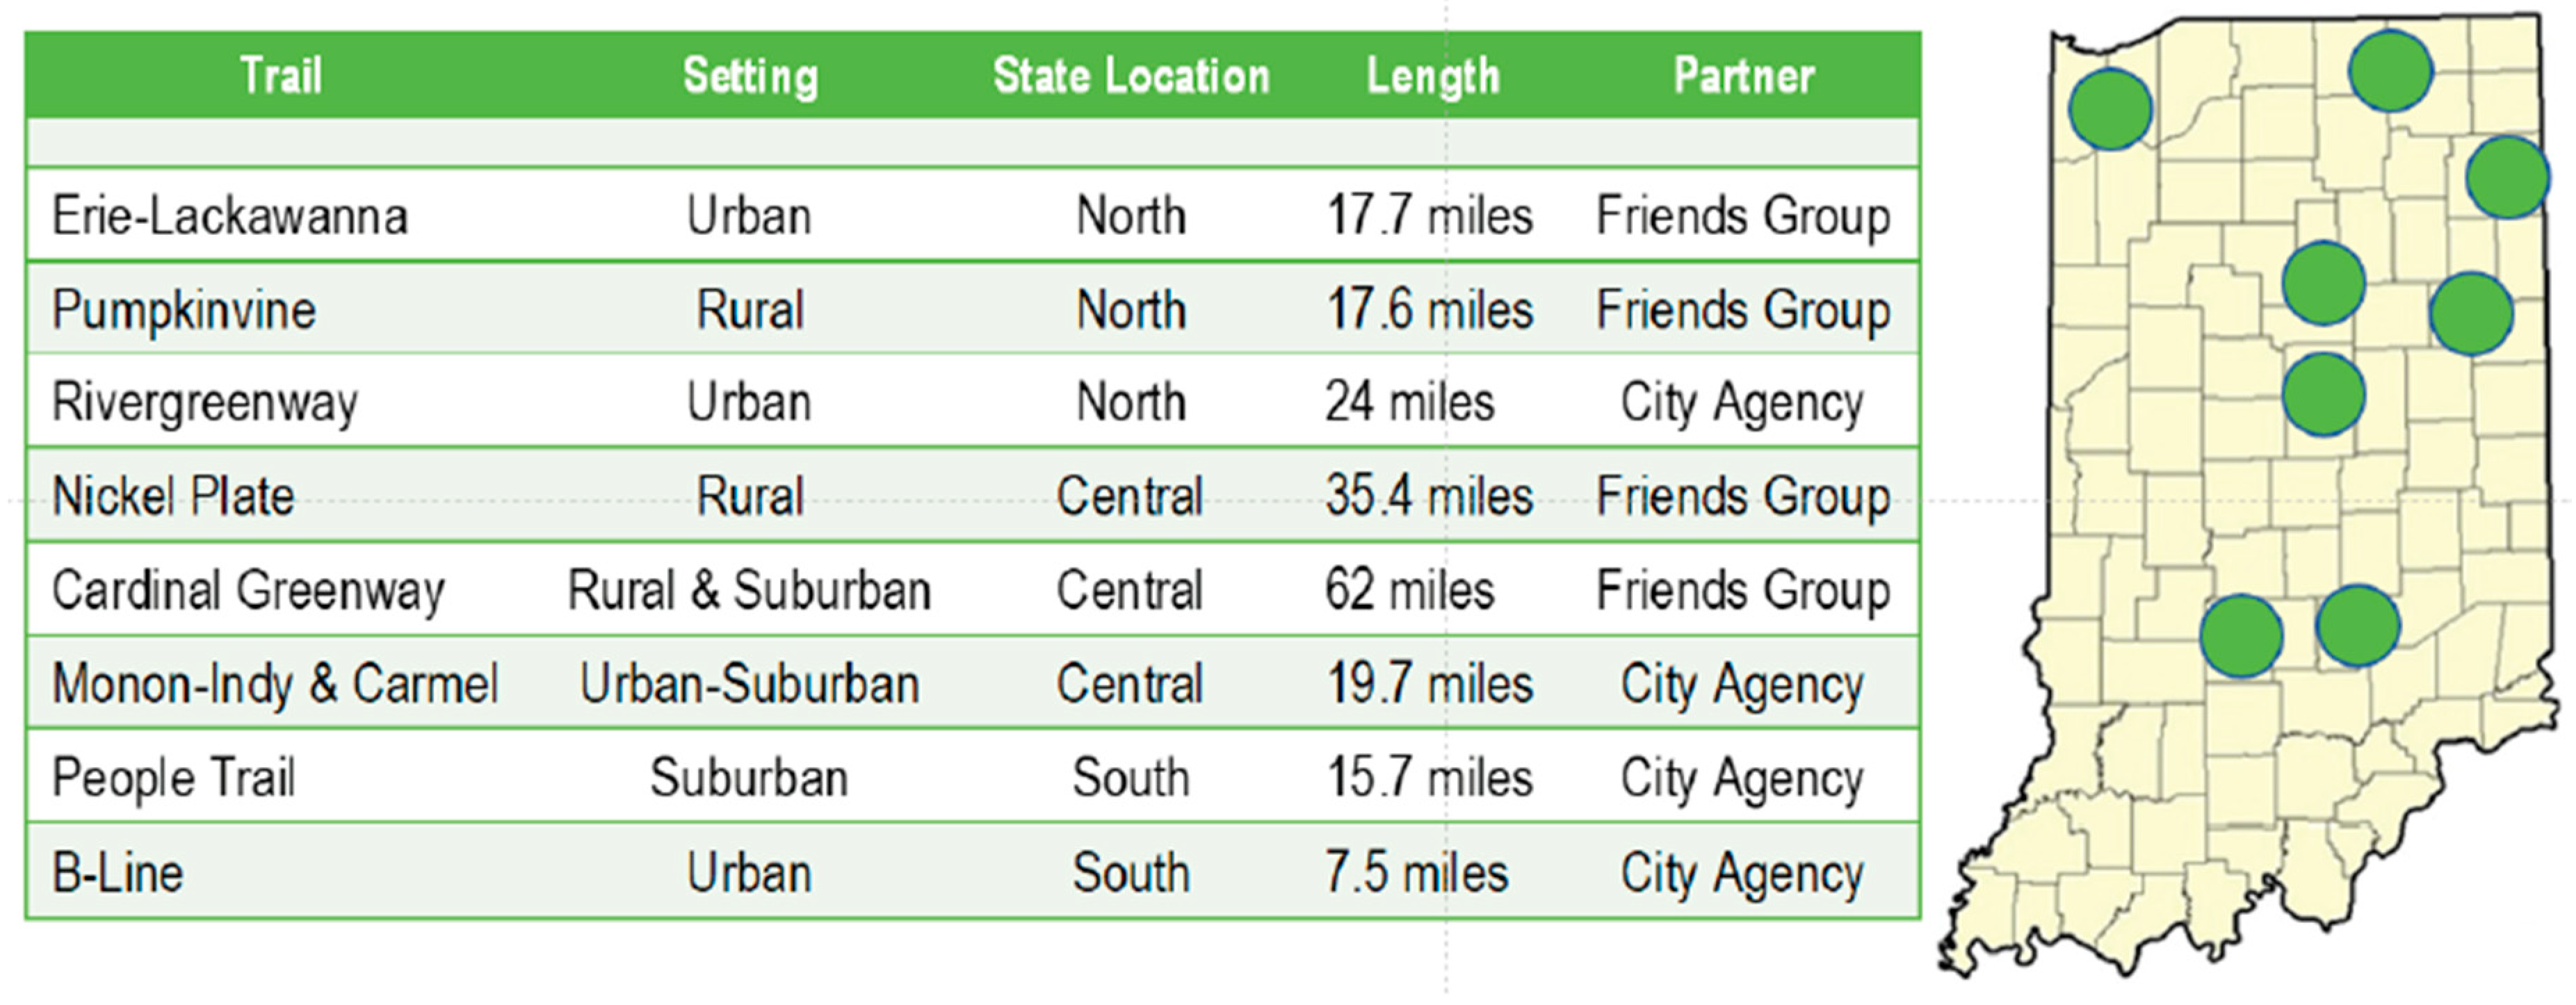
2.2. Trail Selection
2.3. Trail User and Trail Non-User Survey Implementation
2.4. Statistical Methods
3. Results
4. Discussion
4.1. Sociodemographic Factors
4.2. Behaviors
4.3. Wellness and Health
4.4. Limits and Strengths
5. Conclusions
Author Contributions
Funding
Acknowledgments
Conflicts of Interest
References
- Asfar, T.; Ahmad, B.; Rastam, S.; Mulloli, T.P.; Ward, K.D.; Maziak, W. Self-rated health and its determinants among adults in Syria: A model from the Middle East. BMC Public Health 2007, 7, 177. [Google Scholar] [CrossRef] [PubMed] [Green Version]
- Berglund, E.; Lytsy, P.; Westerling, R. Active Traveling and Its Associations with Self-Rated Health, BMI and Physical Activity: A Comparative Study in the Adult Swedish Population. Int. J. Environ. Res. Public Health 2016, 13, 455. [Google Scholar] [CrossRef] [Green Version]
- Berto, R.; Barbiero, G.; Barbiero, P.; Senes, G. An Individual’s Connection to Nature Can Affect Perceived Restorativeness of Natural Environments. Some Observations about Biophilia. Behav. Sci. 2018, 8, 34. [Google Scholar] [CrossRef] [PubMed] [Green Version]
- Carrus, G.; Scopelliti, M.; Panno, A.; Lafortezza, R.; Colangelo, G.; Pirchio, S.; Ferrini, F.; Salbitano, F.; Agrimi, M.; Portoghesi, L.; et al. A Different Way to Stay in Touch with “Urban Nature”: The Perceived Restorative Qualities of Botanical Gardens. Front. Psychol. 2017, 8, 914. [Google Scholar] [CrossRef] [PubMed]
- Darviri, C.; Fouka, G.; Gnardellis, C.; Artemiadis, A.K.; Tigani, X.; Alexopoulos, E.C. Determinants of self-rated health in a representative sample of a rural population: A cross-sectional study in Greece. Int. J. Environ. Res. Public Health 2012, 9, 943–954. [Google Scholar] [CrossRef] [PubMed] [Green Version]
- Dong, W.; Wan, J.; Xu, Y.; Chen, C.; Bai, G.; Fang, L.; Sun, A.; Yang, Y.; Wang, Y. Determinants of self-rated health among shanghai elders: A cross-sectional study. BMC Public Health 2017, 17, 807. [Google Scholar] [CrossRef] [PubMed] [Green Version]
- Girón, P. Determinants of self-rated health in Spain: Differences by age groups for adults. Eur. J. Public Health 2012, 22, 36–40. [Google Scholar] [CrossRef]
- Granger, E.; Williams, G.; Di Nardom, F.; Harrison, A.; Verma, A. The relationship between physical activity and self-rated health status in European adolescents: Results of the EURO-URHIS 2 survey. Eur. J. Public Health 2017, 27, 107–111. [Google Scholar] [CrossRef]
- Han, M.A.; Kim, K.S.; Park, J.; Kang, M.G.; Ryu, S.Y. Association between levels of physical activity and poor self-rated health in Korean adults: The Third Korea National Health and Nutrition Examination Survey (KNHANES), 2005. Public Health 2009, 123, 665–669. [Google Scholar] [CrossRef]
- Hsieh, H.-H.; Chang, C.-M.; Liu, L.-W.; Huang, H.-C. The Relative Contribution of Dietary Habits, Leisure-Time Exercise, Exercise Attitude, and Body Mass Index to Self-Rated Health among College Students in Taiwan. Int. J. Environ. Res. Public Health 2018, 15, 967. [Google Scholar] [CrossRef] [Green Version]
- Kapteyn, A.; Lee, J.; Tassot, C.; Vonkova, H.; Zamarro, G. Dimensions of Subjective Well-Being. Soc. Indic. Res. 2015, 123, 625–660. [Google Scholar] [CrossRef] [PubMed] [Green Version]
- Lachytova, M.; Katreniakova, Z.; Mikula, P.; Jendrichovsky, M.; Nagyova, I. Associations between self-rated health, mental health problems and physical inactivity among urban adolescents. Eur. J. Public Health 2017, 27, 984–989. [Google Scholar] [CrossRef] [PubMed]
- Molarius, A.; Berglund, K.; Eriksson, C.; Lambe, M.; Nordström, E.; Eriksson, H.G.; Feldman, I. Socioeconomic conditions, lifestyle factors, and self-rated health among men and women in Sweden. Eur. J. Public Health 2007, 17, 125–133. [Google Scholar] [CrossRef] [PubMed] [Green Version]
- Pasanen, T.P.; Tyrväinen, L.; Korpela, K.M. The relationship between perceived health and physical activity indoors, outdoors in built environments, and outdoors in nature. Appl. Psychol. Health Well Being 2014, 6, 324–346. [Google Scholar] [CrossRef] [PubMed] [Green Version]
- Richards, J.; Jiang, X.; Kelly, P.; Chau, J.; Bauman, A.; Ding, D. Don’t worry, be happy: Cross-sectional associations between physical activity and happiness in 15 European countries. BMC Public Health 2015, 15, 53. [Google Scholar] [CrossRef] [Green Version]
- Södergren, M.; Sundquist, J.; Johansson, S.E.; Sundquist, K. Physical activity, exercise and self-rated health: A population-based study from Sweden. BMC Public Health 2008, 8, 352. [Google Scholar] [CrossRef] [Green Version]
- Esmaeili, A.; Masjedi, M.; Ani, A.; Farajzadegan, Z.; Behbahani, A.; Dashti, M.; Emami, M.H. New insights of anti-depressant therapy in the management of ulcerative colitis (UC). Gastroenterology 2008, 134, 100. [Google Scholar] [CrossRef]
- Marselle, M.R.; Irvine, K.N.; Warber, S.L. Walking for well-being: Are group walks in certain types of natural environments better for well-being than group walks in urban environments? Int. J. Environ. Res. Public Health 2013, 10, 5603–5628. [Google Scholar] [CrossRef] [Green Version]
- Bhupathiraju, S.N.; Hu, F.B. Epidemiology of Obesity and Diabetes and Their Cardiovascular Complications. Circ. Res. 2016, 118, 1723–1735. [Google Scholar] [CrossRef]
- Smiley, A.; King, D.; Bidulescu, A. The Association between Sleep Duration and Metabolic Syndrome: The NHANES 2013/2014. Nutrients 2019, 11, 2582. [Google Scholar] [CrossRef] [Green Version]
- Brown, J.B.; Gestring, M.L.; Forsythe, R.M.; Stassen, N.A.; Billiar, T.R.; Peitzman, A.B.; Sperry, J.L. Systolic blood pressure criteria in the National Trauma Triage Protocol for geriatric trauma: 110 is the new 90. J. Trauma Acute Care Surg. 2015, 78, 352–359. [Google Scholar] [CrossRef] [PubMed] [Green Version]
- Dulloo, A.G.; Miles-Chan, J.L.; Montani, J.-P. Nutrition, movement and sleep behaviours: Their interactions in pathways to obesity and cardiometabolic diseases. Obes. Rev. 2017, 18, 3–6. [Google Scholar] [CrossRef] [PubMed] [Green Version]
- Haire-Joshu, D.; Tabak, R. Preventing Obesity Across Generations: Evidence for Early Life Intervention. Annu. Rev. Public Health 2016, 37, 253–271. [Google Scholar] [CrossRef] [PubMed] [Green Version]
- Li, J.T.E.; Pursey, K.M.; Duncan, M.J.; Burrows, T. Addictive Eating and Its Relation to Physical Activity and Sleep Behavior. Nutrients 2018, 10, 1428. [Google Scholar] [CrossRef] [Green Version]
- Smiley, A.; King, D.; Harezlak, J.; Dinh, P.; Bidulescu, A. The association between sleep duration and lipid profiles: The NHANES 2013–2014. J. Diabetes Metabolic Disorders 2018, 3, 1–8. [Google Scholar] [CrossRef]
- Morassut, R.E.; Langlois, C.; Alyass, A.; Ishola, A.F.; Yazdi, F.T.; Mayhew, A.J.; Reddon, H.; MacKillop, J.; Pigeyre, M.; Meyre, D. Rationale and design of GENEiUS: A prospective observational study on the genetic and environmental determinants of body mass index evolution in Canadian undergraduate students. BMJ Open 2017, 7, e019365. [Google Scholar] [CrossRef] [Green Version]
- Pablos, A.; Nebot, V.; Vañó-Vicent, V.; Ceca, D.; Elvira, L. Effectiveness of a school-based program focusing on diet and health habits taught through physical exercise. Appl. Physiol. Nutr. Metab. 2018, 43, 331–337. [Google Scholar] [CrossRef] [Green Version]
- Raveendran, A.V.; Chacko, E.C.; Pappachan, J.M. Non-pharmacological Treatment Options in the Management of Diabetes Mellitus. Eur. Endocrinol. 2018, 14, 31–39. [Google Scholar] [CrossRef]
- Shahsanai, A.; Bahreynian, M.; Fallah, Z.; Hovsepian, S.; Kelishadi, R. Perceived barriers to healthy lifestyle from the parental perspective of overweight and obese students. J. Educ. Health Promot. 2019, 8, 79. [Google Scholar] [CrossRef]
- DNR: Statewide Comprehensive Outdoor Recreation Plan (SCORP). Available online: https://www.in.gov/dnr/outdoor/4201.htm. (accessed on 21 May 2020).
- DNR: Trails. Available online: https://www.in.gov/dnr/outdoor/2604.htm. (accessed on 21 May 2020).
- Gladwell, V.F.; Kuoppa, P.; Tarvainen, M.P.; Rogerson, M. A Lunchtime Walk in Nature Enhances Restoration of Autonomic Control during Night-Time Sleep: Results from a Preliminary Study. Int. J. Environ. Res. Public Health 2016, 13, 280. [Google Scholar] [CrossRef] [Green Version]
- Stigsdotter, U.K.; Corazon, S.S.; Sidenius, U.; Kristiansen, J.; Grahn, P. It is not all bad for the grey city - A crossover study on physiological and psychological restoration in a forest and an urban environment. Health Place 2017, 46, 145–154. [Google Scholar] [CrossRef] [PubMed]
- Fitzhugh, E.C.; Bassett, D.R.; Evans, M.F. Urban trails and physical activity: A natural experiment. Am. J. Prev. Med. 2010, 39, 259–262. [Google Scholar] [CrossRef] [PubMed]
- Merom, D.; Bauman, A.; Vita, P.; Close, G. An environmental intervention to promote walking and cycling-the impact of a newly constructed Rail Trail in Western Sydney. Prev. Med. 2003, 36, 235–242. [Google Scholar] [CrossRef]
- Pierce, J.R.; Denison, A.V.; Arif, A.A.; Rohrer, J.E. Living near a trail is associated with increased odds of walking among patients using community clinics. J. Community Health 2006, 31, 289–302. [Google Scholar] [CrossRef]
- Krinski, K.; Machado, D.G.S.; Lirani, L.S.; DaSilva, S.G.; Costa, E.C.; Hardcastle, S.J.; Elsangedy, H.M. Let’s Walk Outdoors! Self-Paced Walking Outdoors Improves Future Intention to Exercise in Women With Obesity. J. Sport Exerc. Psychol 2017, 39, 145–157. [Google Scholar] [CrossRef]
- Brownson, R.C.; Housemann, R.A.; Brown, D.R.; Jackson-Thompson, J.; King, A.C.; Malone, B.R.; Sallis, J.F. Promoting physical activity in rural communities: Walking trail access, use, and effects. Am. J. Prev. Med. 2000, 18, 235–241. [Google Scholar] [CrossRef]
- Won, D.; Bae, J.-S.; Byun, H.; Seo, K.-B. Enhancing Subjective Well-Being through Physical Activity for the Elderly in Korea: A Meta-Analysis Approach. Int J. Environ. Res. Public Health 2019, 17, 262. [Google Scholar] [CrossRef] [Green Version]
- Netz, Y.; Wu, M.-J.; Becker, B.J.; Tenenbaum, G. Physical activity and psychological well-being in advanced age: A meta-analysis of intervention studies. Psychol. Aging 2005, 20, 272–284. [Google Scholar] [CrossRef] [Green Version]
- Abdin, S.; Welch, R.K.; Byron-Daniel, J.; Meyrick, J. The effectiveness of physical activity interventions in improving well-being across office-based workplace settings: A systematic review. Public Health 2018, 160, 70–76. [Google Scholar] [CrossRef]
- Panza, G.A.; Taylor, B.A.; Thompson, P.D.; White, C.M.; Pescatello, L.S. Physical activity intensity and subjective well-being in healthy adults. J. Health Psychol. 2019, 24, 1257–1267. [Google Scholar] [CrossRef]
- Wolter, S.A.; Ramos, W.D.; Elliott, L.; Smiley, A. Investigating the Health Benefits of Trail Use; a Perspective from Park Practitioners. Recreat. Parks Tour. Public Health 2019, 3, 97–112. [Google Scholar] [CrossRef]
- Smiley, A.; Ramos, W.D.; Elliott, L.M.; Wolter, S.A. Association between trail use and self-rated wellness and health. BMC Public Health 2020, 20, 128. [Google Scholar] [CrossRef] [PubMed] [Green Version]
- Gordon, P.M.; Zizzi, S.J.; Pauline, J. Use of a community trail among new and habitual exercisers: A preliminary assessment. Prev. Chronic Dis. 2004, 1, A11. [Google Scholar] [PubMed]
- Inc, G. Fast Food Still Major Part of U.S. Diet. Gallup.com. Published August 6, 2013. Available online: https://news.gallup.com/poll/163868/fast-food-major-part-diet.aspx. (accessed on 17 December 2019).
- Inc, G. In, U.S.; Consumption of Fruits and Vegetables Trails Access. Gallup.com. Published September 22, 2010. Available online: https://news.gallup.com/poll/143159/Consumption-Fruits-Vegetables-Trails-Access.aspx. (accessed on 21 May 2020).
- Wolter, S.; Lindsey, G. The Indiana Trails Study (2001); Eppley Institute for Parks and Public Lands: Bloomington, IN, USA, 2001. Available online: https://www.in.gov/indot/files/z-CompleteDocument.pdf. (accessed on 15 April 2020).
- Natale, V.; Fabbri, M.; Tonetti, L.; Martoni, M. Psychometric goodness of the Mini Sleep Questionnaire. Psychiatry Clin. Neurosci. 2014, 68, 568–573. [Google Scholar] [CrossRef] [PubMed]
- DeSalvo, K.B.; Bloser, N.; Reynolds, K.; He, J.; Muntner, P. Mortality prediction with a single general self-rated health question. A meta-analysis. J. Gen. Intern. Med. 2006, 21, 267–275. [Google Scholar] [CrossRef] [Green Version]
- Hays, R.D.; Bjorner, J.B.; Revicki, D.A.; Spritzer, K.L.; Cella, D. Development of physical and mental health summary scores from the patient-reported outcomes measurement information system (PROMIS) global items. Qual Life Res. 2009, 18, 873–880. [Google Scholar] [CrossRef] [Green Version]
- Picavet, H.S. National health surveys by mail or home interview: Effects on response. J. Epidemiol. Community Health 2001, 55, 408–413. [Google Scholar] [CrossRef] [Green Version]
- Wolter, S.A.; Depper, G.; Cleveland, H.; Moir, A.; Murray, S.; Tessneer, S.; Smiley, A. Indiana Uplands Park, Recreation, and Protected Land Inventory and Opportunity Mapping; Indiana University: Bloomington, IN, USA, 2019; Available online: https://scholarworks.iu.edu/dspace/handle/2022/25510. (accessed on 20 August 2020).
- Titze, S.; Merom, D.; Rissel, C.; Bauman, A. Epidemiology of cycling for exercise, recreation or sport in Australia and its contribution to health-enhancing physical activity. J. Sci. Med. Sport 2014, 17, 485–490. [Google Scholar] [CrossRef]
- Smiley, A. Association of Sleep and Metabolic Syndrome/Metabolic Syndrome Components among Participants in JHS and the REGARDS. Available online: https://search.proquest.com/openview/e260e1515bc14ed21799c895f9b44aa5/1?pq-origsite=gscholar&cbl=18750&diss=y. (accessed on 15 April 2020).
- Smiley, A.; Wolter, S.; Nissan, D. Mechanisms of association of sleep and metabolic syndrome. J. Med. Clin. Res. Rev. 2019, 3, 1–9. [Google Scholar] [CrossRef]
- Marselle, M.R.; Warber, S.L.; Irvine, K.N. Growing Resilience through Interaction with Nature: Can Group Walks in Nature Buffer the Effects of Stressful Life Events on Mental Health? Int. J. Environ. Res. Public Health 2019, 16, 986. [Google Scholar] [CrossRef] [Green Version]
- Aspinall, P.; Mavros, P.; Coyne, R.; Roe, J. The urban brain: Analysing outdoor physical activity with mobile EEG. Br. J. Sports Med. 2015, 49, 272–276. [Google Scholar] [CrossRef] [PubMed] [Green Version]
- Barton, J.; Griffin, M.; Pretty, J. Exercise-, nature- and socially interactive-based initiatives improve mood and self-esteem in the clinical population. Perspect Public Health 2012, 132, 89–96. [Google Scholar] [CrossRef] [PubMed]
- McAllister, E.; Bhullar, N.; Schutte, N.S. Into the Woods or a Stroll in the Park: How Virtual Contact with Nature Impacts Positive and Negative Affect. Int. J. Environ. Res. Public Health 2017, 14, 786. [Google Scholar] [CrossRef] [PubMed] [Green Version]
- Rogerson, M.; Gladwell, V.F.; Gallagher, D.J.; Barton, J.L. Influences of Green Outdoors versus Indoors Environmental Settings on Psychological and Social Outcomes of Controlled Exercise. Int. J. Environ. Res. Public Health 2016, 13, 363. [Google Scholar] [CrossRef] [Green Version]
- Ball, K.; Bauman, A.; Leslie, E.; Owen, N. Perceived environmental aesthetics and convenience and company are associated with walking for exercise among Australian adults. Prev. Med. 2001, 33, 434–440. [Google Scholar] [CrossRef]
- Marselle, M.R.; Irvine, K.N.; Lorenzo-Arribas, A.; Warber, S.L. Moving beyond green: Exploring the relationship of environment type and indicators of perceived environmental quality on emotional well-being following group walks. Int. J. Environ. Res. Public Health 2014, 12, 106–130. [Google Scholar] [CrossRef]

| Demographic & SES Characteristics | Trail Users | Non-Users | p Value | |||
|---|---|---|---|---|---|---|
| Frequency | Percentage | Frequency | Percentage | |||
| Age, years | 18–25 | 78 | 6 | 50 | 22 | 0.0001 * |
| 26–35 | 169 | 13 | 39 | 17 | ||
| 36–45 | 208 | 16 | 35 | 15.5 | ||
| 46–65 | 584 | 45 | 68 | 29.5 | ||
| >65 | 260 | 20 | 36 | 16 | ||
| Sex | Female | 571 | 44 | 139 | 61 | 0.0001 * |
| Male | 728 | 56 | 89 | 38 | ||
| Race | White | 1214 | 93.5 | 205 | 90 | 0.015* |
| Black | 20 | 1.5 | 11 | 5 | ||
| Hispanic | 39 | 3 | 7 | 3 | ||
| Asian | 20 | 1.5 | 3 | 1.5 | ||
| Indian | 6 | 0.5 | 1 | 0.5 | ||
| Marital Status | Single | 240 | 19 | 69 | 30.5 | 0.0001 * |
| Married | 929 | 71.5 | 128 | 56 | ||
| Widowed | 26 | 2 | 8 | 3.5 | ||
| Divorced | 104 | 8 | 23 | 10 | ||
| Employment | Homemaker | 45 | 3.5 | 14 | 6 | 0.0001 * |
| Self-employed | 131 | 10 | 23 | 10 | ||
| Student | 52 | 4 | 30 | 13 | ||
| Employed | 740 | 57 | 121 | 53 | ||
| Retired | 318 | 24.5 | 39 | 17 | ||
| Not Employed | 13 | 1 | 2 | 1 | ||
| Job Satisfaction | <30% | 65 | 5 | 32 | 14 | 0.001 * |
| 30–70% | 273 | 21 | 34 | 15 | ||
| >70% | 961 | 74 | 162 | 71 | ||
| Education | <9th Grade | 13 | 1 | 1 | 0.5 | 0.0001 * |
| High School | 189 | 14.5 | 69 | 30 | ||
| Technical School | 84 | 6.5 | 6 | 2.5 | ||
| College Graduate | 520 | 40 | 86 | 38 | ||
| Graduate School | 344 | 26.5 | 45 | 20 | ||
| Professional Degree | 149 | 11.5 | 21 | 9 | ||
| Household Income | <$10,000 | 26 | 2 | 16 | 7 | 0.0001 * |
| $10,000–38,000 | 130 | 10 | 48 | 21 | ||
| $38,001–91,000 | 546 | 42 | 86 | 38 | ||
| $91,001–190,000 | 454 | 35 | 64 | 28 | ||
| >$190,000 | 143 | 11 | 14 | 6 | ||
| Smoking | Yes | 39 | 3 | 17 | 7.5 | 0.004 * |
| No | 1260 | 97 | 211 | 92.5 | ||
| How Many Days Per Week, Do You Have: | Never, % | Everyday, % | p Value | ||
|---|---|---|---|---|---|
| Trail Users | Non-Users | Trail Users | Non-Users | ||
| Difficulty Falling Asleep | 54 | 41 | 2 | 9 | 0.0001 * |
| Too Early Wake Up | 50 | 43 | 4 | 9 | 0.001 * |
| Hypnotic Medications Use | 89 | 82 | 3 | 6 | 0.001 * |
| Falling Asleep During Day | 68 | 55.5 | 1.5 | 2.5 | 0.007 * |
| Tired Feeling Upon Waking | 19 | 38 | 4.5 | 16.5 | 0.0001 * |
| Snoring | 62 | 49 | 12.5 | 18 | 0.01 * |
| Mid-sleep Awakenings | 34 | 22.5 | 18.5 | 24.5 | 0.02 * |
| Headache Upon Waking | 83 | 68 | 0.1 | 2 | 0.0001 * |
| Excessive Daytime Sleepiness | 58.5 | 34.5 | 2 | 6 | 0.0001 * |
| Excessive Movement During Sleep | 72 | 59 | 3.5 | 9.5 | 0.0001 * |
| Lack of Energy | 61 | 36.5 | 1 | 5 | 0.0001 * |
| Sadness | 68 | 49 | 2.5 | 3 | 0.0001 * |
| Anger | 61 | 44 | 1.5 | 7.5 | 0.0001 * |
| Physical Pain | 55 | 34.5 | 8.5 | 17 | 0.0001 * |
| Worry | 48 | 31.5 | 6 | 13 | 0.0001 * |
| Fast Food Meals | 51 | 33.5 | 0.5 | 0.5 | 0.0001 * |
| <5 Servings of Fruits & Vegetables | 29 | 16.5 | 9 | 14 | 0.0001 * |
| Value | Frequency | Percentage |
|---|---|---|
| Increased | 860 | 66.6 |
| Decreased | 14 | 1.1 |
| Do not know | 24 | 1.9 |
| Stayed the same | 393 | 30.4 |
| Missing | 8 | |
| Total | 1299 |
| Increased Activity Reported | Frequency | Percentage |
|---|---|---|
| 0–25% | 226 | 27.3 |
| 26–50% | 306 | 37.0 |
| 51–75% | 133 | 16.1 |
| 76–100% | 99 | 12.0 |
| Over 100% | 63 | 7.6 |
| Importance | Scenery (Beauty of Environment) | Outdoors (Access to Nature/Environment) | ||
|---|---|---|---|---|
| Frequency | Percentage | Frequency | Percentage | |
| Least Important | 10 | 0.8 | 12 | 1 |
| Somewhat Important | 61 | 4.9 | 29 | 2.4 |
| Important | 227 | 18.3 | 107 | 8.7 |
| Quite Important | 423 | 34.1 | 305 | 24.8 |
| Most Important | 518 | 41.8 | 778 | 63.2 |
| Missing | 60 | 68 | ||
| Total | 1299 | 1299 | ||
| Predictors | Univariable Association | Multivariable Full Model, R2 = 0.183 | Multivariable Final Model, R2 = 0.159 | ||||
|---|---|---|---|---|---|---|---|
| OR (95% CI) ** | p | OR (95% CI) ** | p | OR (95% CI) ** | p | ||
| Age, Years | 1.49 (1.33–1.67) | 0.0001 * | 1.43 (1.18–1.74) | 0.0001 * | 1.39 (1.16–1.65) | 0.0001 * | |
| Sex, Male | 2.00 (1.49–2.69) | 0.0001 * | 2.03 (1.43–2.89) | 0.0001 * | 1.98 (1.41–2.77) | 0.0001 * | |
| Race | White | 0.99 (0.41–2.42) | 0.997 | 0.68 (0.26–1.78) | 0.450 | Race, Marital Status, Employment, Income, Education, Smoking and Nutrition Were Removed By Backward Elimination | |
| Black | 0.26 (0.08–0.82) | 0.021 * | 0.18 (0.05–0.66) | 0.010 * | |||
| Alaska | 0.35 (0.03–4.53) | 0.424 | 0.20 (0.01–2.90) | 0.240 | |||
| Asians | 0.76 (0.17–3.52) | 0.730 | 0.49 (0.09–2.72) | 0.420 | |||
| Marital Status | Married | 0.76 (0.44–1.30) | 0.316 | 1.18 (0.63–2.21) | 0.125 | ||
| Widow | 1.59 (0.97–2.63) | 0.068 | 1.74 (0.85–3.54) | 0.610 | |||
| Divorce | 0.66 (0.26–1.68) | 0.0391 * | 0.74 (0.24–2.26) | 0.600 | |||
| Employment | Self-Employed | 1.87 (0.68–5.14) | 0.222 | 1.36 (0.40–4.6) | 0.620 | ||
| Student | 3.51 (1.40–8.78) | 0.007 * | 1.83 (0.61–5.46) | 0.280 | |||
| Employed for Wages | 1.06 (0.42–2.67) | 0.894 | 1.59 (0.49–5.09) | 0.435 | |||
| Retired | 3.77 (1.67–8.52) | 0.001 * | 2.54 (0.94–6.89) | 0.065 | |||
| Not Employed | 5.27 (2.22–12.50) | 0.0001 * | 1.63 (0.56–4.75) | 0.370 | |||
| Income | 1.56 (1.33–1.84) | 0.0001 * | 0.53 (0.70–0.23) | 0.10 | |||
| Education | 1.26 (1.12–1.42) | 0.0001 * | 1.29 (0.35–4.70) | 0.25 | |||
| Smoking | 0.41 (0.23–0.74) | 0.003 * | 0.68 (0.32–1.45) | 0.320 | |||
| Nutrition | 0.89 (0.86–0.94) | 0.0001 * | 0.97 (0.91–1.03) | 0.30 | |||
| Sleep | 0.94 (0.93–0.96) | 0.0001 * | 0.97 (0.95–0.99) | 0.004 * | 0.97 (0.95–0.99) | 0.002 * | |
| Mood | 0.92 (0.90–0.93) | 0.0001 * | 0.96 (0.93–0.99) | 0.01* | 0.95 (0.93–0.98) | 0.001 * | |
| Predictors | Univariate Association | Multivariable Model, R2 = 0.251 | ||
|---|---|---|---|---|
| β (95% CI) ** | p | β (95% CI) ** | p | |
| Age, Years | 0.32 (0.25–0.39) | 0.0001 * | 0.24 (0.17–0.31) | 0.0001 * |
| Sex, Male | −0.17 (-0.33–−0.01) | 0.04 * | Sex, Race, Marital Status, Employment, Income and Education Were Removed By Backward Elimination | |
| Race | −0.05 (-1.41–−0.39) | 0.30 | ||
| Marital Status | 0.13 (0.02–0.23) | 0.0 2* | ||
| Employment | 0.02 (−0.06–0.10) | 0.65 | ||
| Income | 0.25 (0.16–0.34) | 0.0001 * | ||
| Education | 0.05 (−0.009–0.11) | 0.10 | ||
| Smoking | 1.16 (0.74–1.57) | 0.0001 * | 0.64 (0.24–1.03) | 0.001 * |
| Nutrition | −0.11 (−0.13–−0.08) | 0.0001 * | −0.04 (−0.07–−0.01) | 0.003 * |
| Sleep | −0.05 (−0.06–−0.04) | 0.0001 * | −0.01 (−0.02–−0.002) | 0.017 * |
| Mood | −0.10 (−0.11–−0.09) | 0.0001 * | −0.07 (−0.09–−0.06) | 0.0001 * |
| Using the Trails | 1.07 (0.86–1.29) | 0.0001 * | 0.59 (0.37–0.80) | 0.0001 * |
© 2020 by the authors. Licensee MDPI, Basel, Switzerland. This article is an open access article distributed under the terms and conditions of the Creative Commons Attribution (CC BY) license (http://creativecommons.org/licenses/by/4.0/).
Share and Cite
Smiley, A.; Ramos, W.; Elliott, L.; Wolter, S. Comparing the Trail Users with Trail Non-Users on Physical Activity, Sleep, Mood and Well-Being Index. Int. J. Environ. Res. Public Health 2020, 17, 6225. https://doi.org/10.3390/ijerph17176225
Smiley A, Ramos W, Elliott L, Wolter S. Comparing the Trail Users with Trail Non-Users on Physical Activity, Sleep, Mood and Well-Being Index. International Journal of Environmental Research and Public Health. 2020; 17(17):6225. https://doi.org/10.3390/ijerph17176225
Chicago/Turabian StyleSmiley, Abbas, William Ramos, Layne Elliott, and Stephen Wolter. 2020. "Comparing the Trail Users with Trail Non-Users on Physical Activity, Sleep, Mood and Well-Being Index" International Journal of Environmental Research and Public Health 17, no. 17: 6225. https://doi.org/10.3390/ijerph17176225
APA StyleSmiley, A., Ramos, W., Elliott, L., & Wolter, S. (2020). Comparing the Trail Users with Trail Non-Users on Physical Activity, Sleep, Mood and Well-Being Index. International Journal of Environmental Research and Public Health, 17(17), 6225. https://doi.org/10.3390/ijerph17176225