What Is the Best Practice Method for Quantifying the Health and Economic Benefits of Active Transport?

Abstract
:1. Introduction
2. Materials and Methods
2.1. Systematic Review
2.2. Search Strategy and Databases Included
2.3. Inclusion Criteria, Data Extraction and Quality Appraisal
- 1.
- Be published in English between 1 January 2000 and April 2019.
- 2.
- Be in the public domain, either as academic papers in peer reviewed journals or studies from the “grey” literature such as government reports and commissioned documents.
- 3.
- Be a primary study. Reviews and commentaries were excluded.
- 4a.
- Present a model that can be used for economic evaluation of active transport. Applications of already established models were not included unless they represented an extension of the method.
- 4b.
- Reproducible in a different setting.
- 5.
- Study conducted for the Australian context, or that of other high-income countries.
- 6.
- All age groups were considered.
2.4. Quality Assessment/Rating of Method
3. Results
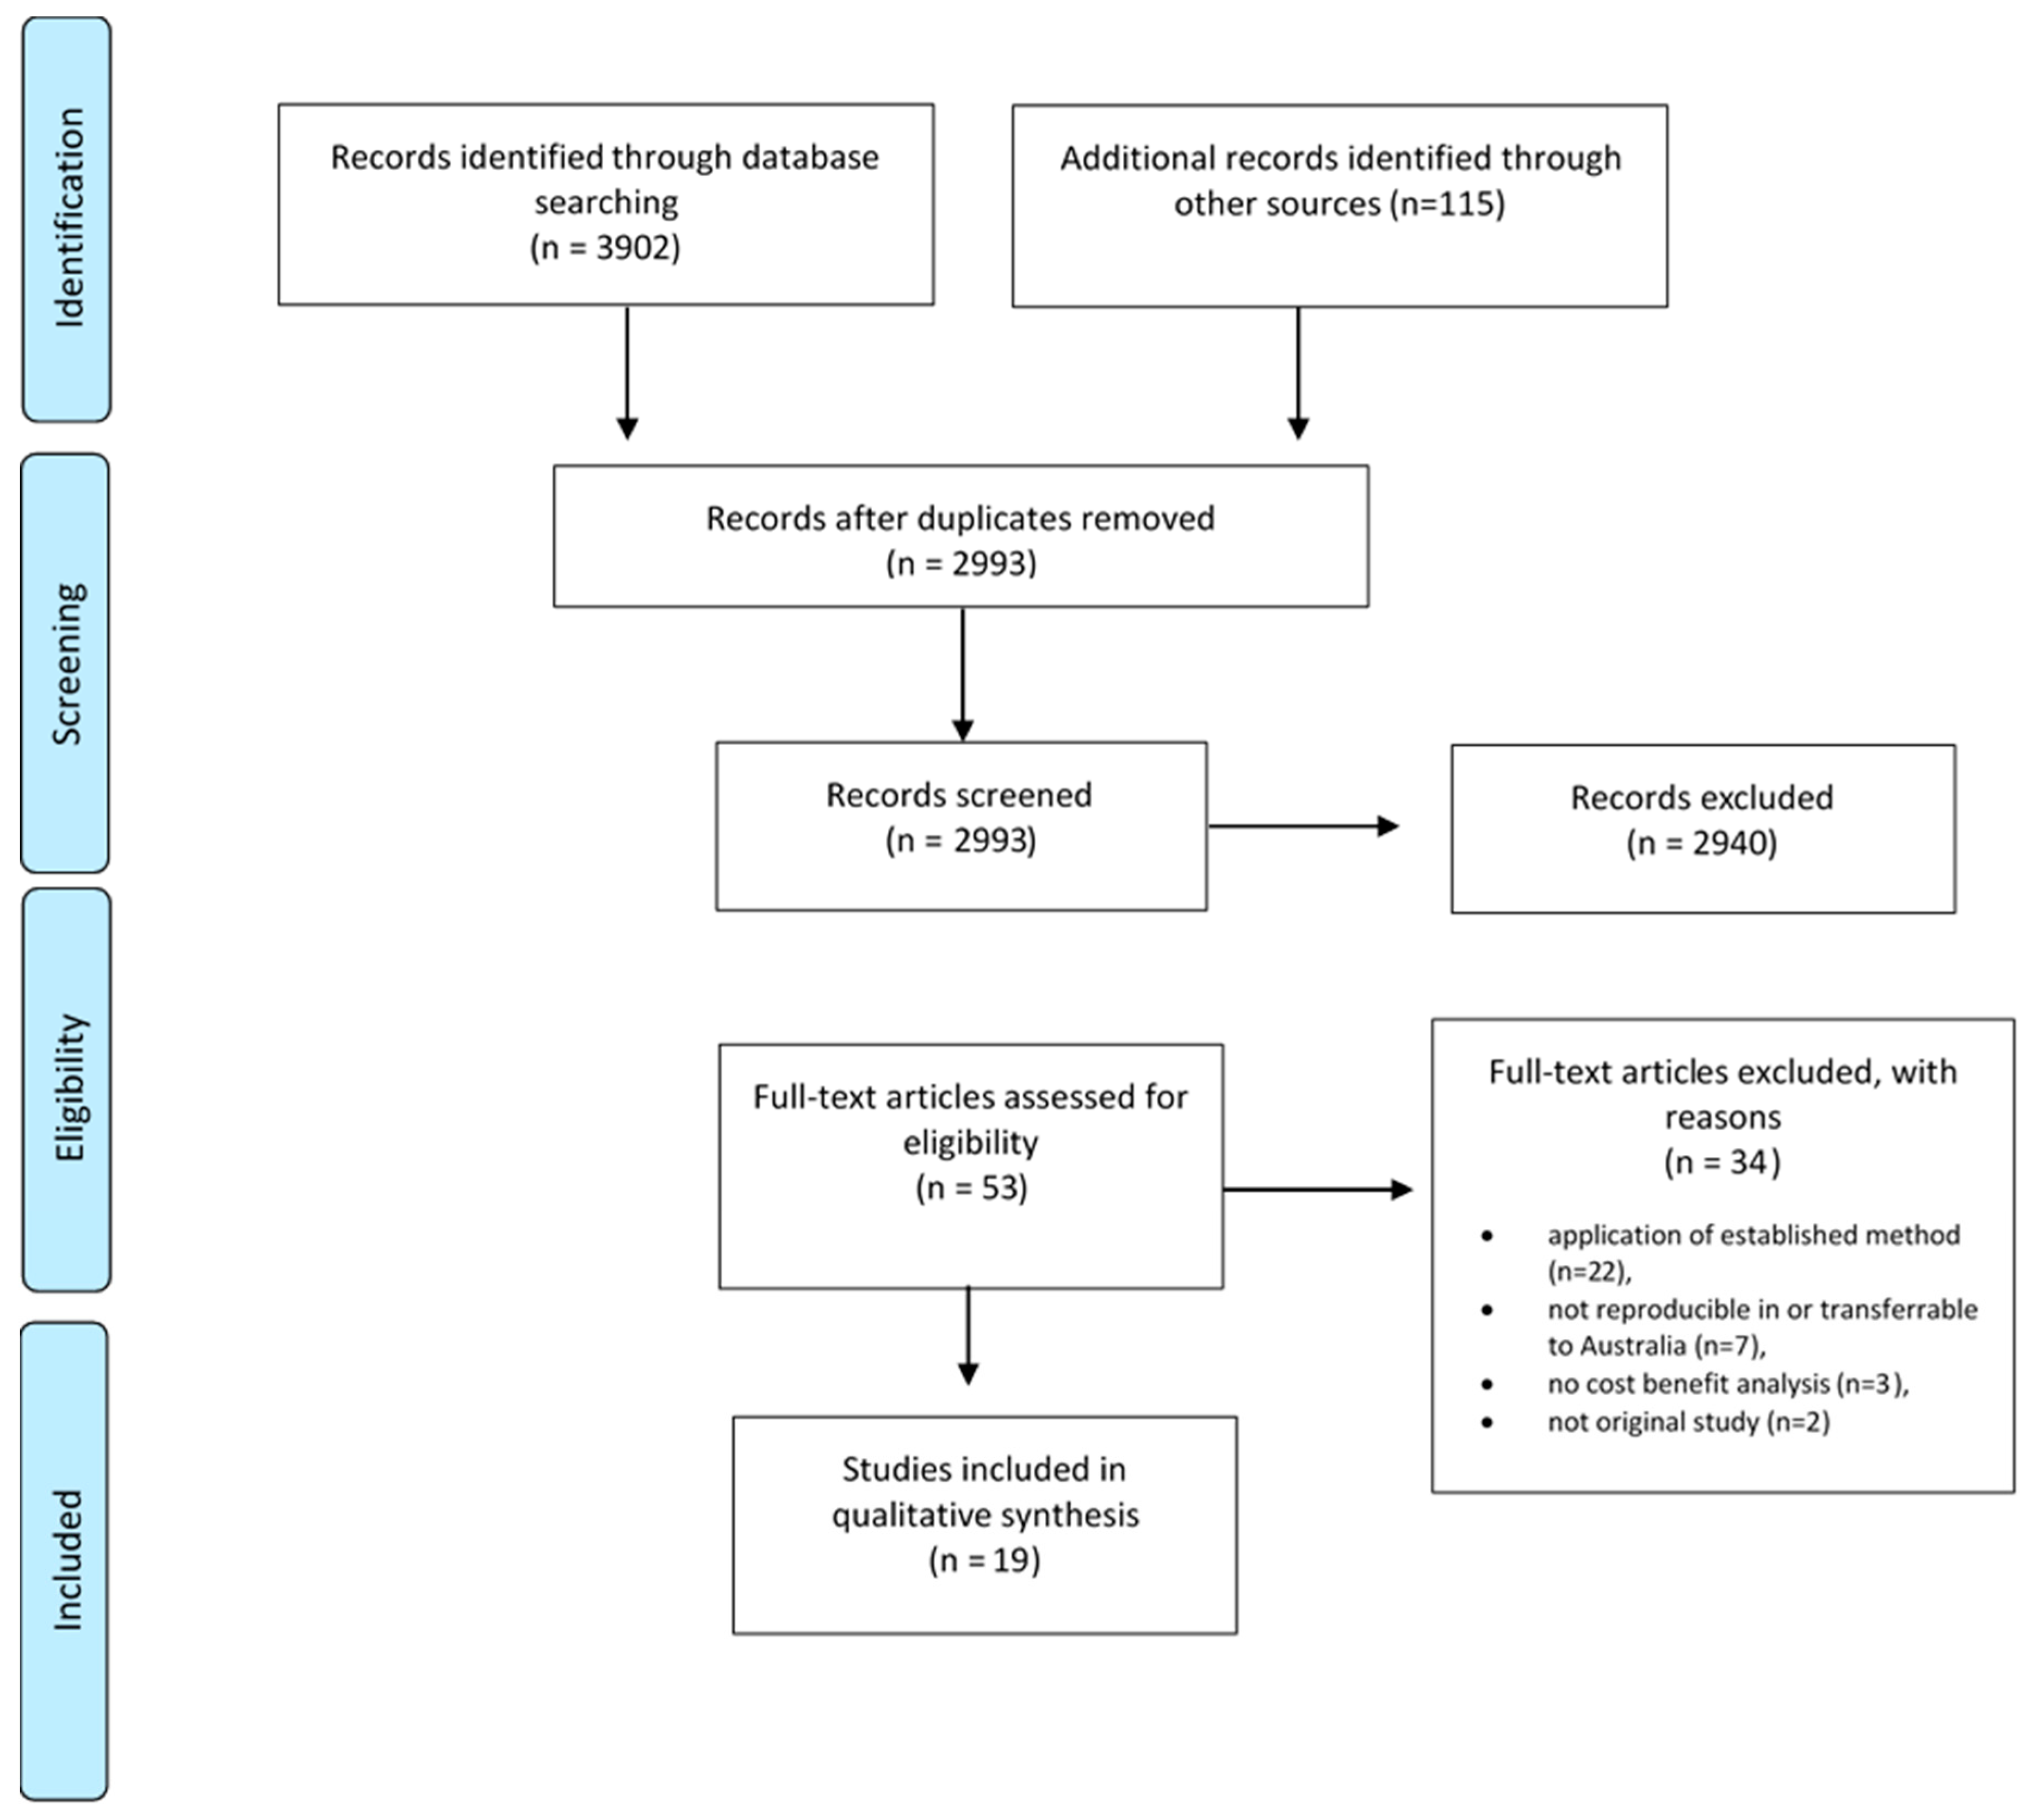
3.1. Literature Review
3.2. Characteristics of Studies Included
3.2.1. Statistical Models
3.2.2. Exposures and Health Outcomes
3.2.3. Outcome Measures
3.2.4. Economic Evaluation
3.2.5. Costing Health Benefits
3.2.6. Discounting
3.2.7. Modelling of Subgroups and Active Transport Modes
3.3. Assessment of Studies
4. Discussion
Strengths and Limitations
5. Conclusions
Supplementary Materials
Author Contributions
Funding
Acknowledgments
Conflicts of Interest
References
- Booth, F.W.; Roberts, C.K.; Laye, M.J. Lack of exercise is a major cause of chronic diseases. Compr. Physiol. 2012, 2, 1143–1211. [Google Scholar] [CrossRef] [PubMed] [Green Version]
- Lee, I.M.; Shiroma, E.J.; Lobelo, F.; Puska, P.; Blair, S.N.; Katzmarzyk, P.T. Effect of physical inactivity on major non-communicable diseases worldwide: An analysis of burden of disease and life expectancy. Lancet 2012, 380, 219–229. [Google Scholar] [CrossRef] [Green Version]
- GBD 2017 Risk Factor Collaborators. Global, regional, and national comparative risk assessment of 84 behavioural, environmental and occupational, and metabolic risks or clusters of risks for 195 countries and territories, 1990–2017: A systematic analysis for the Global Burden of Disease Study 2017. Lancet 2018, 392, 1923–1994. [Google Scholar] [CrossRef] [Green Version]
- Australian Bureau of Statistics. National Health Survey First Results. Australia 2017–2018; ABS Catalogue No. 4364.0.55.001; Australian Bureau of Statistics: Canberra, Australia, 2018.
- Guthold, R.; Stevens, G.; Riley, L.; Bull, F. Worldwide trends in insufficient physical activity from 2001 to 2016: A pooled analysis of 358 population-based surveys with 1·9 million participants. Lancet Glob. Health 2018, 6. [Google Scholar] [CrossRef] [Green Version]
- Giles-Corti, B.; Vernez-Moudon, A.; Reis, R.; Turrell, G.; Dannenberg, A.L.; Badland, H.; Foster, S.; Lowe, M.; Sallis, J.F.; Stevenson, M.; et al. City planning and population health: A global challenge. Lancet 2016, 388, 2912–2924. [Google Scholar] [CrossRef]
- Olsen, J.R.; Mitchell, R.; Mutrie, N.; Foley, L.; Ogilvie, D.; on behalf of the M74 Study. Population levels of, and inequalities in, active travel: A national, cross-sectional study of adults in Scotland. Prev. Med. Rep. 2017, 8, 129–134. [Google Scholar] [CrossRef]
- Zapata-Diomedi, B.; Knibbs, L.D.; Ware, R.S.; Heesch, K.C.; Tainio, M.; Woodcock, J.; Veerman, J.L. A shift from motorised travel to active transport: What are the potential health gains for an Australian city? PLoS ONE 2017, 12, e0184799. [Google Scholar] [CrossRef] [Green Version]
- Woodcock, J.; Givoni, M.; Morgan, A.S. Health impact modelling of active travel visions for England and Wales using an Integrated Transport and Health Impact Modelling Tool (ITHIM). PLoS ONE 2013, 8, e51462. [Google Scholar] [CrossRef]
- Cavill, N.; Kahlmeier, S.; Dinsdale, H.; Ĝtschi, T.; Oja, P.; Racioppi, F.; Rutter, H. The Health Economic Assessment Tool (HEAT) for walking and cycling: From evidence to advocacy on active transport. J. Sci. Med. Sport 2012, 15, S69. [Google Scholar] [CrossRef]
- Riley, E.; Harris, P.; Kent, J.; Sainsbury, P.; Lane, A.; Baum, F. Including Health in Environmental Assessments of Major Transport Infrastructure Projects: A Documentary Analysis. Int. J. Health Policy Manag. 2018, 7, 144–153. [Google Scholar] [CrossRef]
- NSW Government. The Treasurey Guide to Cost-Benefit Analysis; Policy and Guidelines Paper; NSW Government: Sydney, Australia, 2017.
- Brown, V.; Diomedi, B.Z.; Moodie, M.; Veerman, J.L.; Carter, R. A systematic review of economic analyses of active transport interventions that include physical activity benefits. Transp. Policy 2016, 45, 190–208. [Google Scholar] [CrossRef] [Green Version]
- Higgins, J.P.T.; Green, S. Cochrane Handbook for Systematic Reviews of Interventions Version 5.1.0. 2011. Available online: www.handbook.cochrane.org (accessed on 26 August 2020).
- Diomedi, B.Z.; Brown, V.; Veerman, L. An Evidence Review and Modelling Exercise: The Effects of Urban Form on Health: Costs and Benefits; The Australian Prevention Partnership Centre: Sydney, Austrilia, 2016.
- Husereau, D.; Drummond, M.; Petrou, S.; Carswell, C.; Moher, D.; Greenberg, D.; Augustovski, F.; Briggs, A.H.; Mauskopf, J.; Loder, E. Consolidated Health Economic Evaluation Reporting Standards (CHEERS) statement. J. BMJ Br. Med. J. 2013, 346, f1049. [Google Scholar] [CrossRef] [PubMed] [Green Version]
- Brey, R.L.; Antonio, S.N.-B.; José, I.C.-M.; Lourdes, L.P.-V.; Manuel, M.-G.M.; Mercedes, C.-N.O. Is the widespread use of urban land for cycling promotion policies cost effective? A Cost-Benefit Analysis of the case of Seville. Land Use Policy 2017, 63, 130–139. [Google Scholar] [CrossRef]
- Brown, V.; Moodie, M.; Cobiac, L.; Mantilla, H.; Carter, R. Obesity-related health impacts of active transport policies in Australia—A policy review and health impact modelling study. Aust. N. Z. J. Public Health 2017, 41, 611–616. [Google Scholar] [CrossRef] [PubMed]
- Buekers, J.; Dons, E.; Elen, B.; Panis, L.I. Health impact model for modal shift from car use to cycling or walking in Flanders: Application to two bicycle highways. J. Transp. Health 2015, 2, 549–562. [Google Scholar] [CrossRef]
- Cobiac, L.J.; Vos, T.; Barendregt, J.J. Cost-effectiveness of interventions to promote physical activity: A modelling study. PLoS Med. 2009, 6, e1000110. [Google Scholar] [CrossRef] [Green Version]
- Doorley, R.; Pakrashi, V.; Ghosh, B. Health impacts of cycling in Dublin on individual cyclists and on the local population. J. Transp. Health 2017, 6, 420–432. [Google Scholar] [CrossRef]
- Genter, J.; Donovan, S.; Petrenas, B.; Badland, H. Valuing the health benefits of active transport modes. Natl. Acad. Sci. Eng. Med. 2008, 359, 72. [Google Scholar]
- Gu, J.; Mohit, B.; Muennig, P.A. The cost-effectiveness of bike lanes in New York City. Inj. Prev. J. Int. Soc. Child Adolesc. Inj. Prev. 2017, 23, 239–243. [Google Scholar] [CrossRef]
- Holm, A.L.; Glumer, C.; Diderichsen, F. Health impact assessment of increased cycling to place of work or education in Copenhagen. BMJ Open 2012, 2. [Google Scholar] [CrossRef] [Green Version]
- Johansson, C.; Lovenheim, B.; Schantz, P.; Wahlgren, L.; Almstrom, P.; Markstedt, A.; Stromgren, M.; Forsberg, B.; Sommar, J.N. Impacts on air pollution and health by changing commuting from car to bicycle. Sci. Total Environ. 2017, 584–585, 55–63. [Google Scholar] [CrossRef] [PubMed]
- Macmillan, A.; Connor, J.; Witten, K.; Kearns, R.; Rees, D.; Woodward, A. The societal costs and benefits of commuter bicycling: Simulating the effects of specific policies using system dynamics modeling. Environ. Health Perspect. 2014, 122, 335–344. [Google Scholar] [CrossRef] [PubMed] [Green Version]
- Mueller, N.; Rojas-Rueda, D.; Basagana, X.; Cirach, M.; Cole-Hunter, T.; Dadvand, P.; Donaire-Gonzalez, D.; Foraster, M.; Gascon, M.; Martinez, D.; et al. Health impacts related to urban and transport planning: A burden of disease assessment. Environ. Int. 2017, 107, 243–257. [Google Scholar] [CrossRef] [PubMed] [Green Version]
- Rojas-Rueda, D.; de Nazelle, A.; Teixidó, O.; Nieuwenhuijsen, M. Health impact assessment of increasing public transport and cycling use in Barcelona: A morbidity and burden of disease approach. Prev. Med. 2013, 57, 573–579. [Google Scholar] [CrossRef]
- Sælensminde, K. Cost–benefit analyses of walking and cycling track networks taking into account insecurity, health effects and external costs of motorized traffic. Transp. Res. Part A Policy Pract. 2004, 38, 593–606. [Google Scholar] [CrossRef]
- Stokes, R.J.; MacDonald, J.; Ridgeway, G. Estimating the effects of light rail transit on health care costs. Health Place 2008, 14, 45–58. [Google Scholar] [CrossRef]
- Taddei, C.; Gnesotto, R.; Forni, S.; Bonaccorsi, G.; Vannucci, A.; Garofalo, G. Cycling promotion and non-communicable disease prevention: Health impact assessment and economic evaluation of cycling to work or school in Florence. PLoS ONE 2015, 10, e0125491. [Google Scholar] [CrossRef] [Green Version]
- Zheng, H.; Ehrlich, F.; Amin, J.; Zheng, H.; Ehrlich, F.; Amin, J. Economic evaluation of the direct healthcare cost savings resulting from the use of walking interventions to prevent coronary heart disease in Australia. Int. J. Health Care Financ. Econ. 2010, 10, 187–201. [Google Scholar] [CrossRef]
- Moher, D.; Liberati, A.; Tetzlaff, J.; Altman, D.G. Preferred reporting items for systematic reviews and meta-analyses: The PRISMA statement. Ann. Intern. Med. 2009, 151, 264–269, w64. [Google Scholar] [CrossRef] [Green Version]
- Ding, D.; Lawson, K.D.; Kolbe-Alexander, T.L.; Finkelstein, E.A.; Katzmarzyk, P.T.; van Mechelen, W.; Pratt, M. The economic burden of physical inactivity: A global analysis of major non-communicable diseases. Lancet 2016, 388, 1311–1324. [Google Scholar] [CrossRef]
- Sabia, S.; Dugravot, A.; Dartigues, J.F.; Abell, J.; Elbaz, A.; Kivimaki, M.; Singh-Manoux, A. Physical activity, cognitive decline, and risk of dementia: 28 year follow-up of Whitehall II cohort study. BMJ (Clin. Res. Ed.) 2017, 357, j2709. [Google Scholar] [CrossRef] [Green Version]
- Schuch, F.B.; Vancampfort, D.; Firth, J.; Rosenbaum, S.; Ward, P.B.; Silva, E.S.; Hallgren, M.; Ponce De Leon, A.; Dunn, A.L.; Deslandes, A.C.; et al. Physical Activity and Incident Depression: A Meta-Analysis of Prospective Cohort Studies. Am. J. Psychiatry 2018, 175, 631–648. [Google Scholar] [CrossRef] [PubMed]
- Martin, A.; Goryakin, Y.; Suhrcke, M. Does active commuting improve psychological wellbeing? Longitudinal evidence from eighteen waves of the British Household Panel Survey. Prev. Med. 2014, 69, 296–303. [Google Scholar] [CrossRef] [PubMed]
- Brown, V.; Moodie, M.; Mantilla Herrera, A.M.; Veerman, J.L.; Carter, R. Active transport and obesity prevention—A transportation sector obesity impact scoping review and assessment for Melbourne, Australia. Prev. Med. 2017, 96, 49–66. [Google Scholar] [CrossRef] [PubMed] [Green Version]
- Lamichhane, D.K.; Leem, J.H.; Lee, J.Y.; Kim, H.C. A meta-analysis of exposure to particulate matter and adverse birth outcomes. Environ. Health Toxicol. 2015, 30, e2015011. [Google Scholar] [CrossRef]
- Elvik, R.; Goel, R. Safety-in-numbers: An updated meta-analysis of estimates. Accid. Anal. Prev. 2019, 129, 136–147. [Google Scholar] [CrossRef]
- Ezzati, M.; Lopez, A.D.; Rodgers, A.; Murray, C.J.L. Comparative Quantification of Health Risks. Global and Regional Burden of Disease Attributable to Selected Major Risk Factors; World Health Organisation: Geneva, Switzerland, 2004; Volume 1. [Google Scholar]
- Barendregt, J.J.; Veerman, J.L. Categorical versus continuous risk factors and the calculation of potential impact fractions. J. Epidemiol. Community Health 2010, 64, 209–212. [Google Scholar] [CrossRef]
- Barendregt, J.J.; Van Oortmarssen, G.J.; Van Hout, B.A.; Van Den Bosch, J.M.; Bonneux, L. Coping with multiple morbidity in a life table. Math. Popul. Stud. 1998, 7, 29–49. [Google Scholar] [CrossRef]
- Abelson, P. Establishing a Monetary Value for Lives Saved: Issues and Controversies. Working Papers in Cost-Benefit Analysis; 2008. Available online: https://www.pmc.gov.au/sites/default/files/publications/Working_paper_2_Peter_Abelson.pdf (accessed on 26 August 2020).
- Bellavance, F.; Dionne, G.; Lebeau, M. The value of a statistical life: A meta-analysis with a mixed effects regression model. J. Health Econ. 2009, 28, 444–464. [Google Scholar] [CrossRef]

| Category | Characteristics from Stakeholder Consultation | Criteria for Evaluation |
|---|---|---|
| Types of active transport |
|
|
| Statistical model |
|
|
|
| |
|
| |
| Exposures relevant to active transport |
|
|
| Health outcomes |
|
|
| Outcome measures |
|
|
| Author, Date | Country | Type of Active Transport | Statistical Model | Exposures Considered | Physical Activity Outcome Measures | Injury Outcome Measures | Air pollution Outcome Measures | Summary Outcome Measures | Discounting | Evaluation Method |
|---|---|---|---|---|---|---|---|---|---|---|
| Brey et al., 2016 | Spain | Cycling | BoD * | Physical activity and injury | All-cause mortality | Bike and car accidents | N/A | Avoided deaths and monetary value of avoided deaths applying value of statistical life year, cost of road transport injury | 5% | CBA * |
| Brown et al., 2017 | Australia | Walking and cycling | Multi state lifetable model | Physical activity and injury | Incidence of nine obesity-related diseases modelled via effect on BMI. Ischaemic heart disease, hypertensive heart disease, ischaemic stroke, diabetes, colorectal cancer, kidney cancer, breast cancer, endometrial cancer and osteoarthritis) | Mode-specific fatalities and serious injuries | N/A | YLD (for injury only), HALY and healthcare costs | 3% | CBA * |
| Buekers et al., 2015 | Belgium | Walking and cycling | BoD * | Air pollution, road transport injury, physical activity | Incidence: IHD, dementia, type2 diabetes, depression, colon cancer, breast cancer. Mortality: all-cause mortality (mortality risk delayed in time), Morbidity, Morbidity costs (including treatment costs and productivity costs) | Crash risk for cycling and walking, relatively to car driving from local data | All-cause mortality due to air pollution (YLL) | DALY *, external costs, cost per km, cost benefit (YLL * x VSLY *) | No | CBA * |
| Cobiac et al., 2009 | Australia | Any physical activity | Multi state lifetable model | Physical activity | Ischaemic heart disease, ischaemic stroke, type 2 diabetes, breast cancer and colon cancer. Morbidity and mortality | N/A | N/A | DALY * & QALY * | 3% | CUA * |
| Doorley et al., 2017 | Ireland | Cycling | BoD * | Physical activity, air pollution (PM2.5 *), road transport injury | Cardiovascular disease, breast cancer, colon cancer, dementia, depression and type II diabetes | Morbidity and mortality from road transport injury | Respiratory diseases, cardiovascular diseases and lung cancer. Since cardiovascular disease risk is influenced by both physical activity and pollution exposure, the impacts of the two exposures were modelled multiplicatively | YLL *, YLD *, DALY * | No | HIA * |
| Genter et al., 2009 | New Zealand | Walking and cycling | BoD * | Physical activity | All-cause mortality, colon, lung, breast and all cancer, CVD, type 2 diabetes (mortality), depression (incidence) | N/A | N/A | Cost benefit per km of active transport (VSL x mortality) | No | CBA * |
| Gu et al., 2016 | New York, USA | Cycling | Markov model | Physical activity, air pollution (PM2.5 *), road transport injury | LE * gain from physical activity considered in total cost output | QALYs * from injury considered in output | LE * gain/decrease from air pollution considered in total model | QALY *, cost per QALY * | 3% | CEA * |
| Holm 2012 | Copenhagen, Denmark | Cycling | BoD * | Physical activity, air pollution, road transport injury | YLL * and YLD * ischaemic heart disease, ischaemic stroke, type II diabetes, breast cancer, colon cancer | YLL * and YLD * injuries | YLL * and YLD * cardiopulmonary diseases, lung cancer | DALY * | No | HIA * |
| Johansson et al., 2017 | Stockholm, Sweden | Cycling | BoD * | Air pollution | N/A | N/A. | LE * gained due to decreased mortality | Years of life gained | No | HIA * |
| Kahlmeier et al., 2017 | Non-specific | Walking and cycling | BoD * | Physical activity, air pollution (PM2.5 *), road transport injury | All-cause mortality | All-cause mortality | All-cause mortality | Mortality and cost calculated per VSLY | 5% | CBA * |
| Li et al., 2014 | USA | Cycling | BoD * | Physical activity | All-cause mortality and health care costs | N/A | N/A | Reduced healthcare costs, reduced mortality cost (calculated by assigning VSLY * to reduced mortality), reduced accident cost | 5% | CBA * |
| Macmillan et al., 2014 | New Zealand | Cycling | System dynamics model | Physical activity, air pollution, road transport injury | All-cause mortality | Serious injury and deaths caused by a collision with a light vehicle. | Deaths, cardiovascular and respiratory, carbon monoxide, COPD * hospitalizations and restricted activity days due to PM10 *, cancer incidence due to benzene | Deaths, hospitalisations, restricted activity days, monetary values (net benefit, cost benefit) | No | CEA * |
| Mueller et al., 2017 | Spain | Physical activity | BoD * | Physical activity, air pollution, road transport injury | Physical activity all-cause mortality for YLL * and YLD *—cardiovascular disease (CVD *), stroke, type 2 diabetes, colon cancer, breast cancer and dementia. | Road transport Traffic incidents with injuries (fatal or non-fatal) | Air pollution, all-cause mortality, cardiovascular disease (CVD *), stroke, type 2 diabetes, respiratory hospital admissions, preterm birth, low birth weight. | YLL *, YLD *, DALY * | No | HIA * |
| Rojas-Rueda et al., 2013 | Spain | Cycling | BoD * | Physical activity, air pollution, road transport injury | Physical activity: cardiovascular disease, type 2 diabetes, breast cancer, colon cancer, dementia | Road traffic incidents: minor and major injuries | Air pollution: CVD *, cerebrovascular disease, lower respiratory tract infection, low birth weight and preterm birth | Morbidity and DALY * | No | HIA * |
| Saelensminde 2004 | Norway | Walking and cycling | Other-cost savings per new active traveller | Physical activity | The four types of diseases are cancer (five different types), high blood pressure, type 2 diabetes and musculoskeletal ailments. | N/A | N/A | Cost | 3% and 8% | CBA * |
| Stokes et al., 2007 | US | Walking | Other cost saving by applying cost of obesity from other study | Physical activity | Obesity and obesity related costs | N/A | N/A | Cost | No | CBA * |
| Taddei et al., 2014 | Italy | Cycling | BoD * | Physical activity, road transport injury | All-cause mortality, incidence type 2 diabetes, AMI *, heart failure, stroke | Road traffic accidents and fatalities by mode of transport | N/A | Incidence, mortality, treatment cost and cost | 5% | CEA * |
| Woodcock, et al., 2013 | UK | Physical activity | BoD * | Physical activity, air pollution, road transport injury | CVD *, colon cancer, breast cancer, diabetes, dementia, depression, all-cause mortality | Road transport injury | Cardio-respiratory diseases, lung cancer, acute respiratory infections | DALY * | No | HIA * |
| Zapata-Diomedi et al., 2017 | Australia | Walking and cycling | Multi state lifetable model | Physical activity, air pollution, road transport injury | Breast cancer, colon cancer, ischemic Stroke, ischemic heart disease, type 2 diabetes | Road transport injury | Ischemic stroke, ischemic heart disease, tracheal, bronchus and lung cancer, COPD * | Health care costs, life years, HALYs *, prevalent cases, deaths, YLD * | No | CBA * |
| Zheng et al., 2010 | Australia | Walking | BoD * | Physical activity | CHD * | N/A | N/A | Health care cost saving | No | CBA * |
| Criteria | Brey et al., 2016 | Brown et al., 2017 | Buekers et al., 2015 | Cobiac et al., 2009 | Doorley et al., 2017 | Genter et al., 2009 | Gu et al., 2016 | Holm 2012 | Kahlmeier et al., 2017 | Macmillan et al., 2014 | Mueller et al., 2017 | Rojas-Rueda et al., 2013 | Taddei et al., 2014 | Woodcock et al., 2013 | Zapata-Diomedi et al., 2017 | Zheng et al., 2010 |
|---|---|---|---|---|---|---|---|---|---|---|---|---|---|---|---|---|
| Active Transport Modes | ||||||||||||||||
| Different forms of active transport (minimum cycling and walking) | No | Yes | Yes | Yes | Yes | Yes | No | No | Yes | No | Yes | Yes | No | Yes | Yes | No |
| Duration and intensity of active transport | No | Yes | No | Yes | Yes | No | Yes | No | Yes | Yes | Yes | Yes | No | Yes | Yes | No |
| Exposures Relevant to Active Transport | ||||||||||||||||
| Physical activity | Yes | Yes | Yes | Yes | Yes | Yes | Yes | Yes | Yes | Yes | Yes | Yes | Yes | Yes | Yes | Yes |
| Air pollution | No | No | Yes | No | Yes | No | Yes | Yes | Yes | Yes | Yes | Yes | No | Yes | Yes | No |
| Injury | Yes | Yes | Yes | No | Yes | No | Yes | Yes | Yes | Yes | Yes | Yes | Yes | Yes | Yes | No |
| Statistical Model | ||||||||||||||||
| States input parameter and assumptions | No | Yes | Yes | Yes | Yes | Yes | Yes | No | Yes | Yes | Yes | Yes | Yes | Yes | Yes | Yes |
| Analysis by population subgroups | Yes * | Yes * | Yes * | Yes * | Yes * | No | Yes * | Yes * | Yes * | Yes * | Yes * | Yes * | Yes * | Yes * | Yes * | No |
| Dynamic model | No | Yes | No | Yes | No | No | Yes | No | No | Yes | No | No | No | No | Yes | No |
| Models at fine grained level | No | Yes | No | Yes | Yes | No | Yes | Yes | No | Yes | Yes | No | No | Yes | Yes | No |
| Heath Outcomes (Minimum Included) # | ||||||||||||||||
| Physical activity | No | Obesity related outcomes | Yes | Yes | Yes | Yes | No | Yes | No | No | Yes | Yes | Yes | Yes | Yes | No |
| Air pollution | No | No | No | No | Yes | No | No) | No | No | Yes | Yes | Yes | No | Yes | Yes | No |
| Injury | Yes | Yes | Yes | No | Yes | No | No | Yes | No | Yes | Yes | Yes | Yes | Yes | Yes | No |
| Outcome Measures | ||||||||||||||||
| Morbidity | No | No | No | No | No | No | No | No | No | Yes | No | Yes | Yes | No | Yes | Yes |
| Mortality | Yes | Yes | No | No | No | No | Yes | No | Yes | Yes | No | No | Yes | No | Yes | No |
| YLD | No | Yes | Yes | Yes | Yes | No | No | Yes | No | No | Yes | Yes | No | Yes | Yes | No |
| YLL | No | No | Yes | Yes | Yes | No | No | Yes | No | No | Yes | Yes | No | Yes | Yes | No |
| Summary measure of population health | No | Yes | Yes | Yes | Yes | Yes | Yes | Yes | No | No | Yes | Yes | No | Yes | Yes | No |
| Health care costs | Yes | Yes | No | No | No | Yes | No | No | No | No | No | No | No | No | Yes | Yes |
| Productivity | No | No | No | No | No | No | No | No | No | No | No | No | Yes | No | Yes (Later Model) | |
| Monetisation | Yes | Yes | Yes | No | No | Yes | Yes | No | Yes | Yes | No | No | No | No | Yes | Yes |
© 2020 by the authors. Licensee MDPI, Basel, Switzerland. This article is an open access article distributed under the terms and conditions of the Creative Commons Attribution (CC BY) license (http://creativecommons.org/licenses/by/4.0/).
Share and Cite
Möller, H.; Haigh, F.; Hayek, R.; Veerman, L. What Is the Best Practice Method for Quantifying the Health and Economic Benefits of Active Transport? Int. J. Environ. Res. Public Health 2020, 17, 6186. https://doi.org/10.3390/ijerph17176186
Möller H, Haigh F, Hayek R, Veerman L. What Is the Best Practice Method for Quantifying the Health and Economic Benefits of Active Transport? International Journal of Environmental Research and Public Health. 2020; 17(17):6186. https://doi.org/10.3390/ijerph17176186
Chicago/Turabian StyleMöller, Holger, Fiona Haigh, Rema Hayek, and Lennert Veerman. 2020. "What Is the Best Practice Method for Quantifying the Health and Economic Benefits of Active Transport?" International Journal of Environmental Research and Public Health 17, no. 17: 6186. https://doi.org/10.3390/ijerph17176186
APA StyleMöller, H., Haigh, F., Hayek, R., & Veerman, L. (2020). What Is the Best Practice Method for Quantifying the Health and Economic Benefits of Active Transport? International Journal of Environmental Research and Public Health, 17(17), 6186. https://doi.org/10.3390/ijerph17176186