Validation and Application of a Derivatization-Free RP-HPLC-DAD Method for the Determination of Low Molecular Weight Salivary Metabolites


 , , ,
, , ,
Abstract
:1. Introduction
2. Materials and Methods
2.1. Chemicals
2.2. Study Subjects
2.3. Saliva Collection and Processing
2.4. Method Validation and Statistical Analysis
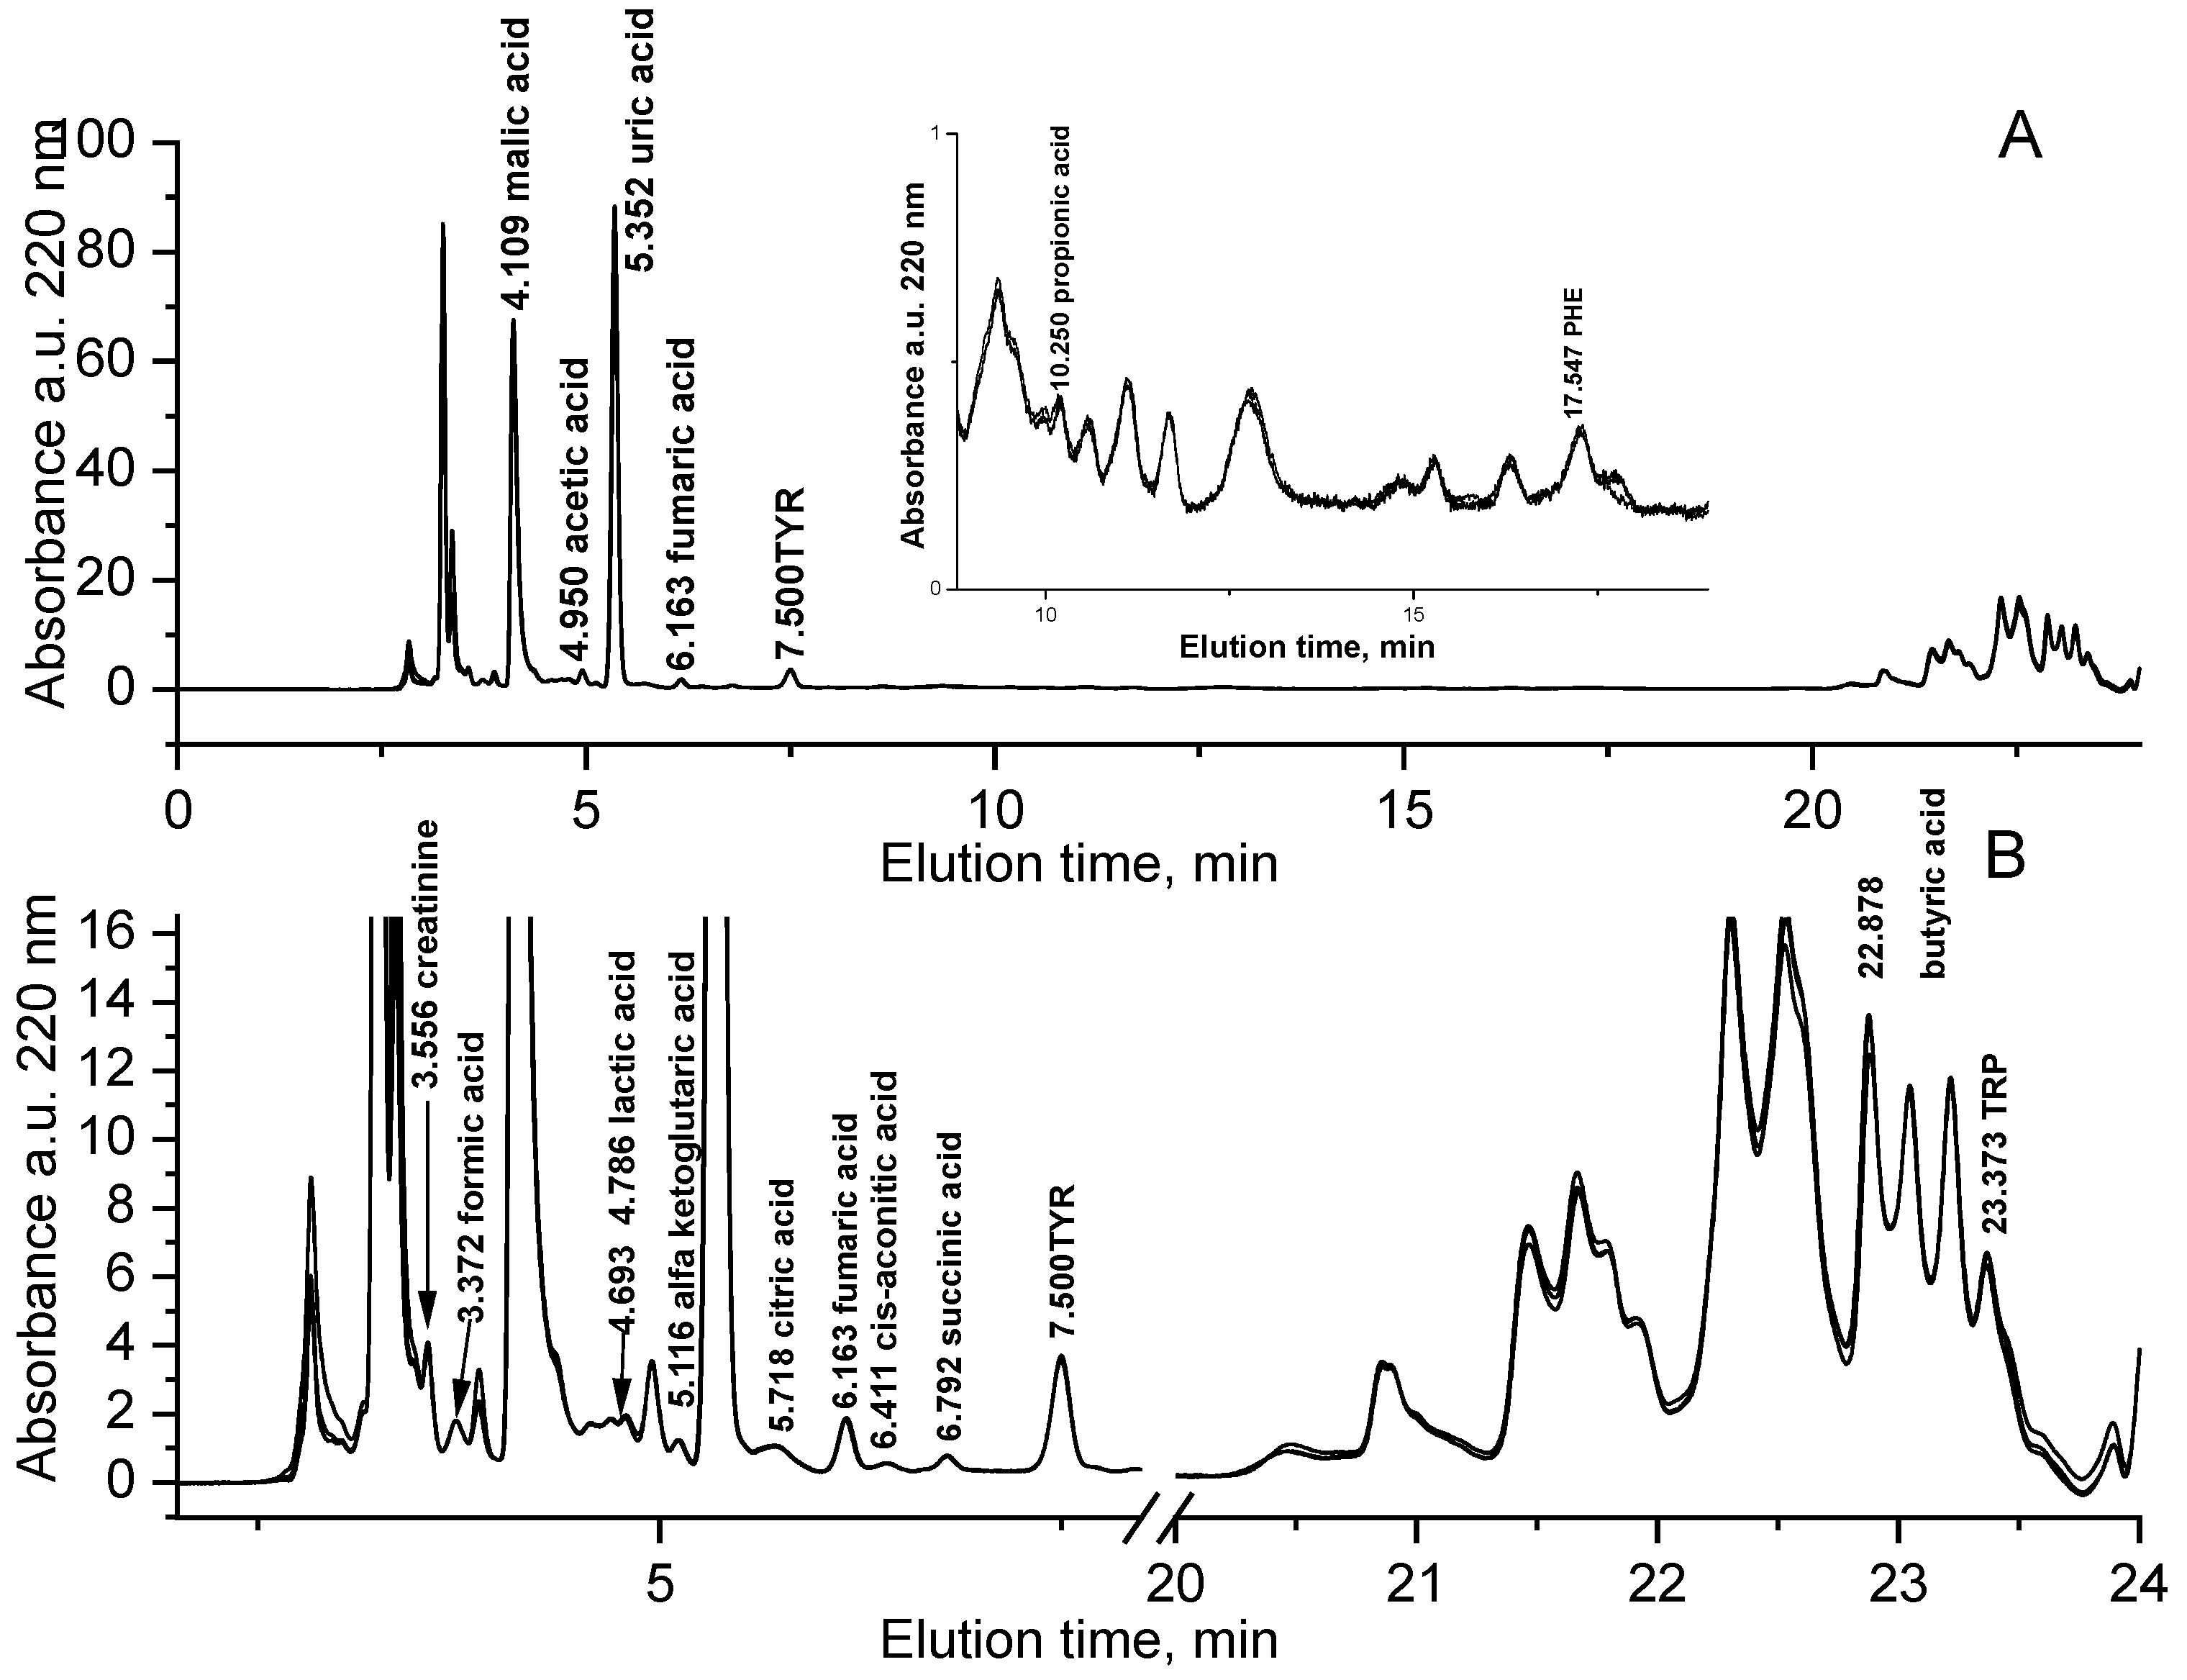
2.5. Analysis of Metabolites by RP-HPLC with UV Detection
3. Results and Discussion
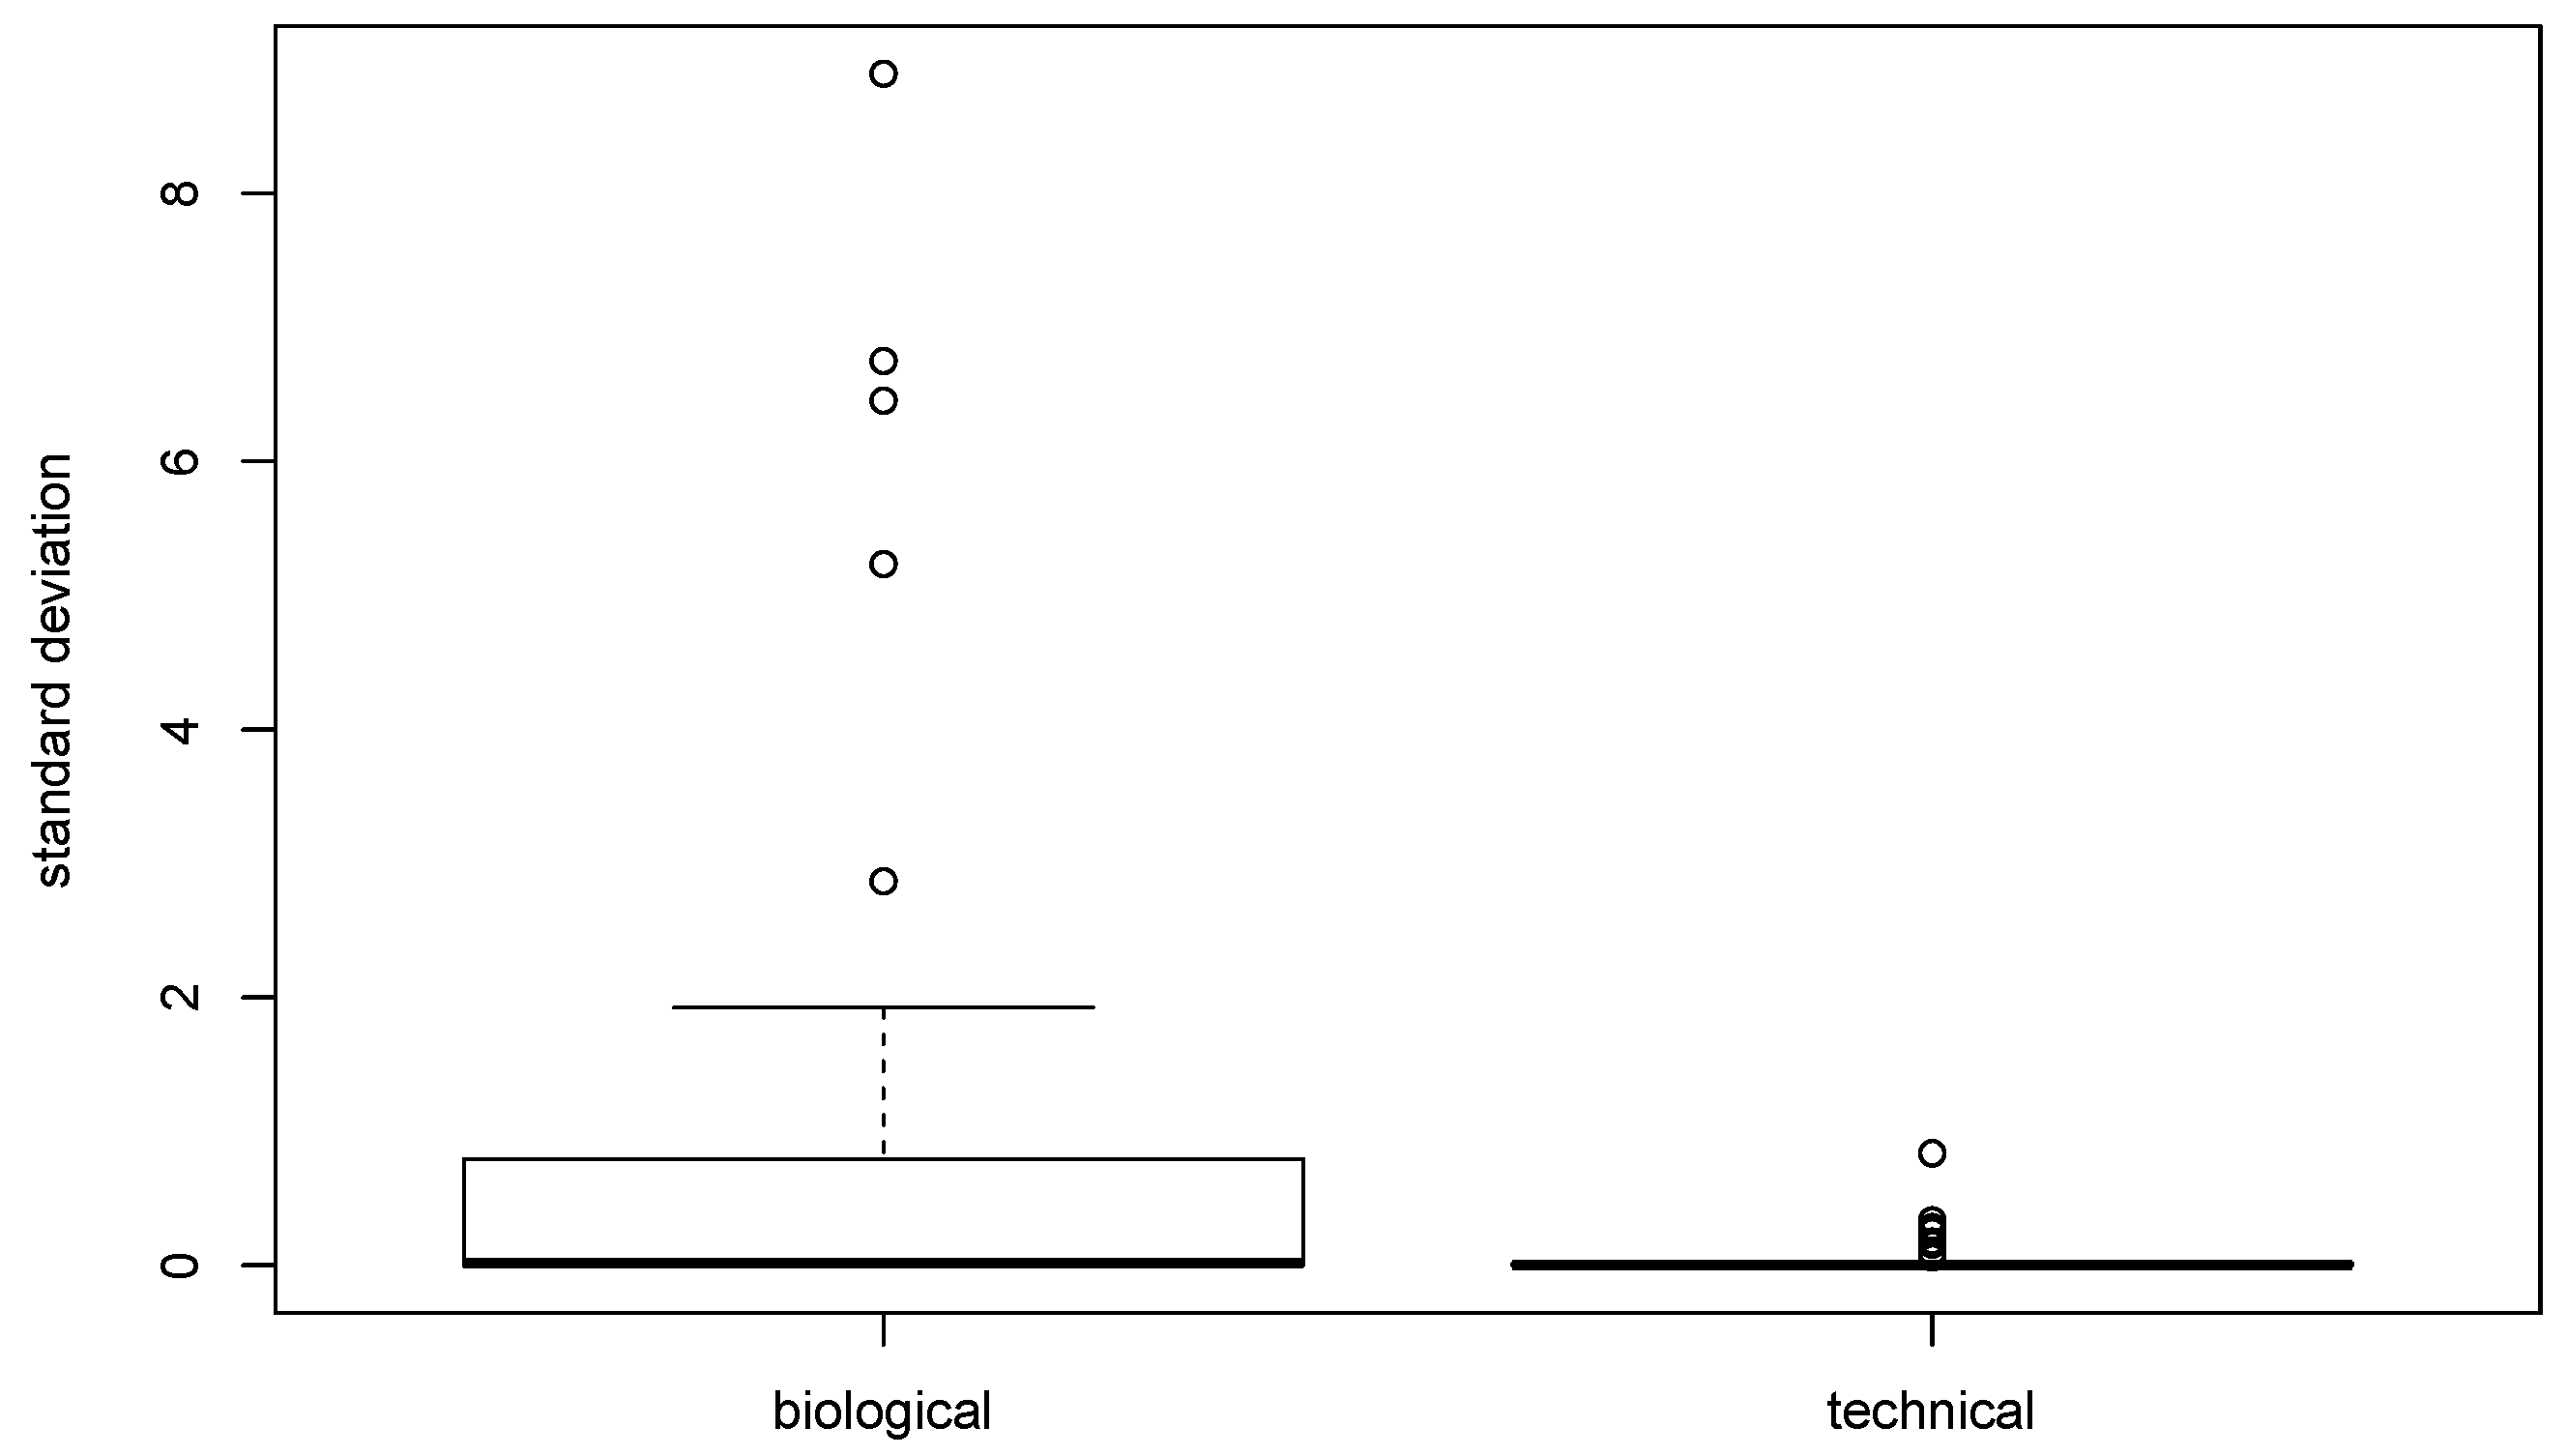
3.1. Method Validation in Saliva
3.2. Metabolites Quantification in Saliva Samples
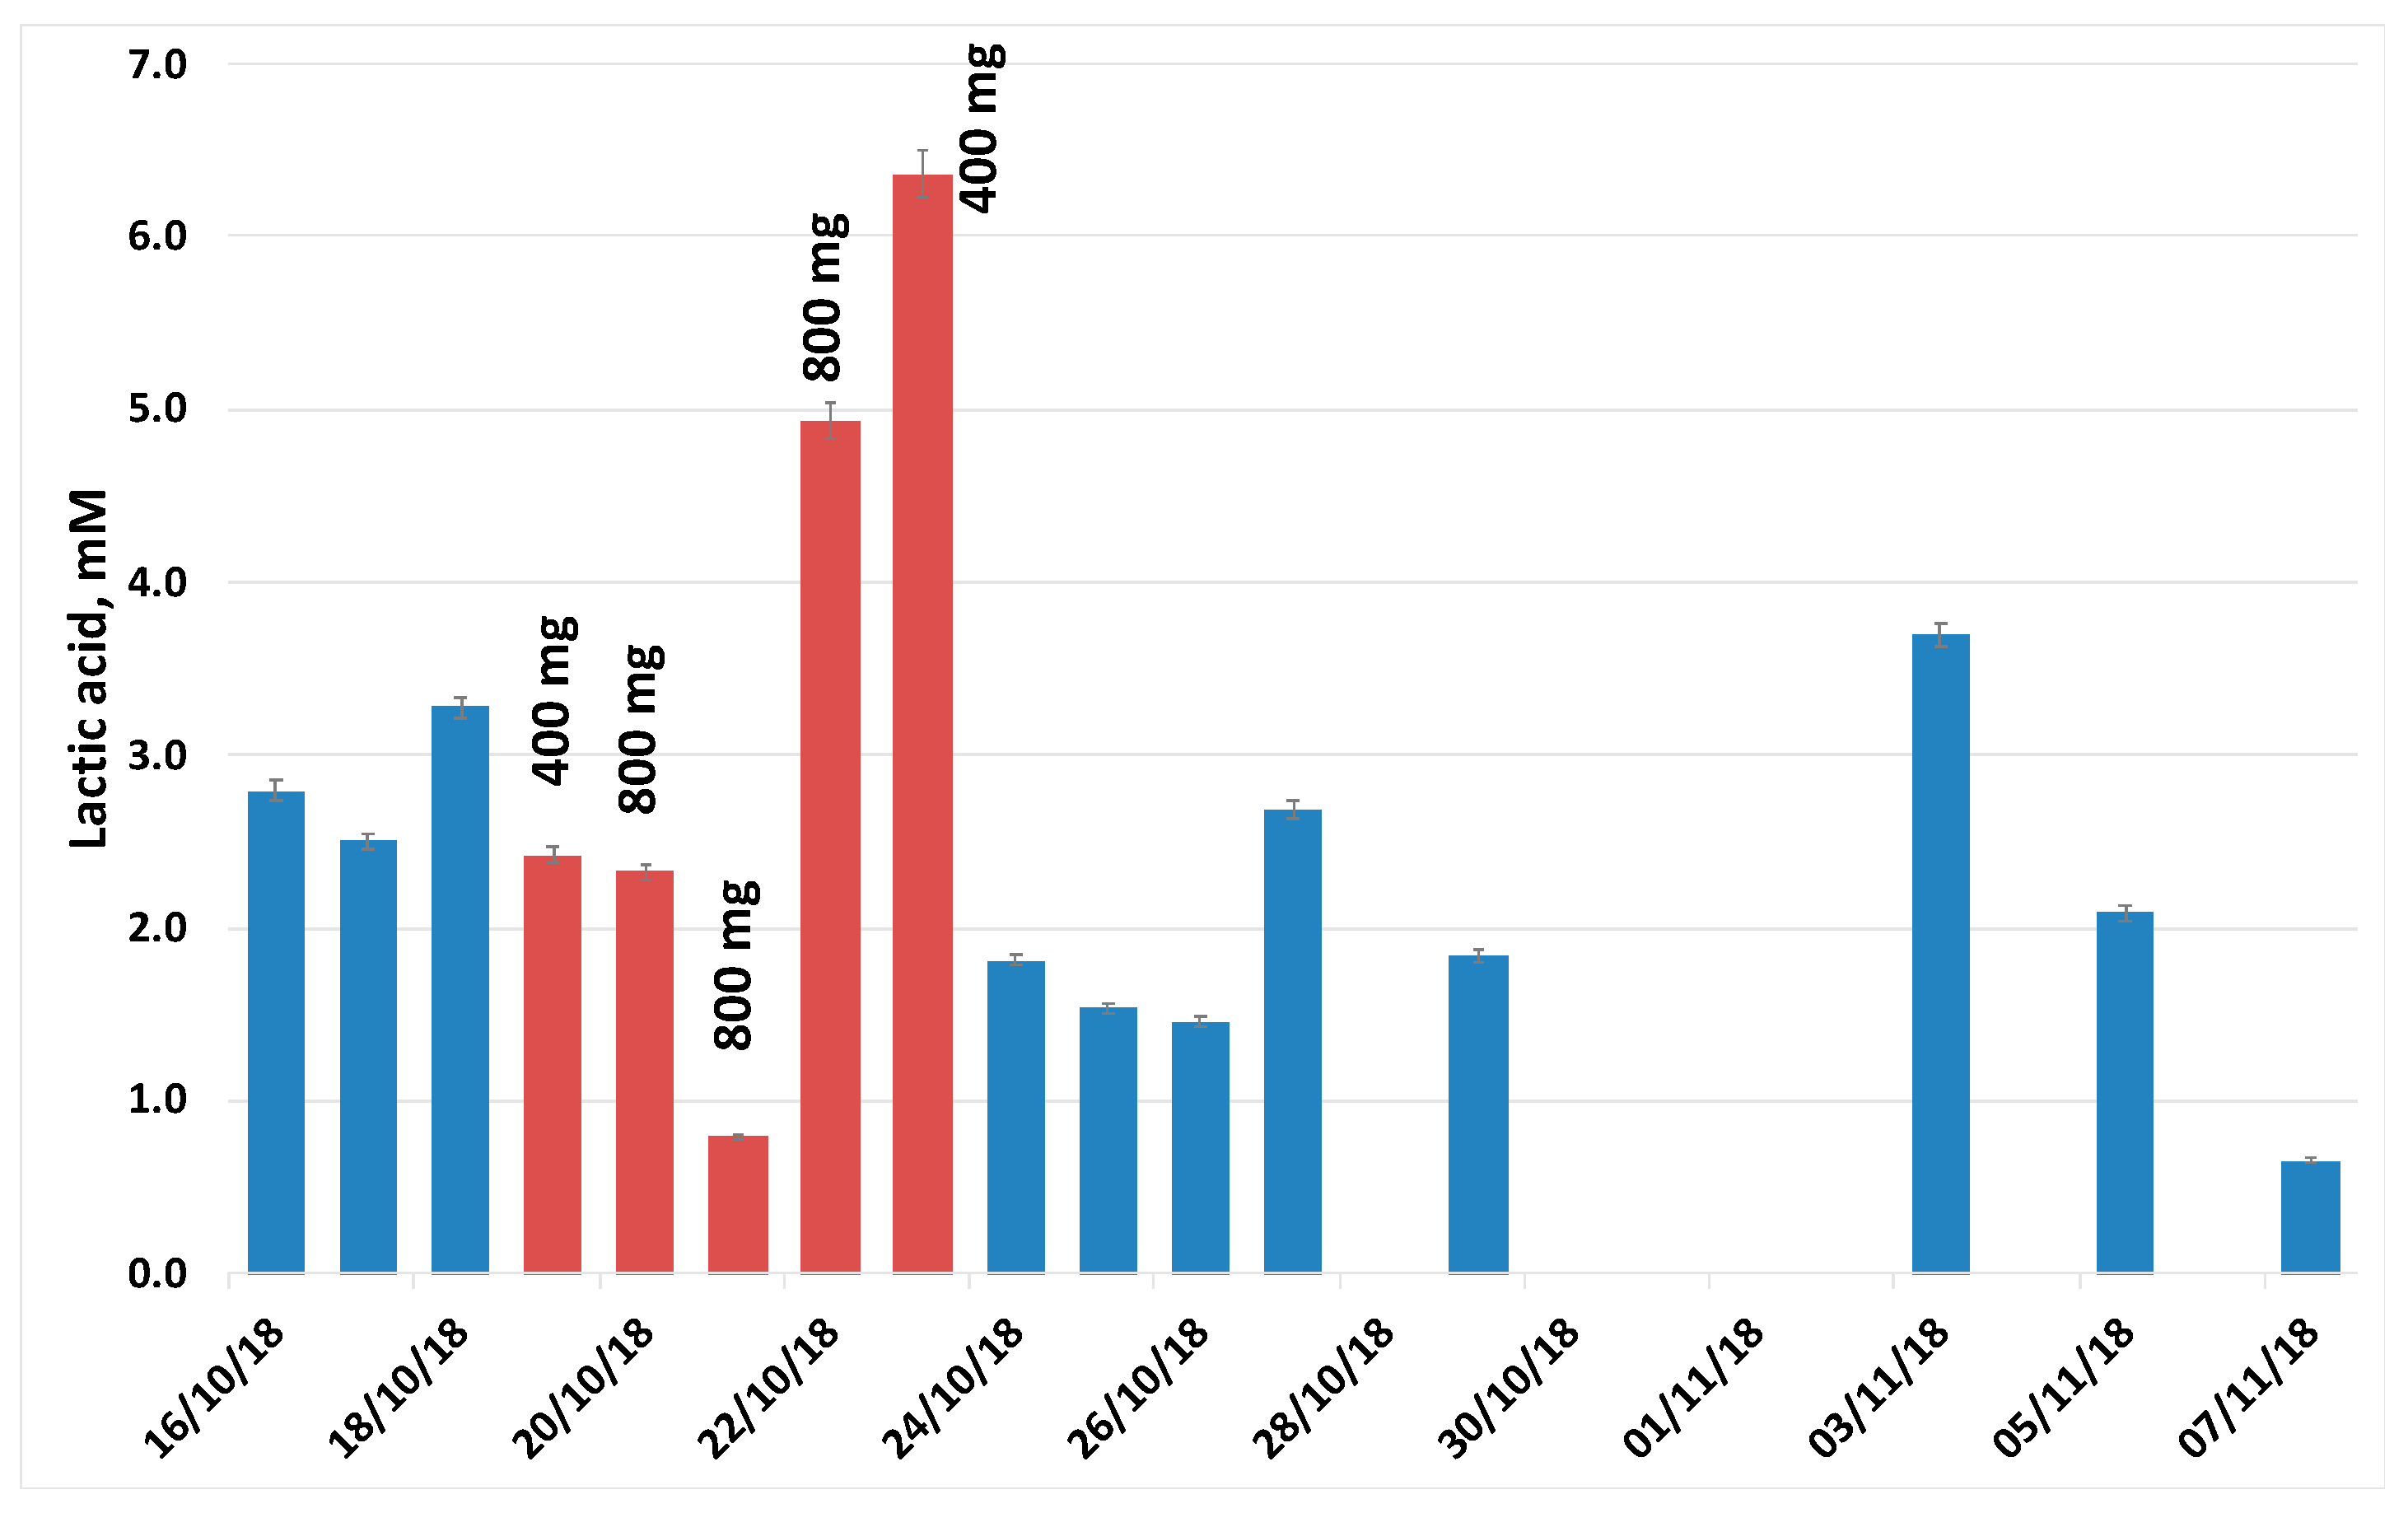
3.3. Metabolite Monitoring during Rifaximin Antibiotic Treatment
4. Conclusions
Supplementary Materials
Author Contributions
Funding
Acknowledgments
Conflicts of Interest
References
- Ponziani, F.R.; Scaldaferri, F.; Petito, V.; Sterbini, F.P.; Pecere, S.; Lopetuso, L.R.; Palladini, A.; Gerardi, V.; Masucci, L.; Pompili, M.; et al. The Role of Antibiotics in Gut Microbiota Modulation: The Eubiotic Effects of Rifaximin. Dig. Dis. 2016, 34, 269–278. [Google Scholar] [CrossRef]
- Olson, K.A.; Schell, J.C.; Rutter, J. Pyruvate and Metabolic Flexibility: Illuminating a Path Toward Selective Cancer Therapies. Trends Biochem. Sci. 2016, 41, 219–230. [Google Scholar] [CrossRef] [Green Version]
- Gibala, M.J.; Young, M.E.; Taegtmeyer, H. Anaplerosis of the citric acid cycle: Role in energy metabolism of heart and skeletal muscle. Acta Physiol. Scand. 2000, 168, 657–665. [Google Scholar] [CrossRef]
- Zheng, X.; Qiu, Y.; Zhong, W.; Baxter, S.; Su, M.; Li, Q.; Xie, G.; Ore, B.M.; Qiao, S.; Spencer, M.D.; et al. A targeted metabolomic protocol for short-chain fatty acids and branched-chain amino acids. Metabolomics 2013, 9, 818–827. [Google Scholar] [CrossRef] [Green Version]
- Tan, J.; McKenzie, C.; Potamitis, M.; Thorburn, A.N.; Mackay, C.R.; Macia, L. Chapter Three—The Role of Short-Chain Fatty Acids in Health and Disease; Frederick, W.A., Ed.; Academic Press: Cambridge, MA, USA, 2014; Volume 121, pp. 91–119. ISBN 0065-2776. [Google Scholar]
- Zeng, M.; Cao, H. Fast quantification of short chain fatty acids and ketone bodies by liquid chromatography-tandem mass spectrometry after facile derivatization coupled with liquid-liquid extraction. J. Chromatogr. B 2018, 1083, 137–145. [Google Scholar] [CrossRef]
- Ghimenti, S.; Tabucchi, S.; Lomonaco, T.; Di Francesco, F.; Fuoco, R.; Onor, M.; Lenzi, S.; Trivella, M.G. Monitoring breath during oral glucose tolerance tests. J. Breath Res. 2013, 7, 17115. [Google Scholar] [CrossRef]
- Biagini, D.; Lomonaco, T.; Ghimenti, S.; Bellagambi, F.G.; Onor, M.; Scali, M.C.; Barletta, V.; Marzilli, M.; Salvo, P.; Trivella, M.G.; et al. Determination of volatile organic compounds in exhaled breath of heart failure patients by needle trap micro-extraction coupled with gas chromatography-tandem mass spectrometry. J. Breath Res. 2017, 11, 47110. [Google Scholar] [CrossRef]
- Lomonaco, T.; Romani, A.; Ghimenti, S.; Biagini, D.; Bellagambi, F.G.; Onor, M.; Salvo, P.; Fuoco, R.; Di Francesco, F. Determination of carbonyl compounds in exhaled breath by on-sorbent derivatization coupled with thermal desorption and gas chromatography-tandem mass spectrometry. J. Breath Res. 2018, 12, 46004. [Google Scholar] [CrossRef] [PubMed]
- Hu, J.; Lin, S.; Zheng, B.; Cheung, P.C.K. Short-chain fatty acids in control of energy metabolism. Crit. Rev. Food Sci. Nutr. 2018, 58, 1243–1249. [Google Scholar] [CrossRef] [PubMed]
- Canfora, E.E.; Jocken, J.W.; Blaak, E.E. Short-chain fatty acids in control of body weight and insulin sensitivity. Nat. Rev. Endocrinol. 2015, 11, 577. [Google Scholar] [CrossRef] [PubMed]
- Koh, A.; De Vadder, F.; Kovatcheva-Datchary, P.; Bäckhed, F. From Dietary Fiber to Host Physiology: Short-Chain Fatty Acids as Key Bacterial Metabolites. Cell 2016, 165, 1332–1345. [Google Scholar] [CrossRef] [Green Version]
- Puchalska, P.; Crawford, P.A. Multi-dimensional Roles of Ketone Bodies in Fuel Metabolism, Signaling, and Therapeutics. Cell Metab. 2017, 25, 262–284. [Google Scholar] [CrossRef] [PubMed] [Green Version]
- Cotter, D.G.; Ercal, B.; Huang, X.; Leid, J.M.; D’Avignon, D.A.; Graham, M.J.; Dietzen, D.J.; Brunt, E.M.; Patti, G.J.; Crawford, P.A. Ketogenesis prevents diet-induced fatty liver injury and hyperglycemia. J. Clin. Investig. 2014, 124, 5175–5190. [Google Scholar] [CrossRef] [PubMed] [Green Version]
- Newman, J.C.; Verdin, E. Ketone bodies as signaling metabolites. Trends Endocrinol. Metab. 2014, 25, 42–52. [Google Scholar] [CrossRef] [PubMed] [Green Version]
- Pellegrini, D.; Onor, M.; Degano, I.; Bramanti, E. Development and validation of a novel derivatization method for the determination of lactate in urine and saliva by liquid chromatography with UV and fluorescence detection. Talanta 2014, 130. [Google Scholar] [CrossRef]
- Tsuruoka, M.; Hara, J.; Hirayama, A.; Sugimoto, M.; Soga, T.; Shankle, W.R.; Tomita, M. Capillary electrophoresis-mass spectrometry-based metabolome analysis of serum and saliva from neurodegenerative dementia patients. Electrophoresis 2013, 34, 2865–2872. [Google Scholar] [CrossRef]
- Wilkins, J.M.; Trushina, E. Application of Metabolomics in Alzheimer’s Disease. Front. Neurol. 2018, 8, 719. [Google Scholar] [CrossRef] [Green Version]
- Brennan, L. Metabolomics in nutrition research: Current status and perspectives. Biochem. Soc. Trans. 2013, 41, 670–673. [Google Scholar] [CrossRef]
- Gika, H.G.; Zisi, C.; Theodoridis, G.; Wilson, I.D. Protocol for quality control in metabolic profiling of biological fluids by U(H)PLC-MS. J. Chromatogr. B 2016, 1008, 15–25. [Google Scholar] [CrossRef]
- Theodoridis, G.A.; Gika, H.G.; Want, E.J.; Wilson, I.D. Liquid chromatography–mass spectrometry based global metabolite profiling: A review. Anal. Chim. Acta 2012, 711, 7–16. [Google Scholar] [CrossRef]
- Ferreira, A.M.C.; Laespada, M.E.F.; Pavón, J.L.P.; Cordero, B.M. In situ aqueous derivatization as sample preparation technique for gas chromatographic determinations. J. Chromatogr. A 2013, 1296, 70–83. [Google Scholar] [CrossRef] [PubMed]
- De Baere, S.; Eeckhaut, V.; Steppe, M.; De Maesschalck, C.; De Backer, P.; Van Immerseel, F.; Croubels, S. Development of a HPLC–UV method for the quantitative determination of four short-chain fatty acids and lactic acid produced by intestinal bacteria during in vitro fermentation. J. Pharm. Biomed. Anal. 2013, 80, 107–115. [Google Scholar] [CrossRef] [PubMed]
- Ewaschuk, J.B.; Zello, G.A.; Naylor, J.M.; Brocks, D.R. Metabolic acidosis: Separation methods and biological relevance of organic acids and lactic acid enantiomers. J. Chromatogr. B 2002, 781, 39–56. [Google Scholar] [CrossRef]
- Kotani, A.; Miyaguchi, Y.; Kohama, M.; Ohtsuka, T.; Shiratori, T.; Kusu, F. Determination of short-chain fatty acids in rat and human feces by high-performance liquid chromatography with electrochemical detection. Anal. Sci. 2009, 25, 1007–1011. [Google Scholar] [CrossRef] [PubMed] [Green Version]
- Mochizuki, Y.; Inagaki, S.; Suzuki, M.; Min, J.Z.; Inoue, K.; Todoroki, K.; Toyo’Oka, T. A novel derivatization reagent possessing a bromoquinolinium structure for biological carboxylic acids in HPLC-ESI-MS/MS. J. Sep. Sci. 2013. [Google Scholar] [CrossRef]
- Marquis, B.J.; Louks, H.P.; Bose, C.; Wolfe, R.R.; Singh, S.P. A New Derivatization Reagent for HPLC-MS Analysis of Biological Organic Acids. Chromatographia 2017, 80, 1723–1732. [Google Scholar] [CrossRef] [Green Version]
- Guo, X.F.; Li, Y.; Wang, H.; Zhang, H.S. Determination of fatty acids in saliva of smokers and nonsmokers by HPLC with fluorescence detection using a hydrazine-based difluoro-boraindacene reagent. Chromatographia 2014. [Google Scholar] [CrossRef]
- Mukherjee, P.S.; Karnes, H.T. Ultraviolet and fluorescence derivatization reagents for carboxylic acids suitable for high performance liquid chromatography: A review. Biomed. Chromatogr. 1996, 10, 193–204. [Google Scholar] [CrossRef]
- Kubota, K.; Fukushima, T.; Yuji, R.; Miyano, H.; Hirayama, K.; Santa, T.; Imai, K. Development of an HPLC-fluorescence determination method for carboxylic acids related to the tricarboxylic acid cycle as a metabolome tool. Biomed. Chromatogr. 2005, 19, 788–795. [Google Scholar] [CrossRef]
- Johnson, D.W. Contemporary clinical usage of LC/MS: Analysis of biologically important carboxylic acids. Clin. Biochem. 2005, 38, 351–361. [Google Scholar] [CrossRef]
- Gikas, E.; Derventi, M.; Panderi, I.; Vavayannis, A.; Kazanis, M.; Parissi-Poulou, M. A new fluorogenic reagent for labelling carboxylic acids in HPLC. J. Liq. Chromatogr. Relat. Technol. 2002, 25, 381–395. [Google Scholar] [CrossRef]
- Kiefer, P.; Delmotte, N.; Vorholt, J.A. Nanoscale Ion-Pair Reversed-Phase HPLC−MS for Sensitive Metabolome Analysis. Anal. Chem. 2011, 83, 850–855. [Google Scholar] [CrossRef] [PubMed] [Green Version]
- Buescher, J.M.; Moco, S.; Sauer, U.; Zamboni, N. Ultrahigh Performance Liquid Chromatography−Tandem Mass Spectrometry Method for Fast and Robust Quantification of Anionic and Aromatic Metabolites. Anal. Chem. 2010, 82, 4403–4412. [Google Scholar] [CrossRef] [PubMed]
- Lu, W.; Clasquin, M.F.; Melamud, E.; Amador-Noguez, D.; Caudy, A.A.; Rabinowitz, J.D. Metabolomic Analysis via Reversed-Phase Ion-Pairing Liquid Chromatography Coupled to a Stand Alone Orbitrap Mass Spectrometer. Anal. Chem. 2010, 82, 3212–3221. [Google Scholar] [CrossRef] [Green Version]
- Kemmei, T.; Kodama, S.; Yamamoto, A.; Inoue, Y.; Hayakawa, K. Reversed phase liquid chromatographic determination of organic acids using on-line complexation with copper(II) ion. Anal. Chim. Acta 2015, 886, 194–199. [Google Scholar] [CrossRef]
- Marcé, R.M.; Calull, M.; Manchobas, R.M.; Borrull, F.; Rius, F.X. An optimized direct method for the determination of carboxylic acids in beverages by HPLC. Chromatographia 1990, 29, 54–58. [Google Scholar] [CrossRef]
- Tusseau, D.; Benoit, C. Routine high-performance liquid chromatographic determination of carboxylic acids in wines and champagne. J. Chromatogr. A 1987, 395, 323–333. [Google Scholar] [CrossRef]
- Scherer, R.; Rybka, A.C.P.; Ballus, C.A.; Meinhart, A.D.; Filho, J.T.; Godoy, H.T. Validation of a HPLC method for simultaneous determination of main organic acids in fruits and juices. Food Chem. 2012, 135, 150–154. [Google Scholar] [CrossRef] [Green Version]
- de Quirós, A.R.-B.; Lage-Yusty, M.A.; López-Hernández, J. HPLC analysis of organic acids using a novel stationary phase. Talanta 2009, 78, 643–646. [Google Scholar] [CrossRef]
- Pereira, V.; Câmara, J.S.; Cacho, J.; Marques, J.C. HPLC-DAD methodology for the quantification of organic acids, furans and polyphenols by direct injection of wine samples. J. Sep. Sci. 2010, 33, 1204–1215. [Google Scholar] [CrossRef] [Green Version]
- Shui, G.; Leong, L.P. Separation and determination of organic acids and phenolic compounds in fruit juices and drinks by high-performance liquid chromatography. J. Chromatogr. A 2002, 977, 89–96. [Google Scholar] [CrossRef]
- Zong, Y.; Lin, J.; Xu, H.; Jia, Z.; Yang, X.; Choi, M.M.F. Optimization and validation of an HPLC-photodiode array detector method for determination of organic acids in vinegar. J. AOAC Int. 2015, 98, 422–430. [Google Scholar] [CrossRef] [PubMed]
- Suarez-Luque, S.; Mato, I.; Huidobro, J.F.; Simal-Lozano, J.; Sancho, M.T. Rapid determination of minority organic acids in honey by high-performance liquid chromatography. J. Chromatogr. A 2002, 955, 207–214. [Google Scholar] [CrossRef]
- Edelkraut, F.; Brockmann, U. Simulataneous determination of carboxylic acids and carbonyl compounds in estuaries by HPLC. Chromatographia 1990, 30, 432–435. [Google Scholar] [CrossRef]
- Liang, Q.; Liu, H.; Li, X.; Zhang, A.H. High-throughput metabolomics analysis discovers salivary biomarkers for predicting mild cognitive impairment and Alzheimer′s disease. RSC Adv. 2016, 6, 75499–75504. [Google Scholar] [CrossRef]
- Torii, T.; Kanemitsu, K.; Wada, T.; Itoh, S.; Kinugawa, K.; Hagiwara, A. Measurement of short-chain fatty acids in human faeces using high-performance liquid chromatography: Specimen stability. Ann. Clin. Biochem. 2010, 47, 447–452. [Google Scholar] [CrossRef]
- Tsuchiya, H.; Hashizume, I.; Tokunaga, T.; Tatsumi, M.; Takagi, N.; Hayashi, T. High-performance liquid chromatography of α-keto acids in human saliva. Arch. Oral Biol. 1983. [Google Scholar] [CrossRef]
- Tsutsui, H.; Mochizuki, T.; Maeda, T.; Noge, I.; Kitagawa, Y.; Min, J.Z.; Todoroki, K.; Inoue, K.; Toyo, T. Simultaneous determination of DL-lactic acid and DL-3-hydroxybutyric acid enantiomers in saliva of diabetes mellitus patients by high-throughput LC-ESI-MS/MS. Anal. Bioanal. Chem. 2012. [Google Scholar] [CrossRef]
- Stein, J.; Kulemeier, J.; Lembcke, B.; Caspary, W.F. Simple and rapid method for determination of short-chain fatty acids in biological materials by high-performance liquid chromatography with ultraviolet detection. J. Chromatogr. 1992, 576, 53–61. [Google Scholar] [CrossRef]
- Park, Y.D.; Jang, J.H.; Oh, Y.J.; Kwon, H.J. Analyses of organic acids and inorganic anions and their relationship in human saliva before and after glucose intake. Arch. Oral Biol. 2014, 59, 1–11. [Google Scholar] [CrossRef]
- Beighton, D.; Brailsford, S.R.; Gilbert, S.C.; Clark, D.T.; Rao, S.; Wilkins, J.C.; Tarelli, E.; Homer, K.A. Intra-Oral Acid Production Associated with Eating Whole or Pulped Raw Fruits. Caries Res. 2004, 38, 341–349. [Google Scholar] [CrossRef] [PubMed]
- Lima, D.P.; Diniz, D.G.; Moimaz, S.A.S.; Sumida, D.H.; Okamoto, A.C. Saliva: Reflection of the body. Int. J. Infect. Dis. 2010, 14, e184–e188. [Google Scholar] [CrossRef] [PubMed] [Green Version]
- Khurshid, Z.; Zohaib, S.; Najeeb, S.; Zafar, M.S.; Slowey, P.D.; Almas, K. Human Saliva Collection Devices for Proteomics: An Update. Int. J. Mol. Sci. 2016, 17, 846. [Google Scholar] [CrossRef] [PubMed] [Green Version]
- Dame, Z.T.; Aziat, F.; Mandal, R.; Krishnamurthy, R.; Bouatra, S.; Borzouie, S.; Guo, A.C.; Sajed, T.; Deng, L.; Lin, H.; et al. The human saliva metabolome. Metabolomics 2015, 11, 1864–1883. [Google Scholar] [CrossRef]
- Cuevas-Cordoba, B.; Santiago-Garcia, J. Saliva: A Fluid of Study for OMICS. Omi. J. Integr. Biol. 2014, 18, 87–97. [Google Scholar] [CrossRef] [PubMed]
- Michalke, B.; Rossbach, B.; Göen, T.; Schäferhenrich, A.; Scherer, G.; Hartwig, A.; MAK Commission. Saliva as a matrix for human biomonitoring in occupational and environmental medicine [Biomonitoring Methods, 2015]. MAK Collect. Occup. Health Saf. 2016. [Google Scholar] [CrossRef]
- Biagi, S.; Ghimenti, S.; Onor, M.; Bramanti, E. Simultaneous determination of lactate and pyruvate in human sweat using reversed-phase high-performance liquid chromatography: A noninvasive approach. Biomed. Chromatogr. 2012. [Google Scholar] [CrossRef]
- Bessonneau, V.; Boyaci, E.; Maciazek-Jurczyk, M.; Pawliszyn, J. In vivo solid phase microextraction sampling of human saliva for non-invasive and on-site monitoring. Anal. Chim. Acta 2015, 856, 35–45. [Google Scholar] [CrossRef]
- Bonne, N.J.; Wong, D.T.W. Salivary biomarker development using genomic, proteomic and metabolomic approaches. Genome Med. 2012, 4. [Google Scholar] [CrossRef]
- Lomonaco, T.; Ghimenti, S.; Piga, I.; Biagini, D.; Onor, M.; Fuoco, R.; Di Francesco, F. Influence of Sampling on the Determination of Warfarin and Warfarin Alcohols in Oral Fluid. PLoS ONE 2014, 9. [Google Scholar] [CrossRef] [Green Version]
- Lomonaco, T.; Ghimenti, S.; Biagini, D.; Bramanti, E.; Onor, M.; Bellagambi, F.G.; Fuoco, R.; Di Francesco, F. The effect of sampling procedures on the urate and lactate concentration in oral fluid. Microchem. J. 2018. [Google Scholar] [CrossRef]
- Beger, R.D.; Dunn, W.; Schmidt, M.A.; Gross, S.S.; Kirwan, J.A.; Cascante, M.; Brennan, L.; Wishart, D.S.; Oresic, M.; Hankemeier, T.; et al. Metabolomics enables precision medicine: “A White Paper, Community Perspective”. Metabolomics 2016, 12, 149. [Google Scholar] [CrossRef] [PubMed] [Green Version]
- Malkar, A.; Devenport, N.A.; Martin, H.J.; Patel, P.; Turner, M.A.; Watson, P.; Maughan, R.J.; Reid, H.J.; Sharp, B.L.; Thomas, C.L.P.; et al. Metabolic profiling of human saliva before and after induced physiological stress by ultra-high performance liquid chromatography-ion mobility-mass spectrometry. Metabolomics 2013, 9, 1192–1201. [Google Scholar] [CrossRef] [Green Version]
- Rangel-Huerta, O.D.; Pastor-Villaescusa, B.; Gil, A. Are we close to defining a metabolomic signature of human obesity? A systematic review of metabolomics studies. Metabolomics 2019, 15, 93. [Google Scholar] [CrossRef] [PubMed] [Green Version]
- Zhang, Z.; Hong, Y.; Chen, M.; Tan, N.; Liu, S.; Nie, X.; Zhou, W. Serum metabolomics reveals metabolic profiling for women with hyperandrogenism and insulin resistance in polycystic ovary syndrome. Metabolomics 2020, 16, 20. [Google Scholar] [CrossRef]
- Campanella, B.; Onor, M.; Lomonaco, T.; Benedetti, E.; Bramanti, E. HS-SPME-GC-MS approach for the analysis of volatile salivary metabolites and application in a case study for the indirect assessment of gut microbiota. Anal. Bioanal. Chem. 2019. [Google Scholar] [CrossRef] [PubMed]
- Ponziani, F.R.; Pompili, M.; Gasbarrini, A. Rifaximin Re-treatment in Patients with Irritable Bowel Syndrome: Feels Like the First Time? Dig. Dis. Sci. 2017, 62, 2220–2222. [Google Scholar] [CrossRef]
- Ponziani, F.R.; Pecere, S.; Lopetuso, L.; Scaldaferri, F.; Cammarota, G.; Gasbarrini, A. Rifaximin for the treatment of irritable bowel syndrome—A drug safety evaluation. Expert Opin. Drug Saf. 2016, 15, 983–991. [Google Scholar] [CrossRef]
- Ponziani, F.R.; Gerardi, V.; Pecere, S.; D’Aversa, F.; Lopetuso, L.; Zocco, M.A.; Pompili, M.; Gasbarrini, A. Effect of rifaximin on gut microbiota composition in advanced liver disease and its complications. World J. Gastroenterol. 2015, 21, 12322–12333. [Google Scholar] [CrossRef]
- Navazesh, M. Methods for Collecting Saliva. Ann. N. Y. Acad. Sci. 1993. [Google Scholar] [CrossRef]
- Goodson, J.M.; Kantarci, A.; Hartman, M.-L.; Denis, G.V.; Stephens, D.; Hasturk, H.; Yaskell, T.; Vargas, J.; Wang, X.; Cugini, M.; et al. Metabolic Disease Risk in Children by Salivary Biomarker Analysis. PLoS ONE 2014, 9, e98799. [Google Scholar] [CrossRef] [PubMed]
- Variuos Authors. Validation of Analytical Procedures: Text and Methodology Q2(R1). In Proceedings of the International Conference on Harmonisation of Technical Requirements for Registration of Pharmaceuticals for Human Use, Geneva, Switzerland, 25–27 April 2005; ICH Harmonised Tripartite Guideline. 2005; pp. 1–13. Available online: https://database.ich.org/sites/default/files/Q2_R1__Guideline.pdf (accessed on 17 August 2020).
- Silwood, C.J.L.; Lynch, E.; Claxson, A.W.D.; Grootveld, M.C. 1H and (13)C NMR spectroscopic analysis of human saliva. J. Dent. Res. 2002, 81, 422–427. [Google Scholar] [CrossRef] [PubMed]
- Sugimoto, M.; Saruta, J.; Matsuki, C.; To, M.; Onuma, H.; Kaneko, M.; Soga, T.; Tomita, M.; Tsukinoki, K. Physiological and environmental parameters associated with mass spectrometry-based salivary metabolomic profiles. Metabolomics 2013, 9, 454–463. [Google Scholar] [CrossRef]
- Figueira, J.; Gouveia-Figueira, S.; Öhman, C.; Lif Holgerson, P.; Nording, M.L.; Öhman, A. Metabolite quantification by NMR and LC-MS/MS reveals differences between unstimulated, stimulated, and pure parotid saliva. J. Pharm. Biomed. Anal. 2017, 140, 295–300. [Google Scholar] [CrossRef] [PubMed]
- Takeda, I.; Stretch, C.; Barnaby, P.; Bhatnager, K.; Rankin, K.; Fu, H.; Weljie, A.; Jha, N.; Slupsky, C. Understanding the human salivary metabolome. NMR Biomed. 2009, 22, 577–584. [Google Scholar] [CrossRef] [PubMed]
- Nakamura, Y.; Kodama, H.; Satoh, T.; Adachi, K.; Watanabe, S.; Yokote, Y.; Sakagami, H. Diurnal Changes in Salivary Amino Acid Concentrations. Vivo Brooklyn 2010, 24, 837–842. [Google Scholar]
- Kochanska, B.; Smolenski, R.T.; Knap, N. Determination of adenine nucleotides and their metabolites in human saliva. Acta Biochim. Pol. 2000, 47, 877–879. [Google Scholar] [CrossRef] [Green Version]
- Riis, J.L.; Bryce, C.I.; Matin, M.J.; Stebbins, J.L.; Kornienko, O.; van Huisstede, L.; Granger, D.A. The validity, stability, and utility of measuring uric acid in saliva. Biomark. Med. 2018, 12, 583–596. [Google Scholar] [CrossRef]
- Choi, S.W.; Lam, D.M.H. A little less conversation. Anaesthesia 2016, 71, 1482–1487. [Google Scholar] [CrossRef]
- Wishart, D.S.; Feunang, Y.D.; Marcu, A.; Guo, A.C.; Liang, K.; Vazquez-Fresno, R.; Sajed, T.; Johnson, D.; Li, C.; Karu, N.; et al. HMDB 4.0: The human metabolome database for 2018. Nucleic Acids Res. 2018, 46, D608–D617. [Google Scholar] [CrossRef]
- Carlsson, G.; Odin, E.; Gustavsson, B.; Wettergren, Y. Pretherapeutic uracil and dihydrouracil levels in saliva of colorectal cancer patients are associated with toxicity during adjuvant 5-fluorouracil-based chemotherapy. CANCER Chemother. Pharmacol. 2014, 74, 757–763. [Google Scholar] [CrossRef] [PubMed]
- Andrade Galarza, A.F.; Linden, R.; Antunes, M.V.; Hahn, R.Z.; Raymundo, S.; da Silva, A.C.; Staggemeier, R.; Spilki, F.R.; Schwartsmann, G. Endogenous plasma and salivary uracil to dihydrouracil ratios and DPYD genotyping as predictors of severe fluoropyrimidine toxicity in patients with gastrointestinal malignancies. Clin. Biochem. 2016, 49, 1221–1226. [Google Scholar] [CrossRef] [PubMed]
- Antunes, M.V.; Raymundo, S.; Cezimbra da Silva, A.C.; Muller, V.V.; Vicente Neto, O.J.; Schwartsmann, G.; Linden, R. Determination of Endogenous Concentrations of Uracil and Dihydrouracil in Dried Saliva Spots by LC-MS/MS. Ther. Drug Monit. 2019, 41, 383–390. [Google Scholar] [CrossRef] [PubMed]
- van Eijk, H.M.H.; Bloemen, J.G.; Dejong, C.H.C. Application of liquid chromatography–mass spectrometry to measure short chain fatty acids in blood. J. Chromatogr. B 2009, 877, 719–724. [Google Scholar] [CrossRef] [PubMed]
- Biagini, D.; Lomonaco, T.; Ghimenti, S.; Fusi, J.; Cerri, E.; De Angelis, F.; Bellagambi, F.G.; Oger, C.; Galano, J.M.; Bramanti, E.; et al. Saliva as a non-invasive tool for monitoring oxidative stress in swimmers athletes performing a VO2max cycle ergometer test. Talanta 2020, 216, 120979. [Google Scholar] [CrossRef]
- Kim, S.; Chen, J.; Cheng, T.; Gindulyte, A.; He, J.; He, S.; Li, Q.; Shoemaker, B.A.; Thiessen, P.A.; Yu, B.; et al. PubChem 2019 update: Improved access to chemical data. Nucleic Acids Res. 2019, 47, D1102–D1109. [Google Scholar] [CrossRef] [Green Version]
- Panek, M.; Paljetak, H.C.; Baresic, A.; Peric, M.; Matijasic, M.; Lojkic, I.; Bender, D.V.; Krznaric, Z.; Verbanac, D. Methodology challenges in studying human gut microbiota—Effects of collection, storage, DNA extraction and next generation sequencing technologies. Sci. Rep. 2018, 8. [Google Scholar] [CrossRef] [Green Version]
- Zmora, N.; Zilberman-Schapira, G.; Suez, J.; Mor, U.; Dori-Bachash, M.; Bashiardes, S.; Kotler, E.; Zur, M.; Regev-Lehavi, D.; Brik, R.B.-Z.; et al. Personalized Gut Mucosal Colonization Resistance to Empiric Probiotics Is Associated with Unique Host and Microbiome Features. Cell 2018, 174, 1388–1405.e21. [Google Scholar] [CrossRef] [Green Version]


| Saliva Sample | Sex | yrs | Code | Annotations |
|---|---|---|---|---|
| 1 | F | 51 | E_030419 | Single saliva sample |
| 2 | F | 51 | E_230319 | Single saliva sample |
| 3 | F | 51 | E_310119 | Single saliva sample |
| 4 | M | 28 | RN | 3 saliva samples collected in 3 days consecutively |
| 4pool | M | 28 | RN | Pool of 3 saliva samples collected in 3 days consecutively |
| 5 | M | 48 | FZ | 3 saliva samples collected in 3 days consecutively |
| 6 | F | 34 | LP | 3 saliva samples collected in 3 days consecutively |
| 7 | F | 26 | BC | Single saliva sample |
| 8 | F | 60 | CM | Single saliva sample |
| 9 | F | 51 | EB_030319 | Single saliva sample |
| 10 | F | 50 | EB_060119 | Single saliva sample |
| 11 | F | 51 | EB_090719 | Single saliva sample |
| 12 | F | 51 | EB_290819 | Single saliva sample |
| 13 | F | 51 | EB_030519 | Single saliva sample |
| R1-R16 | F | 50 | Rifaximin study | 16 saliva sample collected in 16 days consecutively |
| Metabolite | TR (min) | Slope (mM−1) | Intercept | R2 | Concfound in Saliva (mM) | Recovery (%) |
|---|---|---|---|---|---|---|
| Creatinine | 3.603 | 8633 | 7.9 | 0.9999 | 0.005 ± 0.002 | 101.7 |
| Formic acid | 3.736 | 63 | 2 | 0.9974 | 0.169 ± 0.020 | 99.8 |
| Malic acid | 4.015 | 173 | 528.7 | 0.9999 | 16.4 ± 0.020 | 106.3 |
| Pyruvic acid | 4.240 | 1164 | 0 | 0.9999 | <LOD | 121.3 |
| VAL | 4.362 | 64 | 0 | 0.9899 | <LOD | 97.0 |
| Lactic acid | 4.648–4.802 | 111 | 3.8 | 0.9985 | 0.190 ± 0.020 | 100.6 |
| Acetic acid | 4.954 | 39 | 15.4 | 0.9673 | 2.270 ± 0.100 | 85.5 |
| Uric acid | 5.341 | 13,320 | 810 | 0.987 | 0.322 ± 0.020 | 104.3 |
| Citric acid | 5.510 | 412 | 0 | 0.9999 | <LOD | 119.3 |
| GSH | 5.950 | 1445 | 0 | 0.9999 | <LOD | 69.7 |
| Fumaric acid | 6.170 | 23,793 | 5.25 | 0.9999 | 0.0011 ± 0.001 | 113.6 |
| Succinic acid | 6.756 | 96 | 7.82 | 0.9981 | 0.4247 ± 0.030 | 108.8 |
| Acetoacetic acid | 7.040 | 70 | 0 | 0.9999 | < LOD | 99.4 |
| Tyrosine | 7.504 | 18,408 | 40.7 | 0.9996 | 0.0115 ± 0.010 | 110.1 |
| GSSG | 8.167 | 7214 | 0 | 0.9999 | <LOD | 133.5 |
| Propionic acid | 10.25 | 49 | 1.7 | 0.9975 | 0.1979 ± 0.020 | 95.2 |
| Phenylalanine | 17.547 | 3642 | 6.24 | 0.9999 | 0.0089 ± 0.001 | 109.4 |
| Butyric acid | 22.838 | 67 ± 7 | 4.9 ± 2.7 | 0.981 | 0.370 ± 0.040 | 101 |
| Tryptophane | 23.392 | 70,892 | 34.6 | 0.9999 | 0.0025 ± 0.002 | 110.8 |
| N. Missing Values | Min | Max | Mean | SD (n−1) | Median | IQR | Literature Value (μM) | |
|---|---|---|---|---|---|---|---|---|
| Creatinine | 0 | 2.3 | 70.9 | 22.7 | 22.6 | 10.0 | 23.4 | 2- > 10 [74] 5 ± 3 [55] 6.5 ± 2 [17,75] 18–37 [76] |
| Formic acid | 0 | 137.3 | 4687.8 | 1466.4 | 1442.8 | 1066.1 | 1420.6 | 7–244 [77] 600 ± 750 [51] |
| Malic acid | 0 | 7290.1 | 57,645.1 | 24,038.7 | 13,731.4 | 23,367.3 | 19,916.7 | 6 ± 3 [55] 20 ± 11 [75] 20.45 ± 10.87 [17] |
| VAL | 2 | 9.8 | 8303.0 | 2327.9 | 2452.0 | 2118.7 | 3326.6 | 16.2 ± 12.3 [78] 48 ± 34 [55] 4 ± 2 [75] |
| Lactic acid | 0 | 190.0 | 8040.9 | 2467.7 | 2470.2 | 1637.9 | 2462.1 | 527 ± 690 [55] 511 ± 612 [75] 73–208 [76] |
| Acetic acid | 0 | 14.1 | 22,898.6 | 4265.0 | 5968.6 | 2163.0 | 2279.3 | 6815 ± 4311 [55] 1000–1500 [52] 1200–3261 [76] |
| α-ketoglutaric | 9 | 4.1 | 65.9 | 23.5 | 24.8 | 11.9 | 19.1 | 5.27 ± 3.61 [75] |
| uric acid | 0 | 95.6 | 358.9 | 209.9 | 82.5 | 216.5 | 122.0 | 184 ± 22 [79] 179 ± 84 [80] |
| Citric acid | 11 | 139.4 | 289.9 | 214.6 | 75.2 | 214.6 | 75.2 | 29 ± 10 [55] 18 (1–338) [75] |
| GSH | 10 | 32.8 | 44.1 | 37.0 | 5.1 | 34.0 | 5.7 | 7 ± 6 [55] |
| Fumaric acid | 0 | 1.1 | 85.7 | 18.2 | 26.8 | 7.4 | 10.2 | 2 ± 0.7 [55] 1 ± 0.5 [75] |
| cis-aconitic acid | 9 | 0.7 | 25.9 | 7.4 | 10.7 | 1.5 | 6.5 | 3 ± 1 [17,75] |
| Succinic acid | 3 | 51.1 | 4755.7 | 946.9 | 1341.0 | 345.9 | 928.5 | 125 ± 181 [55] 2260 (60–4460) [75] 8–21 [76] |
| Acetoacetic acid | 10 | 164.3 | 823.8 | 593.7 | 303.9 | 792.9 | 329.8 | 10.7 ± 4.33 [55] |
| TYR | 0 | 3.6 | 81.0 | 26.1 | 23.9 | 11.5 | 32.9 | 40 ± 25 [55] 36 ± 15 [75] |
| GSSG | 5 | 6.6 | 56.2 | 18.4 | 16.3 | 9.4 | 14.1 | 0.9 ± 0.4 [17] |
| Propionic acid | 0 | 12.7 | 6990.2 | 1018.5 | 1797.4 | 333.3 | 1078.5 | 1412 ± 1090 [55] 1180 ± 1270 [75] 6.5–338 [76] |
| PHE | 0 | 0.2 | 233.0 | 41.8 | 59.9 | 14.3 | 32.6 | 44 ± 23 [55] 18 (1–112) [75] |
| Butyric acid | 0 | 9.8 | 13,621.2 | 2916.8 | 3635.7 | 2189.4 | 4171.7 | 277 ± 199 [55] 1470 (0–2940) [75] |
| TRP | 0 | 0.5 | 16.2 | 6.2 | 5.5 | 2.7 | 9.1 | 4.8 ± 3 [55] 0.5 ± 0.5 [75] |
| Min | Max | Mean | SD (n−1) | CV% (n−1) | Median | IQR | |
|---|---|---|---|---|---|---|---|
| Creatinine (basal) | 2.9 | 7.1 | 4.7 | 2.1 | 46.2 | 3.9 | 2.1 |
| During rifaximin | 3.7 | 6.6 | 4.7 | 1.1 | 23.3 | 4.6 | 0.6 |
| After rifaximin | 4.0 | 5.9 | 4.8 | 0.7 | 14.2 | 4.7 | 1.1 |
| Formic acid (basal) | 206.3 | 317.5 | 254.0 | 57.2 | 22.5 | 238.1 | 55.6 |
| During rifaximin | 39.7 | 214.3 | 131.7 | 73.9 | 56.1 | 150.8 | 111.1 |
| After rifaximin | 35.7 | 198.4 | 112.5 | 62.7 | 55.7 | 107.1 | 85.5 |
| Malic acid (basal) | 24736.1 | 26234.6 | 25426.5 | 756.1 | 3.0 | 25308.6 | 749.2 |
| During rifaximin | 13765.4 | 42098.8 | 23364.2 | 10861.2 | 46.5 | 20648.1 | 1234.6 |
| After rifaximin | 13688.3 | 29876.5 | 18776.2 | 5416.4 | 28.8 | 16354.9 | 6159.7 |
| VAL (basal) | 833.3 | 1136.4 | 1,007.6 | 156.5 | 15.5 | 1053.0 | 151.5 |
| During rifaximin | 818.2 | 5,401.5 | 2,195.5 | 1941.1 | 88.4 | 1166.7 | 1742.4 |
| After rifaximin | 818.2 | 3,712.1 | 1,747.2 | 993.2 | 56.8 | 1284.1 | 1075.8 |
| Lactic acid (basal) | 2500.0 | 3272.7 | 2856.1 | 389.9 | 13.7 | 2795.5 | 386.4 |
| During rifaximin | 790.9 | 6363.6 | 3367.3 | 2239.5 | 66.5 | 2422.7 | 2613.6 |
| After rifaximin | 650.0 | 3695.5 | 1969.3 | 905.2 | 46.0 | 1825.0 | 719.3 |
| Acetic acid (basal) | 1847.8 | 2717.4 | 2235.5 | 442.4 | 19.8 | 2141.3 | 434.8 |
| During rifaximin | 847.8 | 3815.2 | 1997.8 | 1103.1 | 55.2 | 1728.3 | 423.9 |
| After rifaximin | 1130.4 | 2260.9 | 1773.1 | 380.7 | 21.5 | 1722.8 | 418.5 |
| α-ketoglutaric acid (basal) | 103.6 | 144.3 | 125.5 | 20.5 | 16.4 | 128.4 | 20.4 |
| During rifaximin | 39.6 | 215.4 | 113.0 | 64.7 | 57.3 | 105.1 | 34.8 |
| After rifaximin | 12.2 | 103.6 | 66.4 | 27.0 | 40.7 | 63.8 | 18.4 |
| Uric acid (basal) | 289.7 | 298.3 | 294.5 | 4.4 | 1.5 | 295.5 | 4.3 |
| During rifaximin | 13.7 | 295.5 | 181.4 | 136.5 | 75.2 | 263.8 | 228.8 |
| After rifaximin | 12.0 | 334.9 | 166.5 | 117.7 | 70.6 | 194.2 | 183.2 |
| GSH (basal) | 12.3 | 14.5 | 13.7 | 1.2 | 8.7 | 14.2 | 1.1 |
| During rifaximin | 13.0 | 19.5 | 17.3 | 2.6 | 15.0 | 18.1 | 2.2 |
| After rifaximin | 0.7 | 21.2 | 11.8 | 6.8 | 58.1 | 13.1 | 5.4 |
| Fumaric acid (basal) | 17.9 | 20.3 | 19.0 | 1.3 | 6.6 | 18.6 | 1.2 |
| During rifaximin | 5.8 | 29.8 | 16.2 | 8.7 | 53.4 | 15.5 | 3.1 |
| After rifaximin | 3.1 | 14.5 | 9.5 | 3.3 | 35.1 | 9.8 | 2.3 |
| Succinic acid (basal) | 1022.7 | 1096.6 | 1056.8 | 37.3 | 3.5 | 1051.1 | 36.9 |
| During rifaximin | 221.6 | 1340.9 | 750.0 | 455.3 | 60.7 | 642.0 | 613.6 |
| After rifaximin | 187.5 | 858.0 | 573.2 | 227.5 | 39.7 | 579.5 | 268.5 |
| TYR (basal) | 6.7 | 8.9 | 7.7 | 1.1 | 14.6 | 7.5 | 1.1 |
| During rifaximin | 6.0 | 19.3 | 10.9 | 5.2 | 48.2 | 9.3 | 4.5 |
| After rifaximin | 5.2 | 11.7 | 8.6 | 2.6 | 30.4 | 8.2 | 4.5 |
| Propionic acid (basal) | 245.1 | 294.1 | 264.7 | 25.9 | 9.8 | 254.9 | 24.5 |
| During rifaximin | 34.3 | 281.4 | 148.2 | 109.3 | 73.7 | 156.9 | 182.4 |
| After rifaximin | 49.0 | 134.3 | 93.3 | 33.9 | 36.3 | 86.3 | 60.8 |
| PHE (basal) | 19.2 | 22.2 | 20.6 | 1.5 | 7.4 | 20.3 | 1.5 |
| During rifaximin | 8.1 | 39.7 | 21.0 | 12.2 | 57.8 | 17.9 | 11.3 |
| After rifaximin | 8.6 | 19.2 | 13.6 | 4.1 | 30.0 | 13.4 | 4.8 |
| Butyric acid (basal) | 1363.6 | 1515.2 | 1441.9 | 75.9 | 5.3 | 1447.0 | 75.8 |
| During rifaximin | 1204.5 | 2030.3 | 1527.3 | 378.4 | 24.8 | 1325.8 | 590.9 |
| After rifaximin | 424.2 | 1924.2 | 1218.8 | 550.8 | 45.2 | 1197.0 | 611.7 |
| TRP (basal) | 2.0 | 2.5 | 2.2 | 0.3 | 12.3 | 2.3 | 0.3 |
| During rifaximin | 1.3 | 4.2 | 2.4 | 1.2 | 49.3 | 1.8 | 1.4 |
| After rifaximin | 0.4 | 2.4 | 1.5 | 0.6 | 41.0 | 1.5 | 0.5 |
| R2 | p-Value (Pearson) | |
|---|---|---|
| VAL | 0.6339 | 0.0002 |
| Acetic acid | 0.5915 | 0.0005 |
| a-ketoglutaric acid | 0.6436 | 0.0002 |
| Fumaric acid | 0.6601 | 0.0001 |
| Succinic acid | 0.6021 | 0.0004 |
| TYR | 0.4554 | 0.0041 |
| PHE | 0.6099 | 0.0004 |
| TRP | 0.4196 | 0.0067 |
© 2020 by the authors. Licensee MDPI, Basel, Switzerland. This article is an open access article distributed under the terms and conditions of the Creative Commons Attribution (CC BY) license (http://creativecommons.org/licenses/by/4.0/).
Share and Cite
Campanella, B.; Lomonaco, T.; Benedetti, E.; Onor, M.; Nieri, R.; Bramanti, E. Validation and Application of a Derivatization-Free RP-HPLC-DAD Method for the Determination of Low Molecular Weight Salivary Metabolites. Int. J. Environ. Res. Public Health 2020, 17, 6158. https://doi.org/10.3390/ijerph17176158
Campanella B, Lomonaco T, Benedetti E, Onor M, Nieri R, Bramanti E. Validation and Application of a Derivatization-Free RP-HPLC-DAD Method for the Determination of Low Molecular Weight Salivary Metabolites. International Journal of Environmental Research and Public Health. 2020; 17(17):6158. https://doi.org/10.3390/ijerph17176158
Chicago/Turabian StyleCampanella, Beatrice, Tommaso Lomonaco, Edoardo Benedetti, Massimo Onor, Riccardo Nieri, and Emilia Bramanti. 2020. "Validation and Application of a Derivatization-Free RP-HPLC-DAD Method for the Determination of Low Molecular Weight Salivary Metabolites" International Journal of Environmental Research and Public Health 17, no. 17: 6158. https://doi.org/10.3390/ijerph17176158