The Impact of a Multi-Pronged Intervention on Students’ Perceptions of School Lunch Quality and Convenience and Self-Reported Fruit and Vegetable Consumption


Abstract
1. Introduction
2. Materials and Methods
2.1. Participants
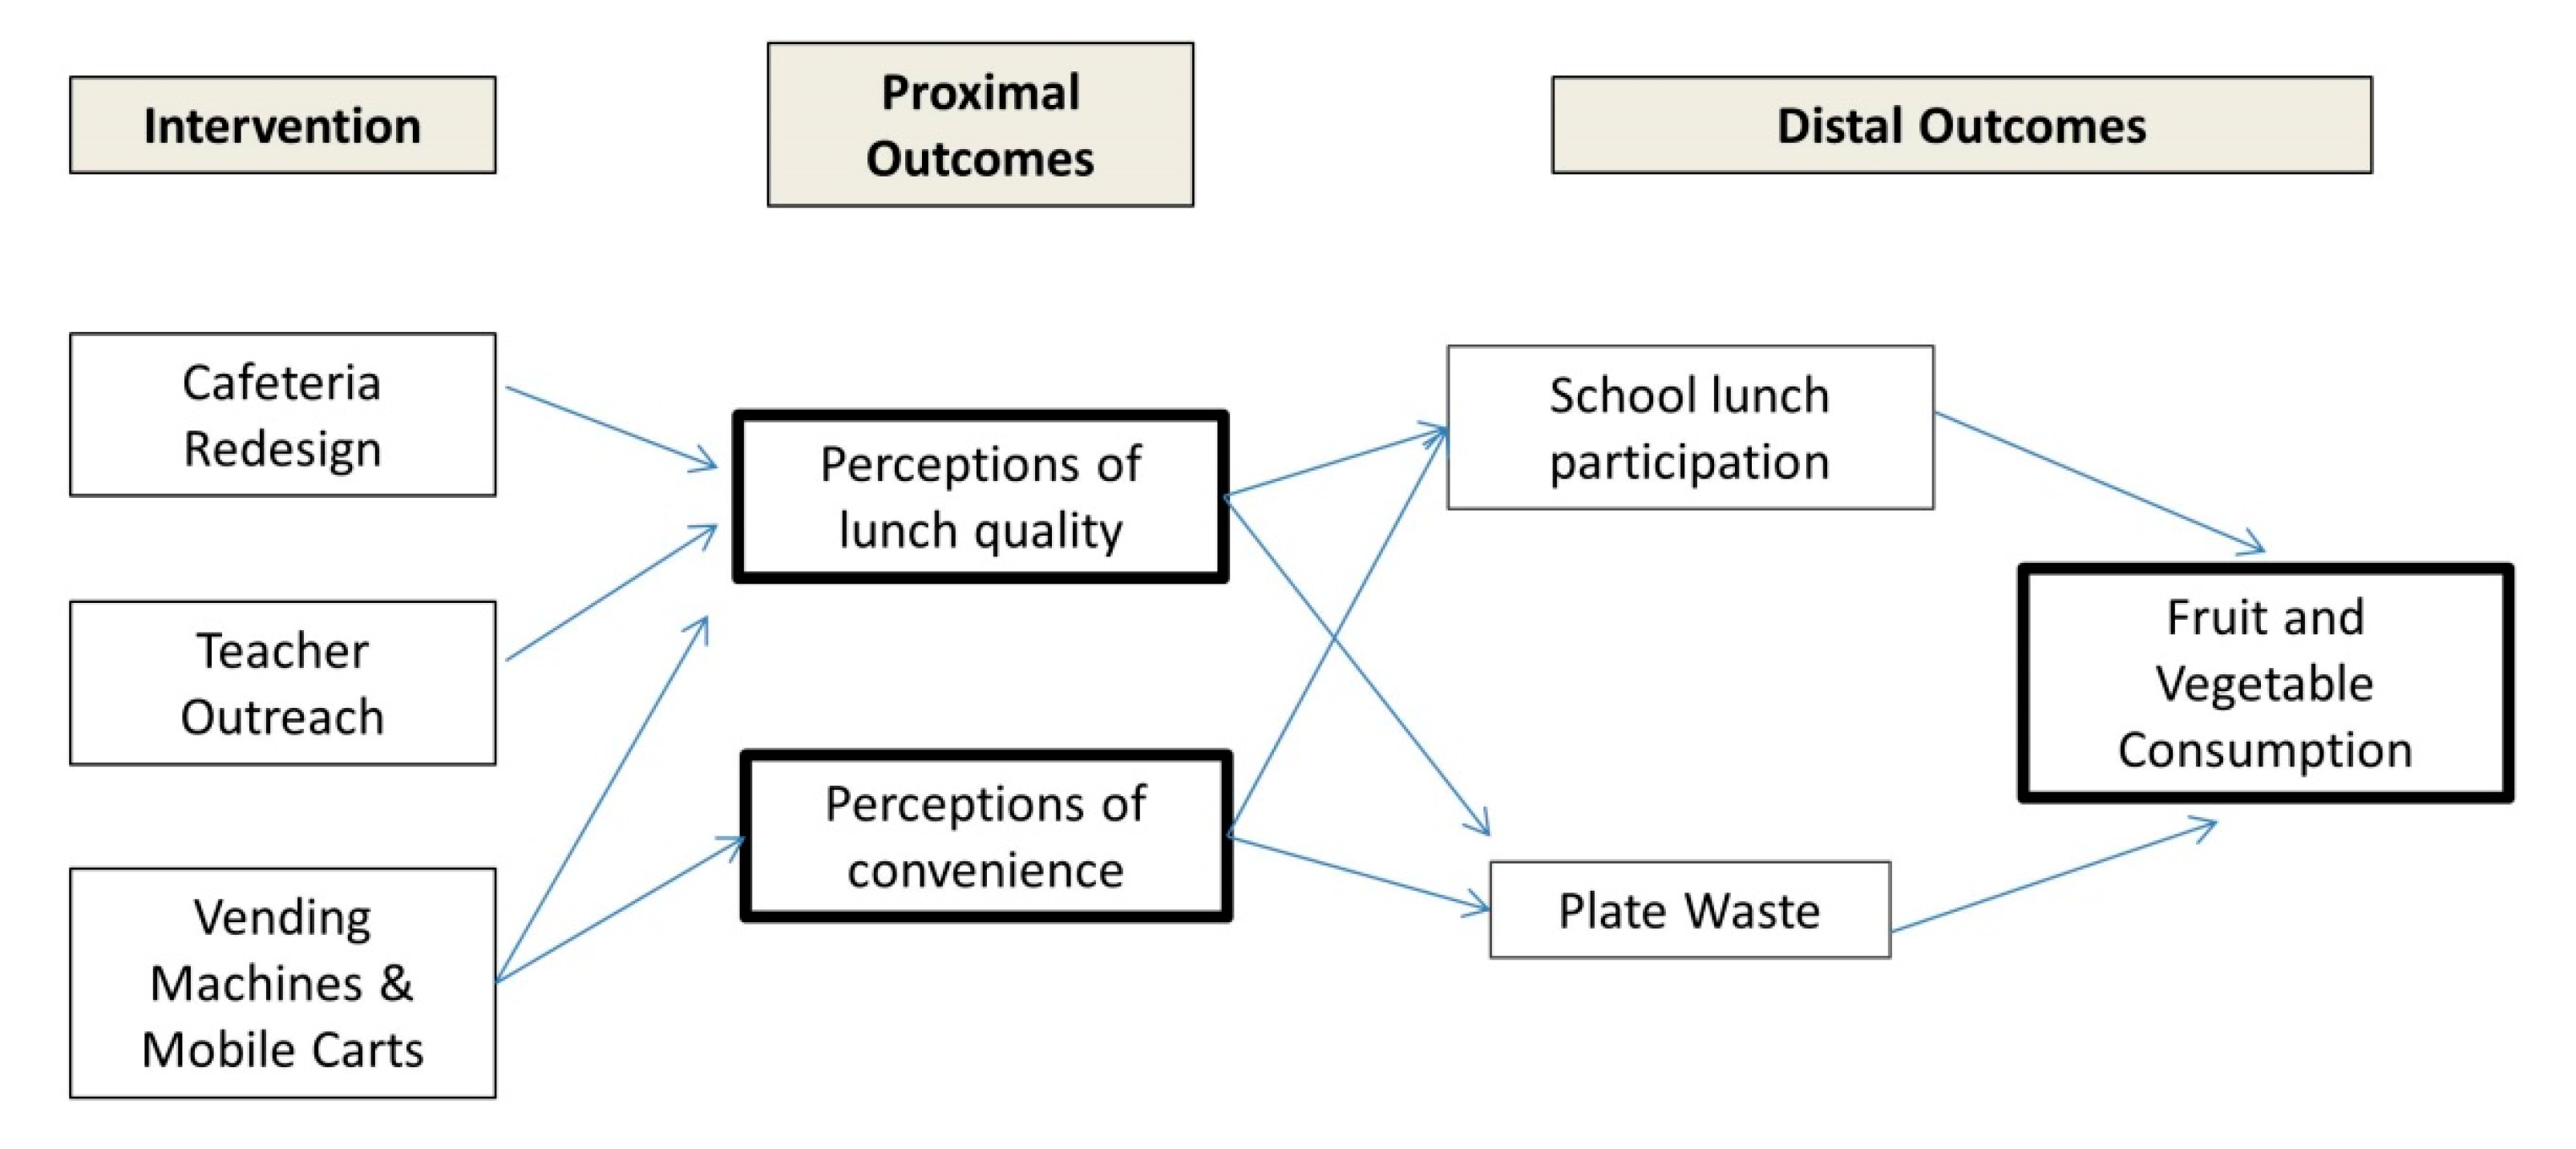
2.2. Intervention and Conceptual Framework
2.3. Measures
2.4. Analysis
3. Results
4. Discussion
5. Conclusions
Supplementary Materials
Author Contributions
Funding
Acknowledgments
Conflicts of Interest
References
- Krebs-Smith, S.M.; Guenther, P.M.; Subar, A.F.; Kirkpatrick, S.I.; Dodd, K.W. Americans do not meet federal dietary recommendations. J. Nutr. 2010, 140, 1832–1838. [Google Scholar] [CrossRef]
- Jääskeläinen, P.; Magnussen, C.G.; Pahkala, K.; Mikkilä, V.; Kähönen, M.; Sabin, M.A.; Fogelholm, M.; Hutri-Kähönen, N.; Taittonen, L.; Telama, R.; et al. Childhood Nutrition in Predicting Metabolic Syndrome in Adults. Diabetes Care 2012, 35, 1937–1943. [Google Scholar] [CrossRef] [PubMed]
- Mikkilä, V.; Räsänen, L.; Raitakari, O.T.; Pietinen, P.; Viikari, J. Longitudinal changes in diet from childhood into adulthood with respect to risk of cardiovascular diseases: The Cardiovascular Risk in Young Finns Study. Eur. J. Clin. Nutr. 2004, 58, 1038–1045. [Google Scholar] [CrossRef] [PubMed]
- Parsons, T.J.; Power, C.; Logan, S.; Summerbell, C.D. Childhood predictors of adult obesity: A systematic review. Int. J. Obes. 1999, 23 (Suppl. S8), 1–107. [Google Scholar]
- Hales, C.; Carroll, M.D.; Fryar, C.D.; Ogden, C.L. Prevalence of Obesity Among Adults and Youth: United States, 2015–2016. Natl. Cent. Health Stat. Data Brief 2017, 288, 1–8. [Google Scholar]
- Hur, I.; Burgess-Champoux, T.; Reicks, M. Higher Quality Intake from School Lunch Meals Compared With Bagged Lunches. ICAN Infant Child Adolesc. Nutr. 2011, 3, 70–75. [Google Scholar] [CrossRef]
- Au, L.E.; Rosen, N.J.; Fenton, K.; Hecht, K.; Ritchie, L.D. Eating School Lunch Is Associated with Higher Diet Quality among Elementary School Students. J. Acad. Nutr. Diet. 2016, 116, 1817–1824. [Google Scholar] [CrossRef]
- Facts: National School Lunch Program. Available online: http://frac.org/wp-content/uploads/cnnslp.pdf (accessed on 26 June 2020).
- Fox, M.K.; Gearan, E.; Cabili, C.; Dotter, D.; Niland, K.; Washburn, L.; Paxton, N.; Olsho, L.; LeClair, L.; Tran, V. School Nutrition and Meal Cost Study Final Report Volume 4: Student Participation, Satisfaction, Plate Waste, and Dietary Intakes; US Department of Agriculture: Alexandria, VA, USA, 2019.
- Cohen, J.F.W.; Richardson, S.; Parker, E.; Catalano, P.J.; Rimm, E.B. Impact of the New U.S. Department of Agriculture School Meal Standards on Food Selection, Consumption, and Waste. Am. J. Prev. Med. 2014, 46, 388–394. [Google Scholar] [CrossRef]
- Marples, C.A.; Spillman, D.-M. Factors affecting students’ participation in the Cincinnati public schools lunch program. Adolescence 1995, 30, 745–755. [Google Scholar] [CrossRef]
- Smith, S.; Cunningham-Sabo, L.; Auld, G. Satisfaction of Middle School Lunch Program Participants and Non- Participants with the School Lunch Experience. J. Child Nutr. Manag. 2015, 39, 1–14. [Google Scholar]
- Gosliner, W. School-level factors associated with increased fruit and vegetable consumption among students in California middle and high schools. J. Sch. Health 2014, 84, 559–568. [Google Scholar] [CrossRef] [PubMed]
- Cohen, J.F.W.; Jahn, J.L.; Richardson, S.; Cluggish, S.A.; Parker, E.; Rimm, E.B. Amount of Time to Eat Lunch Is Associated with Children’s Selection and Consumption of School Meal Entrée, Fruits, Vegetables, and Milk. J. Acad. Nutr. Diet. 2016, 116, 123–128. [Google Scholar] [CrossRef] [PubMed]
- Meiselman, H.L.; Johnson, J.L.; Reeve, W.; Crouch, J.E. Demonstrations of the influence of the eating environment on food acceptance. Appetite 2000, 35, 231–237. [Google Scholar] [CrossRef] [PubMed]
- Hamdi, N.; Ellison, B.; McCaffrey, J.; Metcalfe, J.J.; Hoffman, A.; Haywood, P.; Prescott, M.P. Implementation of a Multi-Component School Lunch Environmental Change Intervention to Improve Child Fruit and Vegetable Intake: A Mixed-Methods Study. Int. J. Environ. Res. Public Health 2020, 17, 3971. [Google Scholar] [CrossRef]
- Higgs, S.; Thomas, J. Social influences on eating. Curr. Opin. Behav. Sci. 2016, 9, 277–291. [Google Scholar] [CrossRef]
- Machado, S.; Ritchie, L.; Thompson, H.; Reed, A.; Castro, A.I.; Neelon, M.; Madsen, K. Multi-pronged intervention to increase secondary student participation in school lunch: Design and rationale. Contemp. Clin. Trials 2019, 78, 133–139. [Google Scholar] [CrossRef]
- Thompson, H.; Gosliner, W.; Ritchie, L.; Wobbekind, K.; Reed, A.; O’Keefe, O.; Madsen, K. The impact of a multi-pronged intervention to increase school lunch participation among secondary school students in an urban public school district. Child. Obes. 2020. [Google Scholar] [CrossRef]
- Thompson, H.; Gosliner, W.; Ritchie, L.; Madsen, K. Impact of a multi-component school lunch intervention on urban secondary students’ school lunch waste. In preparation.
- Zhao, C.; Panizza, C.; Fox, K.; Boushey, C.J.; Byker Shanks, C.; Ahmed, S.; Chen, S.; Serrano, E.L.; Zee, J.; Fialkowski, M.K.; et al. Plate Waste in School Lunch: Barriers, Motivators, and Perspectives of SNAP-Eligible Early Adolescents in the US. J. Nutr. Educ. Behav. 2019, 51, 967–975. [Google Scholar] [CrossRef]
- Kwon, S.; Kim, O.; Lee, Y. Effects of students’ satisfaction with school meal programs on school happiness in South Korea. Nutr. Res. Pract. 2018, 12, 342–347. [Google Scholar] [CrossRef]
- Ozturk, O.D.; McInnes, M.M.; Blake, C.E.; Frongillo, E.A.; Jones, S.J. Development of a structured observational method for the systematic assessment of school food-choice architecture. Ecol. Food Nutr. 2016, 55, 119–140. [Google Scholar] [CrossRef]
- Rajbhandari-Thapa, J.; Bennett, A.; Keong, F.; Palmer, W.; Hardy, T.; Welsh, J. Effect of the Strong4Life School Nutrition Program on Cafeterias and on Manager and Staff Member Knowledge and Practice, Georgia, 2015. Public Health Rep. 2017, 132 (Suppl. S2), 48–56. [Google Scholar] [CrossRef] [PubMed]
- Meyer, M.K. Top Predictors of Middle/Junior High School Students’ Satisfaction with School Food Service and Nutrition Programs. J. Acad. Nutr. Diet. 2000, 100, 100–103. [Google Scholar] [CrossRef]
- Di Noia, J.; Byrd-Bredbenner, C. Determinants of fruit and vegetable intake in low-income children and adolescents. Nutr. Rev. 2014, 72, 575–590. [Google Scholar] [CrossRef] [PubMed]
- Rasmussen, M.; Krølner, R.; Klepp, K.-I.; Lytle, L.; Brug, J.; Bere, E.; Due, P. Determinants of fruit and vegetable consumption among children and adolescents: A review of the literature. Part I: Quantitative studies. Int. J. Behav. Nutr. Phys. Act. 2006, 3, 22. [Google Scholar] [CrossRef] [PubMed]
- van der Horst, K.; Oenema, A.; Ferreira, I.; Wendel-Vos, W.; Giskes, K.; van Lenthe, F.; Brug, J. A systematic review of environmental correlates of obesity-related dietary behaviors in youth. Health Educ. Res. 2007, 22, 203–226. [Google Scholar] [CrossRef]
- Kubik, M.Y.; Lytle, L.; Fulkerson, J.A. Fruits, vegetables, and football: Findings from focus groups with alternative high school students regarding eating and physical activity. J. Adolesc. Health 2005, 36, 494–500. [Google Scholar] [CrossRef]
- Olsta, J. Bringing Breakfast to Our Students: A Program to Increase School Breakfast Participation. J. Sch. Nurs. 2013, 29, 263–270. [Google Scholar] [CrossRef]
- Rovner, A.J.; Nansel, T.R.; Wang, J.; Iannotti, R.J. Food sold in school vending machines is associated with overall student dietary intake. J. Adolesc. Health 2011, 48, 13–19. [Google Scholar] [CrossRef]
- Gosliner, W.; Madsen, K.A.; Woodward-Lopez, G.; Crawford, P.B. Would students prefer to eat healthier foods at school? J. Sch. Health 2011, 81, 146–151. [Google Scholar] [CrossRef]
- Hunsberger, M.; O’Malley, J.; Block, T.; Norris, J.C. Relative validation of Block Kids Food Screener for dietary assessment in children and adolescents. Matern. Child Nutr. 2015, 11, 260–270. [Google Scholar] [CrossRef]
- Kjosen, M.M.; Moore, C.E.; Cullen, K.W. Middle School Student Perceptions of School Lunch Following Revised Federal School Meal Guidelines. J. Child Nutr. Manag. 2015, 39, 11. [Google Scholar]
- Asada, Y.; Hughes, A.; Read, M.; Schwartz, M.B.; Chriqui, J. High School Students’ Recommendations to Improve School Food Environments: Insights From a Critical Stakeholder Group. J. Sch. Health 2017, 87, 842–849. [Google Scholar] [CrossRef] [PubMed]
- Machado, S.; Madsen, K.; Brewster, A.; Shapiro, V.; Magee, K.; Ritchie, L. Implementation leadership in school nutrition: A qualitative study. In preparation.


| Sample Characteristics | Surveys from Intervention Schools a,b | Surveys from Control Schools a,b | p-Value c |
|---|---|---|---|
| Race/Ethnicity, n (%) | <0.001 | ||
| African American | 264 (4%) | 222 (4%) | |
| Asian | 3548 (52%) | 2822 (47%) | |
| Latino | 1680 (25%) | 1,130 (19%) | |
| White | 426 (6%) | 926 (15%) | |
| Other e | 890 (13%) | 919 (15%) | |
| Gender, n (%) | <0.001 | ||
| Female | 3153 (46%) | 3206 (53%) | |
| Male | 3525 (52%) | 2664 (44%) | |
| Other f | 130 (2%) | 149 (2%) | |
| Grade 8, n (%) | 1969 (29%) | 2085 (35%) | <0.001 d |
| Ate school lunch yesterday | 456 (24%) | 456 (22%) | 0.377 |
| Typically eat school lunch | 413 (22%) | 429 (22%) | 0.808 |
| Grade 9, n (%) | 2534 (37%) | 1883 (31%) | <0.001 d |
| Ate school lunch yesterday | 615 (25%) | 267 (14%) | <0.001 |
| Typically eat school lunch | 572 (24%) | 260 (15%) | <0.001 |
| Grade 10, n (%) | 2305 (34%) | 2051 (34%) | <0.001 d |
| Ate school lunch yesterday | 602 (27%) | 390 (19%) | <0.001 |
| Typically eat school lunch | 572 (26%) | 358 (18%) | <0.001 |
| Intervention Schools | Control Schools | Between-Group Difference in Change b 95% CI | |||||
|---|---|---|---|---|---|---|---|
| Grade | Baseline (n = 3551) Mean c ± SE | Follow-Up (n = 3257) Mean ± SE | Difference Mean 95% CI | Baseline (n = 2951) Mean ± SE | Follow-Up (n = 3068) Mean ± SE | Difference Mean 95% CI | |
| School lunch is enough to feel full | |||||||
| grade 8 | 2.39 ± 0.05 | 2.43 ± 0.05 | 0.04 −0.05, 0.14 | 2.44 ± 0.04 | 2.32 ± 0.05 | −0.12 ** −0.21, −0.04 | 0.17 ** 0.04, 0.29 |
| grade 9 | 2.55 ± 0.06 | 2.61 ± 0.06 | 0.06 −0.01, 0.14 | 2.41 ± 0.07 | 2.43 ± 0.07 | 0.02 −0.06, 0.11 | 0.04 −0.08, 0.16 |
| grade 10 | 2.51 ± 0.04 | 2.55 ± 0.04 | 0.04 −0.04, 0.12 | 2.47 ± 0.04 | 2.39 ± 0.04 | −0.08 −0.16, 0.01 | 0.12 0.00, 0.23 |
| School lunch tastes good | |||||||
| grade 8 | 2.01 ± 0.06 | 2.01 ± 0.06 | 0.00 −0.08, 0.09 | 2.08 ± 0.05 | 1.89 ± 0.06 | −0.18 *** −0.27, −0.10 | 0.19 ** 0.07, 0.31 |
| grade 9 | 2.31 ± 0.07 | 2.34 ± 0.07 | 0.02 −0.05, 0.10 | 2.04 ± 0.08 | 2.09 ± 0.08 | 0.05 −0.04, 0.13 | −0.02 −0.14, 0.09 |
| grade 10 | 2.34 ± 0.06 | 2.34 ± 0.06 | 0.00 −0.08, 0.08 | 2.18 ± 0.07 | 2.20 ± 0.07 | 0.02 −0.07, 0.10 | −0.02 −0.13, 0.10 |
| School lunch is healthier than foods I bring from home or off−campus | |||||||
| grade 8 | 2.28 ± 0.04 | 2.25 ± 0.04 | −0.03 −0.12, 0.06 | 2.29 ± 0.04 | 2.17 ± 0.04 | −0.12 ** −0.21, −0.03 | 0.09 −0.03, 0.22 |
| grade 9 | 2.49 ± 0.04 | 2.51 ± 0.04 | 0.03 −0.05, 0.10 | 2.31 ± 0.05 | 2.38 ± 0.05 | 0.07 −0.02, 0.16 | −0.05 −0.17, 0.07 |
| grade 10 | 2.50 ± 0.04 | 2.53 ± 0.04 | 0.03 −0.05, 0.11 | 2.33 ± 0.05 | 2.38 ± 0.05 | 0.05 −0.04, 0.13 | −0.02 −0.13, 0.10 |
| Lines are too long | |||||||
| grade 8 | 3.62 ± 0.10 | 3.67 ± 0.10 | 0.05 −0.04, 0.14 | 3.60 ± 0.09 | 3.60 ± 0.09 | 0.00 −0.08, 0.09 | 0.05 −0.08, 0.17 |
| grade 9 | 3.49 ± 0.15 | 3.39 ± 0.15 | −0.10 * −0.17, −0.02 | 3.28 ± 0.18 | 3.21 ± 0.18 | −0.08 −0.16, 0.01 | −0.02 −0.14, 0.09 |
| grade 10 | 3.55 ± 0.18 | 3.49 ± 0.18 | −0.06 −0.14, 0.01 | 3.25 ± 0.21 | 3.12 ± 0.21 | −0.13 ** −0.21, −0.05 | 0.07 −0.05, 0.18 |
| Intervention Schools | Control Schools | Between-Group Difference in Change | |||||
|---|---|---|---|---|---|---|---|
| Grade | Baseline (n = 3551) Mean ± SE | Follow-Up (n = 3257) Mean ± SE | Difference Mean 95% CI | Baseline (n = 2951) Mean ± SE | Follow-Up (n = 3068) Mean ± SE | Difference Mean 95% CI | |
| Ate fruit at lunch yesterday (excluding fruit juice), % Agree | |||||||
| grade 8 | 56.9 ± 3.5% | 56.6% ± 3.8% | −0.3% −7.1%, 6.4% | 61.4% ± 3.0% | 56.4% ± 3.0% | −4.9% −10.6%, 0.8% | 4.6% −4.4%, 13.6% |
| grade 9 | 56.7% ± 2.8% | 52.8% ± 3.4% | −3.9% −10.0%, 2.1% | 57.3% ± 2.7% | 54.7% ± 3.1% | −2.7% * −5.0%, −0.3% | −1.3% −7.7%, 5.2% |
| grade 10 | 60.5% ± 3.2% | 61.3% ± 3.2% | 0.8% −3.7%, 5.3% | 56.5% ± 3.3% | 52.5% ± 4.4% | −4.0% * −7.8%, −0.3% | 4.8% −1.0%, 10.6% |
| Ate fruit at lunch yesterday (including fruit juice), % Agree | |||||||
| grade 8 | 59.9% ± 3.8% | 59.1% ± 3.6% | −0.8% −7.4%, 5.8% | 65.1% ± 2.6% | 58.3% ± 2.8% | −6.8% * −12.8%, −0.7% | 6.0% −3.2%, 15.2% |
| grade 9 | 60.2% ± 2.4% | 57.0% ± 2.9% | −3.2% −8.0%, 1.7% | 61.6% ± 2.6% | 57.0% ± 2.7% | −4.7% *** −7.5%, −1.9% | 1.5% −4.0%, 7.0% |
| grade 10 | 62.3% ± 2.8% | 63.3 ± 2.9% | 1.0% −3.7%, 5.6% | 61.8% ± 3.1% | 56.6% ± 4.0% | −5.3% *** −8.0%, 2.5% | 6.2% * 1.0%, 11.5% |
| Ate vegetables at lunch yesterday (excluding fried potatoes), % Agree | |||||||
| grade 8 | 40.9% ± 3.6% | 45.6% ± 3.9% | 4.7% −0.3%, 9.7% | 47.5% 3.8% | 46.1% 3.4% | −1.4% −5.6%, 2.8% | 6.1% −0.5%, 12.6% |
| grade 9 | 47.1% ± 3.2% | 49.3% ± 2.1% | 2.3% −4.0%, 8.5% | 49.5% ± 3.2% | 49.2% ± 2.4% | −0.3% −7.3%, 6.7% | 2.5% −6.8%, 11.9% |
| grade 10 | 53.1 ± 2.1% | 56.0% ± 2.4% | 2.9% −0.9%, 6.6% | 50.6% ± 2.0% | 47.3% ± 1.8% | −3.3% * −6.3%, 0.2% | 6.1% ** 1.5%, 10.7% |
| Intervention Schools | Control Schools | Between-Group Difference in Change b 95% CI | |||||
|---|---|---|---|---|---|---|---|
| Grade | Baseline (n = 3487) Mean ± SE | Follow-Up (n = 3187) Mean ± SE | Difference Mean 95% CI | Baseline (n = 2885) Mean ± SE | Follow-Up (n = 2978) Mean ± SE | Difference Mean 95% CI | |
| Fruit (excluding fruit juice), Cups/Day | |||||||
| grade 8 | 1.08 ± 0.03 | 1.11 ± 0.04 | 0.03 −0.09, 0.15 | 1.00 ± 0.02 | 0.97 ± 0.04 | −0.03 −0.10, 0.04 | 0.06 −0.08, 0.19 |
| grade 9 | 0.96 ± 0.05 | 0.90 ± 0.04 | −0.06 −0.12, 0.00 | 1.07 ± 0.05 | 0.94 ± 0.04 | −0.13 *** −0.18, −0.08 | 0.07 −0.01, 0.14 |
| grade 10 | 0.88 ± 0.03 | 0.89 ± 0.04 | 0.00 −0.10, 0.11 | 0.98 ± 0.03 | 0.98 ± 0.02 | 0.00 −0.07, 0.08 | 0.00 −0.14, 0.15 |
| All fruit, Cups/Day | |||||||
| grade 8 | 1.39 ± 0.04 | 1.42 ± 0.06 | 0.04 −0.12, 0.19 | 1.36 ± 0.03 | 1.30 ± 0.04 | −0.06 −0.13, 0.02 | 0.07 −0.06, 0.20 |
| grade 9 | 1.25 ± 0.05 | 1.17 ± 0.03 | −0.08 ** −0.13, −0.03 | 1.39 ± 0.05 | 1.18 ± 0.03 | −0.21 *** −0.27, −0.15 | 0.09 ** 0.03, 0.15 |
| grade 10 | 1.17 ± 0.03 | 1.17 ± 0.04 | 0.00 −0.09 0.09 | 1.29 ± 0.04 | 1.24 ± 0.03 | −0.05 −0.14, 0.03 | 0.04 −0.06, 0.14 |
| Vegetables (excluding potatoes), Cups/Day | |||||||
| grade 8 | 0.70 ± 0.02 | 0.74 ± 0.04 | 0.04 −0.02, 0.10 | 0.66 ± 0.03 | 0.68 ± 0.03 | 0.02 −0.04, 0.07 | 0.02 −0.09, 0.14 |
| grade 9 | 0.66 ± 0.03 | 0.65 ± 0.03 | −0.01 −0.05, 0.03 | 0.70 ± 0.04 | 0.67 ± 0.03 | −0.03 −0.12, 0.05 | 0.03 −0.11, 0.18 |
| grade 10 | 0.73 ± 0.04 | 0.77 ± 0.03 | 0.04 −0.06, 0.14 | 0.72 ± 0.02 | 0.79 ± 0.03 | 0.07 * 0.01, 0.13 | −0.04 −0.19, 0.11 |
| All vegetables, Cups/Day | |||||||
| grade 8 | 0.99 ± 0.02 | 1.0 ± 0.04 | 0.01 −0.07, 0.09 | 0.93 ± 0.04 | 0.95 ± 0.04 | 0.02 −0.08, 0.12 | −0.01 −0.14, 0.12 |
| grade 9 | 0.90 ± 0.03 | 0.88 ± 0.03 | −0.02 −0.07, 0.02 | 0.97 ± 0.06 | 0.94 ± 0.04 | −0.04 −0.17, 0.10 | 0.02 −0.14, 0.17 |
| grade 10 | 0.95 ± 0.04 | 0.99 ± 0.03 | 0.04 −0.07, 0.16 | 0.97 ± 0.03 | 1.05 ± 0.04 | 0.07 −0.01, 0.15 | −0.03 −0.16, 0.11 |
© 2020 by the authors. Licensee MDPI, Basel, Switzerland. This article is an open access article distributed under the terms and conditions of the Creative Commons Attribution (CC BY) license (http://creativecommons.org/licenses/by/4.0/).
Share and Cite
Machado, S.S.; Ritchie, L.D.; Thompson, H.R.; Madsen, K.A. The Impact of a Multi-Pronged Intervention on Students’ Perceptions of School Lunch Quality and Convenience and Self-Reported Fruit and Vegetable Consumption. Int. J. Environ. Res. Public Health 2020, 17, 5987. https://doi.org/10.3390/ijerph17165987
Machado SS, Ritchie LD, Thompson HR, Madsen KA. The Impact of a Multi-Pronged Intervention on Students’ Perceptions of School Lunch Quality and Convenience and Self-Reported Fruit and Vegetable Consumption. International Journal of Environmental Research and Public Health. 2020; 17(16):5987. https://doi.org/10.3390/ijerph17165987
Chicago/Turabian StyleMachado, Stephanie S., Lorrene D. Ritchie, Hannah R. Thompson, and Kristine A. Madsen. 2020. "The Impact of a Multi-Pronged Intervention on Students’ Perceptions of School Lunch Quality and Convenience and Self-Reported Fruit and Vegetable Consumption" International Journal of Environmental Research and Public Health 17, no. 16: 5987. https://doi.org/10.3390/ijerph17165987
APA StyleMachado, S. S., Ritchie, L. D., Thompson, H. R., & Madsen, K. A. (2020). The Impact of a Multi-Pronged Intervention on Students’ Perceptions of School Lunch Quality and Convenience and Self-Reported Fruit and Vegetable Consumption. International Journal of Environmental Research and Public Health, 17(16), 5987. https://doi.org/10.3390/ijerph17165987