Abstract
Data mainly from one-off surveys clearly show that the health of Roma, the largest ethnic minority of Europe, is much worse than that of the general population. However, results from comprehensive exploratory studies are missing. The aim of our study was to create a complex database for comparative and association studies to better understand the background of the very unfavourable health of Roma, especially the high burden of cardiometabolic diseases. A three-pillar (questionnaire-based, physical and laboratory examinations) health survey was carried out on randomly selected samples of the Hungarian general (HG, n = 417) and Roma (HR, n = 415) populations, and a database consisting of more than half a million datapoints was created. Using selected data, the prevalence rates of metabolic syndrome (MetS) and of its components were determined, and to estimate the risk of insulin resistance (IR), surrogate measures (the homeostasis model assessment of insulin resistance index, quantitative insulin sensitivity check index, McAuley and TyG indices and the TG/HDL-C ratio) were calculated. Receiver operating characteristic curve analysis and Youden’s method were used to define the optimal cut-off values of each IR index. The prevalence of MetS was very high in both study populations (HG: 39.8%, HR: 44.0%) with no statistically significant difference between the two groups in females or males. The prevalence of MetS showed a very marked increase in the HR 35–49 years age group. Among surrogate measures, the TyG index showed the greatest power for predicting IR/MetS at a cut-off value of 4.69 (77% sensitivity, 84% specificity) and indicated a 42.3% (HG) and 40.5% (HR) prevalence of IR. The prevalence of MetS and IR is almost equally very unfavourable in both groups; thus, the factors underlying the high premature mortality burden of Roma should be further clarified by investigating the full spectrum of risk factors available in the database, with a special focus on the access of Roma people to preventive and curative health services.
1. Introduction
Roma are the largest ethnic minority population in Europe, with an estimated population of 10–12 million [1]. Although restrictions exist on collecting statistical data on health and its determinants by ethnic status in the countries where Roma populations are most concentrated (Southern, Central, and Eastern European countries) [2,3], increasing amounts of data from ethically appropriate one-off surveys are available and show that the health of Roma is much worse than that of the general population [1]. These studies are almost exclusively descriptive ones on the prevalence of certain diseases, especially infectious and certain genetic diseases [1,4,5], and of health determinants [6,7,8,9], especially cardiovascular risk factors [10,11,12], while comprehensive exploratory studies are missing.
In addition, common study limitations include a low number of participants and the absence of a majority population group as a reference. For example, the latest literature review on the prevalence of diabetes mellitus among Roma notes that altogether, four previously published papers suggested a higher prevalence of diabetes among Roma than in Caucasians, and “none of them reached the standards regarding representative samples and number of cases for a conclusive result” [13].
Although the relationship between the very unfavourable socio-economic conditions and poor health status among Roma [14,15,16] is almost evident, the differences observed in comparisons between the Roma population and the general population do not appear to be explained entirely by their worse socio-economic status [17,18]. Recent studies on the genetic background of the increased risk of different non-communicable diseases among Roma [19,20,21] further strengthen the hypothesis that the health status of Roma is defined by a complexity of different health-related factors.
Metabolic syndrome (MetS) is considered to be the most robust predictor of the increased susceptibility to different non-communicable diseases (cardiovascular diseases, type 2 diabetes, polycystic ovary syndrome, fatty liver, cholesterol gallstones, asthma, sleep disturbances, and some forms of cancer) [22], most of which have a high morbidity and mortality burden especially among vulnerable populations [23]. Insulin resistance (IR) defined as an impaired biological response to insulin actions in the insulin-responsive tissues is considered central to the pathology of MetS. IR can be developed by different mechanisms most commonly initiated by lifestyle factors (unhealthy diet, smoking, physical inactivity) and resulting in hyperglycaemia and hyperinsulinemia in its early phase and the affected subjects subsequently develop multiple metabolic disturbances [24,25,26]. The link between insulin resistance (IR) and MetS has long been well known [27,28], and increasing numbers of studies have demonstrated that IR is the root cause of clustering disturbances in glycose and lipid metabolisms in different target tissues (muscle, adipose tissue, liver), resulting in not only hyperglycaemia, but also elevated TG, decreased HDL-C, and a typically central type of obesity [29,30,31,32]. In addition, abundant clinical and epidemiologic evidence has demonstrated a close linkage between IR and hypertension via enhanced salt absorption in the kidney, activation of the sympathetic nervous system, and alteration in vascular resistance (see reviewed [33]). Findings suggest that IR is significantly associated with the clustering of MetS risk factors [34,35,36,37], and IR is considered central to the pathophysiology of cardiometabolic diseases.
The study we present here is the most complex combined survey ever carried out using mixed methodology among Roma to not only determine the distribution of different health conditions, risk factors, and health determinants in comparison with those of the general population living in their neighbourhood, but also to create a database that can be used for association studies to explore the interactions between different environmental and genetic factors in defining health status and susceptibility to different diseases.
In the present paper, in addition to providing a detailed description of the methodology used to create a complex database and to introduce its composition, we demonstrate its usefulness by first describing how it can be used to examine the prevalence of cardiometabolic risk factors linked to insulin resistance after defining the cut-off points for different IR surrogate indices for metabolic syndrome and its prevalence among Roma in comparison with the general population.
2. Materials and Methods
2.1. Sample Representative of the Hungarian Roma (HR) Population Living in Segregated Colonies in Northeast Hungary
The study population was enrolled from two counties (Hajdú-Bihar and Szabolcs-Szatmár-Bereg) in Northeast Hungary, the area where the Roma are most prevalent and where the majority of segregated Roma colonies are located. Ninety-two segregated colonies identified previously in a nationwide survey with more than 100 inhabitants [38] were considered in the study, of which 25 were randomly selected using general practitioners’ (GPs) validated household lists. Afterwards, 20 households in each colony were randomly chosen, and one person aged 20–64 years from each household was interviewed face-to-face at the respondent’s household by Roma university students under the supervision of public health coordinators and was invited to visit a general practitioner for a physical examination and blood collection. The ethnicity of the participants was assessed by self-declaration. The planned sample size was 500 individuals, and among them, 415 committed to participate in the study (Figure 1).
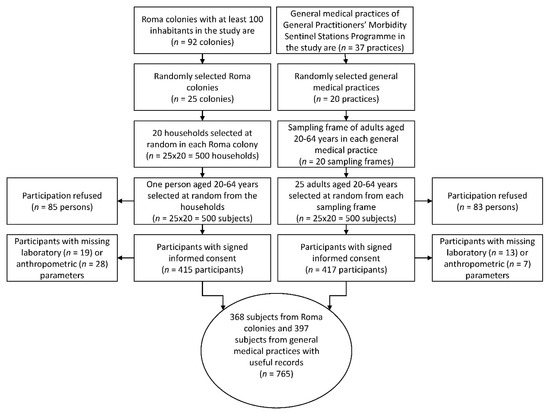
Figure 1.
Flowchart showing the process of sample selection for study populations.
2.2. Sample Representative of the Hungarian General (HG) Population Living in Northeast Hungary
The control study population involved randomly drawn individuals who were 20 to 64 years of age, lived in private households in the same counties of Northeast Hungary and were registered by general practitioners involved in the General Practitioners’ Morbidity Sentinel Stations Programme (GPMSSP). The GPMSSP is a population-based registry that was established in 1998 to monitor the prevalence and incidence of chronic non-communicable diseases of great public health importance [39]. From 20 randomly selected GP practices 25 individuals selected at random/practice were invited to participate in the study. For subjects who could not be reached, other individuals were enrolled, but if someone refused to participate, drawing another person was not allowed. The planned sample size was 500 individuals, and among them 417 could be enrolled into the study (Figure 1).
2.3. Pillars of the Complex (Health Interview and Examination) Survey
A three-pillar survey consisting of questionnaire-based interviews (I), physical examinations (II) and laboratory tests (III) was designed and carried out.
2.3.1. I. Questionnaire-Based Interviews
The main part of the questionnaire in our survey was the European Health Interview Survey (EHIS) wave 2 (EHIS 2 for 2013–2015, used in the Hungarian survey in 2014) questionnaire, which consists of four modules on (a) health status, (b) health care use, (c) health determinants, and (d) socio-economic variables. In these modules, the following topics are covered: (a) self-perceived health, chronic diseases known by the respondents, limitation in activities, and mental health, (b) use of different types of health care services, including hospitalizations, consultations, preventive services, and medications, and unmet needs for health care, and (c) smoking and alcohol consumption, physical activity, and dietary habits and additional background variables on demographics and socio-economic status such as sex, age, living conditions, education, income, and employment [40].
The EHIS questionnaire was extended with some additional groups of questions validated in previous surveys [41,42,43,44,45,46].
2.3.2. II. Physical Examinations
Anthropometric (weight, height and waist circumference) and blood pressure (BP) measurements were obtained for each survey participant by using the European Health Examination Survey protocol [47]. Body mass index (BMI) was calculated by using the following formula: BMI = weight (kg)/height (m)2. Routine physical examination was extended to define visual acuity and physical/cardiovascular fitness.
2.3.3. III. Laboratory Examinations
After overnight fasting, native (5 mL) and EDTA-anticoagulated whole blood samples (2 × 3 mL) were taken for laboratory tests and DNA extraction. For biochemical investigations, serum and plasma samples were separated by centrifugation at 3000 rpm for 10 min and used immediately or kept at −80 °C until analysis. DNA preparation was carried out from EDTA-anticoagulated blood samples on the day of sample collection.
In the Department of Laboratory Medicine of the University of Debrecen, total cholesterol (C), HDL-C, LDL-C, triglycerides (TG), glucose (Glu), creatinine, uric acid, C-reactive protein (CRP), apolipoprotein A1 (ApoA1), apolipoprotein B100 (ApoB100) concentrations, alanine aminotransferase (ALT), aspartate aminotransferase (AST), gamma-glutamyl-transferase (GGT), alkaline phosphatase (ALP) activities, folic acid, Haemoglobin A1c, and insulin concentrations were determined.
From plasma samples lipid profiling and on DNA samples genotyping analyses are in progress.
2.4. Creation of the Database
The data management process was coordinated by the Public Health Research Institute of the University of Debrecen. All validation rules (skip, range, and consistency checks) provided previously to the EHIS 2 by Eurostat were strictly followed and processed [40]. Data obtained from interviewer-assisted questionnaires as well as from physical and laboratory examinations were input into an Excel spreadsheet type database with the type of data as column headers and anonymized participants in the rows.
Data for the determination of the prevalence of MetS and its components and the calculation of surrogate indices to estimate the prevalence of IR were extracted from the database of the complex survey. Namely, the results of waist circumference and blood pressure measurements, fasting TG, HDL-C, Glu, and insulin concentrations, as well as antihypertensive, antidiabetic therapies, and specific treatments for lipid abnormalities were sorted.
2.5. Determination of the Prevalence of Metabolic Syndrome and Its Components
The prevalence rates of MetS and that of its components were defined by accepting the IDF definition, i.e., someone was considered to have metabolic syndrome if he or she had central adiposity (waist circumference: ≥94 cm for men and ≥80 cm for women—for Europid population) combined with two or more of the following four factors: (1) raised concentration of triglycerides (≥1.7 mmol/L) or specific treatment for this lipid abnormality; (2) reduced concentration of HDL cholesterol: (<1.03 mmol/L in men and <1.29 mmol/L in women) or specific treatment for this lipid abnormality; (3) raised blood pressure (systolic blood pressure ≥ 130 mmHg or diastolic blood pressure ≥ 85 mmHg) or treatment of previously diagnosed hypertension; and (4) raised fasting plasma glucose concentration (≥5.6 mmol/L) or previously diagnosed type 2 diabetes [48].
2.6. Insulin Sensitivity/Resistance Indices Calculated by Using Fasting Serum/Plasma Concentrations of Insulin, Glucose, HDL-C and Triglycerides
The method accepted as the gold standard for investigating and quantifying insulin resistance, the hyperinsulinaemic euglycaemic clamp technique [49], is not applicable in population-based surveys (it involves intravenous infusion of insulin, frequent blood sampling over a 2-h period, and continuous adjustment of a glucose infusion) [50]. Thus, indirect indices are used in population studies because of their technical simplicity (see reviewed by [51]). To estimate the risk of insulin resistance, surrogate indices, such as the homeostasis model assessment of insulin resistance, HOMA-IR [52], defined as (glucose (mmol/L) × insulin level (mIU/L)/22.5), the quantitative insulin sensitivity check index, QUICKI [53], defined as (1 − (log glucose + log insulin)), and the McAuley index [54] as defined (exp ((2.63–0.28 ln [insulin (IU/mL)] − 0.31 ln [TG (mmol/L)])) were calculated. In addition, the TyG index has been proposed as a useful surrogate measure of insulin resistance in healthy adults [55]; it is calculated by using the equation ln[triglycerides (mmol/L) × glucose (mmol/L)/2] and TG/HDL-C ratio [56] and was demonstrated to be a good indicator of IR in numerous studies (see discussed in [57]).
2.6.1. Determination of the Cut-Off Values of Surrogate Measures for Insulin Resistance
Surrogate indices were calculated for each participant in both study groups. To estimate the cut-off values of the surrogate measures of insulin sensitivity for discriminating metabolic syndrome, the receiver operating characteristic (ROC) curve was applied. Youden’s method [58] was used to find an optimal cut-off point on the ROC curves to optimize the sensitivity and the specificity of each IR index. The index was calculated for all points of the ROC curves, and the maximum value of the index was used as a criterion for selecting the optimum cut-off point. To characterize the indicative power of different biochemical parameters and surrogate indices for MetS/IR, area under the curve (AUC) calculations were carried out. Analyses were performed using SPSS software version 26.0 (IBM, Armonk, NY, USA) [59].
2.6.2. Determination of the Prevalence of IR by Using Different Surrogate Indices
The prevalence of IR was defined for the HG and HR populations by using population-specific cut-off points and cut-off values defined in combined populations for the HOMA-IR, QUICKI, McAuley index, TG/HDL-C ratio, and TyG index. The prevalence of IR was defined as the proportion (%) of the populations with surrogate index values higher than or equal to the cut-off points by age and sex for both populations by using the HOMA-IR, McAuley, and TyG indices.
2.7. Statistical Analysis
The age- and sex-specific prevalence of the different measures was calculated. Subjects were categorized by age as follows: 20–34, 35–49, and 50–64 years. The exact 95% confidence interval (95% CI) was computed for all point estimates. SPSS software version 26.0 was used for statistical analyses. Differences in prevalence were evaluated by the 95% CI presented. The difference was considered as significant at p < 0.05.
2.8. Ethical Statement
All subjects gave their informed consent for inclusion before they participated in the study. The study was conducted in accordance with the Declaration of Helsinki, and the protocol was approved by the Ethics Committee of the Hungarian Scientific Council on Health (61327-2017/EKU).
3. Results
Because the sample number planned was 500 for both populations, the response rates for completing the questionnaires were 83.4% (n = 417) in the Hungarian general population and 83.0% (n = 415) in the Roma population. The flowchart of the process of sample management (Figure 1) shows the reasons why 20 subjects from the HG and 47 from the HR populations were excluded. Ultimately, in the database created, more than half a million datapoints were entered (Figure 2) from the full records of 765 participants (397 from the HG and 368 from the HR sample).
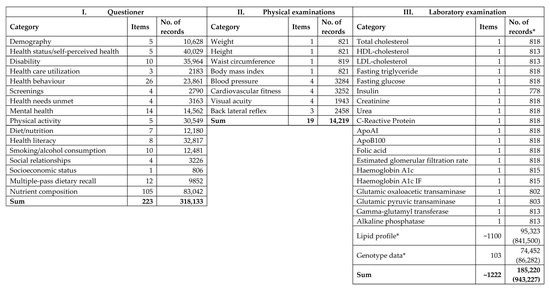
Figure 2.
Content of the database by three pillars of the survey. *: available data (expected data).
3.1. Demographic and Anthropometric Characteristics of the Samples
Differences in demographic and anthropometric characteristics were observed between the HG and HR population samples (Table 1). The representation of females was significantly higher in the HR (73.6%) than in the HG (55.4%) population. Although the age distribution of the HR sample was slightly shifted towards the youngest age group (20–34 years), no significant difference could be observed between the age distribution of the HG and HR samples. The average ages in the HG and HR populations were 44.2 and 42.8 years, respectively. Both the average weight and height were significantly higher in the HG population (77.8 kg vs. 71.9 kg and 168.7 cm vs. 161.2 cm, respectively). Thus, the average BMI values did not differ significantly.

Table 1.
Anthropometric and demographic characteristics of the study populations.
3.2. The Prevalence of MetS and Its Components in the Study Populations
The prevalence of metabolic syndrome was very high in both study populations (HG 39.8%, HR 44.0%), especially among Roma males (46.4%), but no significant difference could be shown between the two groups in either females or males (Table 2). Regarding MetS components, the prevalence of central obesity was the highest (HG 75.6%, HR 73.4%), followed by that of increased blood pressure or treated hypertension (HG 57.2%, HR 54.1%). Significant differences in the prevalence of reduced HDL-C concentration could be detected in both sexes, as well as at the population level between HG and HR groups due to the extremely high prevalence among Roma compared to the HG population (56% vs. 36.3% at population level, 47.4% vs. 32.2% for males, and 59.0% vs. 39.6% for females).
Table 2.
Prevalence of metabolic syndrome and its components in the Hungarian general (HG) and Hungarian Roma (HR) populations by ethnicity and sex.
3.3. Findings Used to Estimate the Risk of IR for MetS
Table 3 shows that regarding data defined by the questionnaire-based survey, as well as by laboratory and physical examinations and used in IR and MetS calculations, significant differences were observed in the average HDL-C concentration and systolic blood pressure; both values were significantly lower in the HR population than in the HG population (1.26 mmol/L vs. 1.37 mmol/L, 123.7 mmHg vs. 126.8 mmHg, respectively). In the case of these two parameters, significant differences were observed in subgroups without and with MetS in harmony with our previous findings on the genetic background of the high prevalence of low HDL-C concentration [20] and low prevalence of hypertension [60] among Roma in comparison with the HG population. The prevalence rates of antidiabetic and lipid-lowering therapies were significantly higher among the HR population (11.1% vs. 6.1%, 11.7% vs. 6.8%, respectively), while no significant difference was found in any of the other parameters between the study groups.
Table 3.
Mean value of biochemical and physical parameters used to estimate the risk of insulin resistance and metabolic syndrome in the Hungarian general (HG) and Hungarian Roma (HR) populations furthermore obtained on samples without and with metabolic syndrome.
Average surrogate indices calculated for the two population groups did not differ significantly. In harmony with findings on the mean TG and HDL-C concentration values, a significant difference was observed in the case of the TG/HDL-C ratio being less favourable for the HR than for the HG population (1.49 vs. 1.36, p = 0.033) (Table 4).
Table 4.
Average surrogate index values calculated for the Hungarian general (HG) and Hungarian Roma (HR) populations.
The prevalence of MetS strongly increased by age in both the HG and HR populations (Figure 3), but while it was only slightly higher in the 35–49 years age group than in the 20–34 years age group in the HG population (31.6% vs. 29.6%), a very marked increase in prevalence was observed in the 35–49 years age group in comparison with the 20–34 years age group in the HR population (46.7% vs. 26.4%).
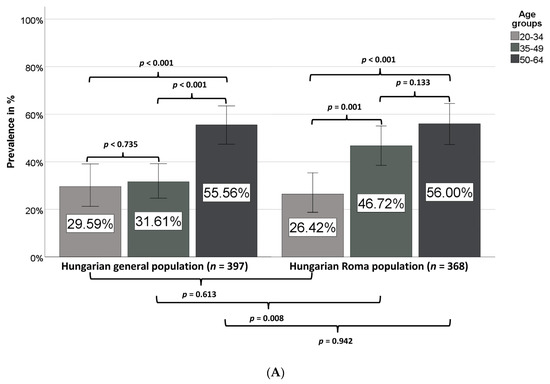
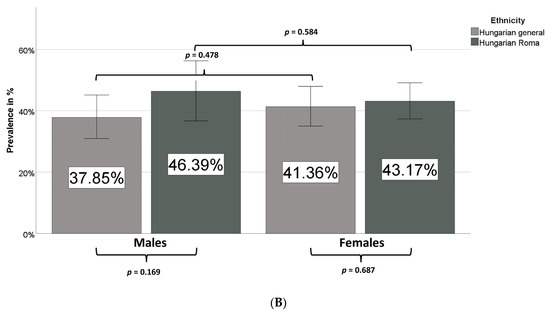
Figure 3.
Prevalence of metabolic syndrome in different age groups (A) and sexes (B) in the Hungarian general and Hungarian Roma populations.
While in the case of the Hungarian general population the prevalence of MetS is significantly increased in the age group of 50–64 years, a significant increase in MetS prevalence is observed in the age group of 35–49 years among Roma in comparison with the age group of 20–34 years (Figure 3A). No statistically significant difference was observed between males or females in the two groups (Figure 3B).
3.4. Determination of Cut-Off Points for IR Surrogate Indices
As it was shown (Table 3 and Table 4) that the mean values of both biochemical parameters and surrogate indices strongly differed between subgroups without and with MetS in both study populations and as—except for HDL-C mean values—no significant difference could be detected between the HG and HR population subgroups (without and with MetS), the sensitivity, specificity, Youden’s index and cut-off points for each surrogate measure (biochemical parameters and indices) were defined not only for HG and HR but also for the combined population.
Among the biochemical variables (Table 5A), Youden’s index was the highest (0.562) for fasting TG at 1.59 mmol/L in the combined population, with 71% sensitivity and 85% specificity to indicate MetS/IR. Among Roma, Youden’s index for fasting TG was as high as 0.605, with low sensitivity (67%) but relatively high specificity (93%). Concerning surrogate indices (Table 5B), cut-off values were determined by using Youden’s index, with results varying between 0.399 and 0.615. The cut-off values of HOMA-IR (as 2.32) and QUICKI (0.34) could be defined with relatively low sensitivity and specificity (71% and 69% for both indices, respectively) in comparison with those of the McAuley index (5.99) and TG/HDL-C ratio (1.27), with similar sensitivity (70% and 73%, respectively) but with much higher specificity (83% and 84%, respectively). The cut-off value of 4.69 with 77% sensitivity and 84% specificity for the TyG index seems to be the surrogate index with the most favourable prognostic/diagnostic performance in our study. On the basis of the results obtained by AUC analyses, the predictive power of the TyG index was found to be the highest for MetS/IR. These results are in harmony with the finding that the highest AUC value was obtained for fasting TG among the biochemical parameters used for the surrogate index calculations (Table 5).
Table 5.
The cut-off points and their sensitivity, specificity and Youden’s index calculated on the basis of area under curve for each surrogate measure—as biochemical parameters (A) and indices (B)—in the Hungarian general and Hungarian Roma populations and in the combined study population.
3.5. Prevalence of IR in the Hungarian General and Hungarian Roma Populations
The prevalence values defined varied in a relatively wide range (38.8–48.1% for HG and 40.5–53.2% for HR) by using different population-specific cut-off values and in a slightly narrower range (37.8–47.6% for HG and 40.5–47.8%) if cut-off values defined on the combined population were applied (Table 6). Except for the IR prevalence values defined by using the McAuley index in separate populations (42.6% for HG and 53.3% for HR), no significant difference was observed between the two groups. The 53.3% IR prevalence for the HR population defined by the McAuley index was exceptionally high, which was not comparable with the results obtained by using any other surrogate indices. If the McAuley index cut-off value defined on the combined population was used, the prevalence rates could be defined as 37.8% for the HG and 40.8% for the HR population. By using cut-off values obtained on the combined population, the highest prevalence values were determined by the HOMA-IR and QUICKI (47.6% for HG and 47.8% for HR, 47.1% for HG and 47.8% for HR, respectively), while the lowest prevalence values could be defined by the TG/HDL-C ratio (39.3% for HG and 40.5% for HR). The prevalence values defined by using TyG index cut-off points were barely different if the population-specific cut-off points or the cut-off points defined on combined population were used (42.3% for HG and 40.8% for HR, 42.3% for HG and 40.5% for HR, respectively).
Table 6.
Prevalence of insulin resistance (IR) and number of persons with IR in the Hungarian general and Hungarian Roma populations.
The prevalence values by age did not differ significantly between the two populations (Table 7A), except for the IR prevalence values defined by using the HOMA-IR in the age group of 50–64 years (60.4% for HG and 45.6% for HR, p = 0.015). In contrast to the expectation, increasing prevalence by age could not be detected by either the HOMA-IR (consequently by QUICKI) or the McAuley indices in the HR population; the p for trend values showed significant increases in the IR prevalence in both groups only if the TyG index was used for calculation.
Table 7.
Prevalence of insulin resistance based on the homeostasis model assessment of insulin resistance (HOMA-IR) index, McAuley index, and TyG index (calculated on the combined population) in the Hungarian general (HG, n = 397) and Hungarian Roma (HR, n = 368) populations by age group in years (A) and sex (B).
HOMA-IR-based prevalence values showed no significant differences between the two groups by sex and ethnicity. Calculations using the McAuley index indicated a higher IR prevalence in both sexes among Roma (Table 7B), but the IR prevalence values did not differ significantly between sexes in either the HG or the HR populations. TyG index-based estimates did not indicate a significant difference by ethnicity but clearly showed a higher IR prevalence among men in both groups.
As the TyG index showed the greatest power for predicting IR to estimate MetS risk in both populations, the IR/MS prevalence was defined by using TyG and was found to be as high as 42.3% and 40.5% in the HG and HR populations, respectively.
4. Discussion
In our present study, a unique database was created in which questionnaire-based survey results, physical examination and laboratory data obtained in a complex survey on participants from the general and Roma populations living in North-East Hungary were collected. The database consists of more than half a million data points available for comparative descriptive and association analyses. It is a very valuable resource not only to examine the prevalence of unhealthy conditions and susceptibility to different diseases, but also to explore the environmental and genetic factors contributing to their development. In addition to the more precise characterization of the health status and disease burden/risk of the Hungarian general population, the findings can also help to understand the unfavourable health status of Roma people. Roma—independently, where they live—represent the most vulnerable ethnic group of the European population [15,16,61], with a continuously increasing representation [62,63]. It has been thoroughly demonstrated that Roma people are overrepresented in marginalized communities and live in unhealthy environments, and their health behaviour is significantly less favourable than that of the non-Roma population [38,64,65,66]. The health of Roma can be considered as global ill health [1], based not only on the burden of rare and infectious diseases [4,5], but also on chronic non-communicable diseases of high public health importance, such as cardiometabolic diseases, which are significantly higher among them than in the majority population [7,8,9,11,12,13,67]. In addition, the access of Roma people to health care is also impaired, resulting in a broad spectrum of unmet health needs [68,69,70,71]. Although our previous studies strongly suggest increased genetic susceptibility to certain cardiometabolic diseases through leading to high prevalence of decreased HDL-C level and increased risk of thrombosis among Roma [19,20], we have found no difference between the Hungarian general and Roma populations in genetic risk for diabetes and obesity [72,73]. The admixture of Roma with West Eurasians before their exodus and during their migration period besides their admixture with Europeans is a well-known fact, but using identity-by-descent segment (IDS) analysis Melegh et al. [74] demonstrated that Roma are closer related to European populations. Central and Eastern European populations show a significantly higher share in the European ancestry of Roma than other regions of Europe. Average shared IBD segment length of Roma with Central European populations was 0.355 Mb.
Improvements in their health status would make an important contribution to the economic progress of the countries where they live with increasingly representation. The metaphor from Thomas Reid’s Essays on the Intellectual Powers of Man, published in 1785 [75], of “a chain is only as strong as its weakest link”, is also very relevant for Roma inclusion initiatives.
In our present study, as a demonstration of the usefulness of the database we have developed, the prevalence and development dynamics of insulin resistance and metabolic syndrome in the Hungarian Roma population accumulated in the North-East part of the country were investigated in comparison with these characteristics in the Hungarian general population.
In epidemiological studies, surrogate indices using anthropometric (waist circumference and blood pressure measurements) and biochemical variables, such as fasting insulin, glucose, and TG and HDL-C levels, are widely used [51,76]. While there is general agreement among the authors of myriad publications on the predictive power of different surrogate markers of IR, namely, that they adequately indicate IR and are good predictors of MetS, especially when using the International Diabetes Foundation classification, studies on different populations found different indices to be “the best”. In a Korean sample [77] and in the Cyprus Study [78], the McAuley index showed the best accuracy, while in another Korean survey [59], in a Chinese study [79], and in a White European cohort (Vascular-Metabolic CUN cohort) in Spain, the TyG index was found to have the best sensitivity and specificity to detect MetS/diabetes [80]. In a comparative study carried out by Kahn et al. [81]—in harmony with findings of initial studies [47,82] that identified TyG as a tangible marker for metabolic syndrome and underlying insulin resistance—the TyG index, with the highest AUC in comparison to fasting glucose, TG, LDL-C, non-HDL-C, and the HOMA-IR, was found to be the most efficient marker for diagnosing MetS. It was presented by the authors that the HOMA-IR showed the lowest AUC in comparison to other evaluated markers [81].
In our present study, the prevalence of MetS was very high in both study populations (HG 39.8%, HR 44.0%), especially among Roma males (46.4%), but no statistically significant difference could be shown between the two groups for either females or males. By defining the MetS prevalence by age groups, we could show that MetS arises earlier among Roma than in the HG population; while there is no significant difference in MetS prevalence between HG and HR populations in the 20–34 years age group (29.6% and 26.4%, respectively), it is significantly higher in the HR population than in the HG population in the 35–49 years age group (46.7% vs. 31.6%), i.e., in comparison with the prevalence values for the age group of 20–34 years a significant increase in MetS prevalence can be observed in the age group of 35–49 years among Roma, while in case of the HG population it can be detected only in the older age group (50–64 years). Regarding the prevalence of different MetS components, a significant difference could be detected only in the frequency of reduced HDL-C concentration, which was as high as 56% (47.4% for males and 59.0% for females) among Roma (in the HG population overall and in HG males and females, these values were 36.3%, 32.2%, and 39.6%, respectively). This finding is in accordance with previous findings on the high prevalence of participants with reduced HDL-C level not only among Hungarian Roma [83] but also in the Slovakian Roma population [48]. In our previous study, we confirmed that a genetic background exists behind this phenomenon [20]. The prevalence of central obesity was extremely high in both groups (HG 75.6%, HR 73.4%), and that of increased blood pressure or treated hypertension was also very high (HG 57.2%, HR 54.1%). It is worth mentioning that in comparison with the prevalence of hypertension, the prevalence of patients with antihypertensive medication was as low as 28.5% in the HG population and not significantly higher among Roma (31.5%), indicating a severe risk for hypertension underdiagnosis and undertreatment in both groups.
To define the prevalence of insulin resistance, we have determined the cut-off values of the five surrogate IR indices (HOMA-IR, QUICKI, McAuley, TG/HDL-C, and TyG) most frequently used in clinical and population studies for the development of MetS in separate and combined populations. Since no significant difference could be detected between the results obtained in separate and combined populations, cut-off values defined on the combined population were used for risk prediction. As the TyG had the best indicative power (cut-off value of 4.69 with 77% sensitivity and 84% specificity) for predicting IR to estimate MetS risk in both populations, the IR prevalence was defined by using TyG and was found to be as high as 42.3% and 40.5% in the HG and HR populations, respectively. The prevalence of IR is consistent with that of MetS—slightly higher in the HG and slightly lower in the HR population, but the differences were not significant. It is important to mention that the increase in MetS prevalence by age as a significant trend in both groups could be detected only by the TyG index at the level of IR. Consequently, we can propose the TyG index instead of other surrogate indices to estimate the risk of IR as having indicative power for MetS development.
The only survey that is comparable with our present one—in which data were collected via questionnaire, anthropometric measures and analysed blood and urine samples—was named HepaMeta and was carried out in 2011 in Eastern Slovakia to define the prevalence of Hepatitis B/C and metabolic syndrome in populations living in segregated Roma colonies in comparison with the general Slovakian population [84]. In the HepaMeta study, Roma and non-Roma participants aged between 18 and 55 years were enrolled, and MetS was found to be more common in the Roma than in the general population (29.6% vs. 20.1%, respectively, p < 0.0001) [85]. Although the Slovakian researchers used the same (IDF) criteria to identify individuals with MetS, their findings strongly differed from ours. The main reasons for the difference in data on MetS prevalence might be as follows:
(a) The Slovakian researchers recruited participants aged 18–55 years (i.e., their study population was roughly a decade younger than ours), which may result in the significantly higher MetS prevalence among Roma than non-Roma populations observed in the Slovakian study. As we show in our present study, the age of MetS onset is significantly lower among Roma (the MetS prevalence in the age group of 35–49 years is 46.7% among Hungarian Roma and 31.6% in the HG population, while the prevalence in the 50–64 year age group is almost the same in the two populations).
(b) In addition, the prevalence of central obesity is significantly higher among Slovakian Roma than in the majority population (58.9% vs. 45.8%), while no significant difference was observed between the two populations in our study. In addition, the prevalence of reduced HDL-C was found to be double among Roma in comparison with their non-Roma counterparts (70% in the Roma population and 34.9% among non-Roma). In our study, the relevant prevalence values were 56% vs. 36.3% (i.e., the ratio is 1.54).
(c) The Slovakian study was carried out in 2011, while our present survey was conducted in 2018. In our previous study, which was performed in a representative random sample of the Roma population aged 20–64 years living in segregated colonies in North-East Hungary in 2011 (i.e., in the very same year as the Slovakian HepaMeta study), the prevalence of central obesity was much lower in the Roma population both in absolute value and in comparison with the general population [83]. Consequently, the prevalence of MetS was also much lower in the sample from 2011 than in our present study in both the Roma and the general populations (36.4% and 35% in 2011 and 44% and 39.8% in 2018, respectively). This finding is consistent with the results of our comparative analysis on data of two Roma surveys carried out before and after the Decade of Roma Inclusion (in 2004 and 2015), in which we demonstrated that obesity among Roma (especially in the younger age groups) became significantly more frequent during that decade [8].
The main strength of our present study is that, as an outcome of a complex health (behaviour and examination) survey among Roma living in colonies in North-East Hungary and their surrounding general Hungarian population, a very valuable database was created that can be used in comparative and association studies. By using selected data, the prevalence of insulin resistance was first defined in Roma and the general Hungarian populations by comparing the results obtained after defining the cut-off values for different surrogate indices and identifying the index with the best indicative power to estimate the risk of the development of metabolic syndrome.
The major limitation of the study is that females are overrepresented in the Roma sample. This cross-sectional survey was based on randomly selected households, and in many households, only women were home during the day when most visits took place, while men had travelled at least locally for public work. The Hungarian government quadrupled the budget for public works between 2010 and 2015 for all Hungarian municipalities. This is especially relevant for villages in the North-eastern region of Hungary, where segregated Roma settlements are concentrated. The majority of workers participating in the programme are men from deprived Roma communities. In addition, elderly (aged over 65 years) citizens are not represented in the sample. As determined in our previous Roma surveys [8,64,83], the representation of people over 65 years was as low as 3–4%. Thus, the size of the strata 65-X was too small to make reliable conclusions for this subgroup of the population. Among the limitations it is also worth mentioning that the data obtained among Roma were compared to the data on the Hungarian general population, one of the most obese adult (15+ years) populations (with 62.3% prevalence of overweight/obesity) among OECD countries [8,62,64,83], which may lead to an underestimation of the difference between the two populations.
5. Conclusions
The prevalence of IR, as well as that of MetS, which are the most robust indicators for the risk of cardiometabolic diseases, do not differ significantly between the Hungarian Roma population and the Hungarian general population. These values are almost equally unfavourable for both groups, but the premature mortality of Roma is much higher, as indicated by the very low representation of the 65-X age group among Roma in our previous studies. The findings clearly indicate that the access of Roma people to health services (including both preventive and curative services) should be closely evaluated and inequities urgently targeted by effective interventions.
Author Contributions
Conceptualization, R.Á.; Data curation, P.P. and Z.K.; Formal analysis, P.P.; Funding acquisition, R.Á.; Investigation, R.Á., P.P., S.F., Z.K., J.S., K.K., G.P., O.V., and M.B.; Methodology, P.P., J.S., É.B., K.K., G.P., É.B.B., I.V.-B., and K.B.; Project administration, M.B.; Supervision, R.Á.; Validation, P.P., S.F., J.S., and É.B.; Writing—original draft, R.Á.; Writing—review & editing, R.Á. All authors have read and agreed to the published version of the manuscript.
Funding
The project was co-financed by the European Union under European Regional Development Fund (GINOP-2.3.2-15-2016-00005), as well as by the Hungarian Academy of Sciences (MTA11010 and TK2016-78).
Conflicts of Interest
The authors declare no conflict of interest.
References
- European Commission. Health Status of the Roma Population. Data Collection in the Member States of the European Union; European Commission: Brussels, Belgium, 2014; ISBN 978-92-79-37904-8. [Google Scholar]
- Adany, R. Roma health is global ill health. Eur. J. Public Health 2014, 24, 702–703. [Google Scholar] [CrossRef] [PubMed]
- Farkas, L. Data Collection in the Field of Ethnicity; Publications Office of the European Union, European Commission: Luxembourg, 2017; ISBN 978-92-79-66084-9. [Google Scholar]
- Fernandez-Feito, A.; Pesquera-Cabezas, R.; Gonzalez-Cobo, C.; Prieto-Salceda, M.D. What do we know about the health of Spanish Roma people and what has been done to improve it? A scoping review. Ethn. Health 2019, 24, 224–243. [Google Scholar] [CrossRef] [PubMed]
- Ivanov, I.S.; Azmanov, D.N.; Ivanova, M.B.; Chamova, T.; Pacheva, I.H.; Panova, M.V.; Song, S.; Morar, B.; Yordanova, R.V.; Galabova, F.K.; et al. Founder p.Arg 446* mutation in the PDHX gene explains over half of cases with congenital lactic acidosis in Roma children. Mol. Genet. Metab. 2014, 113, 76–83. [Google Scholar] [CrossRef]
- Dotcho, M. The Health Situation of Roma Communities: Analysis of the Data from the UNDP/World Bank/EC Regional Roma Survey; UNDP Europe and the CIS, Bratislava Regional Centre, Valeur, s. r. o.: Dunajská Streda, Slovak Republic, 2012; ISBN 978-92-95092-60-0. [Google Scholar]
- Ekmekci, P.E. Health and Roma People in Turkey. Balkan Med. J. 2016, 33, 377–382. [Google Scholar] [CrossRef] [PubMed]
- Sandor, J.; Kosa, Z.; Boruzs, K.; Boros, J.; Tokaji, I.; McKee, M.; Adany, R. The decade of Roma Inclusion: Did it make a difference to health and use of health care services? Int. J. Public Health 2017, 62, 803–815. [Google Scholar] [CrossRef] [PubMed]
- Belak, A.; Madarasova Geckova, A.; van Dijk, J.P.; Reijneveld, S.A. Health-endangering everyday settings and practices in a rural segregated Roma settlement in Slovakia: A descriptive summary from an exploratory longitudinal case study. BMC Public Health 2017, 17, 128. [Google Scholar] [CrossRef]
- Weiss, E.; Japie, C.; Balahura, A.M.; Bartos, D.; Badila, E. Cardiovascular risk factors in a Roma sample population from Romania. Rom. J. Intern. Med. 2018, 56, 193–202. [Google Scholar] [CrossRef]
- Babinska, I.; Veselska, Z.D.; Bobakova, D.; Pella, D.; Panico, S.; Reijneveld, S.A.; Jarcuska, P.; Jarcuska, P.; Zezula, I.; Geckova, A.M.; et al. Is the cardiovascular risk profile of people living in Roma settlements worse in comparison with the majority population in Slovakia? Int. J. Public Health 2013, 58, 417–425. [Google Scholar] [CrossRef]
- Zeljko, H.M.; Skaric-Juric, T.; Narancic, N.S.; Baresic, A.; Tomas, Z.; Petranovic, M.Z.; Milicic, J.; Salihovic, M.P.; Janicijevic, B. Age trends in prevalence of cardiovascular risk factors in Roma minority population of Croatia. Econ. Hum. Biol. 2013, 11, 326–336. [Google Scholar] [CrossRef]
- Nunes, M.A.; Kucerova, K.; Lukac, O.; Kvapil, M.; Broz, J. Prevalence of Diabetes Mellitus among Roma Populations-A Systematic Review. Int. J. Environ. Res. Public Health 2018, 15, 2607. [Google Scholar] [CrossRef]
- Janevic, T.; Jankovic, J.; Bradley, E. Socioeconomic position, gender, and inequalities in self-rated health between Roma and non-Roma in Serbia. Int. J. Public Health 2012, 57, 49–55. [Google Scholar] [CrossRef] [PubMed]
- Sarvary, A.; Kosa, Z.; Javorne, R.E.; Gyulai, A.; Takacs, P.; Sandor, J.; Sarvary, A.; Nemeth, A.; Halmai, R.; Adany, R. Socioeconomic status, health related behaviour, and self-rated health of children living in Roma settlements in Hungary. Cent. Eur. J. Public Health 2019, 27, 24–31. [Google Scholar] [CrossRef] [PubMed]
- La Parra-Casado, D.; Mosquera, P.A.; Vives-Cases, C.; San Sebastian, M. Socioeconomic Inequalities in the Use of Healthcare Services: Comparison between the Roma and General Populations in Spain. Int. J. Environ. Res. Public Health 2018, 15, 121. [Google Scholar] [CrossRef] [PubMed]
- Voko, Z.; Csepe, P.; Nemeth, R.; Kosa, K.; Kosa, Z.; Szeles, G.; Adany, R. Does socioeconomic status fully mediate the effect of ethnicity on the health of Roma people in Hungary? J. Epidemiol. Community Health 2009, 63, 455–460. [Google Scholar] [CrossRef] [PubMed]
- Duval, L.; Wolff, F.C.; McKee, M.; Roberts, B. The Roma vaccination gap: Evidence from twelve countries in Central and South-East Europe. Vaccine 2016, 34, 5524–5530. [Google Scholar] [CrossRef] [PubMed]
- Fiatal, S.; Piko, P.; Kosa, Z.; Sandor, J.; Adany, R. Genetic profiling revealed an increased risk of venous thrombosis in the Hungarian Roma population. Thromb. Res. 2019, 179, 37–44. [Google Scholar] [CrossRef]
- Piko, P.; Fiatal, S.; Kosa, Z.; Sandor, J.; Adany, R. Genetic factors exist behind the high prevalence of reduced high-density lipoprotein cholesterol levels in the Roma population. Atherosclerosis 2017, 263, 119–126. [Google Scholar] [CrossRef]
- Sipeky, C.; Weber, A.; Szabo, M.; Melegh, B.I.; Janicsek, I.; Tarlos, G.; Szabo, I.; Sumegi, K.; Melegh, B. High prevalence of CYP2C19*2 allele in Roma samples: Study on Roma and Hungarian population samples with review of the literature. Mol. Biol. Rep. 2013, 40, 4727–4735. [Google Scholar] [CrossRef]
- Grundy, S.M.; Brewer, H.B., Jr.; Cleeman, J.I.; Smith, S.C., Jr.; Lenfant, C.; American Heart, A.; National Heart, L.; Blood, I. Definition of metabolic syndrome: Report of the National Heart, Lung, and Blood Institute/American Heart Association conference on scientific issues related to definition. Circulation 2004, 109, 433–438. [Google Scholar] [CrossRef]
- WHO: Non communicable diseases. Key Facts. 2018. Available online: https://www.who.int/news-room/fact-sheets/detail/noncommunicable-diseases (accessed on 17 June 2020).
- Roberts, C.K.; Hevener, A.L.; Barnard, R.J. Metabolic syndrome and insulin resistance: Underlying causes and modification by exercise training. Compr. Physiol. 2013, 3, 1–58. [Google Scholar] [CrossRef]
- Reaven, G.M. Insulin resistance and compensatory hyperinsulinemia: Role in hypertension, dyslipidemia, and coronary heart disease. Am. Heart J. 1991, 121, 1283–1288. [Google Scholar] [CrossRef]
- Petersen, M.C.; Shulman, G.I. Mechanisms of Insulin Action and Insulin Resistance. Physiol. Rev. 2018, 98, 2133–2223. [Google Scholar] [CrossRef] [PubMed]
- Ferrannini, E.; Haffner, S.M.; Mitchell, B.D.; Stern, M.P. Hyperinsulinaemia: The key feature of a cardiovascular and metabolic syndrome. Diabetologia 1991, 34, 416–422. [Google Scholar] [CrossRef] [PubMed]
- Ford, E.S. Risks for all-cause mortality, cardiovascular disease, and diabetes associated with the metabolic syndrome: A summary of the evidence. Diabetes Care 2005, 28, 1769–1778. [Google Scholar] [CrossRef]
- Wang, W.; Wang, K.; Li, T.; Xiang, H.; Ma, L.; Fu, Z.; Chen, J.; Liu, Z.; Bai, J.; Feng, J.; et al. A discussion on utility and purposed value of obesity and abdomen obesity when body mass index, waist circumference, waist to hip ratio used as indexes predicting hypertension and hyper-blood glucose. Zhonghua Liu Xing Bing Xue Za Zhi 2002, 23, 16–19. [Google Scholar]
- Fan, H.; Zhang, P.R.; Xu, Y. Relationship between non-alcohol fatty liver disease and insulin resistance/cardiovascular diseases in patients with type 2 diabetes mellitus. Chin. Gen. Pract. 2011, 14, 147–150. [Google Scholar]
- Andrew, J.K.; Graham, A.H. The Expanding Pathogenic Role of Insulin Resistance in Human Disease. Diabet. Med. 2014. [Google Scholar] [CrossRef]
- Semenkovich, C.F. Insulin Resistance and a Long, Strange Trip. N. Engl. J. Med. 2016, 374, 1378–1379. [Google Scholar] [CrossRef]
- Zhou, M.S.; Wang, A.; Yu, H. Link between insulin resistance and hypertension: What is the evidence from evolutionary biology? Diabetol. Metab. Syndr. 2014, 6, 12. [Google Scholar] [CrossRef]
- Cho, J.; Hong, H.; Park, S.; Kim, S.; Kang, H. Insulin Resistance and Its Association with Metabolic Syndrome in Korean Children. Biomed. Res. Int. 2017, 2017, 8728017. [Google Scholar] [CrossRef]
- Brown, A.E.; Walker, M. Genetics of Insulin Resistance and the Metabolic Syndrome. Curr. Cardiol. Rep. 2016, 18, 75. [Google Scholar] [CrossRef] [PubMed]
- Brede, S.; Serfling, G.; Klement, J.; Schmid, S.M.; Lehnert, H. Clinical Scenario of the Metabolic Syndrome. Visc. Med. 2016, 32, 336–341. [Google Scholar] [CrossRef] [PubMed]
- Mansyur, M.A.; Bakri, S.; Patellongi, I.J.; Rahman, I.A. The association between metabolic syndrome components, low-grade systemic inflammation and insulin resistance in non-diabetic Indonesian adolescent male. Clin. Nutr. ESPEN 2020, 35, 69–74. [Google Scholar] [CrossRef] [PubMed]
- Kosa, K.; Darago, L.; Adany, R. Environmental survey of segregated habitats of Roma in Hungary: A way to be empowering and reliable in minority research. Eur. J. Public Health 2011, 21, 463–468. [Google Scholar] [CrossRef]
- Szeles, G.; Voko, Z.; Jenei, T.; Kardos, L.; Pocsai, Z.; Bajtay, A.; Papp, E.; Pasti, G.; Kosa, Z.; Molnar, I.; et al. A preliminary evaluation of a health monitoring programme in Hungary. Eur. J. Public Health 2005, 15, 26–32. [Google Scholar] [CrossRef]
- European Health Interview Survey (EHIS wave 2) Methodological Manual; Publications Office of the European Union, European Commission Eurostat: Luxembourg, 2013; ISBN 978-92-79-29424-2.
- Goldberg, D.P.; Gater, R.; Sartorius, N.; Ustun, T.B.; Piccinelli, M.; Gureje, O.; Rutter, C. The validity of two versions of the GHQ in the WHO study of mental illness in general health care. Psychol. Med. 1997, 27, 191–197. [Google Scholar] [CrossRef]
- Örkényi, Á. Lelki Egészség (Mental Health); Országos Epidemiológiai Központ: Budapest, Hungary, 2005. [Google Scholar]
- Saunders, J.B.; Aasland, O.G.; Babor, T.F.; de la Fuente, J.R.; Grant, M. Development of the Alcohol Use Disorders Identification Test (AUDIT): WHO Collaborative Project on Early Detection of Persons with Harmful Alcohol Consumption--II. Addiction 1993, 88, 791–804. [Google Scholar] [CrossRef]
- Babor, T.F.; Higgins-Biddle, J.C.; Saunders, J.B.; Monteiro, M.G. AUDIT: The Alcohol Use Disorders Identification Test: Guidelines for Use in Primary Care, 2nd ed.; World Health Organization: Geneva, Switzerland, 2001. [Google Scholar]
- Reinert, D.F.; Allen, J.P. The alcohol use disorders identification test: An update of research findings. Alcohol. Clin. Exp. Res. 2007, 31, 185–199. [Google Scholar] [CrossRef]
- Hagstromer, M.; Oja, P.; Sjostrom, M. The International Physical Activity Questionnaire (IPAQ): A study of concurrent and construct validity. Public Health Nutr. 2006, 9, 755–762. [Google Scholar] [CrossRef]
- Simental-Mendia, L.E.; Rodriguez-Moran, M.; Guerrero-Romero, F. The product of fasting glucose and triglycerides as surrogate for identifying insulin resistance in apparently healthy subjects. Metab. Syndr. Relat. Disord. 2008, 6, 299–304. [Google Scholar] [CrossRef]
- Hubkova, B.; Maslankova, J.; Stupak, M.; Guzy, J.; Kovacova, A.; Pella, D.; Jarcuska, P.; Marekova, M.; HepaMeta, T. Assessment of clinical biochemical parameters in Roma minority residing in eastern Slovakia compared with the majority population. Cent. Eur. J. Public Health 2014, 22, S12–S17. [Google Scholar] [CrossRef]
- DeFronzo, R.A.; Tobin, J.D.; Andres, R. Glucose clamp technique: A method for quantifying insulin secretion and resistance. Am. J. Physiol. 1979, 237, E214–E223. [Google Scholar] [CrossRef] [PubMed]
- Bonora, E.; Targher, G.; Alberiche, M.; Bonadonna, R.C.; Saggiani, F.; Zenere, M.B.; Monauni, T.; Muggeo, M. Homeostasis model assessment closely mirrors the glucose clamp technique in the assessment of insulin sensitivity: Studies in subjects with various degrees of glucose tolerance and insulin sensitivity. Diabetes Care 2000, 23, 57–63. [Google Scholar] [CrossRef] [PubMed]
- Singh, B.; Saxena, A. Surrogate markers of insulin resistance: A review. World J. Diabetes 2010, 1, 36–47. [Google Scholar] [CrossRef] [PubMed]
- Matthews, D.R.; Hosker, J.P.; Rudenski, A.S.; Naylor, B.A.; Treacher, D.F.; Turner, R.C. Homeostasis model assessment: Insulin resistance and beta-cell function from fasting plasma glucose and insulin concentrations in man. Diabetologia 1985, 28, 412–419. [Google Scholar] [CrossRef]
- Katz, A.; Nambi, S.S.; Mather, K.; Baron, A.D.; Follmann, D.A.; Sullivan, G.; Quon, M.J. Quantitative insulin sensitivity check index: A simple, accurate method for assessing insulin sensitivity in humans. J. Clin. Endocrinol. Metab. 2000, 85, 2402–2410. [Google Scholar] [CrossRef]
- McAuley, K.A.; Williams, S.M.; Mann, J.I.; Walker, R.J.; Lewis-Barned, N.J.; Temple, L.A.; Duncan, A.W. Diagnosing insulin resistance in the general population. Diabetes Care 2001, 24, 460–464. [Google Scholar] [CrossRef]
- Guerrero-Romero, F.; Simental-Mendia, L.E.; Gonzalez-Ortiz, M.; Martinez-Abundis, E.; Ramos-Zavala, M.G.; Hernandez-Gonzalez, S.O.; Jacques-Camarena, O.; Rodriguez-Moran, M. The product of triglycerides and glucose, a simple measure of insulin sensitivity. Comparison with the euglycemic-hyperinsulinemic clamp. J. Clin. Endocrinol. Metab. 2010, 95, 3347–3351. [Google Scholar] [CrossRef]
- Roa Barrios, M.; Arata-Bellabarba, G.; Valeri, L.; Velazquez-Maldonado, E. Relationship between the triglyceride/high-density lipoprotein-cholesterol ratio, insulin resistance index and cardiometabolic risk factors in women with polycystic ovary syndrome. Endocrinol. Nutr. 2009, 56, 59–65. [Google Scholar] [CrossRef]
- McLaughlin, T.; Reaven, G.; Abbasi, F.; Lamendola, C.; Saad, M.; Waters, D.; Simon, J.; Krauss, R.M. Is there a simple way to identify insulin-resistant individuals at increased risk of cardiovascular disease? Am. J. Cardiol. 2005, 96, 399–404. [Google Scholar] [CrossRef]
- Ruopp, M.D.; Perkins, N.J.; Whitcomb, B.W.; Schisterman, E.F. Youden Index and optimal cut-point estimated from observations affected by a lower limit of detection. Biom. J. 2008, 50, 419–430. [Google Scholar] [CrossRef] [PubMed]
- Moon, S.; Park, J.H.; Jang, E.J.; Park, Y.K.; Yu, J.M.; Park, J.S.; Ahn, Y.; Choi, S.H.; Yoo, H.J. The Cut-off Values of Surrogate Measures for Insulin Sensitivity in a Healthy Population in Korea according to the Korean National Health and Nutrition Examination Survey (KNHANES) 2007-2010. J. Korean Med. Sci. 2018, 33, e197. [Google Scholar] [CrossRef] [PubMed]
- Soltesz, B.; Piko, P.; Sandor, J.; Kosa, Z.; Adany, R.; Fiatal, S. The genetic risk for hypertension is lower among the Hungarian Roma population compared to the general population. PLoS ONE 2020, 15, e0234547. [Google Scholar] [CrossRef] [PubMed]
- Kuhlbrandt, C.; Footman, K.; Rechel, B.; McKee, M. An examination of Roma health insurance status in Central and Eastern Europe. Eur. J. Public Health 2014, 24, 707–712. [Google Scholar] [CrossRef] [PubMed]
- OECD Economic Surveys: Slovak Republic 2019; OECD Publishing: Paris, France, 2019. [CrossRef]
- Pasztor, I.; Penzes, J.; Tatrai, P.; Pálóczi, Á. The number and spatial distribution of the Roma population in Hungary—in the light of different approaches. Folia Geogr. 2016, 58, 5–21. [Google Scholar]
- Kosa, Z.; Szeles, G.; Kardos, L.; Kosa, K.; Nemeth, R.; Orszagh, S.; Fesus, G.; McKee, M.; Adany, R.; Voko, Z. A comparative health survey of the inhabitants of Roma settlements in Hungary. Am. J. Public Health 2007, 97, 853–859. [Google Scholar] [CrossRef]
- Toth, M.D.; Adam, S.; Zonda, T.; Birkas, E.; Purebl, G. Risk factors for multiple suicide attempts among Roma in Hungary. Transcult. Psychiatry 2018, 55, 55–72. [Google Scholar] [CrossRef]
- Paulik, E.; Nagymajtenyi, L.; Easterling, D.; Rogers, T. Smoking behaviour and attitudes of Hungarian Roma and non-Roma population towards tobacco control policies. Int. J. Public Health 2011, 56, 485–491. [Google Scholar] [CrossRef]
- Vincze, F.; Foldvari, A.; Palinkas, A.; Sipos, V.; Janka, E.A.; Adany, R.; Sandor, J. Prevalence of Chronic Diseases and Activity-Limiting Disability among Roma and Non-Roma People: A Cross-Sectional, Census-Based Investigation. Int. J. Environ. Res. Public Health 2019, 16, 3620. [Google Scholar] [CrossRef]
- Arora, V.S.; Kuhlbrandt, C.; McKee, M. An examination of unmet health needs as perceived by Roma in Central and Eastern Europe. Eur. J. Public Health 2016, 26, 737–742. [Google Scholar] [CrossRef]
- Sandor, J.; Nagy, A.; Foldvari, A.; Szabo, E.; Csenteri, O.; Vincze, F.; Sipos, V.; Kovacs, N.; Palinkas, A.; Papp, M.; et al. Delivery of cardio-metabolic preventive services to Hungarian Roma of different socio-economic strata. Fam. Pract. 2017, 34, 83–89. [Google Scholar] [CrossRef] [PubMed]
- Sudzinova, A.; Nagyova, I.; Studencan, M.; Rosenberger, J.; Skodova, Z.; Vargova, H.; Middel, B.; Reijneveld, S.A.; van Dijk, J.P. Roma coronary heart disease patients have more medical risk factors and greater severity of coronary heart disease than non-Roma. Int. J. Public Health 2013, 58, 409–415. [Google Scholar] [CrossRef]
- Kolvek, G.; Rosicova, K.; Rosenberger, J.; Podracka, L.; Stewart, R.E.; Nagyova, I.; Reijneveld, S.A.; van Dijk, J.P. End-stage renal disease among Roma and non-Roma: Roma are at risk. Int. J. Public Health 2012, 57, 751–754. [Google Scholar] [CrossRef] [PubMed]
- Werissa, N.A.; Piko, P.; Fiatal, S.; Kosa, Z.; Sandor, J.; Adany, R. SNP-Based Genetic Risk Score Modeling Suggests No Increased Genetic Susceptibility of the Roma Population to Type 2 Diabetes Mellitus. Genes 2019, 10, 942. [Google Scholar] [CrossRef] [PubMed]
- Nagy, K.; Fiatal, S.; Sandor, J.; Adany, R. Distinct Penetrance of Obesity-Associated Susceptibility Alleles in the Hungarian General and Roma Populations. Obes. Facts 2017, 10, 444–457. [Google Scholar] [CrossRef]
- Melegh, B.I.; Banfai, Z.; Hadzsiev, K.; Miseta, A.; Melegh, B. Refining the South Asian Origin of the Romani people. BMC Genet. 2017, 18, 82. [Google Scholar] [CrossRef]
- Reid, T. Essays on the Intellectual Powers of Man; J. Bartlett: Edinburgh, UK, 1785. [Google Scholar]
- Antoniolli, L.P.; Nedel, B.L.; Pazinato, T.C.; de Andrade Mesquita, L.; Gerchman, F. Accuracy of insulin resistance indices for metabolic syndrome: A cross-sectional study in adults. Diabetol. Metab. Syndr. 2018, 10, 65. [Google Scholar] [CrossRef]
- Kim, T.J.; Kim, H.J.; Kim, Y.B.; Lee, J.Y.; Lee, H.S.; Hong, J.H.; Lee, J.W. Comparison of Surrogate Markers as Measures of Uncomplicated Insulin Resistance in Korean Adults. Korean J. Fam. Med. 2016, 37, 188–196. [Google Scholar] [CrossRef][Green Version]
- Kouis, P.; Griffin, M.; Nicolaides, A.; Panayiotou, A. A comparison of different Insulin Resistance indices for the prediction of the Metabolic Syndrome. Eur. J. Public Health 2016, 26. [Google Scholar] [CrossRef]
- Yu, X.; Wang, L.; Zhang, W.; Ming, J.; Jia, A.; Xu, S.; Li, Q.; Ji, Q. Fasting triglycerides and glucose index is more suitable for the identification of metabolically unhealthy individuals in the Chinese adult population: A nationwide study. J. Diabetes Investig. 2019, 10, 1050–1058. [Google Scholar] [CrossRef]
- Navarro-Gonzalez, D.; Sanchez-Inigo, L.; Pastrana-Delgado, J.; Fernandez-Montero, A.; Martinez, J.A. Triglyceride-glucose index (TyG index) in comparison with fasting plasma glucose improved diabetes prediction in patients with normal fasting glucose: The Vascular-Metabolic CUN cohort. Prev. Med. 2016, 86, 99–105. [Google Scholar] [CrossRef] [PubMed]
- Khan, S.H.; Sobia, F.; Niazi, N.K.; Manzoor, S.M.; Fazal, N.; Ahmad, F. Metabolic clustering of risk factors: Evaluation of Triglyceride-glucose index (TyG index) for evaluation of insulin resistance. Diabetol. Metab. Syndr. 2018, 10, 74. [Google Scholar] [CrossRef] [PubMed]
- Abbasi, F.; Reaven, G.M. Comparison of two methods using plasma triglyceride concentration as a surrogate estimate of insulin action in nondiabetic subjects: Triglycerides x glucose versus triglyceride/high-density lipoprotein cholesterol. Metabolism 2011, 60, 1673–1676. [Google Scholar] [CrossRef] [PubMed]
- Kosa, Z.; Moravcsik-Kornyicki, A.; Dioszegi, J.; Roberts, B.; Szabo, Z.; Sandor, J.; Adany, R. Prevalence of metabolic syndrome among Roma: A comparative health examination survey in Hungary. Eur. J. Public Health 2015, 25, 299–304. [Google Scholar] [CrossRef] [PubMed]
- Geckova, A.M.; Jarcuska, P.; Marekova, M.; Pella, D.; Siegfried, L.; Jarcuska, P.; Halanova, M.; HepaMeta, T. Hepameta—Prevalence of hepatitis B/C and metabolic syndrome in population living in separated and segregated Roma settlements: A methodology for a cross-sectional population-based study using community-based approach. Cent. Eur. J. Public Health 2014, 22, S6–S11. [Google Scholar] [CrossRef]
- Macejova, Z.; Kristian, P.; Janicko, M.; Halanova, M.; Drazilova, S.; Antolova, D.; Marekova, M.; Pella, D.; Madarasova-Geckova, A.; Jarcuska, P.; et al. The Roma Population Living in Segregated Settlements in Eastern Slovakia Has a Higher Prevalence of Metabolic Syndrome, Kidney Disease, Viral Hepatitis B and E, and Some Parasitic Diseases Compared to the Majority Population. Int. J. Environ. Res. Public Health 2020, 17, 3112. [Google Scholar] [CrossRef]


© 2020 by the authors. Licensee MDPI, Basel, Switzerland. This article is an open access article distributed under the terms and conditions of the Creative Commons Attribution (CC BY) license (http://creativecommons.org/licenses/by/4.0/).