Awareness and Knowledge Regarding the Consumption of Dietary Fiber and Its Relation to Self-Reported Health Status in an Adult Arab Population: A Cross-Sectional Study

 , , , ,
Abstract
:1. Introduction
2. Materials and Methods
2.1. Study Design and Participants
2.2. Questionnaires, Data Collection and Measurements
- Socio-demographic characteristics including sex, age, marital status, family income, educational qualification, etc.
- Consumption of DF sources where participants had to indicate how often he or she consumes a selected list (30 items) of fiber-rich foods. The options were “don’t consume”, “less than once a week”, “1–2 times a week”, “≥3 times a week”, “daily”. Data were presented in the table as the frequency of participants consuming these food items regularly (≥3 times per week), rarely (twice or less a week) and those who do not consume at all.
- Knowledge about DF and their health impacts, and the preference of food choices while eating out/having fast foods. The interviewer assessed the knowledge of the participants by asking about the relation of DF in health conditions like cardiovascular diseases, obesity, diabetes, high cholesterol etc.; sources of DF in food; and the preference of food items while eating out.
- Reasons for the lack of DF in their diet. The participants had to answer whether they thought foods rich in DF were expensive; or foods rich in DF had limited health benefits; or whether they did not like the taste; or whether they had a perception of them not being readily available.
- Self-reported health status of the study participants, including diabetes, obesity, high cholesterol, hypertension etc.
2.3. Statistical Analysis
3. Results
3.1. Socio-Demographic Characteristics of the Study Participants
3.2. Consumption of Fiber-Rich Foods by the Study Participants
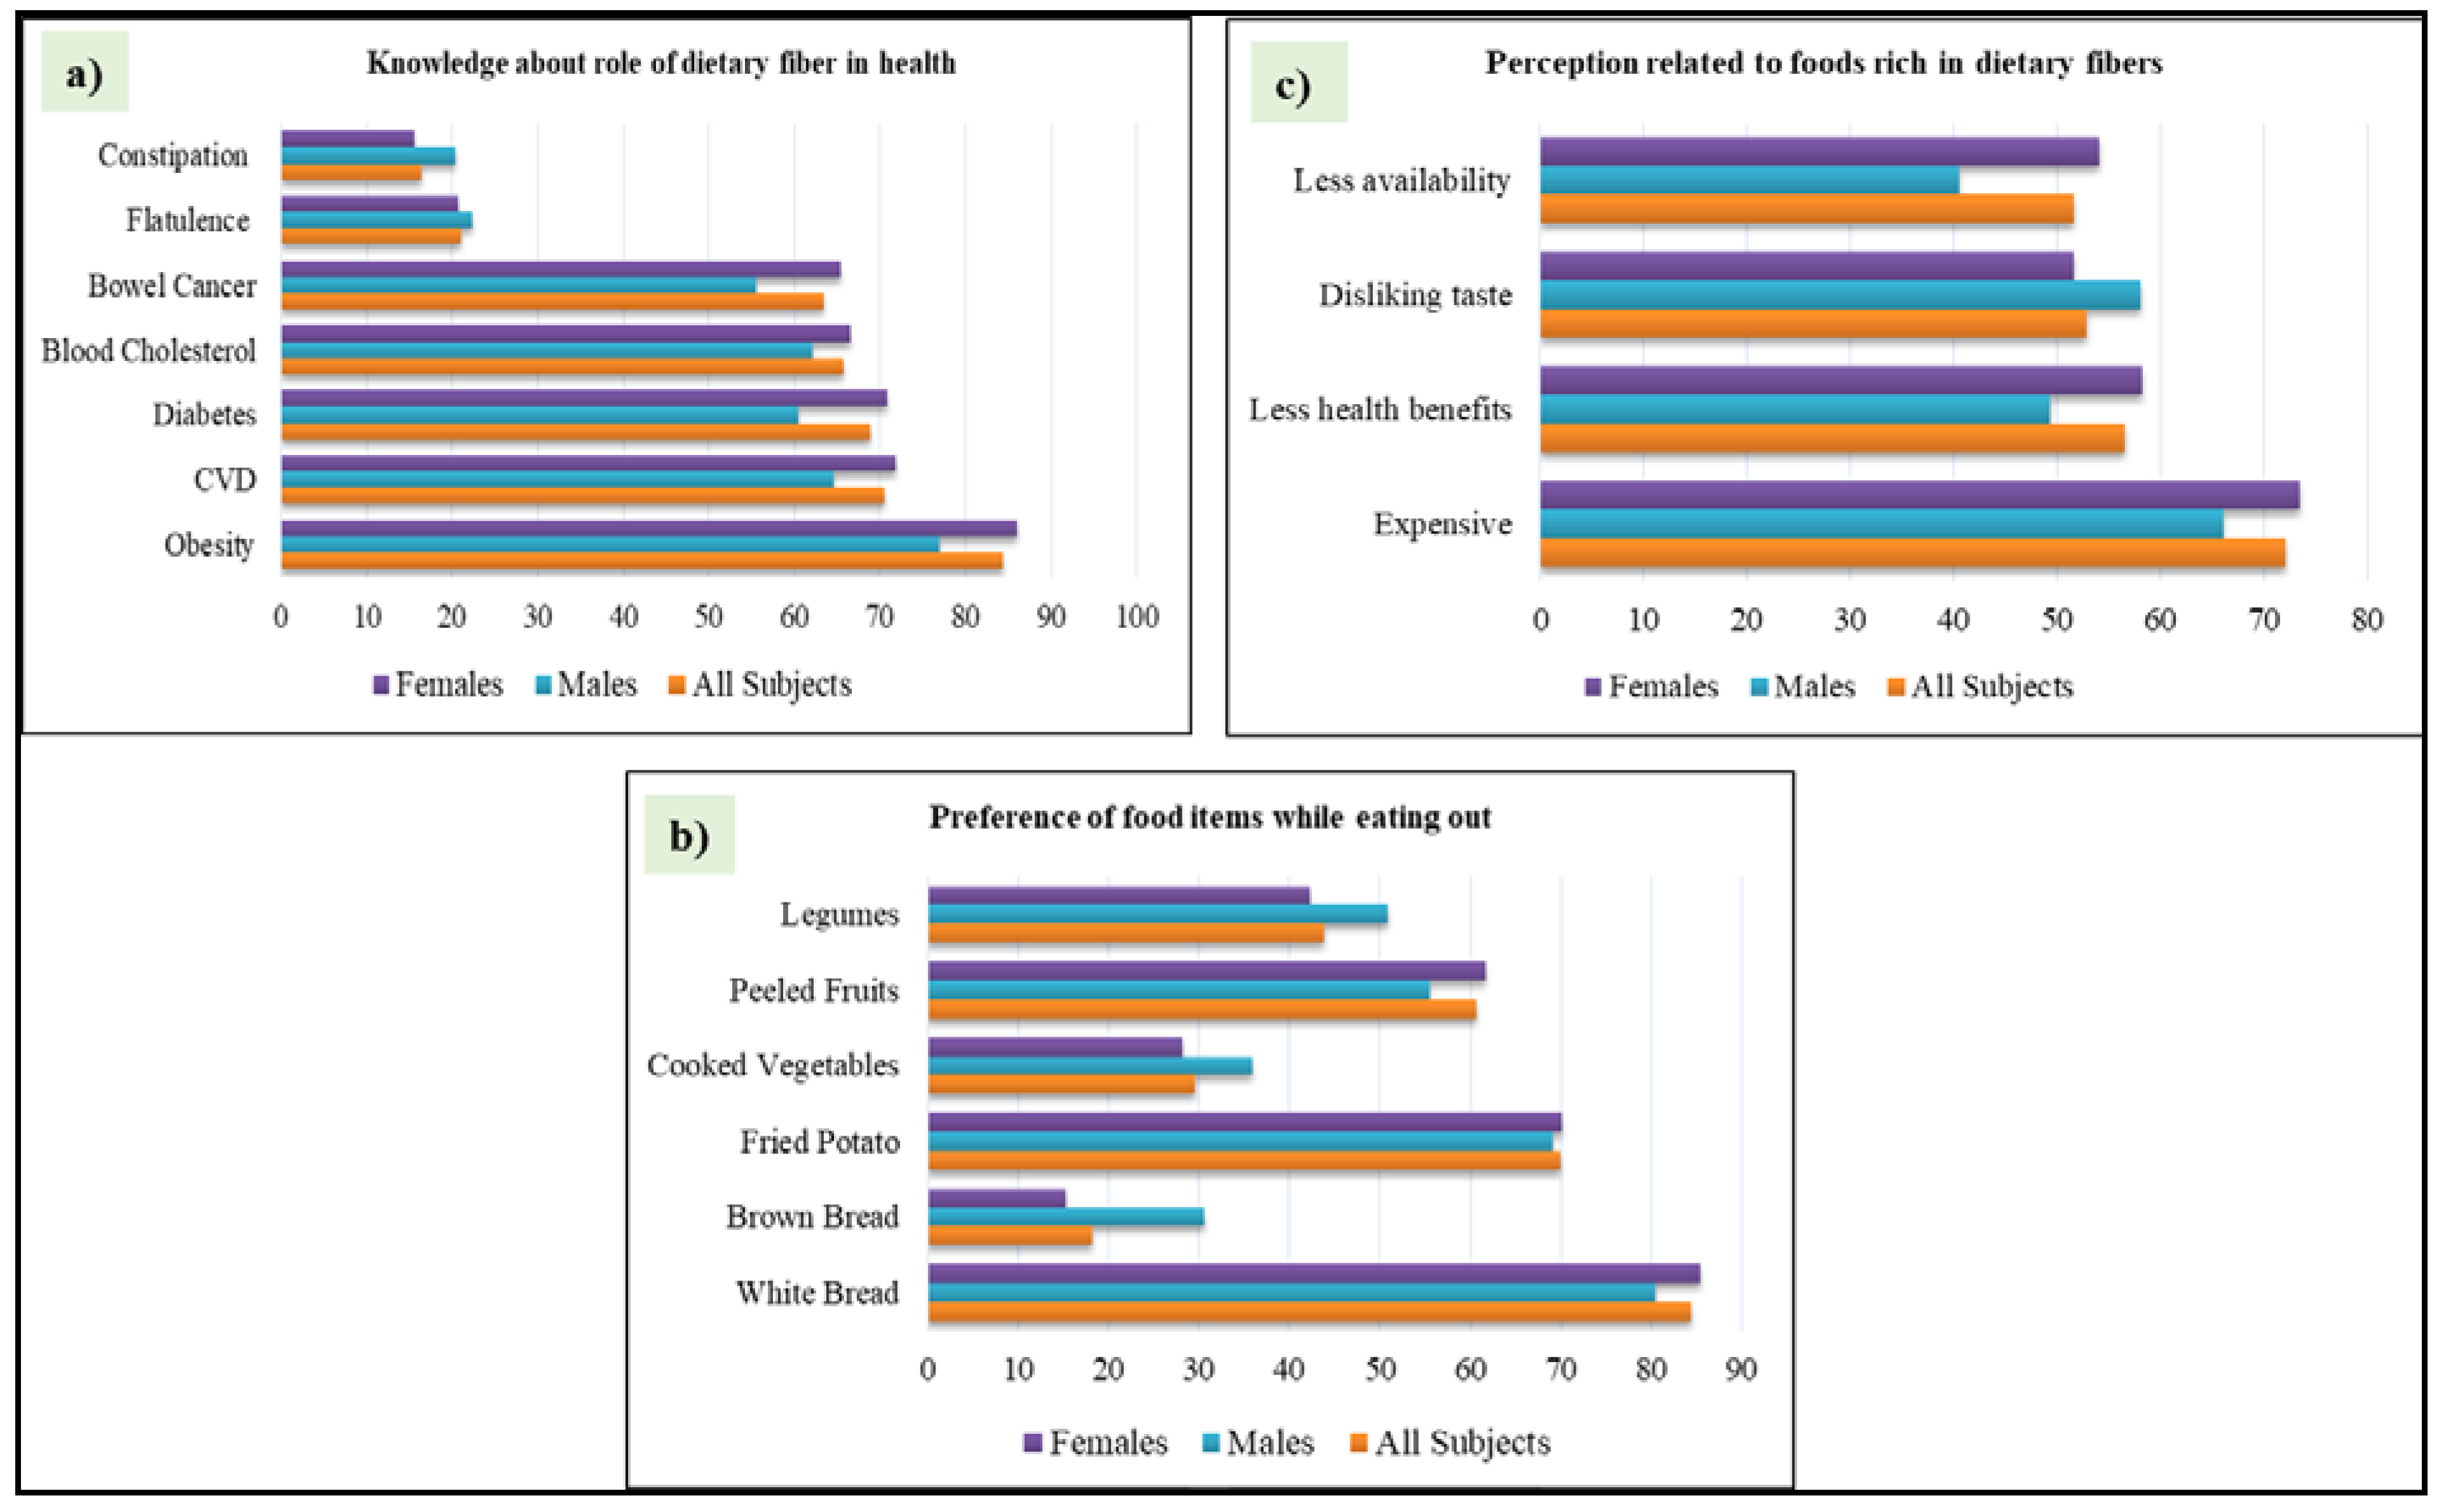
3.3. Knowledge about Dietary Fibers in Study Participants
3.4. Perceptions about Foods Rich in DF
3.5. Self-Reported Health Status of the Study Participants and Its Association with DF Intake
4. Discussion
5. Conclusions
Supplementary Materials
Author Contributions
Funding
Acknowledgments
Conflicts of Interest
References
- Paglia, L. WHO: Healthy diet to prevent chronic diseases and caries. Eur. J. Paediatr. Dent. 2018, 19, 5. [Google Scholar] [PubMed]
- Lattimer, J.M.; Haub, M.D. Effects of dietary fiber and its components on metabolic health. Nutrients 2010, 2, 1266–1289. [Google Scholar] [CrossRef] [PubMed] [Green Version]
- Zhou, Q.; Wu, J.; Tang, J.; Wang, J.-J.; Lu, C.-H.; Wang, P.-X. Beneficial effect of higher dietary fiber intake on plasma hdl-c and tc/hdl-c ratio among chinese rural-to-urban migrant workers. Int. J. Environ. Res. Public Health 2015, 12, 4726–4738. [Google Scholar] [CrossRef] [PubMed] [Green Version]
- American Association of Cereal Chemists Fiber Committee. The definition of dietary fiber: Report of the dietary fiber definition committee to the board of directors of the american association of cereal chemists. Cereal Foods World 2001, 46, 112–126. [Google Scholar]
- Dhingra, D.; Michael, M.; Rajput, H.; Patil, R. Dietary fibre in foods: A review. J. Food Sci. Technol. 2012, 49, 255–266. [Google Scholar] [CrossRef] [Green Version]
- Stephen, A.M.; Champ, M.M.-J.; Cloran, S.J.; Fleith, M.; Van Lieshout, L.; Mejborn, H.; Burley, V.J. Dietary fibre in europe: Current state of knowledge on definitions, sources, recommendations, intakes and relationships to health. Nutr. Res. Rev. 2017, 30, 149–190. [Google Scholar] [CrossRef]
- Buttriss, J.; Stokes, C. Dietary fibre and health: An overview. Nutr. Bull. 2008, 33, 186–200. [Google Scholar] [CrossRef]
- Lie, L.; Brown, L.; Forrester, T.; Plange-Rhule, J.; Bovet, P.; Lambert, E.; Layden, B.; Luke, A.; Dugas, L. The association of dietary fiber intake with cardiometabolic risk in four countries across the epidemiologic transition. Nutrients 2018, 10, 628. [Google Scholar] [CrossRef] [Green Version]
- Whelton, S.P.; Hyre, A.D.; Pedersen, B.; Yi, Y.; Whelton, P.K.; He, J. Effect of dietary fiber intake on blood pressure: A meta-analysis of randomized, controlled clinical trials. J. Hypertens. 2005, 23, 475–481. [Google Scholar] [CrossRef]
- Naumann, S.; Schweiggert-Weisz, U.; Eglmeier, J.; Haller, D.; Eisner, P. In vitro interactions of dietary fibre enriched food ingredients with primary and secondary bile acids. Nutrients 2019, 11, 1424. [Google Scholar] [CrossRef] [Green Version]
- Weickert, M.O.; Möhlig, M.; Schöfl, C.; Arafat, A.M.; Otto, B.; Viehoff, H.; Koebnick, C.; Kohl, A.; Spranger, J.; Pfeiffer, A.F. Cereal fiber improves whole-body insulin sensitivity in overweight and obese women. Diabetes Care 2006, 29, 775–780. [Google Scholar] [CrossRef] [PubMed] [Green Version]
- Tucker, L. Fiber intake and insulin resistance in 6374 adults: The role of abdominal obesity. Nutrients 2018, 10, 237. [Google Scholar] [CrossRef] [PubMed] [Green Version]
- Petruzziello, L.; Iacopini, F.; Bulajic, M.; Shah, S.; Costamagna, G. Uncomplicated diverticular disease of the colon. Aliment. Pharmacol. Ther. 2006, 23, 1379–1391. [Google Scholar] [CrossRef] [PubMed]
- Foley, A.; Burgell, R.; Barrett, J.S.; Gibson, P.R. Management strategies for abdominal bloating and distension. Gastroenterol. Hepatol. 2014, 10, 561. [Google Scholar]
- Fleming, D.J.; Tucker, K.L.; Jacques, P.F.; Dallal, G.E.; Wilson, P.W.; Wood, R.J. Dietary factors associated with the risk of high iron stores in the elderly framingham heart study cohort. Am. J. Clin. Nutr. 2002, 76, 1375–1384. [Google Scholar] [CrossRef] [Green Version]
- Murphy, N.; Norat, T.; Ferrari, P.; Jenab, M.; Bueno-de-Mesquita, B.; Skeie, G.; Dahm, C.C.; Overvad, K.; Olsen, A.; Tjønneland, A. Dietary fibre intake and risks of cancers of the colon and rectum in the european prospective investigation into cancer and nutrition (epic). PLoS ONE 2012, 7, e39361. [Google Scholar] [CrossRef] [Green Version]
- Trumbo, P.; Schlicker, S.; Yates, A.A.; Poos, M. Dietary reference intakes for energy, carbohdrate, fiber, fat, fatty acids, cholesterol, protein and amino acids. J. Acad. Nutr. Diet. 2002, 102, 1621. [Google Scholar]
- Foote, J.A.; Giuliano, A.R.; Harris, R.B. Older adults need guidance to meet nutritional recommendations. J. Am. Coll. Nutr. 2000, 19, 628–640. [Google Scholar] [CrossRef] [Green Version]
- Adams, J.; Engstrom, A. Dietary intake of whole grain vs. Recommendations. Cereal Foods World 2000, 45, 75–78. [Google Scholar]
- Thane, C.; Jones, A.; Stephen, A.; Seal, C.; Jebb, S. Whole-grain intake of british young people aged 4–18 years. Br. J. Nutr. 2005, 94, 825–831. [Google Scholar] [CrossRef] [Green Version]
- Ahmed, M.T.; Rahman, S.S.; Islam, M.S.; Rana, A.M.M.; Rahman, M.H. A comparative study of dietary fiber awareness, diseases & drugs interaction in rural and urban areas of bangladesh. Science 2013, 1, 194–200. [Google Scholar]
- Ljubicic, M.; Saric, M.M.; Rumbak, I.; Baric, I.C.; Komes, D.; Satalic, Z.; Guiné, R.P. Knowledge about dietary fibre and its health benefits: A cross-sectional survey of 2536 residents from across croatia. Med. Hypotheses 2017, 105, 25–31. [Google Scholar] [CrossRef] [PubMed]
- Tarcea, M.; Fazakas, Z.; Ruta, F.; Rus, V.; Zugravu, C.; Guiné, R. Romanian knowledge and attitudes regarding DF. Bull. Univ. Agric. Sci. Vet. Med. Cluj-Napoca Food Sci. Technol. 2016, 73, 123–128. [Google Scholar]
- DeNicola, E.; Aburizaiza, O.S.; Siddique, A.; Khwaja, H.; Carpenter, D.O. Obesity and public health in the kingdom of saudi arabia. Rev. Environ. Health 2015, 30, 191–205. [Google Scholar] [CrossRef] [PubMed]
- Al-Hazzaa, H.M. Physical inactivity in saudi arabia revisited: A systematic review of inactivity prevalence and perceived barriers to active living. Int. J. Health Sci. 2018, 12, 50. [Google Scholar]
- Alfawaz, H.; Naeef, A.F.; Wani, K.; Khattak, M.N.K.; Sabico, S.; Alnaami, A.M.; Al-Daghri, N.M. Improvements in glycemic, micronutrient, and mineral indices in arab adults with pre-diabetes post-lifestyle modification program. Nutrients 2019, 11, 2775. [Google Scholar] [CrossRef] [Green Version]
- Al-Nuaim, A.A.; Al-Nakeeb, Y.; Lyons, M.; Al-Hazzaa, H.M.; Nevill, A.; Collins, P.; Duncan, M.J. The prevalence of physical activity and sedentary behaviours relative to obesity among adolescents from al-ahsa, saudi arabia: Rural versus urban variations. J. Nutr. Metab. 2012, 2012. [Google Scholar] [CrossRef] [Green Version]
- Al-Daghri, N.; Khan, N.; Alkharfy, K.; Al-Attas, O.; Alokail, M.; Alfawaz, H.; Alothman, A.; Vanhoutte, P. Selected dietary nutrients and the prevalence of metabolic syndrome in adult males and females in saudi arabia: A pilot study. Nutrients 2013, 5, 4587–4604. [Google Scholar] [CrossRef] [Green Version]
- He, M.; van Dam, R.M.; Rimm, E.; Hu, F.B.; Qi, L. Whole grain, cereal fiber, bran, and germ intake and the risks of all-cause and cvd-specific mortality among women with type 2 diabetes. Circulation 2010, 121, 2162. [Google Scholar] [CrossRef] [Green Version]
- Fernstrand, A.M.; Bury, D.; Garssen, J.; Verster, J.C. Dietary intake of fibers: Differential effects in men and women on perceived general health and immune functioning. Food Nutr. Res. 2017, 61, 1297053. [Google Scholar] [CrossRef] [Green Version]
- Riediger, N.D.; Moghadasian, M.H. Patterns of fruit and vegetable consumption and the influence of sex, age and socio-demographic factors among canadian elderly. J. Am. Coll. Nutr. 2008, 27, 306–313. [Google Scholar] [CrossRef] [PubMed]
- Vereecken, C.A.; Keukelier, E.; Maes, L. Influence of mother’s educational level on food parenting practices and food habits of young children. Appetite 2004, 43, 93–103. [Google Scholar] [CrossRef] [PubMed]
- Wronka, I.; Suliga, E.; Pawlinska-Chmara, R. Perceived and desired body weight among female university students in relation to bmi-based weight status and socio-economic factors. Ann. Agric. Environ. Med. 2013, 20, 533–538. [Google Scholar] [PubMed]
- Bagordo, F.; Grassi, T.; Serio, F.; Idolo, A.; De Donno, A. Dietary habits and health among university students living at or away from home in southern italy. J. Food Nutr. Res. 2013, 52. [Google Scholar]
- Arvola, A.; Lähteenmäki, L.; Dean, M.; Vassallo, M.; Winkelmann, M.; Claupein, E.; Saba, A.; Shepherd, R. Consumers’ beliefs about whole and refined grain products in the uk, italy and finland. J. Cereal Sci. 2007, 46, 197–206. [Google Scholar] [CrossRef]
- Lin, W.; Yang, H.-C.; Hang, C.-M.; Pan, W.-H. Nutrition knowledge, attitude, and behavior of taiwanese elementary school children. Asia Pac. J. Clin. Nutr. 2007, 16, 534–546. [Google Scholar]
- Barzegari, A.; Ebrahimi, M.; Azizi, M.; Ranjbar, K. A study of nutrition knowledge, attitudes and food habits of college students. World Appl. Sci. J. 2011, 15, 1012–1017. [Google Scholar]
- Dean, M.; Raats, M.; Shepherd, R.; Arvola, A.; Vassallo, M.; Winkelmann, M.; Saba, A.; Claupein, E.; Lähteenmäki, L. Consumer perceptions and expectations for healthy cereal products. J. Cereal Sci. 2007, 46, 188–196. [Google Scholar] [CrossRef]
- Hoppert, K.; Mai, R.; Zahn, S.; Hoffmann, S.; Rohm, H. Integrating sensory evaluation in adaptive conjoint analysis to elaborate the conflicting influence of intrinsic and extrinsic attributes on food choice. Appetite 2012, 59, 949–955. [Google Scholar] [CrossRef]
- Raghunathan, R.; Naylor, R.W.; Hoyer, W.D. The unhealthy= tasty intuition and its effects on taste inferences, enjoyment, and choice of food products. J. Mark. 2006, 70, 170–184. [Google Scholar] [CrossRef]
- Higgins, P.D.; Johanson, J.F. Epidemiology of constipation in north america: A systematic review. Am. J. Gastroenterol. 2004, 99, 750. [Google Scholar] [CrossRef] [PubMed]
- Alharbi, N.S.; Almutari, R.; Jones, S.; Al-Daghri, N.; Khunti, K.; de Lusignan, S. Trends in the prevalence of type 2 diabetes mellitus and obesity in the arabian gulf states: Systematic review and meta-analysis. Diabetes Res. Clin. Pract. 2014, 106, e30–e33. [Google Scholar] [CrossRef] [PubMed] [Green Version]
- Sadat-Ali, M.; Al-Habdan, I.M.; Al-Turki, H.A.; Azam, M.Q. An epidemiological analysis of the incidence of osteoporosis and osteoporosis-related fractures among the saudi arabian population. Ann. Saudi Med. 2012, 32, 637–641. [Google Scholar] [CrossRef] [PubMed]
- Yang, J.; Wang, H.P.; Zhou, L.; Xu, C.F. Effect of dietary fiber on constipation: A meta analysis. WJG 2012, 18, 7378. [Google Scholar] [CrossRef] [PubMed]
- Pereira, M.A.; O’Reilly, E.; Augustsson, K.; Fraser, G.E.; Goldbourt, U.; Heitmann, B.L.; Hallmans, G.; Knekt, P.; Liu, S.; Pietinen, P. Dietary fiber and risk of coronary heart disease: A pooled analysis of cohort studies. Arch. Intern. Med. 2004, 164, 370–376. [Google Scholar] [CrossRef] [PubMed] [Green Version]
- Wang, Y.; Harding, S.V.; Thandapillay, S.J.; Tosh, S.M.; Jones, P.J.H.; Ames, N.P. Barley β-glucan reduces blood cholesterol levels via interrupting bile acid metabolism. Br. J. Nutr. 2017, 118, 822–829. [Google Scholar] [CrossRef] [Green Version]
- Soliman, G.A. Dietary fiber, atherosclerosis, and cardiovascular disease. Nutrients 2019, 11, 1155. [Google Scholar] [CrossRef] [Green Version]
- Hadrévi, J.; Soggard, K.; Christensen, J.R. Dietary Fiber Intake among Normal-Weight and Overweight Female Health Care Workers: An Exploratory Nested Case-Control Study within FINALE-Health. J. Nutr. Metab. 2017, 2017. [Google Scholar] [CrossRef] [Green Version]
- Veronese, N.; Solmi, M.; Caruso, M.G.; Gianelli, G.; Osella, A.R.; Evangelou, E.; Maggi, S.; Fontana, L.; Stubbs, B.; Tzoulaki, L. Dietary fiber and health outcomes: An umbrella review of systematic reviews and meta-analyses. Am. J. Clin. Nutr. 2018, 107, 436–444. [Google Scholar] [CrossRef] [Green Version]

| Parameters | All | Male | Female | p |
| N | 1363 | 256 | 1107 | |
| Age Group (Years) | <0.01 | |||
| 20–24 | 176 (12.9) | 25 (9.8) | 151 (13.6) | |
| 25–35 | 411 (30.2) | 70 (27.3) | 341 (30.8) | |
| 36–45 | 457 (33.5) | 72 (28.1) | 385 (34.8) | |
| 46–55 | 242 (17.8) | 51 (19.9) | 191 (17.3) | |
| 56–65 | 76 (5.6) | 37 (14.5) | 39 (3.5) | |
| 66–70 | 1 (0.1) | 1 (0.4) | 0 (0.0) | |
| Marital Status | 0.02 | |||
| Married | 1029 (75.5) | 202 (78.9) | 827 (74.7) | |
| Unmarried | 262 (19.2) | 50 (19.5) | 212 (19.2) | |
| Widow | 47 (3.4) | 1 (0.4) | 46 (4.2) | |
| Divorce | 25 (1.8) | 3 (1.2) | 22 (2.0) | |
| Family Income (SAR/month) | <0.01 | |||
| Low (<5000) | 262 (19.2) | 62 (24.2) | 200 (18.1) | |
| Average (5000–10,000) | 444 (32.6) | 51 (19.9) | 393 (35.5) | |
| Moderate (10,001–16,000) | 384 (28.2) | 55 (21.5) | 329 (29.7) | |
| High (>16,000) | 273 (20.0) | 88 (34.4) | 185 (16.7) | |
| Education Level | 0.26 | |||
| Read and Write | 4 (0.3) | 1 (0.4) | 3 (0.3) | |
| Primary | 1 (0.1) | 0 (0.0) | 1 (0.1) | |
| Intermediate | 42 (3.1) | 3 (1.2) | 39 (3.5) | |
| Secondary | 166 (12.2) | 36 (14.1) | 130 (11.7) | |
| Diploma | 168 (12.3) | 34 (13.3) | 134 (12.1) | |
| Graduate | 860 (63.1) | 153 (59.8) | 707 (63.9) | |
| Post-Graduate | 122 (9.0) | 29 (11.3) | 93 (8.4) |
| All | Males | Females | p | |||||||
|---|---|---|---|---|---|---|---|---|---|---|
| Yes | No | Rarely | Yes | No | Rarely | Yes | No | Rarely | ||
| Fiber Supplements | 288 (21.1) | 1074 (78.8) | 61 (23.8) | 195 (76.2) | 227 (20.5) | 879 (79.4) | <0.001 | |||
| Fruits and Vegetables | ||||||||||
| Salad | 1184 (86.9) | 23 (1.7) | 156 (11.4) | 222 (86.7) | 8 (3.1) | 26 (10.2) | 962 (86.9) | 15 (1.4) | 130 (11.7) | 0.115 |
| Cooked Vegetables | 1111 (81.5) | 30 (2.2) | 222 (16.3) | 197 (77.0) | 13 (5.1) | 46 (18.0) | 914 (82.6) | 17 (1.5) | 176 (15.9) | 0.001 |
| Fruit Juice | 863 (63.3) | 79 (5.8) | 421 (30.9) | 182 (71.1) | 16 (6.3) | 58 (22.7) | 681 (61.5) | 63 (5.7) | 363 (32.8) | 0.007 |
| Fresh Peeled Vegetables | 838 (61.5) | 205 (15.0) | 320 (23.5) | 166 (64.8) | 45 (17.6) | 45 (17.6) | 672 (60.7) | 160 (14.5) | 275 (24.8) | 0.037 |
| Fruits with peel | 833 (61.1) | 232 (17.0) | 298 (21.9) | 162 (63.3) | 43 (16.8) | 51 (19.9) | 671 (60.6) | 189 (17.1) | 247 (22.3) | 0.672 |
| Cereals | ||||||||||
| Oats | 905 (66.4) | 121 (8.9) | 337 (24.7) | 150 (58.6) | 37 (14.5) | 69 (27.0) | 755 (68.2) | 84 (7.6) | 268 (24.2) | 0.001 |
| Whole Wheat | 884 (64.9) | 157 (11.5) | 322 (23.6) | 168 (65.6) | 33 (12.9) | 55 (21.5) | 716 (64.7) | 124 (11.2) | 267 (24.1) | 0.536 |
| Refined wheat | 861 (63.2) | 157 (11.5) | 345 (25.3) | 165 (64.5) | 32 (12.5) | 59 (23.0) | 696 (62.9) | 125 (11.3) | 286 (25.8) | 0.684 |
| Maize | 572 (42.0) | 246 (18.0) | 545 (40.0) | 97 (37.9) | 57 (22.3) | 102 (39.8) | 475 (42.9) | 189 (17.1) | 443 (40.0) | 0.113 |
| Burghul | 377 (27.7) | 368 (27.0) | 618 (45.3) | 59 (23.0) | 83 (32.4) | 114 (44.5) | 318 (28.7) | 285 (25.7) | 504 (45.5) | 0.052 |
| Barley | 275 (20.2) | 572 (42.0) | 516 (37.9) | 74 (28.9) | 94 (36.7) | 88 (34.4) | 201 (18.2) | 478 (43.2) | 428 (38.7) | 0.001 |
| Millet | 241 (17.7) | 572 (42.0) | 550 (40.4) | 62 (24.2) | 94 (36.7) | 100 (39.1) | 179 (16.2) | 478 (43.2) | 450 (40.7) | 0.007 |
| Quinoa | 213 (15.6) | 698 (51.2) | 452 (33.2) | 39 (15.2) | 144 (56.3) | 73 (28.5) | 174 (15.7) | 554 (50.0) | 379 (34.2) | 0.151 |
| Nuts | ||||||||||
| Peanuts | 1015 (74.5) | 61 (4.5) | 287 (21.1) | 198 (77.3) | 11 (4.3) | 47 (18.4) | 817 (73.8) | 50 (4.5) | 240 (21.7) | 0.525 |
| Pistachios | 982 (72.0) | 89 (6.5) | 292 (21.4) | 191 (74.6) | 19 (7.4) | 46 (18.0) | 791 (71.5) | 70 (6.3) | 246 (22.2) | 0.257 |
| Almonds | 854 (62.7) | 147 (10.8) | 362 (26.6) | 160 (62.5) | 31 (12.1) | 65 (25.4) | 694 (62.7) | 116 (10.5) | 297 (26.8) | 0.729 |
| Walnuts | 678 (49.7) | 246 (18.0) | 439 (32.2) | 123 (48.0) | 42 (16.4) | 91 (35.5) | 555 (50.1) | 204 (18.4) | 348 (31.4) | 0.503 |
| Hazelnut | 581 (42.6) | 288 (21.1) | 494 (36.2) | 125 (48.8) | 49 (19.1) | 82 (32.0) | 456 (41.2) | 239 (21.6) | 412 (37.2) | 0.069 |
| Shea Seeds | 241 (17.7) | 738 (54.1) | 384 (28.2) | 49 (19.1) | 145 (56.6) | 62 (24.2) | 192 (17.3) | 593 (53.6) | 322 (29.1) | 0.193 |
| Dried Fruits | ||||||||||
| Dried Pineapple | 627 (46.0) | 237 (17.4) | 499 (36.6) | 125 (48.8) | 38 (14.8) | 93 (36.3) | 502 (45.3) | 199 (18.0) | 406 (36.7) | 0.459 |
| Dried Dates | 595 (43.7) | 450 (33.0) | 318 (23.3) | 124 (48.4) | 71 (27.7) | 61 (23.8) | 471 (42.5) | 379 (34.2) | 257 (23.2) | 0.096 |
| Raisin | 573 (42.0) | 313 (23.0) | 477 (35.0) | 129 (50.4) | 42 (16.4) | 85 (33.2) | 444 (40.1) | 271 (24.5) | 392 (35.4) | 0.005 |
| Dried Figs | 539 (39.5) | 381 (28.0) | 443 (32.5) | 122 (47.7) | 52 (20.3) | 82 (32.0) | 417 (37.7) | 329 (29.7) | 361 (32.6) | 0.001 |
| Apricot | 433 (31.7) | 434 (31.9) | 496 (36.4) | 97 (37.9) | 66 (25.8) | 93 (36.3) | 336 (30.4) | 368 (33.2) | 403 (36.4) | 0.031 |
| Legumes | ||||||||||
| Fava Beans | 936 (68.7) | 122 (9.0) | 305 (22.4) | 187 (73.0) | 24 (9.4) | 45 (17.6) | 749 (67.7) | 98 (8.9) | 260 (23.5) | 0.110 |
| Yellow Lentils | 868 (63.7) | 147 (10.8) | 348 (25.5) | 157 (61.3) | 32 (12.5) | 67 (26.2) | 711 (64.2) | 115 (10.4) | 281 (25.4) | 0.495 |
| Chickpeas | 867 (63.6) | 130 (9.5) | 366 (26.9) | 185 (72.3) | 19 (7.4) | 52 (20.3) | 682 (61.6) | 111 (10.0) | 314 (28.4) | 0.009 |
| Green Beans | 690 (50.6) | 261 (19.1) | 412 (30.2) | 131 (51.2) | 37 (14.5) | 88 (34.4) | 559 (50.5) | 224 (20.2) | 324 (29.3) | 0.074 |
| White Beans | 380 (27.9) | 464 (34.0) | 519 (38.1) | 90 (35.2) | 59 (23.0) | 107 (41.8) | 290 (26.2) | 405 (36.6) | 412 (37.2) | <0.001 |
| Libya beans | 354 (26.0) | 496 (36.4) | 513 (37.6) | 80 (31.3) | 73 (28.5) | 103 (40.2) | 274 (24.8) | 423 (38.2) | 410 (37.0) | 0.004 |
| All (N = 1363) | Males (N = 256) | Females (N = 1107) | p | ||||
|---|---|---|---|---|---|---|---|
| Yes | No | Yes | No | Yes | No | ||
| Knowledge about DF | |||||||
| DF and prevention of obesity | 1148 (84.3) | 214 (15.7) | 197 (77.0) | 59 (23.0) | 951 (86.0) | 155 (14.0) | <0.001 |
| DF and cardiovascular diseases | 960 (70.5) | 402 (29.5) | 165 (64.5) | 91 (35.5) | 795 (71.9) | 311 (28.1) | 0.004 |
| DF and regulation of blood sugar | 939 (68.9) | 423 (31.1) | 155 (60.5) | 101 (39.5) | 784 (70.9) | 322 (29.1) | 0.002 |
| DF and reduction in blood cholesterol | 895 (65.7) | 467 (34.3) | 159 (62.1) | 97 (37.9) | 736 (66.5) | 370 (33.4) | 0.293 |
| DF and prevention of bowel cancer | 865 (63.5) | 497 (36.5) | 142 (55.5) | 114 (44.5) | 723 (65.4) | 383 (34.6) | <0.001 |
| DF and flatulence | 286 (21.0) | 1076 (78.9) | 57 (22.3) | 199 (77.7) | 229 (20.7) | 877 (79.2) | 0.516 |
| DF and constipation | 223 (16.4) | 1139 (83.6) | 52 (20.3) | 204 (79.9) | 171 (15.5) | 935 (84.5) | 0.020 |
| Too much DF and health | 183 (13.4) | 1179 (86.5) | 42 (16.4) | 214 (83.6) | 141 (12.7) | 965 (87.2) | 0.058 |
| DF daily intake requirement | 0.060 | ||||||
| 5–10 g/day | 151 (11.0) | 27 (10.7) | 124 (11.2) | ||||
| 11–24 g/day | 402 (29.6) | 59 (23.0) | 343 (31.0) | ||||
| 25–38 g/day | 810 (59.4) | 170 (66.3) | 640 (57.8) | ||||
| Preference of DF intake in fast foods/eating out | |||||||
| Regularly eating fast foods/eating out | 652 (47.8) | 711 (52.2) | 115 (44.9) | 141(55.1) | 536 (48.5) | 570 (51.5) | 0.552 |
| Use of white bread in fast foods/eating out | 1150 (84.4) | 212 (15.6) | 206 (80.5) | 50 (19.5) | 944 (85.4) | 162 (14.6) | 0.011 |
| Use of fried potato in fast foods/eating out | 952 (69.9) | 410 (30.1) | 177 (69.1) | 79 (30.9) | 775 (70.1) | 331 (29.9) | 0.09 |
| Use of peeled fruits in fast foods/eating out | 825 (60.6) | 538 (39.4) | 142 (55.5) | 114 (44.5) | 683 (61.7) | 423 (38.2) | 0.001 |
| Use of legumes in fast foods/eating out | 598 (43.8) | 765 (56.1) | 130 (50.8) | 126 (49.2) | 467 (42.2) | 639 (57.8) | 0.012 |
| Use of cooked vegetables in fast foods/eating out | 404 (29.6) | 959 (70.4) | 92 (35.9) | 164 (64.1) | 311 (28.1) | 795 (71.9) | 0.005 |
| Use of brown bread in fast foods/eating out | 246 (18.1) | 1117 (81.9) | 78 (30.5) | 178 (69.5) | 168 (15.2) | 938 (84.8) | <0.001 |
| All (N = 1363) | Male (N = 256) | Female (N = 1107) | p | |||||||
|---|---|---|---|---|---|---|---|---|---|---|
| Yes | No | Don’t Know | Yes | No | Don’t Know | Yes | No | Don’t Know | ||
| •Foods rich in DF are expensive | 983 (72.1) | 215 (15.8) | 165 (12.1) | 169 (66.1) | 48 (18.6) | 39 (15.3) | 814 (73.5) | 167 (15.1) | 126 (11.4) | 0.07 |
| •There is limited beneficial effect in consuming fiber-rich food to my health | 770 (56.5) | 478 (35.1) | 115 (8.4) | 126 (49.2) | 95 (37.2) | 35 (13.6) | 644 (58.2) | 383 (34.6) | 80 (7.2) | 0.02 |
| •I do not like fiber-rich food taste | 720 (52.8) | 507 (37.2) | 136 (10.0) | 149 (58.1) | 77 (30.1) | 30 (11.9) | 571 (51.6) | 430 (38.8) | 106 (9.6) | 0.04 |
| •Foods rich in DF are not easily available | 703 (51.6) | 478 (35.1) | 180 (13.2) | 104 (40.5) | 104 (40.5) | 48 (19.0) | 601 (54.1) | 374 (33.9) | 132 (11.9) | <0.01 |
| All Participants (N = 1363) | |||||||||
| Fiber Intake Quartiles | Q 1 (340) | Q 2 (341) | Q 3 (341) | Q 4 (341) | Q1 | Q2 | Q3 | Q4 | Pa |
| Dietary fiber score | 6 ± 2 | 12 ± 2 | 17 ± 1 | 23 ± 3 | Adjusted O.R. (95% C.I.) | ||||
| % (N) | |||||||||
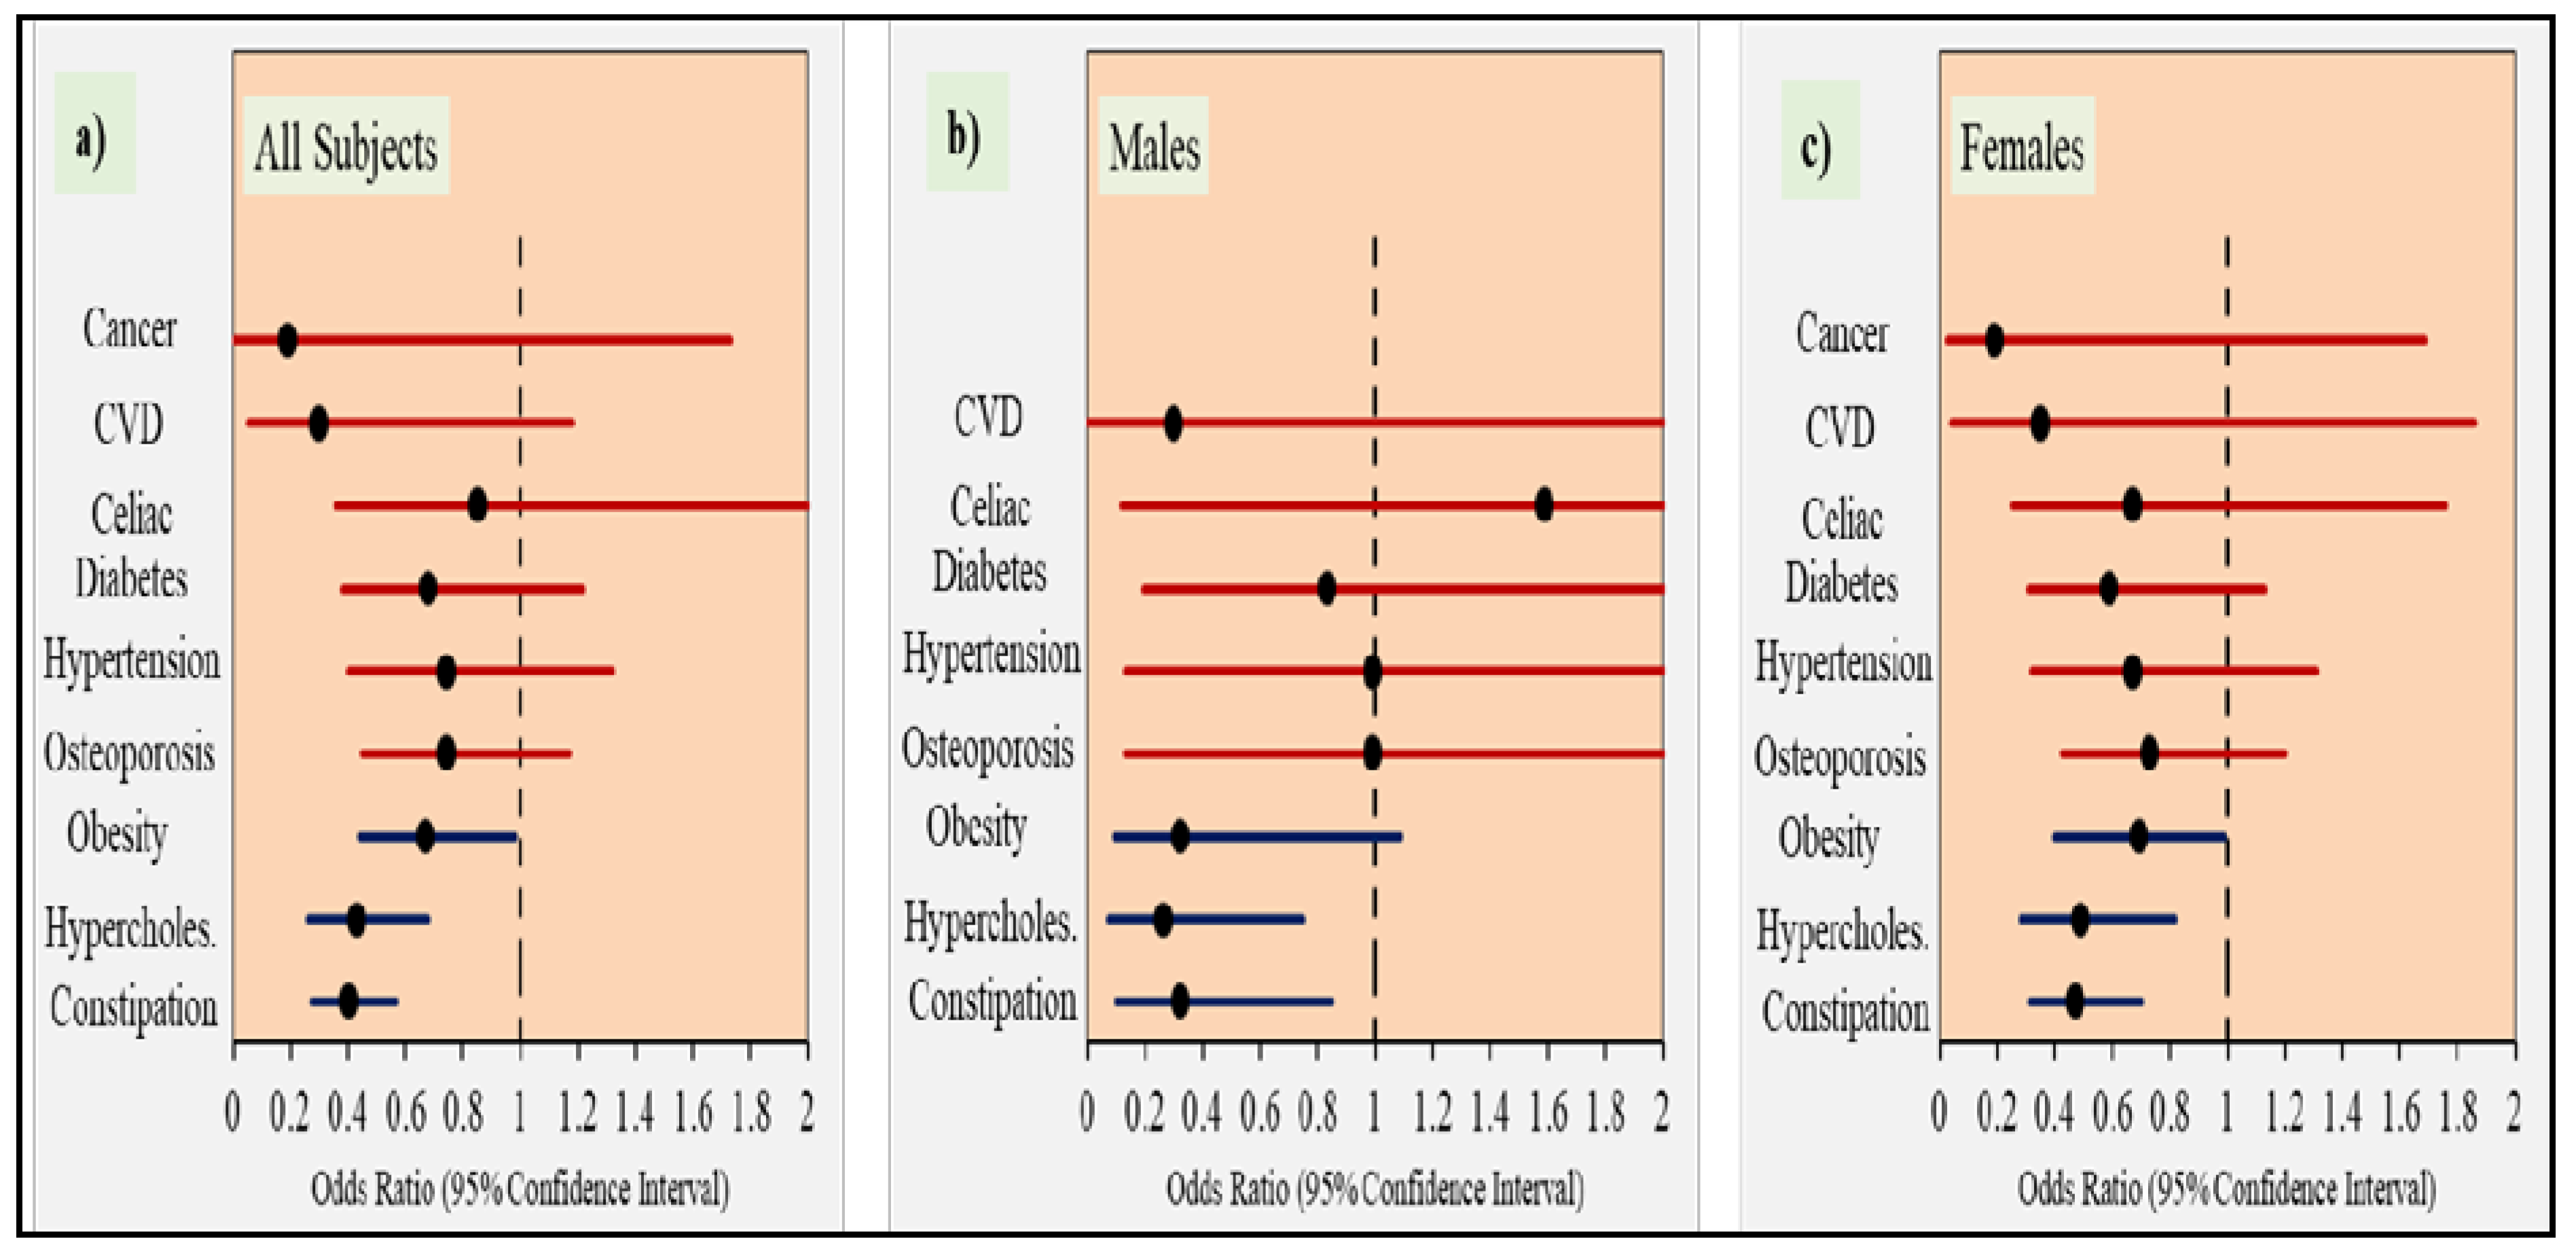
| Constipation | 37.2 (126) | 29.6 (100) | 29.2 (99) | 19.1 (65) | Ref. | 0.71 (0.51–0.98) * | 0.70 (0.51–0.96) * | 0.40 (0.28–0.57) ** | <0.001 |
| High cholesterol | 20.4 (69) | 11.8 (40) | 15.3 (52) | 10.9 (37) | Ref. | 0.46 (0.29–0.73) ** | 0.66 (0.43–0.99) * | 0.43 (0.27–0.68) ** | 0.001 |
| Obesity | 19.6 (66) | 12.1 (41) | 12.1 (41) | 13.8 (47) | Ref. | 0.57 (0.37–0.87) * | 0.57 (0.37–0.87) * | 0.67 (0.44–0.98) * | 0.027 |
| Osteoporosis | 15.1 (51) | 10.7 (36) | 13.0 (44) | 10.9 (37) | Ref. | 0.68 (0.42–1.09) | 0.94 (0.59–1.48) | 0.74 (0.46–1.17) | 0.307 |
| Hypertension | 9.5 (32) | 12.1 (41) | 10.3 (35) | 7.3 (25) | Ref. | 1.28 (0.76–2.16) | 1.09 (0.64–1.87) | 0.74 (0.42–1.32) | 0.251 |
| Diabetes | 9.8 (33) | 12.4 (42) | 8.8 (30) | 7.0 (24) | Ref. | 1.21 (0.72–2.03) | 0.87 (0.50–1.52) | 0.68 (0.38–1.22) | 0.225 |
| Celiac disease | 4.2 (14) | 2.7 (9) | 1.5 (5) | 2.9 (10) | Ref. | 0.78 (0.32–1.88) | 0.46 (0.16–1.33) | 0.85 (0.36–2.00) | 0.507 |
| CVD | 2.7 (9) | 1.2 (4) | 2.9 (10) | 0.9 (3) | Ref. | 0.44 (0.13–1.54) | 1.10 (0.42–2.95) | 0.30 (0.08–1.18) | 0.103 |
| Cancer | 1.8 (6) | 0.9 (3) | 1.8 (6) | 0.3 (1) | Ref. | 0.57 (0.13–2.45) | 1.27 (0.37–4.37) | 0.19 (0.02–1.73) | 0.185 |
| Males (N = 256) | |||||||||
| Fiber intake quartiles | Q 1 (64) | Q 2 (64) | Q 3 (64) | Q 4 (64) | Q1 | Q2 | Q3 | Q4 | Pa |
| Dietary fiber score | 6 ± 3 | 13 ± 2 | 17 ± 2 | 25 ± 3 | Adjusted O.R. (95% C.I.) | ||||
| % (N) | |||||||||
| Constipation | 34.4 (22) | 29.7 (19) | 17.2 (11) | 12.5 (8) | Ref. | 0.83 (0.37–1.85) | 0.39 (0.16–0.95) * | 0.32 (0.12–0.85) * | 0.037 |
| High Cholesterol | 28.2 (18) | 25.0 (16) | 20.3 (13) | 12.5 (8) | Ref. | 0.47 (0.19–1.18) | 0.49 (0.19–1.27) | 0.26 (0.09–0.75) * | 0.076 |
| Obesity | 18.8 (12) | 15.6 (10) | 9.4 (6) | 7.8 (5) | Ref. | 0.79 (0.29–2.16) | 0.42 (0.14–1.33) | 0.32 (0.09–1.09) | 0.198 |
| Osteoporosis | 7.8 (5) | 6.3 (4) | 0.0 (0) | 6.3 (4) | Ref. | 0.92 (0.21–3.98) | - | 0.99 (0.22–4.49) | 0.07 |
| Hypertension | 9.4 (6) | 25.0 (16) | 15.6 (10) | 10.9 (7) | Ref. | 3.74 (1.20–11.6) * | 1.93 (0.58–6.40) | 1.53 (0.43–5.39) | 0.099 |
| Diabetes | 7.8 (5) | 25.0 (16) | 15.6 (10) | 6.3 (4) | Ref. | 3.37 (1.04–10.9) * | 1.96 (0.56–6.79) | 0.83 (0.19–3.56) | 0.057 |
| Celiac disease | 1.6 (1) | 4.7 (3) | 1.6 (1) | 3.1 (2) | Ref. | 3.35 (0.31–36.2) | 1.00 (0.06–18.4) | 1.59 (0.12–21.7) | 0.658 |
| CVD | 3.1 (2) | 3.1 (2) | 3.1 (2) | 1.6 (1) | Ref. | 1.12 (0.11–11.1) | 1.16 (0.12–11.5) | 0.30 (0.02–4.77) | 0.697 |
| Cancer | 0.0 (0) | 1.6 (1) | 0.0 (0) | 1.6 (1) | Ref. | ||||
| Females (N = 1107) | |||||||||
| Fiber intake quartiles | Q 1 (277) | Q 2 (277) | Q 3 (277) | Q 4 (276) | Q1 | Q2 | Q3 | Q4 | Pa |
| Dietary fiber score | 6 ± 2 | 12 ± 2 | 17 ± 1 | 23 ± 3 | |||||
| % (N) | Adjusted O.R. (95% C.I.) | ||||||||
| Constipation | 37.3 (103) | 30.1 (83) | 30.9 (85) | 21.6 (59) | Ref. | 0.73 (0.51–0.99) * | 0.81 (0.56–1.16) | 0.47 (0.32–0.70) ** | 0.001 |
| High cholesterol | 18.2 (50) | 9.8 (27) | 13.8 (38) | 10.2 (28) | Ref. | 0.46 (0.27–0.78) ** | 0.70 (0.43–1.15) | 0.49 (0.29–0.82) ** | 0.010 |
| Obesity | 20.1 (55) | 11.2 (31) | 12.7 (35) | 15.0 (41) | Ref. | 0.49 (0.31–0.81) ** | 0.59 (0.37–0.95) * | 0.69 (0.40–0.99) * | 0.028 |
| Osteoporosis | 17.2 (47) | 11.2 (31) | 15.6 (43) | 12.4 (34) | Ref. | 0.63 (0.38–1.05) | 1.02 (0.63–1.64) | 0.73 (0.44–1.20) | 0.170 |
| Hypertension | 9.4 (26) | 9.1 (25) | 9.4 (26) | 6.2 (21) | Ref. | 0.99 (0.54–1.84) | 1.09 (0.59–2.02) | 0.67 (0.34–1.31) | 0.472 |
| Diabetes | 10.5 (29) | 9.4 (26) | 7.6 (21) | 6.6 (18) | Ref. | 0.83 (0.46–1.52) | 0.69 (0.37–1.31) | 0.59 (0.31–1.13) | 0.409 |
| Celiac disease | 4.7 (13) | 2.2 (6) | 1.8 (5) | 2.6 (7) | Ref. | 0.56 (0.20–1.56) | 0.50 (0.17–1.48) | 0.67 (0.25–1.76) | 0.550 |
| CVD | 2.2 (6) | 1.4 (4) | 2.5 (7) | 0.7 (2) | Ref. | 0.70 (0.18–2.74) | 1.18 (0.36–3.92) | 0.35 (0.07–1.86) | 0.396 |
| Cancer | 2.2 (6) | 0.7 (2) | 2.2 (5) | 1.5 (1) | Ref. | 0.36 (0.07–1.94) | 1.15 (0.32–4.08) | 0.19 (0.04–1.69) | 0.191 |
© 2020 by the authors. Licensee MDPI, Basel, Switzerland. This article is an open access article distributed under the terms and conditions of the Creative Commons Attribution (CC BY) license (http://creativecommons.org/licenses/by/4.0/).
Share and Cite
Alfawaz, H.; Khan, N.; Alhuthayli, H.; Wani, K.; Aljumah, M.A.; Khattak, M.N.K.; Alghanim, S.A.; Al-Daghri, N.M. Awareness and Knowledge Regarding the Consumption of Dietary Fiber and Its Relation to Self-Reported Health Status in an Adult Arab Population: A Cross-Sectional Study. Int. J. Environ. Res. Public Health 2020, 17, 4226. https://doi.org/10.3390/ijerph17124226
Alfawaz H, Khan N, Alhuthayli H, Wani K, Aljumah MA, Khattak MNK, Alghanim SA, Al-Daghri NM. Awareness and Knowledge Regarding the Consumption of Dietary Fiber and Its Relation to Self-Reported Health Status in an Adult Arab Population: A Cross-Sectional Study. International Journal of Environmental Research and Public Health. 2020; 17(12):4226. https://doi.org/10.3390/ijerph17124226
Chicago/Turabian StyleAlfawaz, Hanan, Nasiruddin Khan, Haya Alhuthayli, Kaiser Wani, Muneerah A. Aljumah, Malak Nawaz Khan Khattak, Saad A. Alghanim, and Nasser M. Al-Daghri. 2020. "Awareness and Knowledge Regarding the Consumption of Dietary Fiber and Its Relation to Self-Reported Health Status in an Adult Arab Population: A Cross-Sectional Study" International Journal of Environmental Research and Public Health 17, no. 12: 4226. https://doi.org/10.3390/ijerph17124226
APA StyleAlfawaz, H., Khan, N., Alhuthayli, H., Wani, K., Aljumah, M. A., Khattak, M. N. K., Alghanim, S. A., & Al-Daghri, N. M. (2020). Awareness and Knowledge Regarding the Consumption of Dietary Fiber and Its Relation to Self-Reported Health Status in an Adult Arab Population: A Cross-Sectional Study. International Journal of Environmental Research and Public Health, 17(12), 4226. https://doi.org/10.3390/ijerph17124226