Variations of Workload Indices Prior to Injuries: A Study in Trail Runners


Abstract
1. Introduction
2. Materials and Methods
2.1. Participants
2.2. Experimental Approach to the Problem
2.3. Injuries Occurrence
2.4. Training Load Monitoring
2.4.1. Distance Covered
2.4.2. Rate of Perceived Exertion
2.4.3. Workload Indices
3. Statistical Analysis
4. Results
5. Discussion
6. Conclusions
Author Contributions
Funding
Conflicts of Interest
References
- Viru, A.; Viru, M. Nature of training effects. In Exercise and Sport Science; Lippincott Williams & Wilkins: Philadelphia, PA, USA, 2000; pp. 67–95. [Google Scholar]
- Bartlett, J.D.; O’Connor, F.; Pitchford, N.; Torres-Ronda, L.; Robertson, S.J. Relationships Between Internal and External Training Load in Team-Sport Athletes: Evidence for an Individualized Approach. Int. J. Sports Physiol. Perform. 2017, 12, 230–234. [Google Scholar] [CrossRef]
- Mujika, I. Quantification of Training and Competition Loads in Endurance Sports: Methods and Applications. Int. J. Sports Physiol. Perform. 2017, 12, S2-9–S2-17. [Google Scholar] [CrossRef]
- Gabbett, T.J.; Nassis, G.P.; Oetter, E.; Pretorius, J.; Johnston, N.; Medina, D.; Rodas, G.; Myslinski, T.; Howells, D.; Beard, A.; et al. The athlete monitoring cycle: A practical guide to interpreting and applying training monitoring data. Br. J. Sports Med. 2017, 51, 1451–1452. [Google Scholar] [CrossRef]
- Foster, C.; Rodriguez-Marroyo, J.A.; de Koning, J.J. Monitoring Training Loads: The Past, the Present, and the Future. Int. J. Sports Physiol. Perform. 2017, 12, S2-2–S2-8. [Google Scholar] [CrossRef]
- Malone, J.; Di Michele, R.; Morgans, R.; Burgess, D.; Morton, J.P.; Drust, B. Seasonal Training-Load Quantification in Elite English Premier League Soccer Players. Int. J. Sports Physiol. Perform. 2015, 10, 489–497. [Google Scholar] [CrossRef]
- Impellizzeri, F.M.; Marcora, S.M.; Coutts, A.J. Internal and external training load: 15 years on. Int. J. Sports Physiol. Perform. 2019, 14, 270–273. [Google Scholar] [CrossRef]
- Bourdon, P.C.; Cardinale, M.; Murray, A.; Gastin, P.; Kellmann, M.; Varley, M.C.; Gabbett, T.J.; Coutts, A.J.; Burgess, D.J.; Gregson, W.; et al. Monitoring Athlete Training Loads: Consensus Statement. Int. J. Sports Physiol. Perform. 2017, 12, S2-161–S2-170. [Google Scholar] [CrossRef]
- Campbell, B.I.; Bove, D.; Ward, P.; Vargas, A.; Dolan, J. Quantification of Training Load and Training Response for Improving Athletic Performance. Strength Cond. J. 2017, 39, 3–13. [Google Scholar] [CrossRef]
- McLaren, S.J.; Macpherson, T.W.; Coutts, A.J.; Hurst, C.; Spears, I.R.; Weston, M. The Relationships Between Internal and External Measures of Training Load and Intensity in Team Sports: A Meta-Analysis. Sport. Med. 2018, 48, 641–658. [Google Scholar] [CrossRef]
- Burgess, D.J. The Research Doesn’t Always Apply: Practical Solutions to Evidence-Based Training-Load Monitoring in Elite Team Sports. Int. J. Sports Physiol. Perform. 2017, 12, S2-136–S2-141. [Google Scholar] [CrossRef]
- Clemente, F.M.; Clark, C.; Castillo, D.; Sarmento, H.; Nikolaidis, P.T.; Rosemann, T.; Knechtle, B. Variations of training load, monotony, and strain and dose-response relationships with maximal aerobic speed, maximal oxygen uptake, and isokinetic strength in professional soccer players. PLoS ONE 2019, 14, e0225522. [Google Scholar] [CrossRef]
- Clemente, F.M.; Silva, A.F.; Clark, C.C.T.; Conte, D.; Ribeiro, J.; Mendes, B.; Lima, R. Analyzing the Seasonal Changes and Relationships in Training Load and Wellness in Elite Volleyball Players. Int. J. Sports Physiol. Perform. 2020, 15, 731–740. [Google Scholar] [CrossRef]
- Matos, S.; Clemente, F.M.; Brandão, A.; Pereira, J.; Rosemann, T.; Nikolaidis, P.T.; Knechtle, B. Training Load, Aerobic Capacity and Their Relationship With Wellness Status in Recreational Trail Runners. Front. Physiol. 2019, 10, 1189. [Google Scholar] [CrossRef]
- Hernández-Cruz, G.; López-Walle, J.M.; Quezada-Chacón, J.T.; Jaenes Sánchez, J.C.; Rangel-Colmenero, B.R.; Reynoso-Sánchez, L.F. Impact of the internal training load over recovery-stress balance in endurance runners. J. Sport Psychol. 2017, 26, 57–62. [Google Scholar]
- Dumortier, J.; Mariman, A.; Boone, J.; Delesie, L.; Tobback, E.; Vogelaers, D.; Bourgois, J.G. Sleep, training load and performance in elite female gymnasts. Eur. J. Sport Sci. 2018, 18, 151–161. [Google Scholar] [CrossRef]
- Martínez-Silván, D.; Díaz-Ocejo, J.; Murray, A. Predictive indicators of overuse injuries in adolescent endurance athletes. Int. J. Sports Physiol. Perform. 2017, 12, 153–156. [Google Scholar] [CrossRef]
- Lu, D.; Howle, K.; Waterson, A.; Duncan, C.; Duffield, R. Workload profiles prior to injury in professional soccer players. Sci. Med. Footb. 2017, 1, 237–243. [Google Scholar] [CrossRef]
- Wang, C.; Vargas, J.T.; Stokes, T.; Steele, R.; Shrier, I. Analyzing Activity and Injury: Lessons Learned from the Acute: Chronic Workload Ratio. Sport. Med. 2020, 1–12. [Google Scholar] [CrossRef]
- Fuller, C.W.; Ekstrand, J.; Junge, A.; Andersen, T.E.; Bahr, R.; Dvorak, J.; Hagglund, M.; McCrory, P.; Meeuwisse, W.H. Consensus statement on injury definitions and data collection procedures in studies of football (soccer) injuries. Scand. J. Med. Sci. Sport. 2006, 16, 83–92. [Google Scholar] [CrossRef]
- Malone, S.; Owen, A.; Newton, M.; Mendes, B.; Collins, K.D.; Gabbett, T.J. The acute:chonic workload ratio in relation to injury risk in professional soccer. J. Sci. Med. Sport 2017, 20, 561–565. [Google Scholar] [CrossRef]
- Weiss, K.J.; Allen, S.V.; McGuigan, M.R.; Whatman, C.S. The Relationship Between Training Load and Injury in Men’s Professional Basketball. Int. J. Sports Physiol. Perform. 2017, 12, 1238–1242. [Google Scholar] [CrossRef] [PubMed]
- Timoteo, T.F.; Debien, P.B.; Miloski, B.; Werneck, F.Z.; Gabbett, T.; Bara Filho, M.G. Influence of Workload and Recovery on Injuries in Elite Male Volleyball Players. J. Strength Cond. Res. 2018. Available online: https://www.researchgate.net/profile/Paula_Debien/publication/325697891_The_influence_of_workload_and_recovery_on_injuries_in_elite_male_volleyball_players/links/5b7caa564585151fd12685b9/The-influence-of-workload-and-recovery-on-injuries-in-elite-male-volleyball-players.pdf (accessed on 4 June 2020).
- Rojas-Valverde, D.; Sánchez-Ureña, B.; Pino-Ortega, J.; Gómez-Carmona, C.; Gutiérrez-Vargas, R.; Timón, R.; Olcina, G. External workload indicators of muscle and kidney mechanical injury in endurance trail running. Int. J. Environ. Res. Public Health 2019, 16, 3909. [Google Scholar] [CrossRef] [PubMed]
- Gabbett, T.J. The training-injury prevention paradox: Should athletes be training smarter and harder? Br. J. Sports Med. 2016, 50, 273–280. [Google Scholar] [CrossRef] [PubMed]
- Malone, S.; Roe, M.; Doran, D.A.; Gabbett, T.J.; Collins, K.D. Protection Against Spikes in Workload With Aerobic Fitness and Playing Experience: The Role of the Acute: Chronic Workload Ratio on Injury Risk in Elite Gaelic Football. Int. J. Sports Physiol. Perform. 2017, 12, 393–401. [Google Scholar] [CrossRef]
- Gabbett, T.J. Debunking the myths about training load, injury and performance: Empirical evidence, hot topics and recommendations for practitioners. Br. J. Sports Med. 2020, 54, 58–66. [Google Scholar] [CrossRef]
- Halson, S.L. Monitoring Training Load to Understand Fatigue in Athletes. Sport. Med. 2014, 44, 139–147. [Google Scholar] [CrossRef]
- Foster, C.; Florhaug, J.A.; Franklin, J.; Gottschall, L.; Hrovatin, L.A.; Parker, S.; Doleshal, P.; Dodge, C. A new approach to monitoring exercise training. J. Strength Cond. Res. 2001, 15, 109–115. [Google Scholar]
- Jeong, T.S.; Reilly, T.; Morton, J.; Bae, S.W.; Drust, B. Quantification of the physiological loading of one week of “pre-season” and one week of “in-season” training in professional soccer players. J. Sports Sci. 2011, 29, 1161–1166. [Google Scholar] [CrossRef]
- Manzi, V.; Bovenzi, A.; Franco Impellizzeri, M.; Carminati, I.; Castagna, C. Individual Training-Load and Aerobic-Fitness Variables in Premiership Soccer Players During the Precompetitive Season. J. Strength Cond. Res. 2013, 27, 631–636. [Google Scholar] [CrossRef]
- Rodríguez-Marroyo, J.A.; Medina, J.; García-López, J.; García-Tormo, J.V.; Foster, C. Correspondence between training load executed by volleyball players and the one observed by coaches. J. Strength Cond. Res. 2014, 28, 1588–1594. [Google Scholar] [CrossRef]
- Algrøy, E.A.; Hetlelid, K.J.; Seiler, S.; Pedersen, J.I.S. Quantifying Training Intensity Distribution in a Group of Norwegian Professional Soccer Players. Int. J. Sports Physiol. Perform. 2011, 6, 70–81. [Google Scholar] [CrossRef] [PubMed]
- Rogalski, B.; Dawson, B.; Heasman, J.; Gabbett, T.J. Training and game loads and injury risk in elite Australian footballers. J. Sci. Med. Sport 2013, 16, 499–503. [Google Scholar] [CrossRef] [PubMed]
- Hulin, B.T.; Gabbett, T.J.; Lawson, D.W.; Caputi, P.; Sampson, J.A.; Caputi, P.; Sampson, J.A. The acute: Chronic workload ratio predicts injury: High chronic workload may decrease injury risk in elite rugby league players. Br. J. Sports Med. 2016, 50, 231–236. [Google Scholar] [CrossRef] [PubMed]
- Maupin, D.; Schram, B.; Canetti, E.; Orr, R. The Relationship Between Acute: Chronic Workload Ratios and Injury Risk in Sports: A Systematic Review. Open Access J. Sport. Med. 2020, 11, 51–75. [Google Scholar] [CrossRef] [PubMed]
- Hulin, B.T.; Gabbett, T.J.; Caputi, p.; Lawson, D.W.; Sampson, J.A.; Caputi, P.; Lawson, D.W.; Sampson, J.A. Low chronic workload and the acute: Chronic workload ratio are more predictive of injury than between-match recovery time: A two-season prospective cohort study in elite rugby league players. Br. J. Sports Med. 2016, 50, 1008–1012. [Google Scholar] [CrossRef]
- Li, R.T.; Salata, M.J.; Rambhia, S.; Sheehan, J.; Voos, J.E. Does Overexertion Correlate With Increased Injury? The Relationship Between Player Workload and Soft Tissue Injury in Professional American Football Players Using Wearable Technology. Sport. Health A Multidiscip. Approach 2020, 12, 66–73. [Google Scholar] [CrossRef]
- Foster, C. Monitoring training in athletes with reference to overtraining syndrome. Med. Sci. Sport. Exerc. 1998, 30, 1164–1168. [Google Scholar] [CrossRef]
- Delecroix, B.; Mccall, A.; Dawson, B.; Berthoin, S.; Dupont, G. Workload monotony, strain and non-contact injury incidence in professional football players. Sci. Med. Footb. 2019, 3, 105–108. [Google Scholar] [CrossRef]
- Brink, M.S.; Visscher, C.; Arends, S.; Zwerver, J.; Post, W.J.; Lemmink, K.A.P.M. Monitoring stress and recovery: New insights for the prevention of injuries and illnesses in elite youth soccer players. Br. J. Sports Med. 2010, 44, 809–815. [Google Scholar] [CrossRef]
- Windt, J.; Zumbo, B.D.; Sporer, B.; Macdonald, K.; Gabbett, T.J. Why do workload spikes cause injuries, and which athletes are at higher risk? Mediators and moderators in workload-injury investigations. Br. J. Sports Med. 2017, 51, 993–994. [Google Scholar] [CrossRef]
- Malone, S.; Hughes, B.; Doran, D.A.; Collins, K.; Gabbett, T.J. Can the workload–injury relationship be moderated by improved strength, speed and repeated-sprint qualities? J. Sci. Med. Sport 2019, 22, 29–34. [Google Scholar] [CrossRef] [PubMed]
- Scheer, V.; Janssen, T.I.; Vieluf, S.; Heitkamp, H.C. Predicting trail-running performance with laboratory exercise tests and field-based results. Int. J. Sports Physiol. Perform. 2019, 14, 130–133. [Google Scholar] [CrossRef] [PubMed]
- Malliaropoulos, N.; Mertyri, D.; Tsaklis, P. Prevalence of Injury in Ultra Trail Running. Hum. Mov. 2015, 16, 52–59. [Google Scholar] [CrossRef]
- Lopes, A.D.; Hespanhol, L.C.; Yeung, S.S.; Pena Costa, L.O. What are the Main Running Related Musculoskeletal Injuries. Sport. Med. 2012, 42, 892–905. [Google Scholar] [CrossRef] [PubMed]
- Istvan, A.O.; Yvonne, P.; Terry, J.E.; Marco, B.; Timothy, B.Q.; Henriëtte, V.H.; Gert, L.S. Common ultramarathon trail running injuries and illnesses: A review (2007–2016). Int. J. Med. Med. Sci. 2019, 11, 36–42. [Google Scholar] [CrossRef]
- Myrick, K.M. Overtraining and Overreaching Syndrome in Athletes. J. Nurse Pract. 2015, 11, 1018–1022. [Google Scholar] [CrossRef]
- Issurin, V.B. New horizons for the methodology and physiology of training periodization. Sports Med. 2010, 40, 189–206. [Google Scholar] [CrossRef] [PubMed]
- Mueller-Wohlfahrt, H.-W.; Haensel, L.; Mithoefer, K.; Ekstrand, J.; English, B.; McNally, S.; Orchard, J.; van Dijk, C.N.; Kerkhoffs, G.M.; Schamasch, P.; et al. Terminology and classification of muscle injuries in sport: The Munich consensus statement. Br. J. Sports Med. 2013, 47, 342–350. [Google Scholar] [CrossRef]
- Caminal, P.; Sola, F.; Gomis, P.; Guasch, E.; Perera, A.; Soriano, N.; Mont, L. Validity of the Polar V800 monitor for measuring heart rate variability in mountain running route conditions. Eur. J. Appl. Physiol. 2018, 118, 669–677. [Google Scholar] [CrossRef]
- Borg, G. Borg’s Perceived Exertion and Pain Scales; Human Kinetics: Champaign, IL, USA, 1998. [Google Scholar]
- Impellizzeri, F.M.; Rampinini, E.; Coutts, A.J.; Sassi, A.; Marcora, S.M. Use of RPE-based training load in soccer. Med. Sci. Sports Exerc. 2004, 36, 1042–1047. [Google Scholar] [CrossRef]
- Hulin, B.T.; Gabbett, T.J.; Blanch, P.; Chapman, P.; Bailey, D.; Orchard, J.W. Spikes in acute workload are associated with increased injury risk in elite cricket fast bowlers. Br. J. Sports Med. 2014, 48, 708–712. [Google Scholar] [CrossRef] [PubMed]
- Murray, N.B.; Gabbett, T.J.; Townshend, A.D.; Blanch, P. Calculating acute: Chronic workload ratios using exponentially weighted moving averages provides a more sensitive indicator of injury likelihood than rolling averages. Br. J. Sports Med. 2017, 51, 749–754. [Google Scholar] [CrossRef] [PubMed]
- Nielsen, R.Ø.; Parner, E.T.; Nohr, E.A.; Sørensen, H.; Lind, M.; Rasmussen, S. Excessive Progression in Weekly Running Distance and Risk of Running-Related Injuries: An Association Which Varies According to Type of Injury. J. Orthop. Sport. Phys. Ther. 2014, 44, 739–747. [Google Scholar] [CrossRef] [PubMed]
- Damsted, C.; Glad, S.; Nielsen, R.O.; Sørensen, H.; Malisoux, L. Is There Evidence For An Association Between Changes in Training Load and Running-Related Injuries? A Systematic Review. Int. J. Sports Phys. Ther. 2018, 13, 931–942. [Google Scholar] [CrossRef] [PubMed]
- Hopkins, W.G. Measures of Realiability in Sports Medicine and Science. Sport. Med. 2000, 30, 1–15. [Google Scholar] [CrossRef] [PubMed]
- Comyns, T.; Flanagan, E.P. Applications of the session rating of perceived exertion system in professional Rugby union. Strength Cond. J. 2013, 35, 78–85. [Google Scholar] [CrossRef]


| Index | Week-3 Mean ± SD | Week-2 Mean ± SD | Week-1 Mean ± SD | Injury Week Mean ± SD | p Pairwise Comparisons | Effect Size (d) | Magnitude Pairwise Comparisons |
|---|---|---|---|---|---|---|
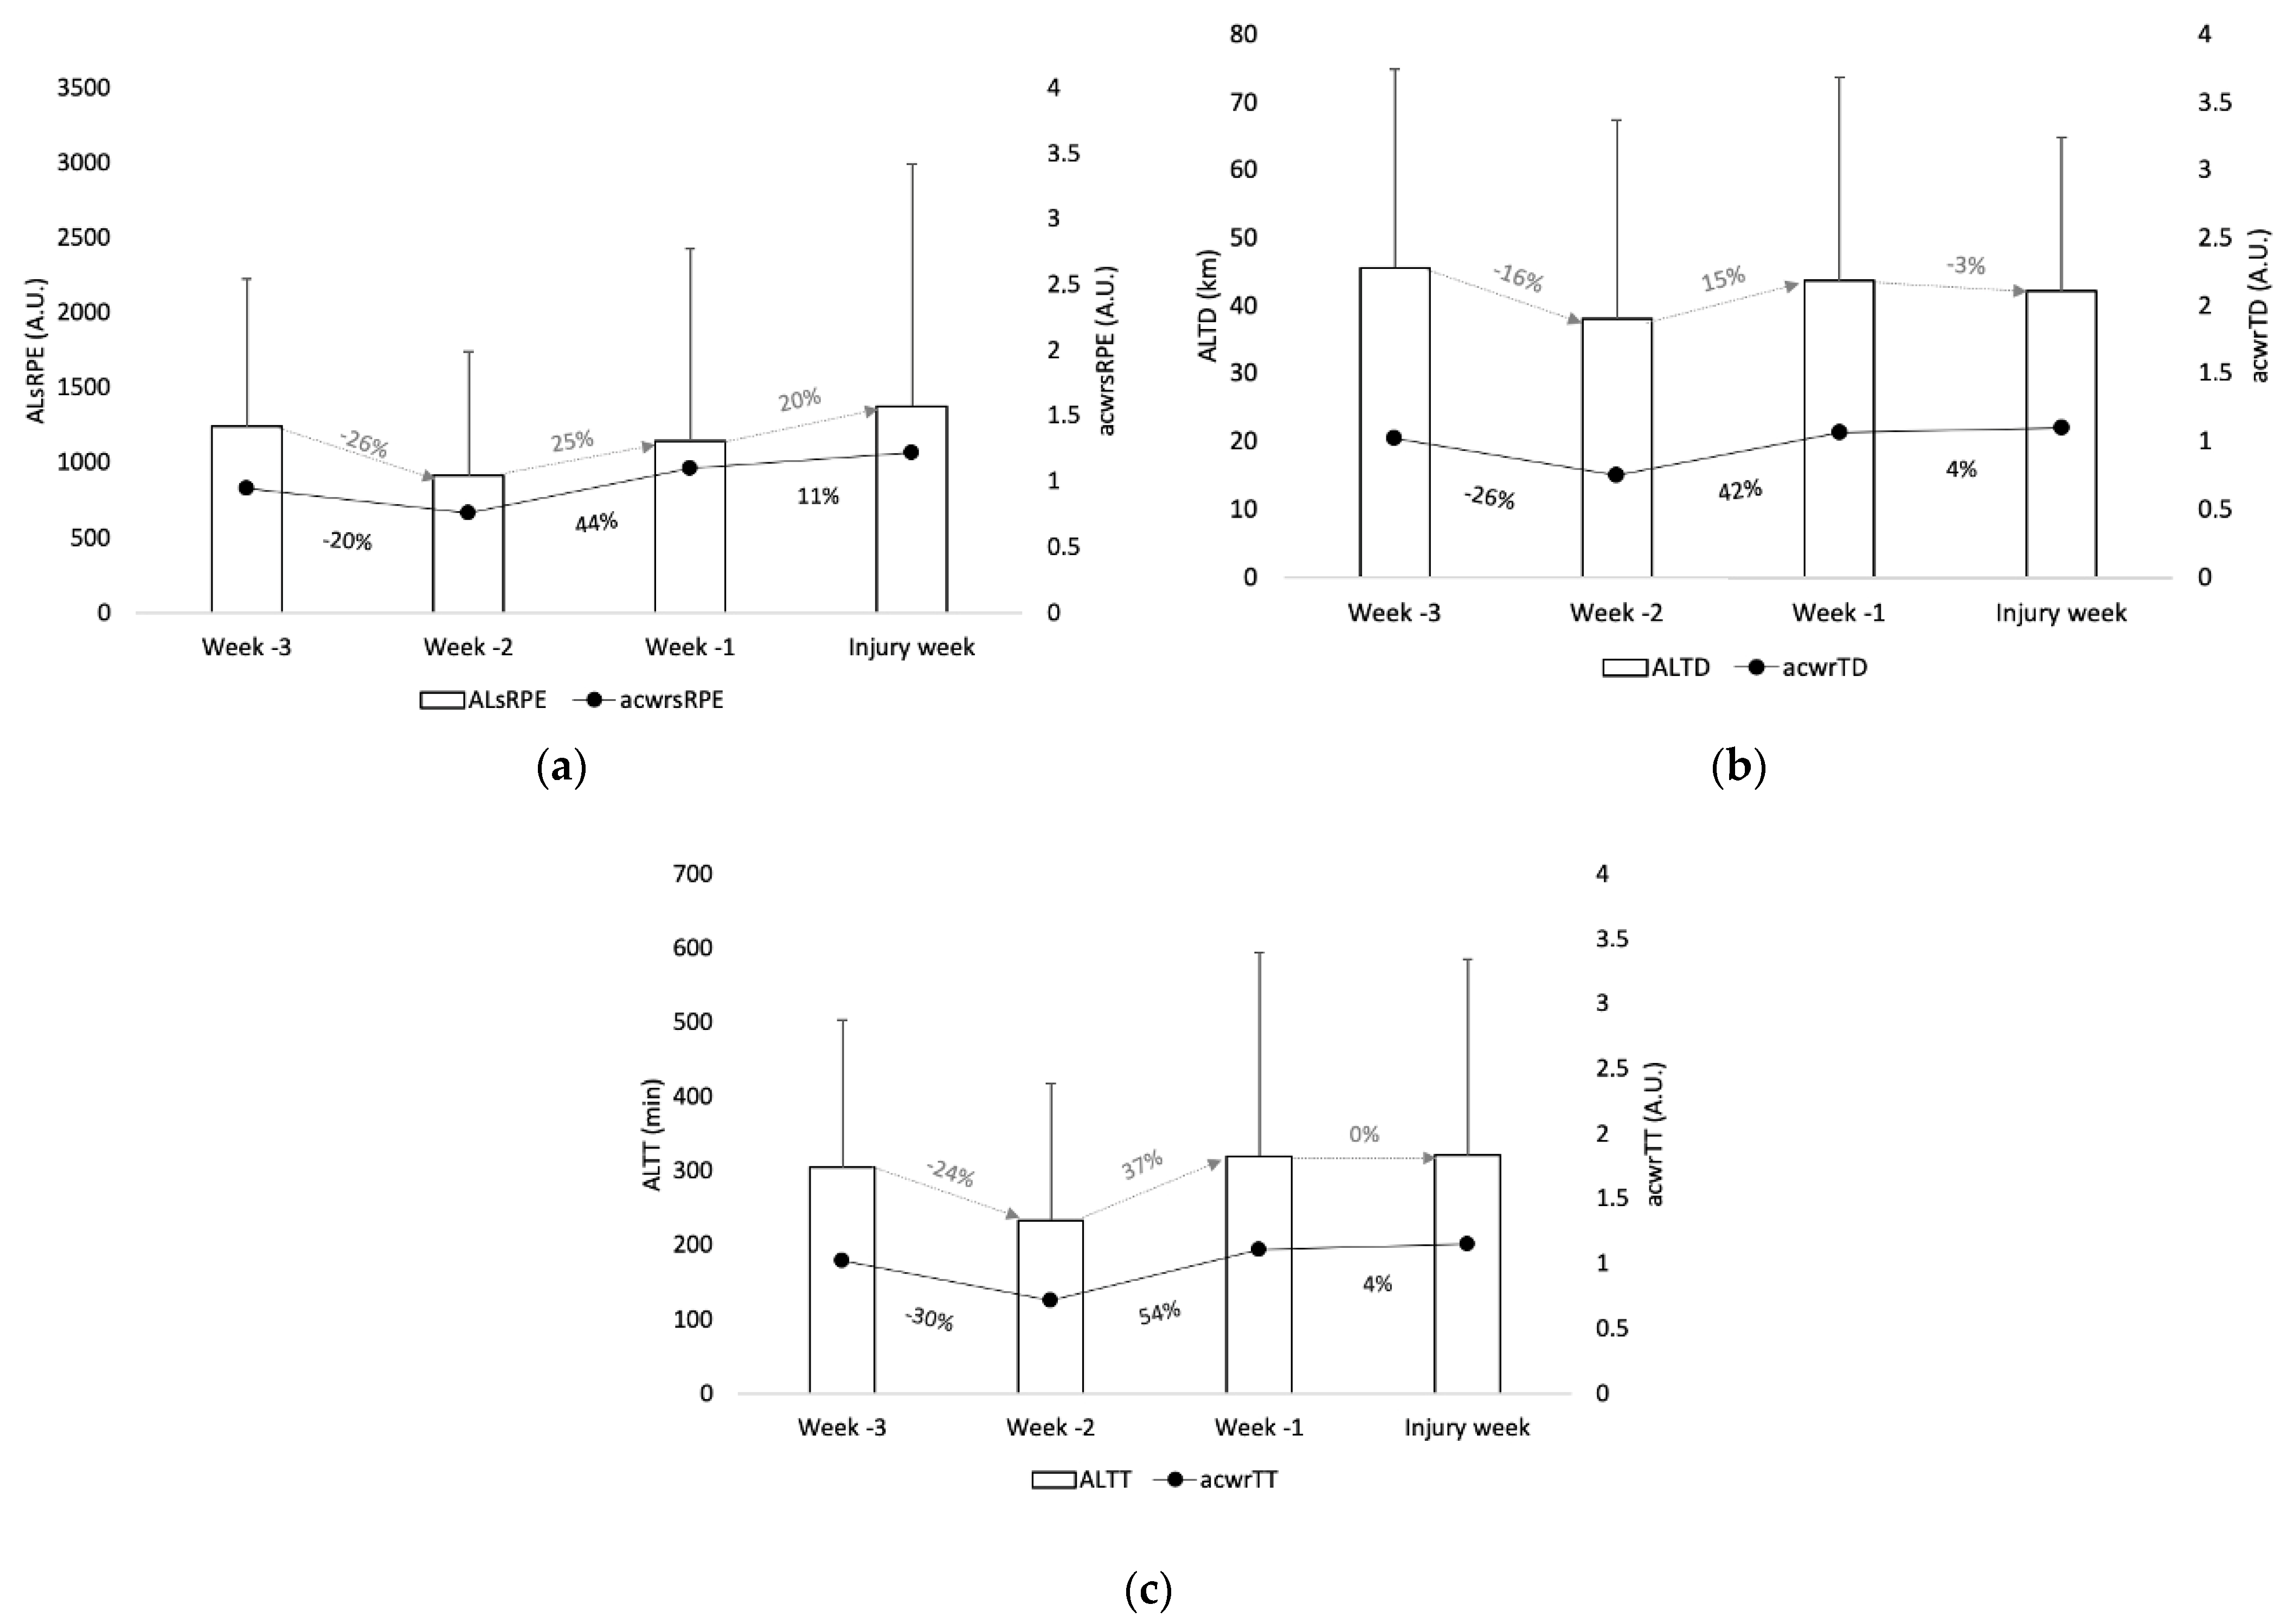
| AL (km) | 45.6 ± 29.4 | 38.1 ± 29.3 | 43.7 ± 30.1 | 42.3 ± 22.6 | w-3 vs. w-2: 0.205 w-3 vs. w-1: 0.828 w-3 vs. Iw: 0.651 w-2 vs. w-1: 0.458 w-2 vs. Iw: 0.460 w-1 vs. Iw: 0.843 | w-3 vs. w-2: 0.256, small w-3 vs. w-1: 0.064, trivial w-3 vs. Iw: 0.126, trivial w-2 vs. w-1: −0.189, trivial w-2 vs. Iw: −0.161, trivial w-1 vs. Iw: 0.053 trivial |
| ACWR (A.U.) | 1.0 ± 0.9 | 0.7 ± 0.5 | 1.1 ± 0.7 | 1.1 ± 0.6 | w-3 vs. w-2: 0.229 w-3 vs. w-1: 0.857 w-3 vs. Iw: 0.681 w-2 vs. w-1: 0.102 w-2 vs. Iw: 0.077 w-1 vs. Iw: 0.792 | w-3 vs. w-2: 0.412 small w-3 vs. w-1: −0.124 trivial w-3 vs. Iw: −0.131 trivial w-2 vs. w-1: −0.658 moderate w-2 vs. Iw: −0.724 moderate w-1 vs. Iw: <0.001 trivial |
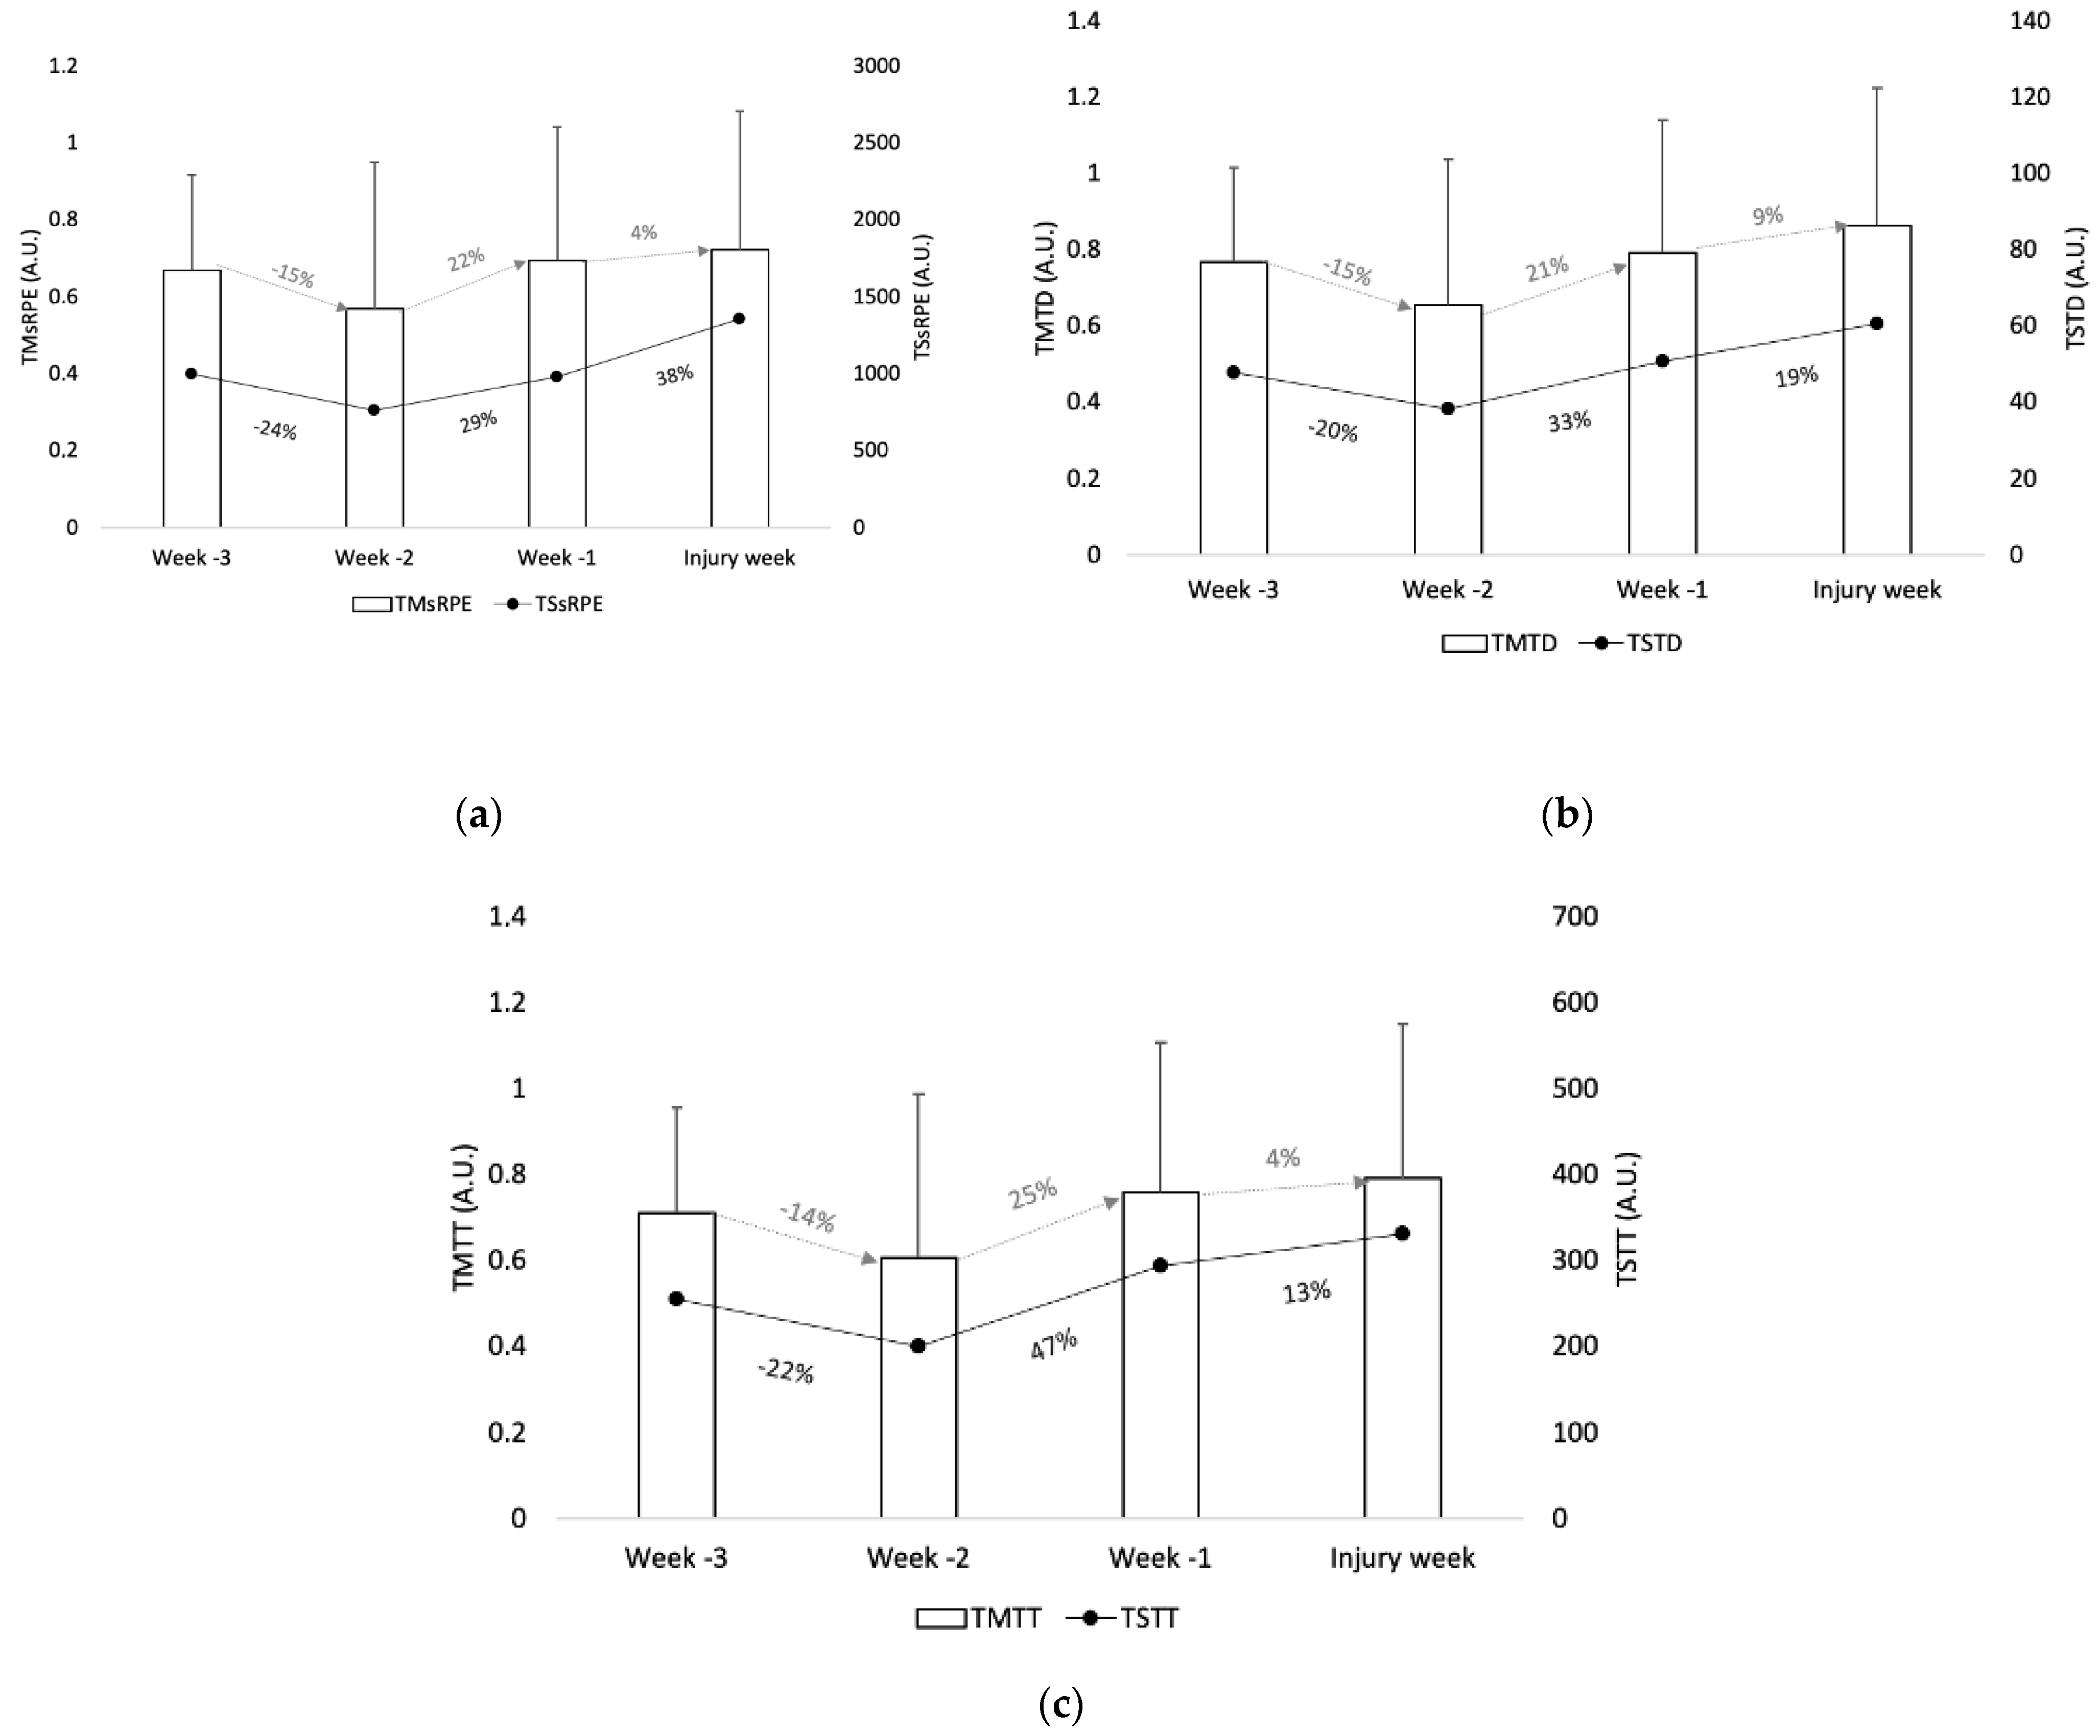
| TM (A.U.) | 0.8 ± 0.3 | 0.7 ± 0.4 | 0.8 ± 0.4 | 0.9 ± 0.5 | w-3 vs. w-2: 0.217 w-3 vs. w-1: 0.832 w-3 vs. Iw: 0.406 w-2 vs. w-1: 0.236 w-2 vs. Iw: 0.063 w-1 vs. Iw: 0.561 | w-3 vs. w-2: 0.283 small w-3 vs. w-1: <0.001 trivial w-3 vs. Iw: −0.243 small w-2 vs. w-1: −0.250 small w-2 vs. Iw: −0.442 small w-1 vs. Iw: −0.221 small |
| TS (A.U.) | 47.8 ± 43.3 | 38.2 ± 38.7 | 50.7 ± 50.7 | 60.5 ± 99.9 | w-3 vs. w-2: 0.269 w-3 vs. w-1: 0.825 w-3 vs. Iw: 0.487 w-2 vs. w-1: 0.289 w-2 vs. Iw: 0.279 w-1 vs. Iw: 0.613 | w-3 vs. w-2: 0.234 small w-3 vs. w-1: −0.062 trivial w-3 vs. Iw: −0.165 trivial w-2 vs. w-1: −0.277 small w-2 vs. Iw: −0.294 small w-1 vs. Iw: −0.124 trivial |
| Index | Week-3 Mean ± SD | Week-2 Mean ± SD | Week-1 Mean ± SD | Injury Week Mean ± SD | p Pairwise Comparisons | Effect Size (d) | Magnitude Pairwise Comparisons |
|---|---|---|---|---|---|---|
| AL (min) | 305.7 ± 198.4 | 233.4 ± 184.8 | 320.7 ± 273.5 | 321.1 ± 263.9 | w-3 vs. w-2: 0.074 w-3 vs. w-1: 0.793 w-3 vs. Iw: 0.759 w-2 vs. w-1: 0.145 w-2 vs. Iw: 0.126 w-1 vs. Iw: 0.993 | w-3 vs. w-2: 0.377 small w-3 vs. w-1: −0.063 trivial w-3 vs. Iw: −0.066 trivial w-2 vs. w-1: −0.374 small w-2 vs. Iw: −0.385 small w-1 vs. Iw: −0.002 trivial |
| ACWR (A.U.) | 1.0 ± 0.9 | 0.7 ± 0.5 | 1.1 ± 0.8 | 1.2 ± 0.6 | w-3 vs. w-2: 0.192 w-3 vs. w-1: 0.686 w-3 vs. Iw: 0.579 w-2 vs. w-1: 0.054 w-2 vs. Iw: 0.047 w-1 vs. Iw: 0.893 | w-3 vs. w-2: 0.412 small w-3 vs. w-1: −0.117 trivial w-3 vs. Iw: −0.262 small w-2 vs. w-1: −0.600 moderate w-2 vs. Iw: −0.905 small w-1 vs. Iw: −0.141 trivial |
| TM (A.U.) | 0.7 ± 0.3 | 0.6 ± 0.4 | 0.8 ± 0.4 | 0.8 ± 0.4 | w-3 vs. w-2: 0.222 w-3 vs. w-1: 0.648 w-3 vs. Iw: 0.395 w-2 vs. w-1: 0.164 w-2 vs. Iw: 0.058 w-1 vs. Iw: 0.748 | w-3 vs. w-2: 0.283 small w-3 vs. w-1: −0.283 small w-3 vs. Iw: −0.283 small w-2 vs. w-1: −0.500 small w-2 vs. Iw: −0.500 small w-1 vs. Iw: 0.000 trivial |
| TS (A.U.) | 256.2 ± 216.0 | 200.0 ± 206.1 | 294.0 ± 294.4 | 331.2 ± 503.6 | w-3 vs. w-2: 0.239 w-3 vs. w-1: 0.591 w-3 vs. Iw: 0.396 w-2 vs. w-1: 0.152 w-2 vs. Iw: 0.218 w-1 vs. Iw: 0.704 | w-3 vs. w-2: 0.266 small w-3 vs. w-1: −0.146 trivial w-3 vs. Iw: −0.194 trivial w-2 vs. w-1: −0.370 small w-2 vs. Iw: −0.341 small w-1 vs. Iw: −0.090 trivial |
| Index | Week-3 Mean±SD | Week-2 Mean±SD | Week-1 Mean±SD | Injury Week Mean±SD | p Pairwise Comparisons | Effect Size (d) | Magnitude Pairwise Comparisons |
|---|---|---|---|---|---|---|
| AL (A.U.) | 1244.0 ± 982.3 | 917.1 ± 827.3 | 1147.9 ± 1282.0 | 1378.8 ± 1617.0 | w-3 vs. w-2: 0.047 w-3 vs. w-1: 0.717 w-3 vs. Iw: 0.618 w-2 vs. w-1: 0.397 w-2 vs. Iw: 0.115 w-1 vs. Iw: 0.356 | w-3 vs. w-2: 0.360 small w-3 vs. w-1: 0.084 trivial w-3 vs. Iw: −0.101 trivial w-2 vs. w-1: −0.214 small w-2 vs. Iw: −0.360 small w-1 vs. Iw: −0.158 trivial |
| ACWR (A.U.) | 0.9 ± 0.9 | 0.8 ± 0.7 | 1.1 ± 0.9 | 1.2 ± 0.6 | w-3 vs. w-2: 0.493 w-3 vs. w-1: 0.545 w-3 vs. Iw: 0.277 w-2 vs. w-1: 0.134 w-2 vs. Iw: 0.052 w-1 vs. Iw: 0.655 | w-3 vs. w-2: 0.124 trivial w-3 vs. w-1: −0.222 small w-3 vs. Iw: −0.392 small w-2 vs. w-1: −0.372 small w-2 vs. Iw: −0.614 moderate w-1 vs. Iw: −0.131 trivial |
| TM (A.U.) | 0.7 ± 0.2 | 0.6 ± 0.4 | 0.7 ± 0.3 | 0.7 ± 0.4 | w-3 vs. w-2: 0.217 w-3 vs. w-1: 0.790 w-3 vs. Iw: 0.536 w-2 vs. w-1: 0.202 w-2 vs. Iw: 0.083 w-1 vs. Iw: 0.712 | w-3 vs. w-2: 0.316 small w-3 vs. w-1: <0.001 trivial w-3 vs. Iw: <0.001 trivial w-2 vs. w-1: −0.283 small w-2 vs. Iw: −0.250 small w-1 vs. Iw: 0.000 trivial |
| TS (A.U.) | 997.4 ± 1021.9 | 760.8 ± 882.7 | 981.3 ± 1168.7 | 1359.0 ± 2538.9 | w-3 vs. w-2: 0.184 w-3 vs. w-1: 0.949 w-3 vs. Iw: 0.379 w-2 vs. w-1: 0.401 w-2 vs. Iw: 0.214 w-1 vs. Iw: 0.396 | w-3 vs. w-2: 0.248 small w-3 vs. w-1: 0.015 trivial w-3 vs. Iw: −0.187 small w-2 vs. w-1: −0.213 small w-2 vs. Iw: −0.315 small w-1 vs. Iw: −0.191 trivial |
© 2020 by the authors. Licensee MDPI, Basel, Switzerland. This article is an open access article distributed under the terms and conditions of the Creative Commons Attribution (CC BY) license (http://creativecommons.org/licenses/by/4.0/).
Share and Cite
Matos, S.; Clemente, F.M.; Silva, R.; Cancela Carral, J.M. Variations of Workload Indices Prior to Injuries: A Study in Trail Runners. Int. J. Environ. Res. Public Health 2020, 17, 4037. https://doi.org/10.3390/ijerph17114037
Matos S, Clemente FM, Silva R, Cancela Carral JM. Variations of Workload Indices Prior to Injuries: A Study in Trail Runners. International Journal of Environmental Research and Public Health. 2020; 17(11):4037. https://doi.org/10.3390/ijerph17114037
Chicago/Turabian StyleMatos, Sérgio, Filipe Manuel Clemente, Rui Silva, and José María Cancela Carral. 2020. "Variations of Workload Indices Prior to Injuries: A Study in Trail Runners" International Journal of Environmental Research and Public Health 17, no. 11: 4037. https://doi.org/10.3390/ijerph17114037
APA StyleMatos, S., Clemente, F. M., Silva, R., & Cancela Carral, J. M. (2020). Variations of Workload Indices Prior to Injuries: A Study in Trail Runners. International Journal of Environmental Research and Public Health, 17(11), 4037. https://doi.org/10.3390/ijerph17114037