Transcriptomic Response of Breast Cancer Cells MDA-MB-231 to Docosahexaenoic Acid: Downregulation of Lipid and Cholesterol Metabolism Genes and Upregulation of Genes of the Pro-Apoptotic ER-Stress Pathway

 ,
, 
Abstract
1. Introduction
2. Materials and Methods
2.1. Cell Culture and Treatment
2.2. RNA Extraction
2.3. Library Construction and RNA-seq Analysis
2.4. Quantitative RT-PCR
2.5. Statistical Analysis
3. Results and Discussion
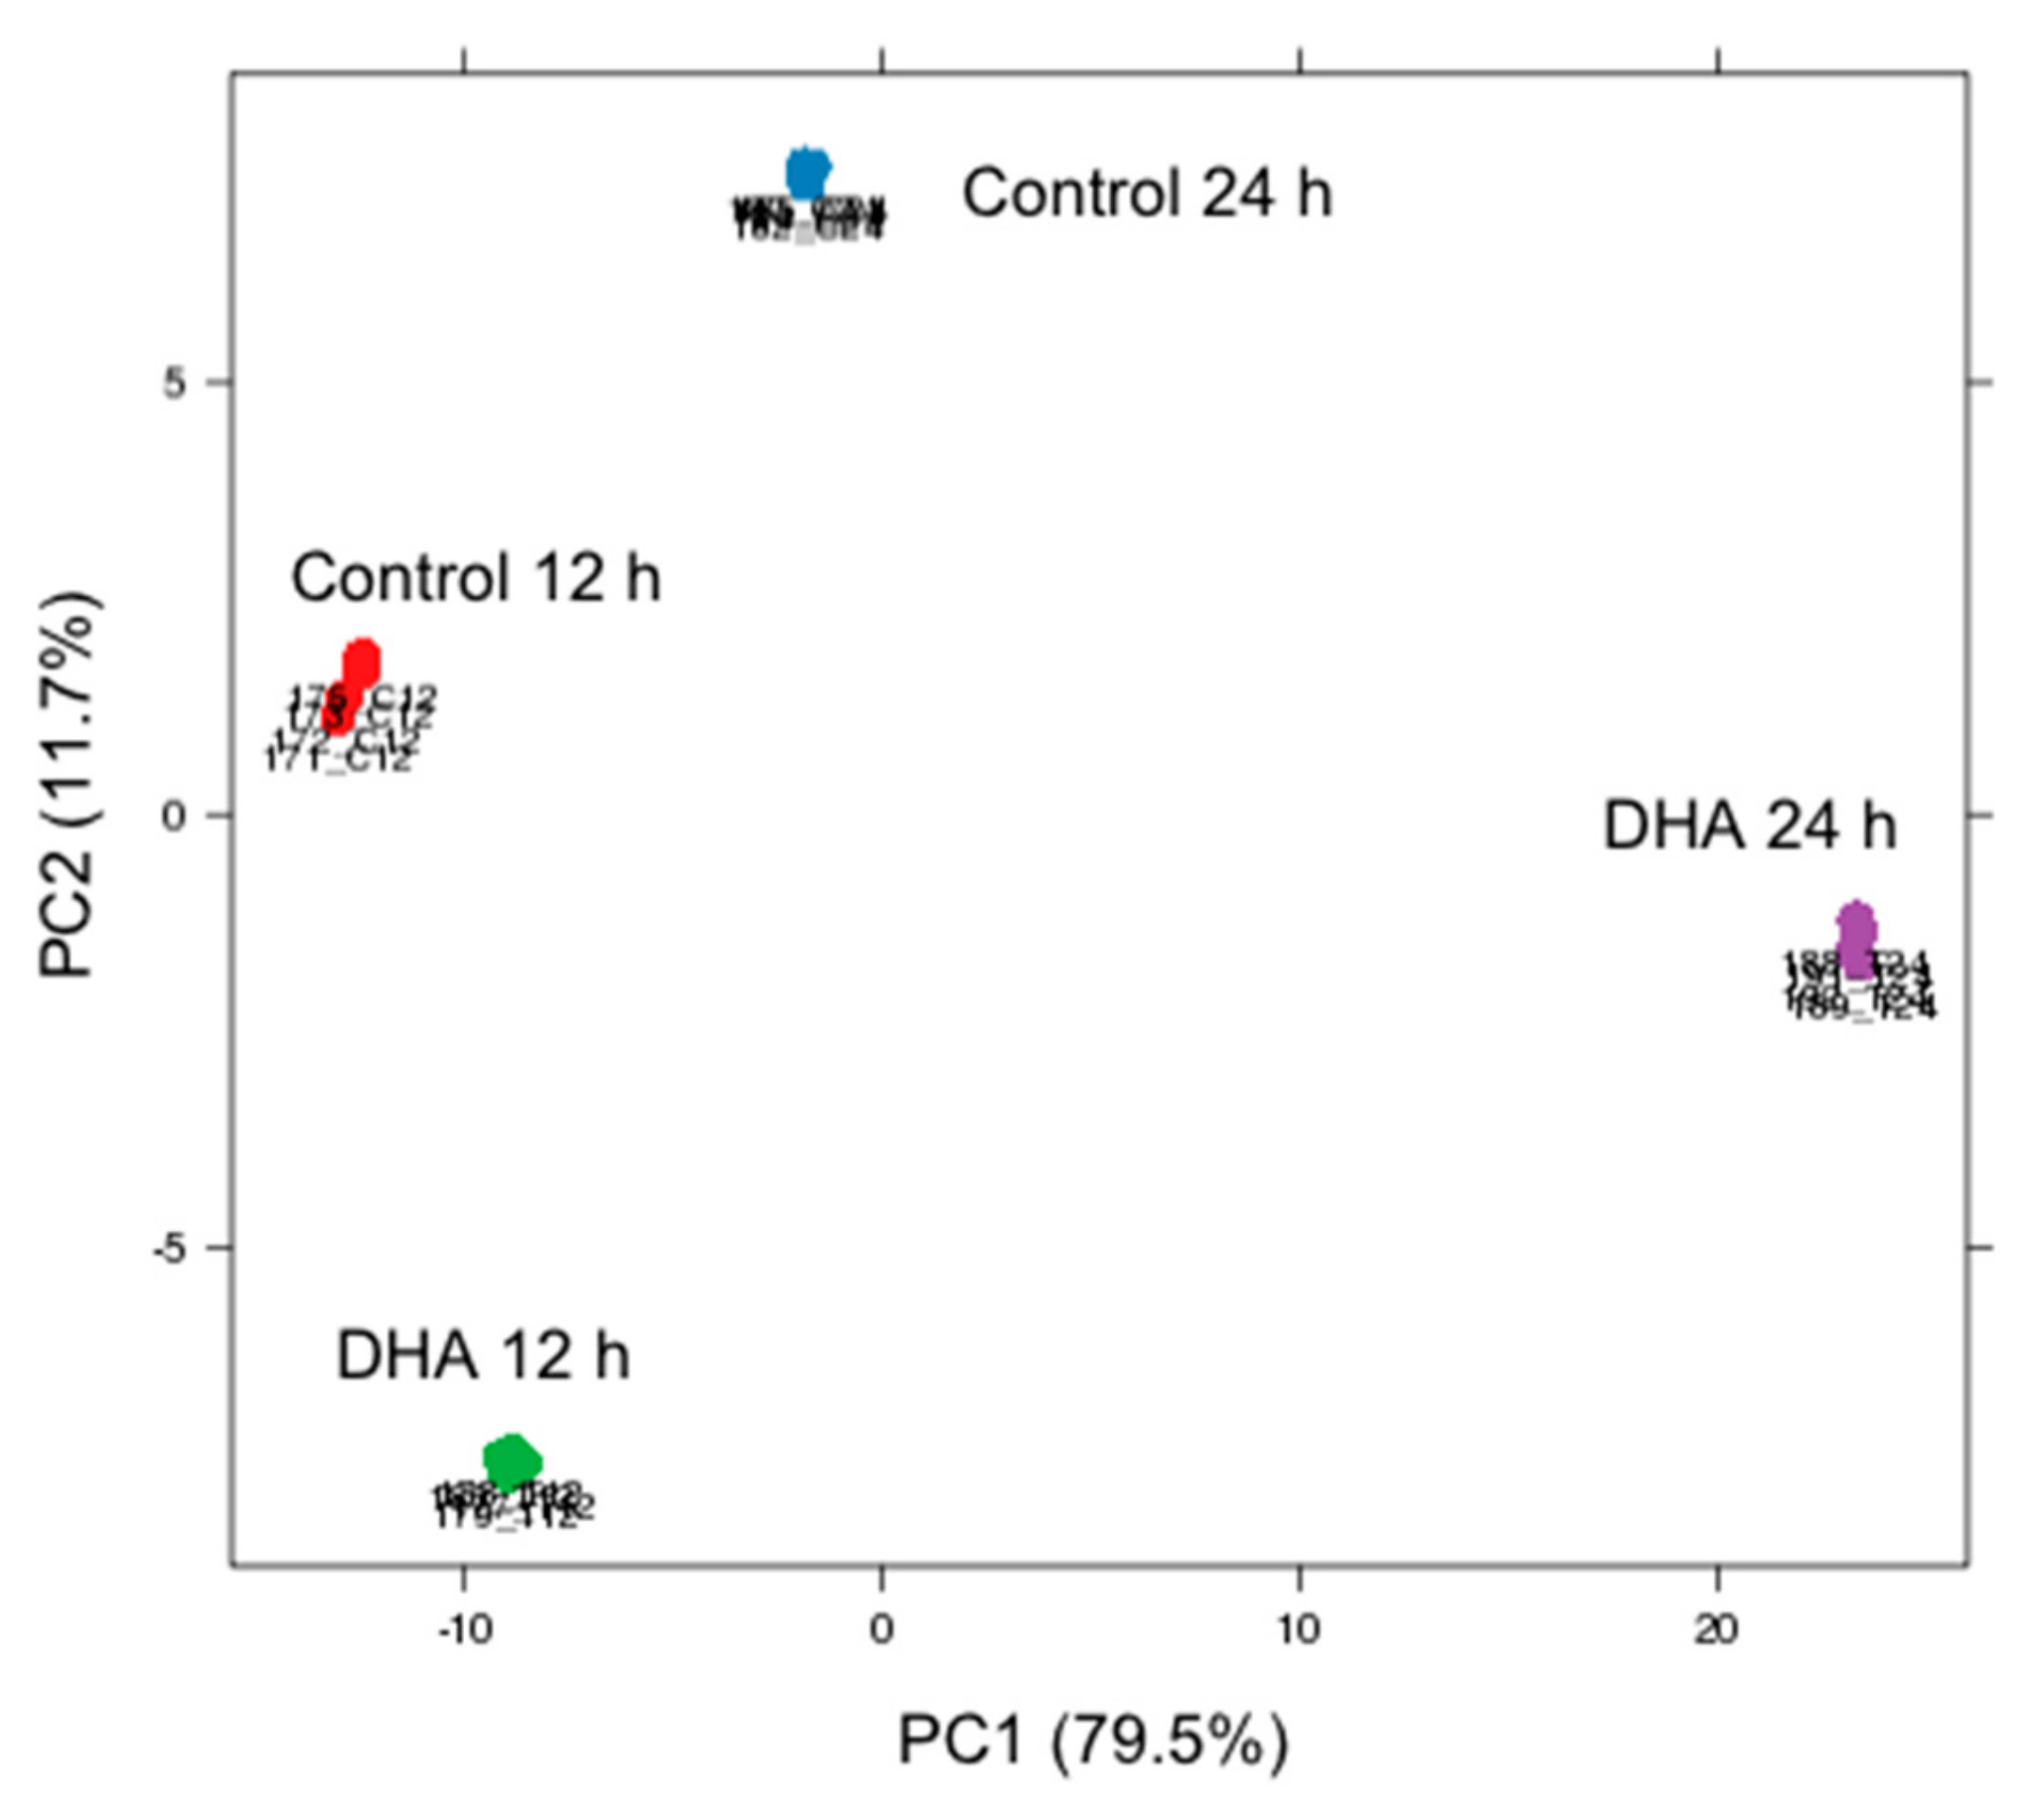
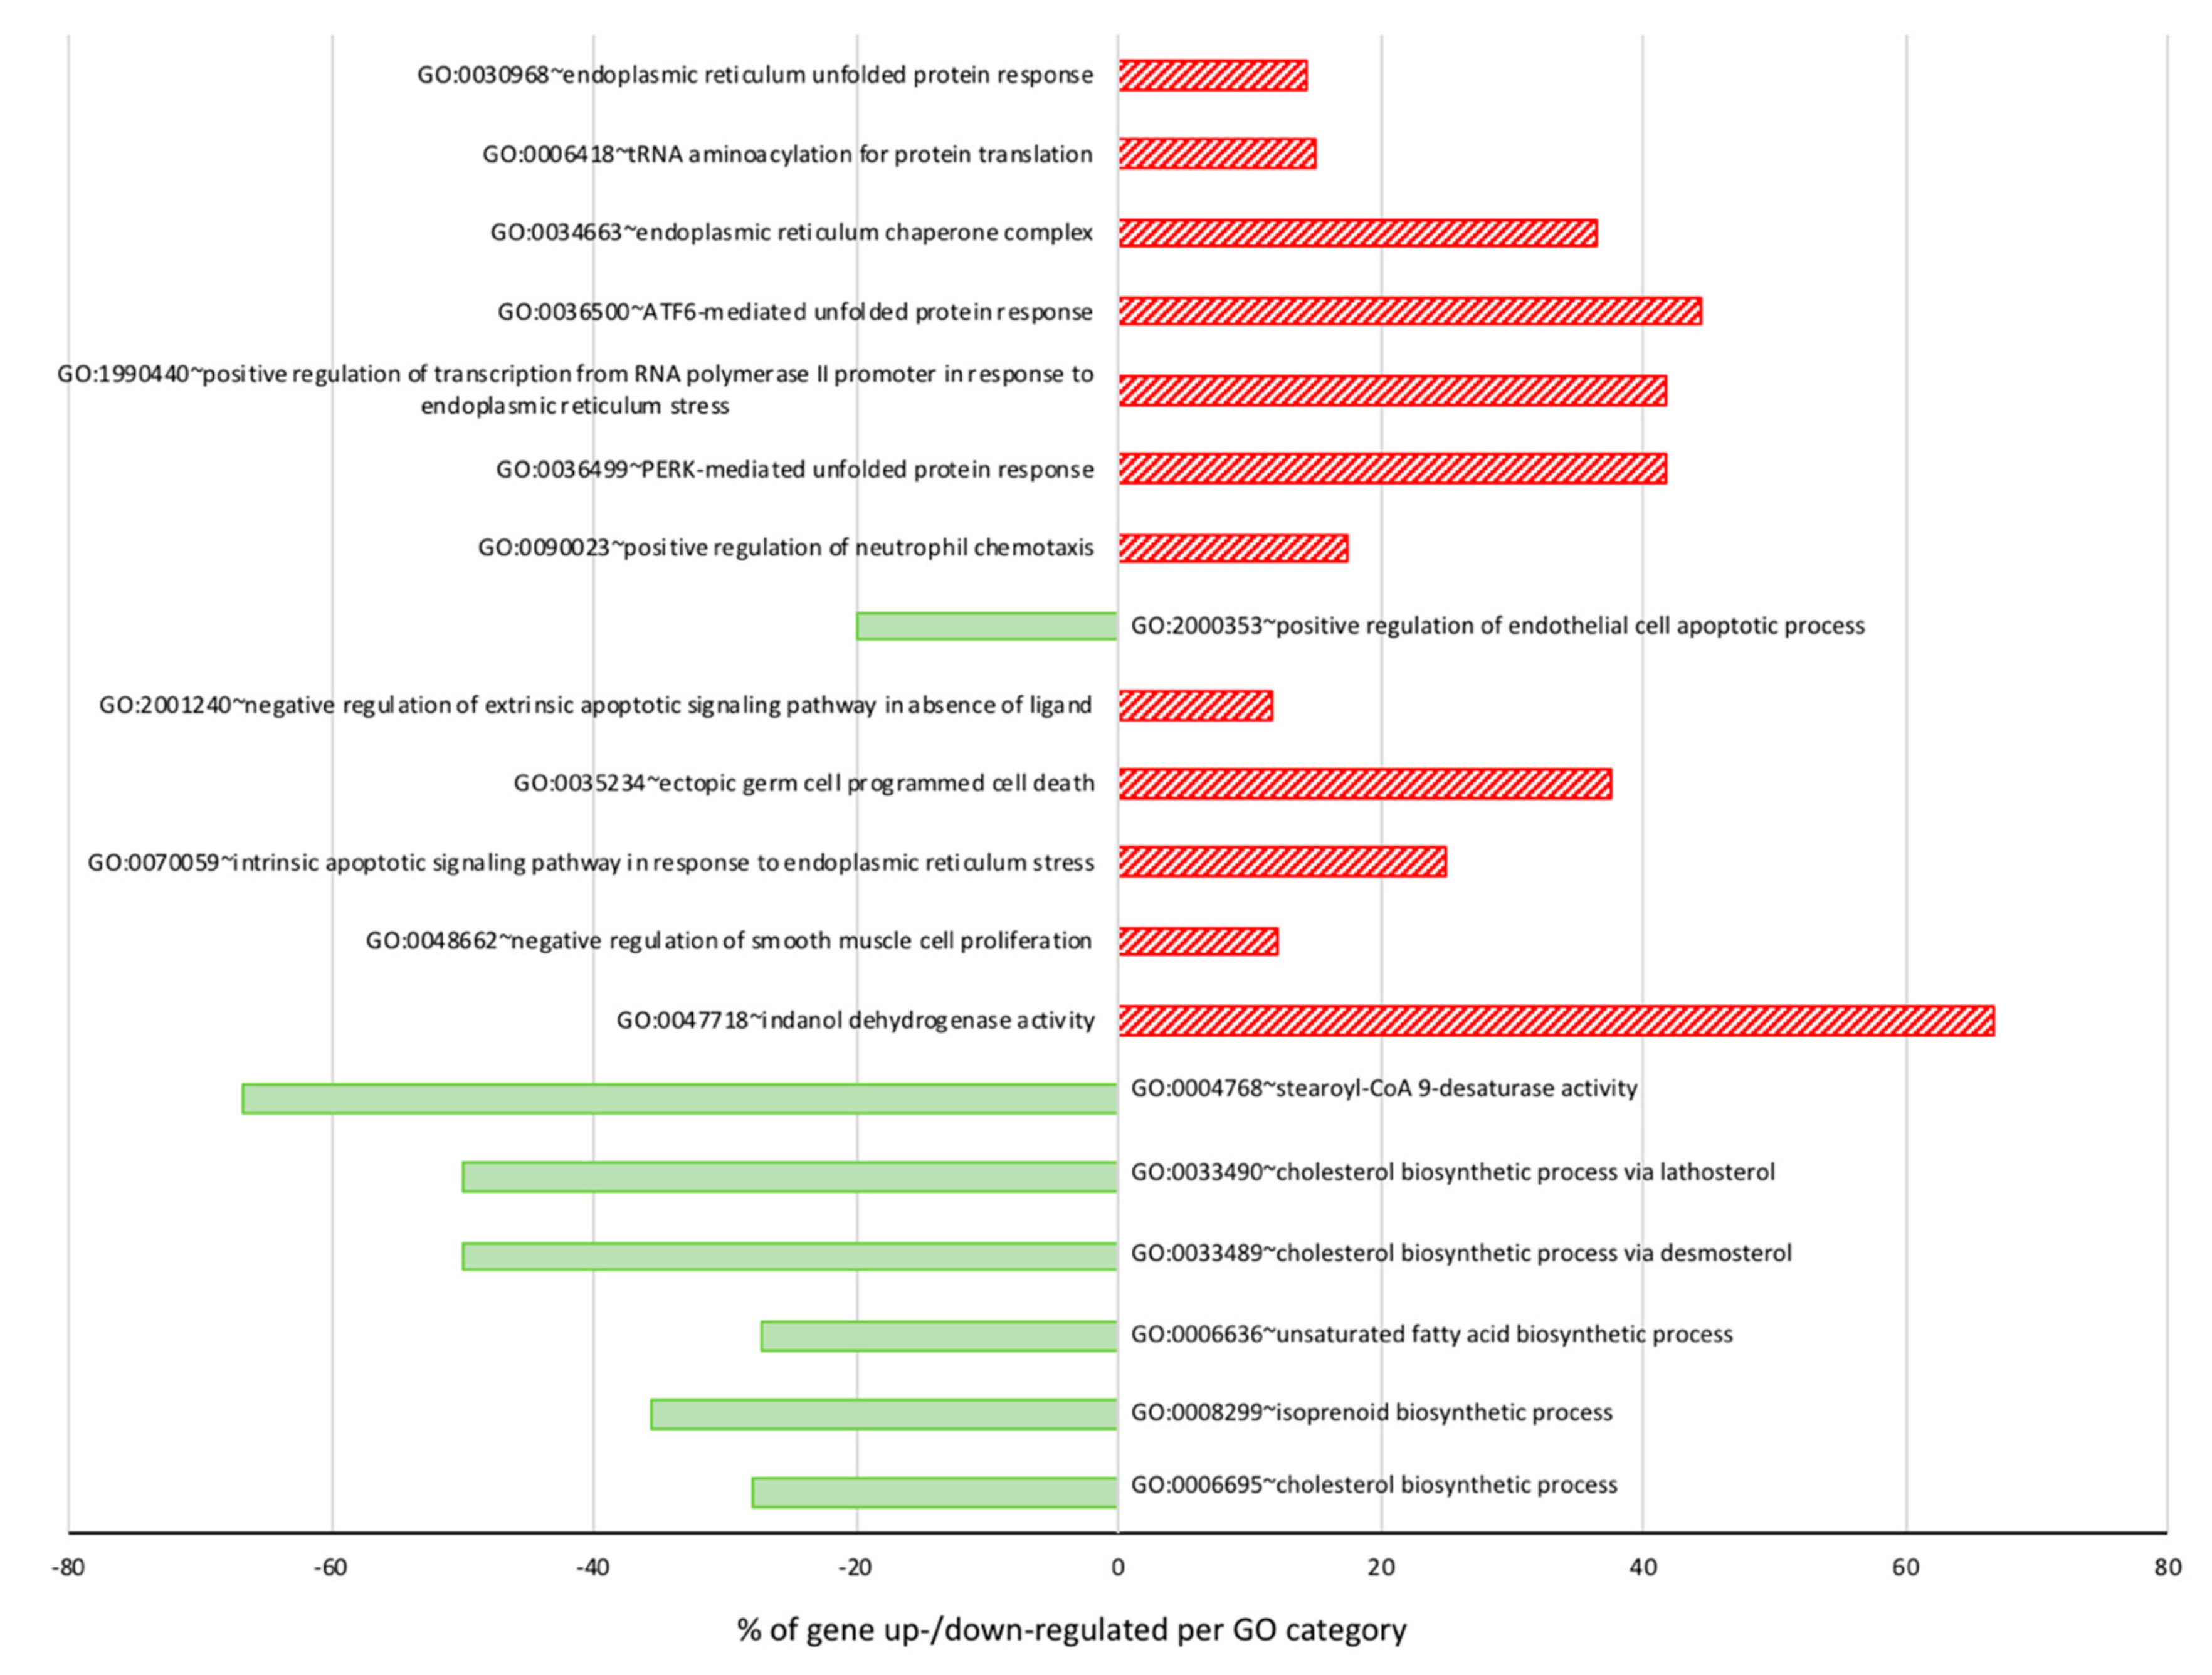
3.1. Global Overview of DHA Impact on MDA-MB-231 Cells Transcriptome
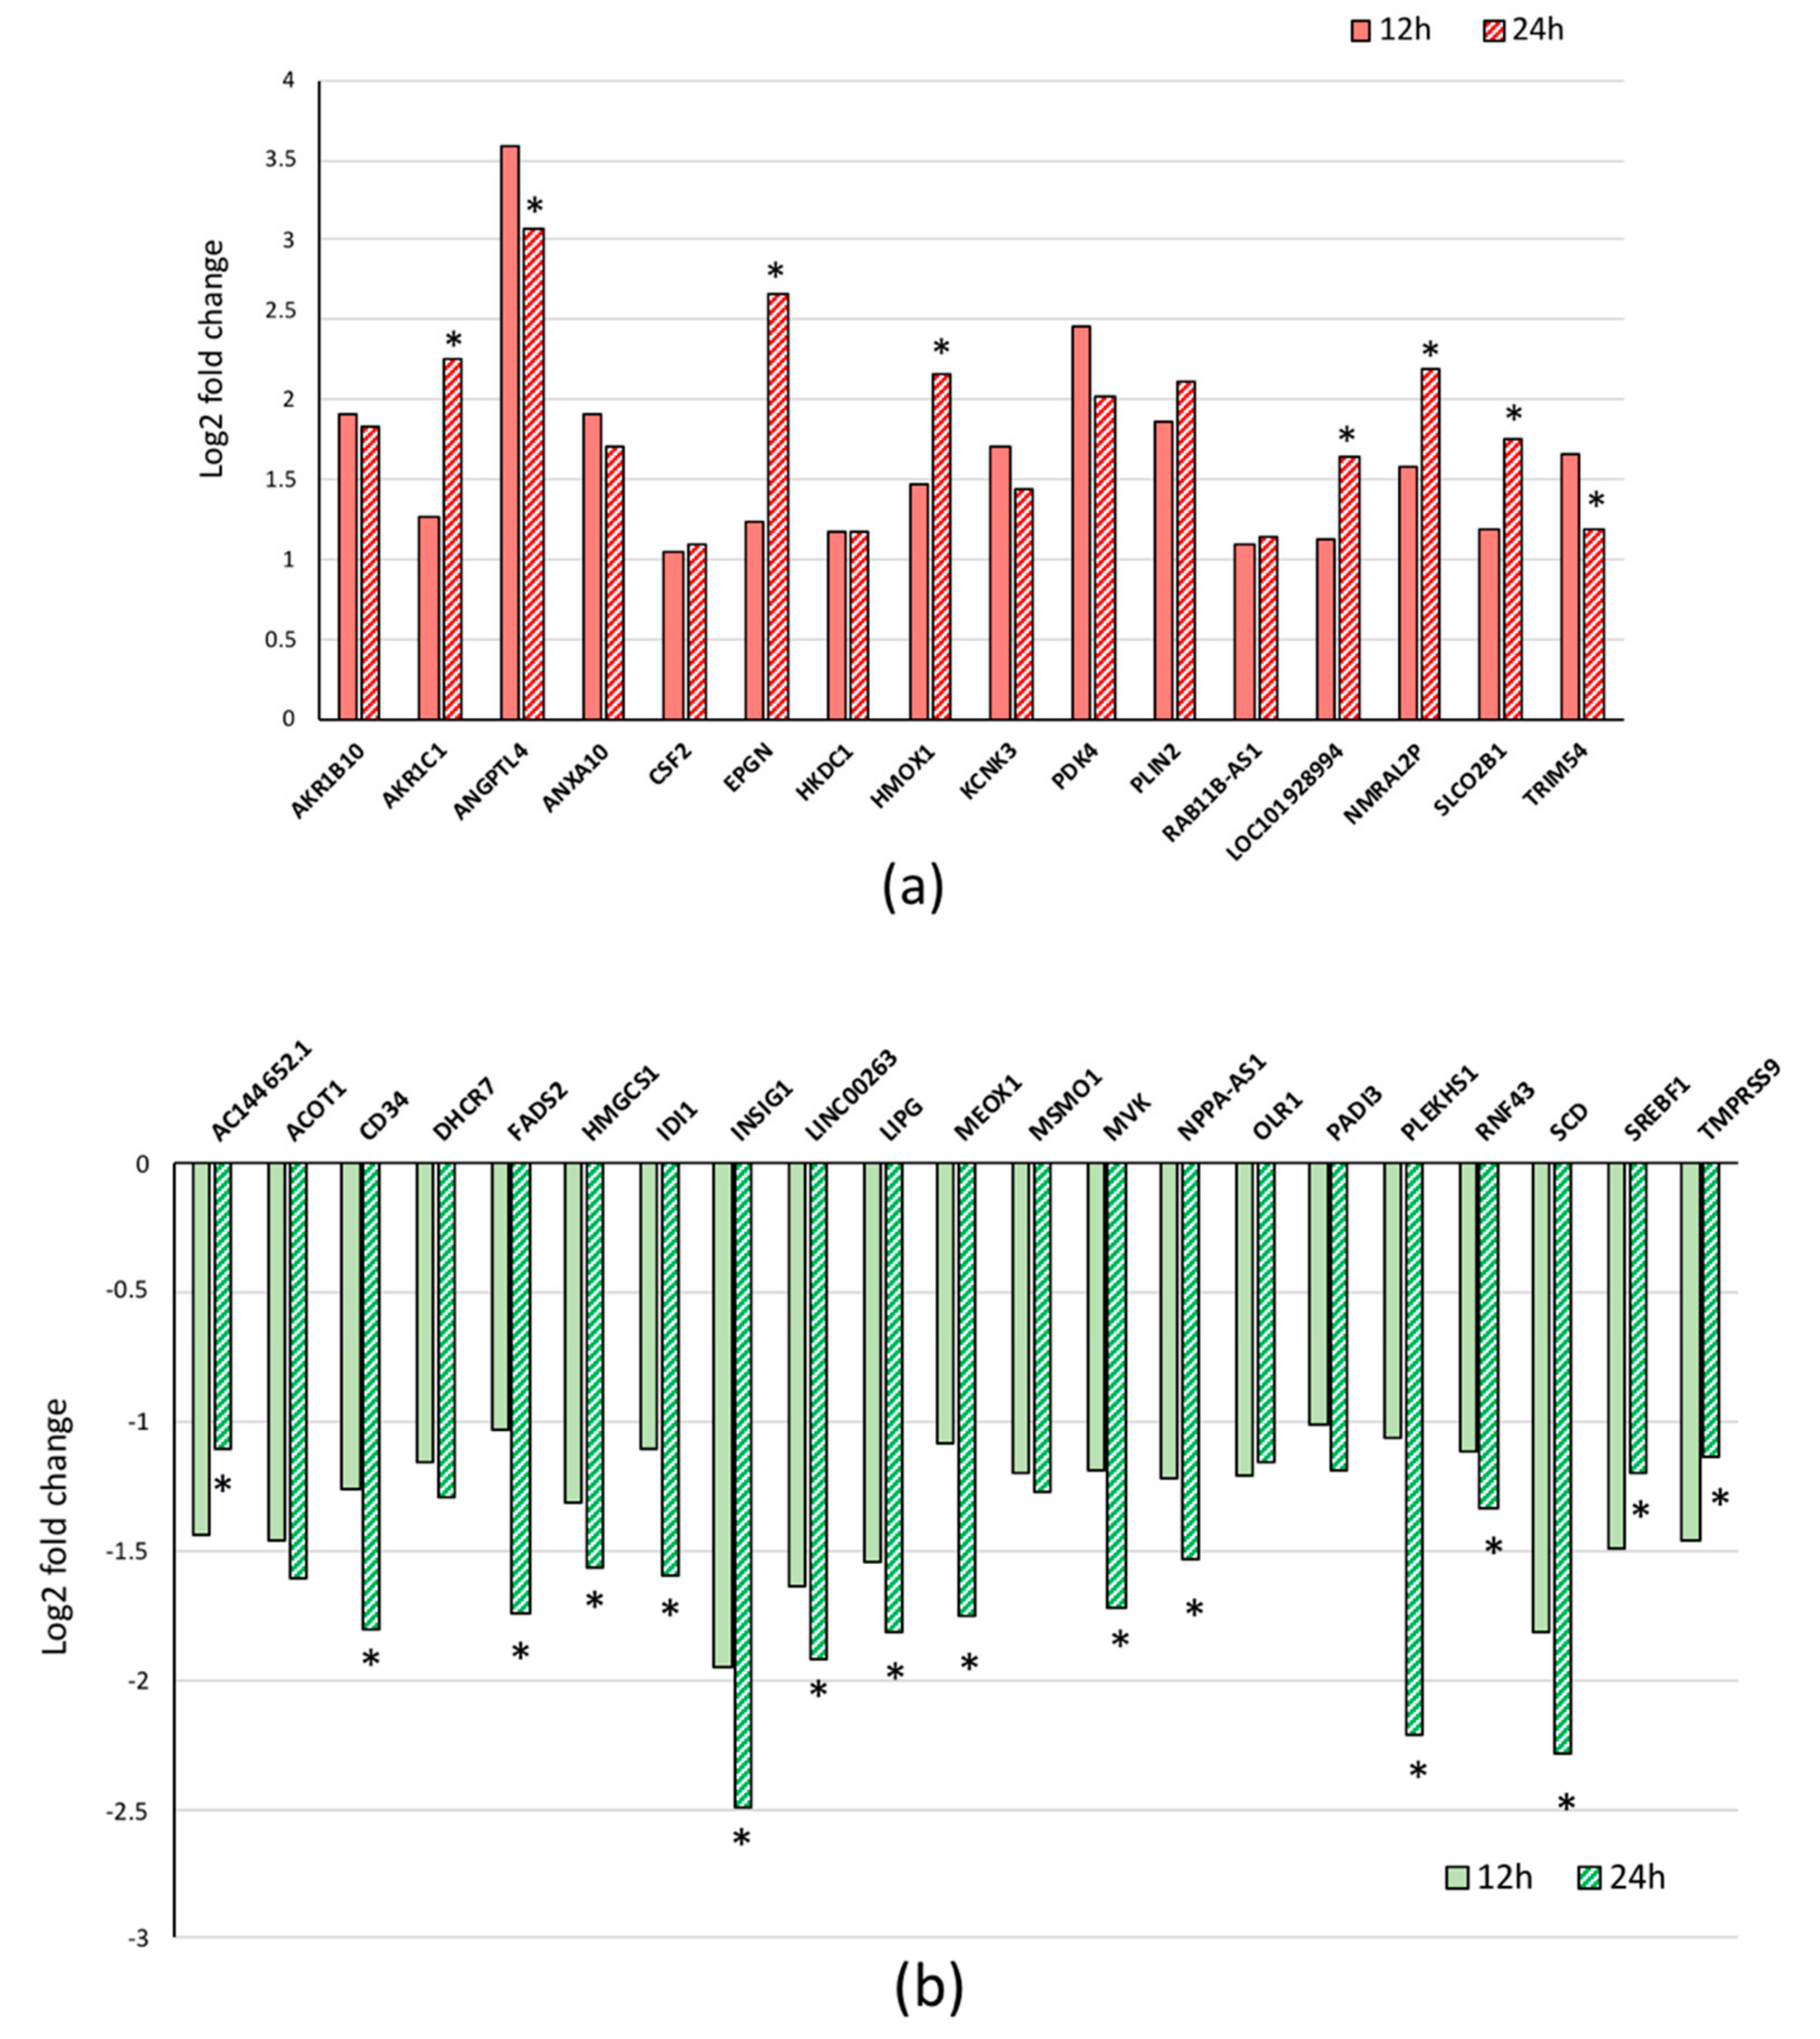
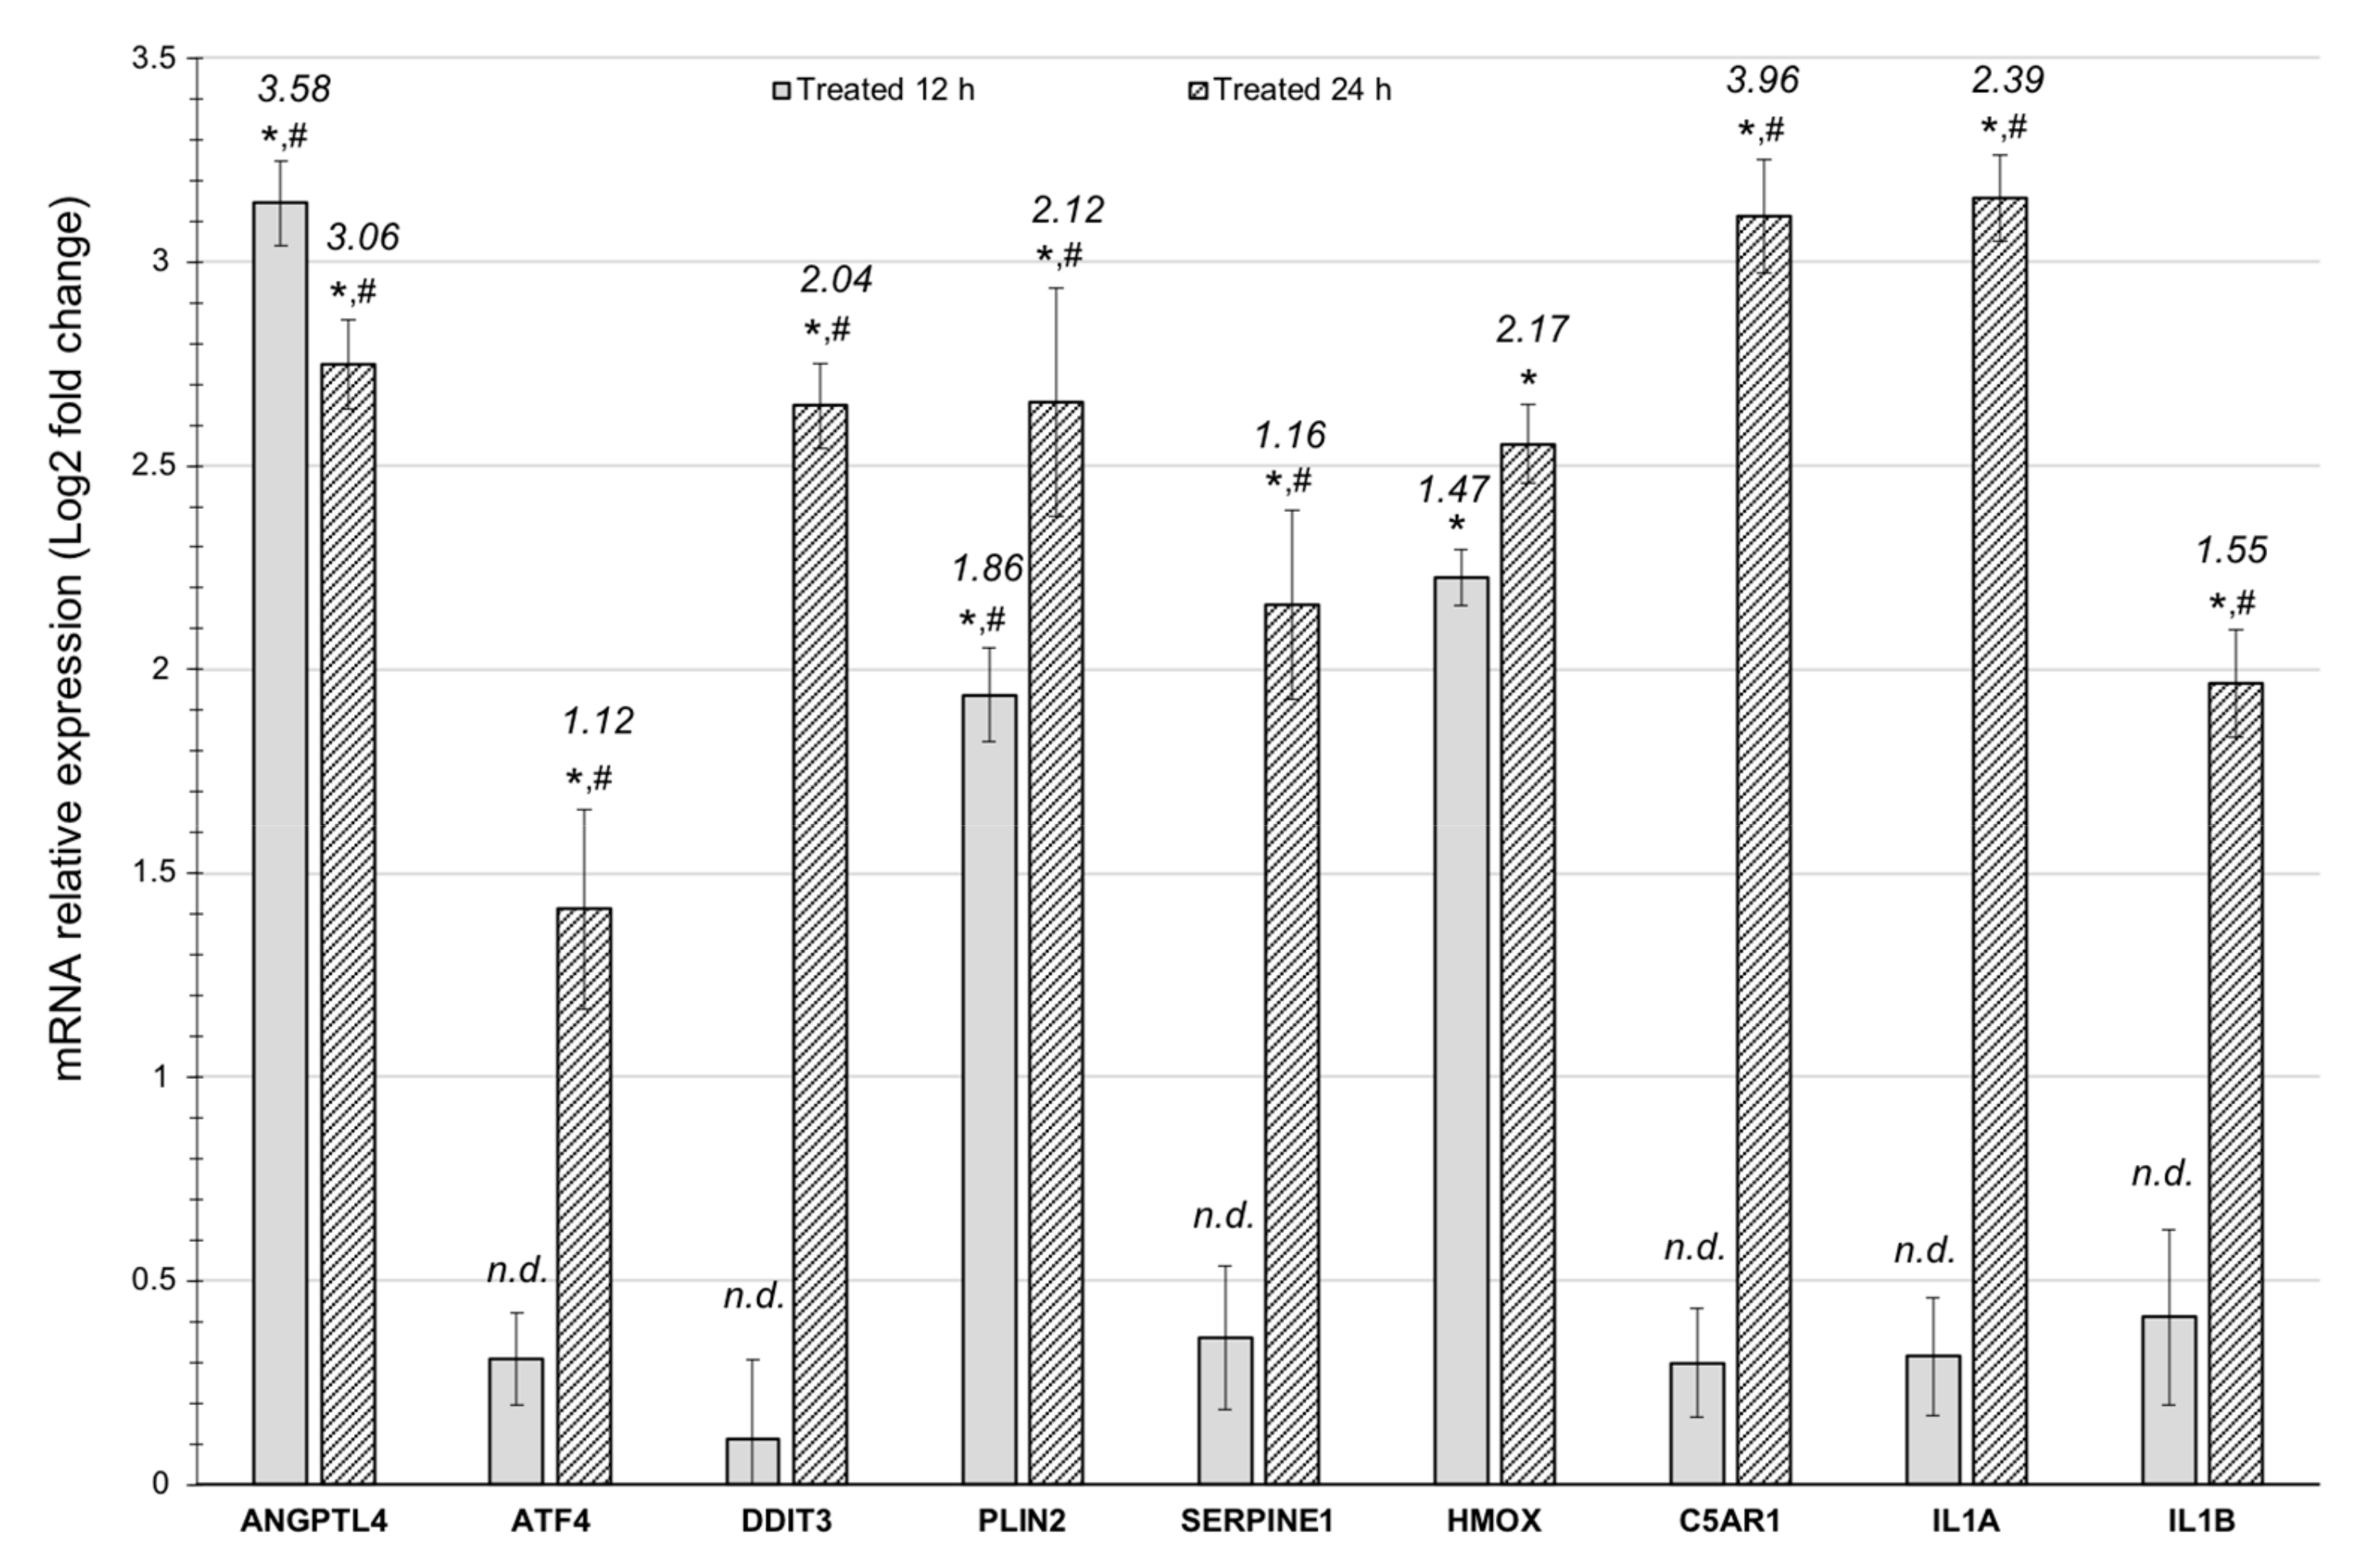
3.2. Quantitative RT-PCR Validation of the Results
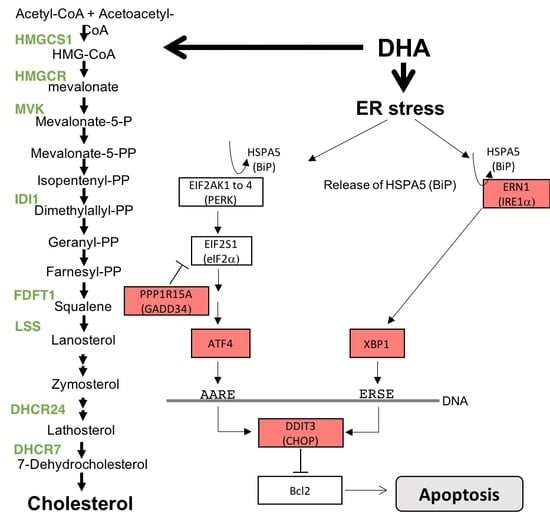
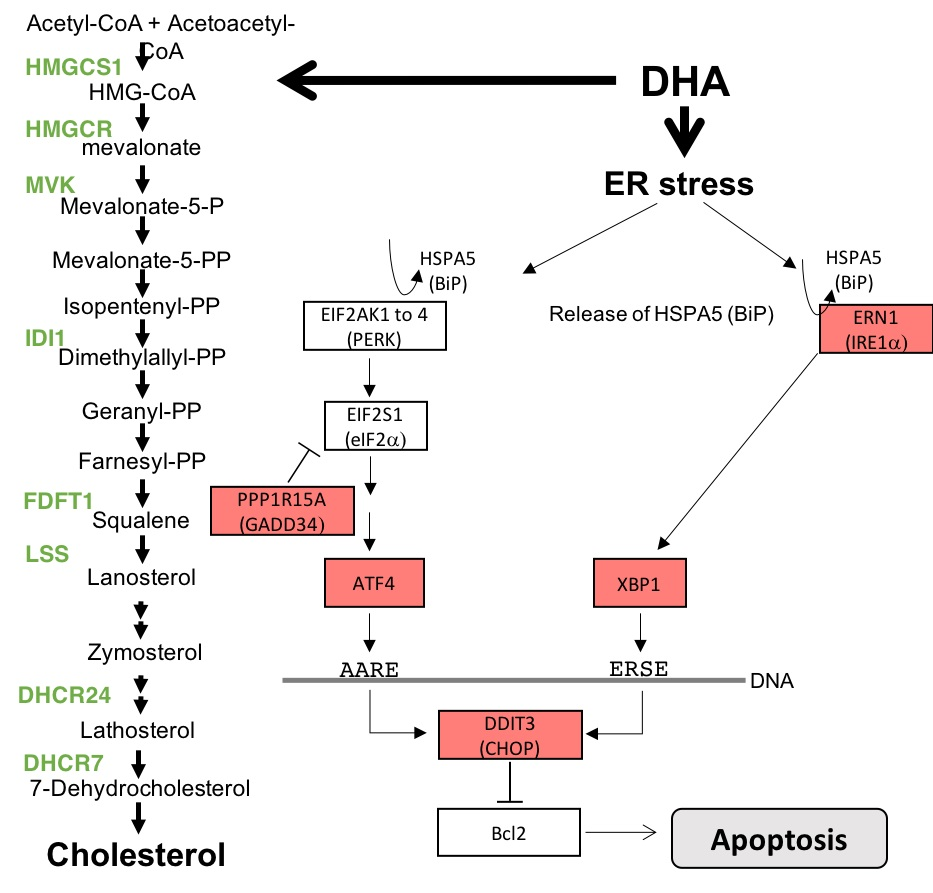
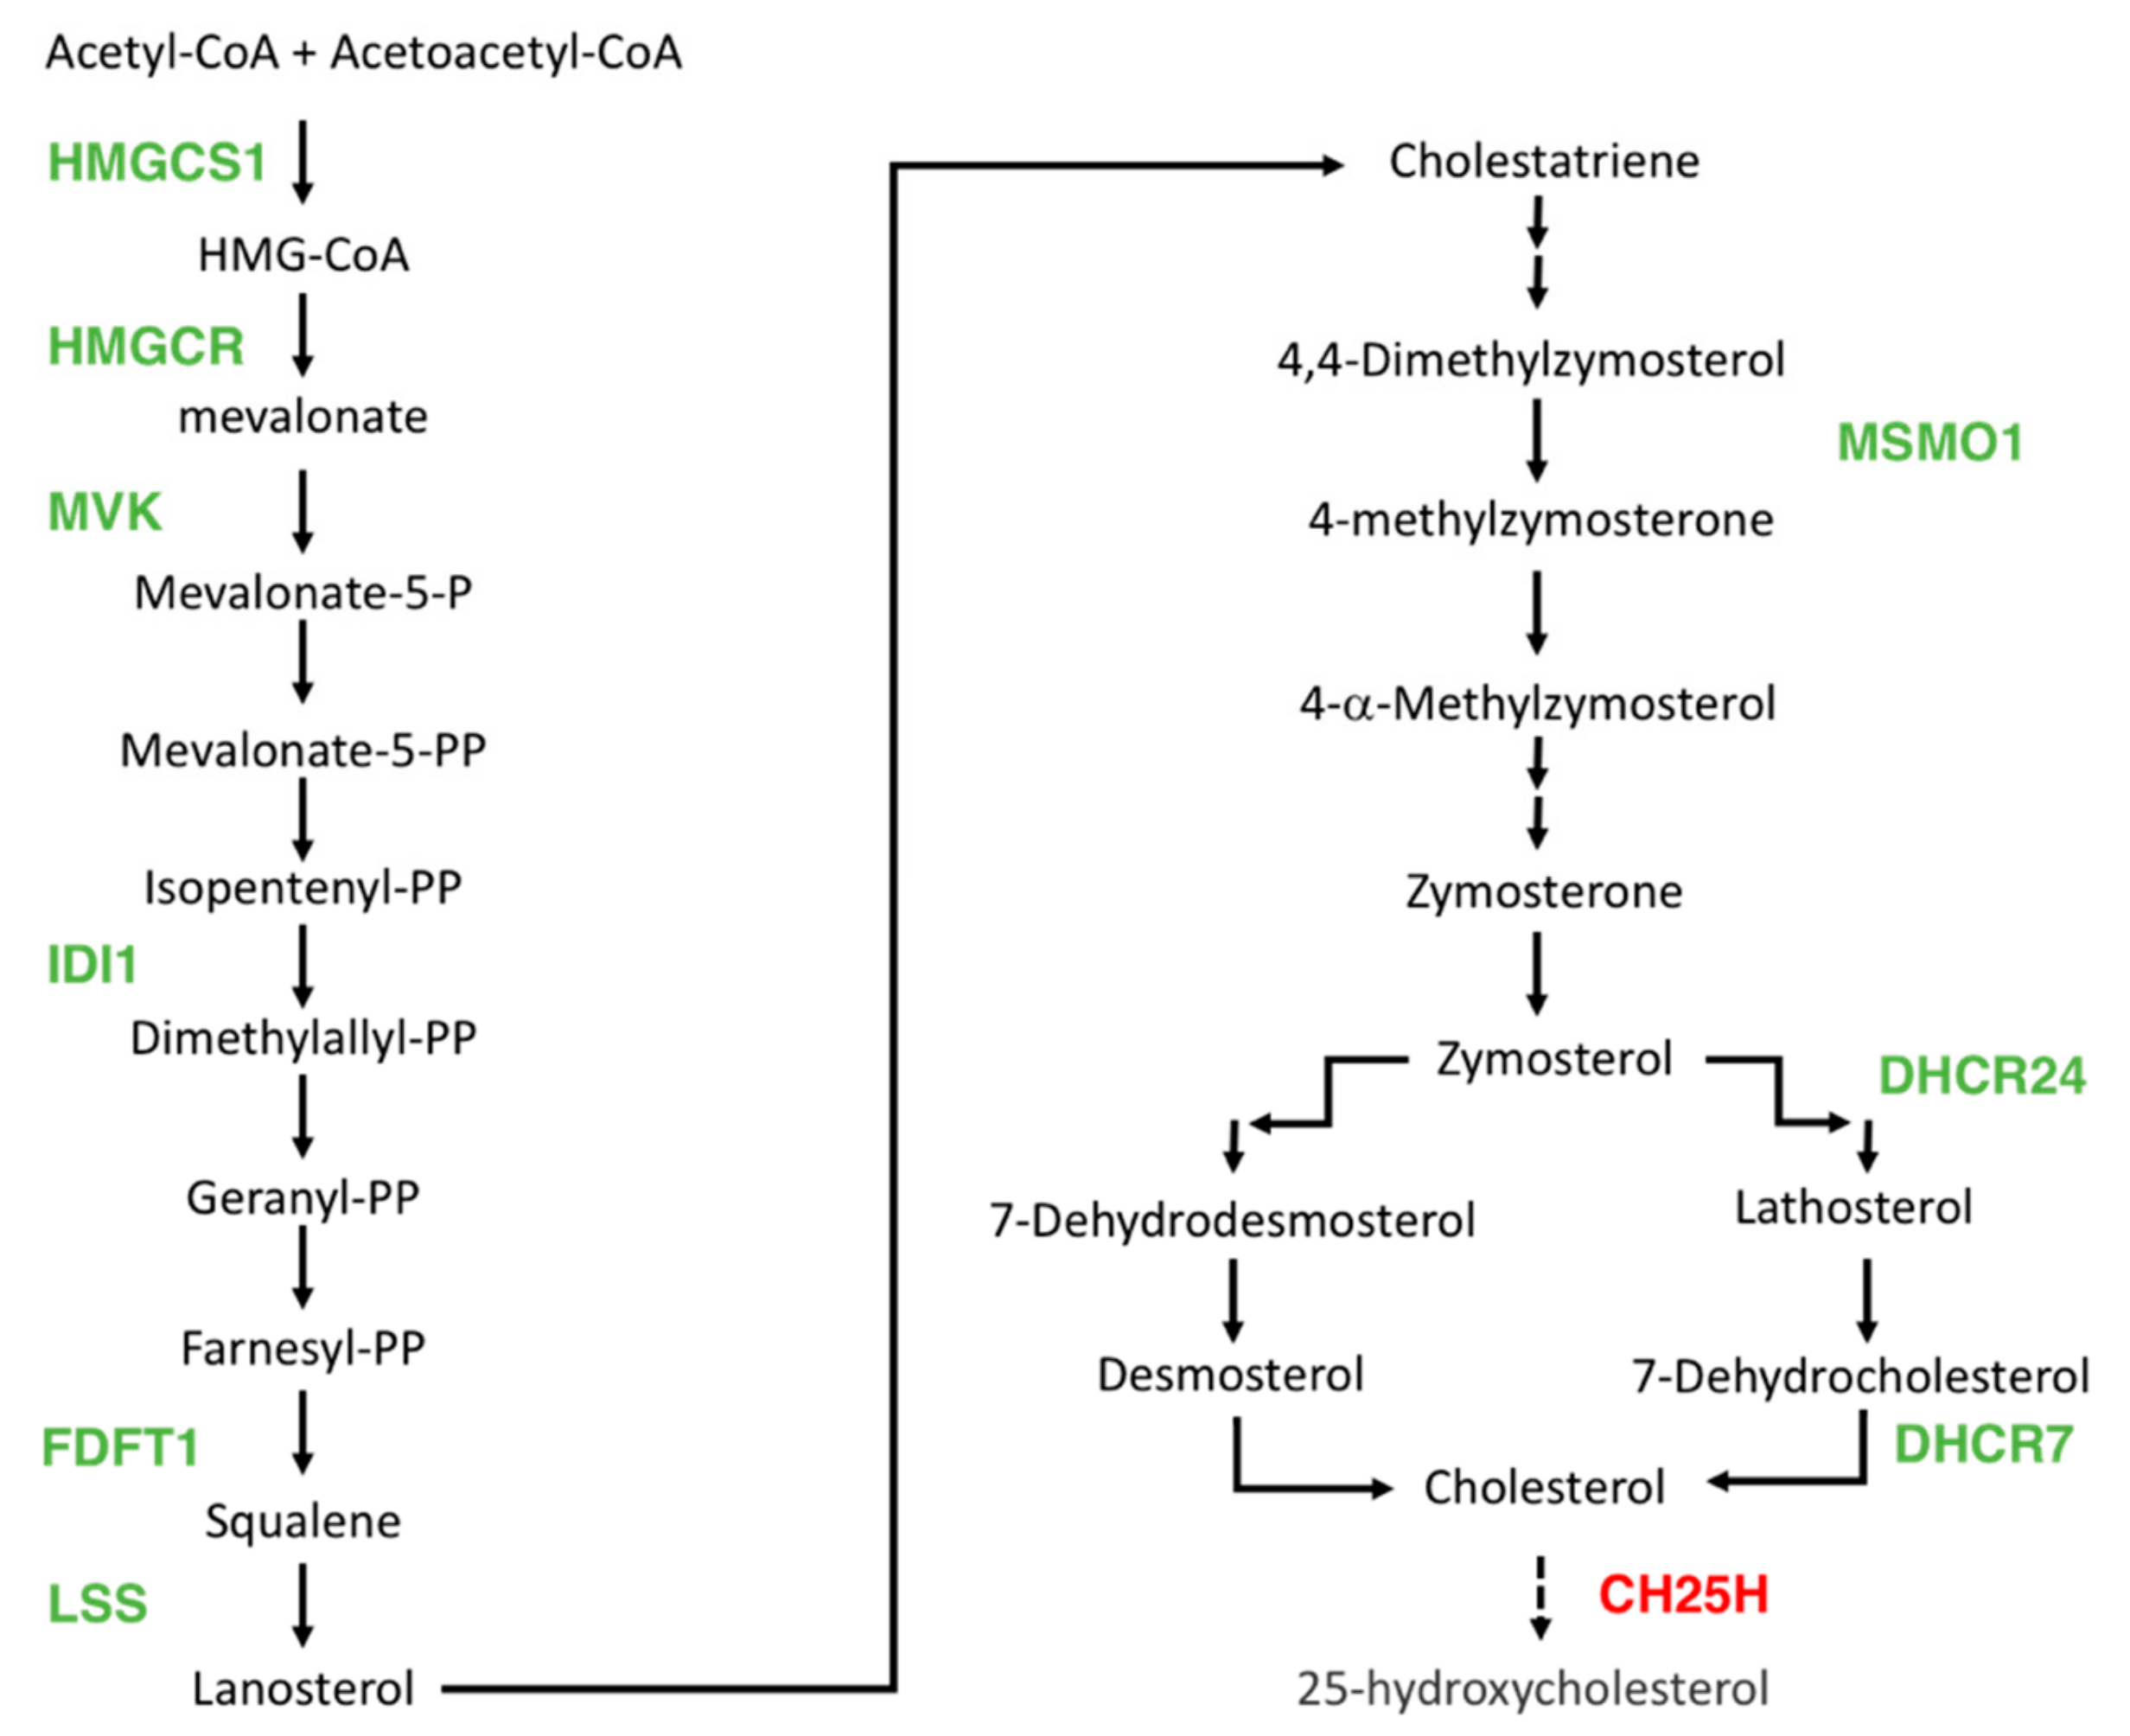
3.3. DHA Impacted the Regulation of Lipids, Fatty Acid, and Sterol Metabolisms
3.4. Antiproliferative Effect and Induction of Apoptosis
3.5. Reduction of Migration and Invasion
4. Conclusions
Supplementary Materials
Author Contributions
Funding
Conflicts of Interest
References
- Bray, F.; Ferlay, J.; Soerjomataram, I.; Siegel, R.L.; Torre, L.A.; Jemal, A. Global cancer statistics 2018: GLOBOCAN estimates of incidence and mortality worldwide for 36 cancers in 185 countries. CA Cancer J. Clin. 2018, 68, 394–424. [Google Scholar] [CrossRef] [PubMed]
- Cardoso, F.; Kyriakides, S.; Ohno, S.; Penault-Llorca, F.; Poortmans, P.; Rubio, I.T.; Zackrisson, S.; Senkus, E. Early breast cancer: ESMO Clinical Practice Guidelines for diagnosis, treatment and follow-up†. Ann. Oncol. 2019, 30, 1194–1220. [Google Scholar] [CrossRef] [PubMed]
- Saini, R.K.; Keum, Y.-S. Omega-3 and omega-6 polyunsaturated fatty acids: Dietary sources, metabolism, and significance—A review. Life Sci. 2018, 203, 255–267. [Google Scholar] [CrossRef] [PubMed]
- Shahidi, F.; Ambigaipalan, P. Omega-3 Polyunsaturated Fatty Acids and Their Health Benefits. Annu. Rev. Food Sci. Technol. 2018, 9, 345–381. [Google Scholar] [CrossRef]
- Chénais, B.; Blanckaert, V. The Janus Face of Lipids in Human Breast Cancer: How Polyunsaturated Fatty Acids Affect Tumor Cell Hallmarks. Int. J. Breast Cancer 2012, 2012, 712536. [Google Scholar] [CrossRef]
- D’Archivio, M.; Scazzocchio, B.; Vari, R.; Santangelo, C.; Giovannini, C.; Masella, R. Recent Evidence on the Role of Dietary PUFAs in Cancer Development and Prevention. Curr. Med. Chem. 2018, 25, 1818–1836. [Google Scholar] [CrossRef]
- Freitas, R.D.S.; Campos, M.M. Protective Effects of Omega-3 Fatty Acids in Cancer-Related Complications. Nutrients 2019, 11, 945. [Google Scholar] [CrossRef]
- Marventano, S.; Kolacz, P.; Castellano, S.; Galvano, F.; Buscemi, S.; Mistretta, A.; Grosso, G. A review of recent evidence in human studies of n-3 and n-6 PUFA intake on cardiovascular disease, cancer, and depressive disorders: Does the ratio really matter? Int. J. Food Sci. Nutr. 2015, 66, 611–622. [Google Scholar] [CrossRef]
- Nabavi, S.F.; Bilotto, S.; Russo, G.L.; Orhan, I.E.; Habtemariam, S.; Daglia, M.; Devi, K.P.; Loizzo, M.R.; Tundis, R.; Nabavi, S.M. Omega-3 polyunsaturated fatty acids and cancer: Lessons learned from clinical trials. Cancer Metastasis Rev. 2015, 34, 359–380. [Google Scholar] [CrossRef]
- Serini, S.; Calviello, G. Long-chain omega-3 fatty acids and cancer: Any cause for concern? Curr. Opin. Clin. Nutr. Metab. Care 2018, 21, 83–89. [Google Scholar] [CrossRef]
- Ulmann, L.; Mimouni, V.; Blanckaert, V.; Pasquet, V.; Schoefs, B.; Chénais, B. The polyunsaturated fatty acids from microalgae as potential sources for health and disease. In Polyunsaturated Fatty Acids; Catala, A., Ed.; Nova Science Publishers: New York, NY, USA, 2014; pp. 23–43. ISBN 978-1-62948-151-7. [Google Scholar]
- Ulmann, L.; Blanckaert, V.; Mimouni, V.; Andersson, M.X.; Schoefs, B.; Chénais, B. Microalgal Fatty Acids and Their Implication in Health and Disease. Mini Rev. Med. Chem. 2017, 17, 1112–1123. [Google Scholar] [CrossRef] [PubMed]
- Vaughan, V.C.; Hassing, M.R.; Lewandowski, P.A. Marine polyunsaturated fatty acids and cancer therapy. Br. J. Cancer 2013, 108, 486–492. [Google Scholar] [CrossRef] [PubMed]
- Volpato, M.; Hull, M.A. Omega-3 polyunsaturated fatty acids as adjuvant therapy of colorectal cancer. Cancer Metastasis Rev. 2018, 37, 545–555. [Google Scholar] [CrossRef] [PubMed]
- Liu, J.; Ma, D. The Role of n-3 Polyunsaturated Fatty Acids in the Prevention and Treatment of Breast Cancer. Nutrients 2014, 6, 5184–5223. [Google Scholar] [CrossRef] [PubMed]
- Shapira, N. The potential contribution of dietary factors to breast cancer prevention. Eur. J. Cancer Prev. 2017, 26, 385–395. [Google Scholar] [CrossRef] [PubMed]
- Zanoaga, O.; Jurj, A.; Raduly, L.; Cojocneanu-Petric, R.; Fuentes-Mattei, E.; Wu, O.; Braicu, C.; Gherman, C.D.; Berindan-Neagoe, I. Implications of dietary ω-3 and ω-6 polyunsaturated fatty acids in breast cancer. Exp. Ther. Med. 2018, 15, 1167–1176. [Google Scholar] [CrossRef]
- Terme, N.; Chénais, B.; Fournière, M.; Bourgougnon, M.; Bedoux, G. Algal derived functional lipids and their role in promoting health. In Recent Advancements in Micro and Macroalgal Processing: Food and Health Perspectives; Wiley: Hoboken, NJ, USA, 2020; in press; ISBN 978-1-119-54258-2. [Google Scholar]
- D’Eliseo, D.; Velotti, F. Omega-3 Fatty Acids and Cancer Cell Cytotoxicity: Implications for Multi-Targeted Cancer Therapy. J. Clin. Med. 2016, 5, 15. [Google Scholar] [CrossRef]
- Jing, K.; Wu, T.; Lim, K. Omega-3 polyunsaturated fatty acids and cancer. Anticancer Agents Med. Chem. 2013, 13, 1162–1177. [Google Scholar] [CrossRef]
- Moloudizargari, M.; Mortaz, E.; Asghari, M.H.; Adcock, I.M.; Redegeld, F.A.; Garssen, J. Effects of the polyunsaturated fatty acids, EPA and DHA, on hematological malignancies: A systematic review. Oncotarget 2018, 9, 11858–11875. [Google Scholar] [CrossRef]
- Song, E.; Kim, H. Docosahexaenoic Acid Induces Oxidative DNA Damage and Apoptosis, and Enhances the Chemosensitivity of Cancer Cells. Int. J. Mol. Sci. 2016, 17, 1257. [Google Scholar] [CrossRef]
- VanderSluis, L.; Mazurak, V.; Damaraju, S.; Field, C. Determination of the Relative Efficacy of Eicosapentaenoic Acid and Docosahexaenoic Acid for Anti-Cancer Effects in Human Breast Cancer Models. Int. J. Mol. Sci. 2017, 18, 2607. [Google Scholar] [CrossRef] [PubMed]
- Kim, S.; Jing, K.; Shin, S.; Jeong, S.; Han, S.-H.; Oh, H.; Yoo, Y.-S.; Han, J.; Jeon, Y.-J.; Heo, J.-Y.; et al. ω3-polyunsaturated fatty acids induce cell death through apoptosis and autophagy in glioblastoma cells: In vitro and in vivo. Oncol. Rep. 2018, 39, 239–246. [Google Scholar] [CrossRef] [PubMed]
- Jing, K.; Song, K.-S.; Shin, S.; Kim, N.; Jeong, S.; Oh, H.-R.; Park, J.-H.; Seo, K.-S.; Heo, J.-Y.; Han, J.; et al. Docosahexaenoic acid induces autophagy through p53/AMPK/mTOR signaling and promotes apoptosis in human cancer cells harboring wild-type p53. Autophagy 2011, 7, 1348–1358. [Google Scholar] [CrossRef] [PubMed]
- Shin, S.; Jing, K.; Jeong, S.; Kim, N.; Song, K.-S.; Heo, J.-Y.; Park, J.-H.; Seo, K.-S.; Han, J.; Park, J.-I.; et al. The Omega-3 Polyunsaturated Fatty Acid DHA Induces Simultaneous Apoptosis and Autophagy via Mitochondrial ROS-Mediated Akt-mTOR Signaling in Prostate Cancer Cells Expressing Mutant p53. Available online: https://www.hindawi.com/journals/bmri/2013/568671/ (accessed on 9 May 2020).
- Kim, N.; Jeong, S.; Jing, K.; Shin, S.; Kim, S.; Heo, J.-Y.; Kweon, G.-R.; Park, S.-K.; Wu, T.; Park, J.-I.; et al. Docosahexaenoic Acid Induces Cell Death in Human Non-Small Cell Lung Cancer Cells by Repressing mTOR via AMPK Activation and PI3K/Akt Inhibition. Biomed. Res. Int. 2015, 2015, 239764. [Google Scholar] [CrossRef]
- Mason, J.K.; Klaire, S.; Kharotia, S.; Wiggins, A.K.A.; Thompson, L.U. α-linolenic acid and docosahexaenoic acid, alone and combined with trastuzumab, reduce HER2-overexpressing breast cancer cell growth but differentially regulate HER2 signaling pathways. Lipids Health Disease 2015, 14, 91. [Google Scholar] [CrossRef] [PubMed]
- Sun, H.; Hu, Y.; Gu, Z.; Owens, R.T.; Chen, Y.Q.; Edwards, I.J. Omega-3 fatty acids induce apoptosis in human breast cancer cells and mouse mammary tissue through syndecan-1 inhibition of the MEK-Erk pathway. Carcinogenesis 2011, 32, 1518–1524. [Google Scholar] [CrossRef]
- Xue, M.; Ge, Y.; Yu, C.; Zheng, Z.; He, X.; Zhao, J. Apoptosis is induced by docosahexaenoic acid in breast cancer cells via death receptor and mitochondria-mediated pathways. Mol. Med. Rep. 2017, 16, 978–982. [Google Scholar] [CrossRef]
- Geng, L.; Zhou, W.; Liu, B.; Wang, X.; Chen, B. DHA induces apoptosis of human malignant breast cancer tissues by the TLR-4/PPAR-α pathways. Oncol. Lett. 2018, 15, 2967–2977. [Google Scholar] [CrossRef]
- Yousefnia, S.; Momenzadeh, S.; Seyed Forootan, F.; Ghaedi, K.; Nasr Esfahani, M.H. The influence of peroxisome proliferator-activated receptor γ (PPARγ) ligands on cancer cell tumorigenicity. Gene 2018, 649, 14–22. [Google Scholar] [CrossRef]
- Tsai, C.H.; Shen, Y.C.; Chen, H.W.; Liu, K.L.; Chang, J.W.; Chen, P.Y.; Lin, C.Y.; Yao, H.T.; Li, C.C. Docosahexaenoic acid increases the expression of oxidative stress-induced growth inhibitor 1 through the PI3K/Akt/Nrf2 signaling pathway in breast cancer cells. Food Chem. Toxicol. 2017, 108, 276–288. [Google Scholar] [CrossRef]
- Barascu, A.; Besson, P.; Le Floch, O.; Bougnoux, P.; Jourdan, M.L. CDK1-cyclin B1 mediates the inhibition of proliferation induced by omega-3 fatty acids in MDA-MB-231 breast cancer cells. Int. J. Biochem. Cell Biol. 2006, 38, 196–208. [Google Scholar] [CrossRef] [PubMed]
- Bougnoux, P.; Hajjaji, N.; Ferrasson, M.N.; Giraudeau, B.; Couet, C.; Le Floch, O. Improving outcome of chemotherapy of metastatic breast cancer by docosahexaenoic acid: A phase II trial. Br. J. Cancer 2009, 101, 1978–1985. [Google Scholar] [CrossRef] [PubMed]
- Bougnoux, P.; Hajjaji, N.; Maheo, K.; Couet, C.; Chevalier, S. Fatty acids and breast cancer: Sensitization to treatments and prevention of metastatic re-growth. Prog. Lipid Res. 2010, 49, 76–86. [Google Scholar] [CrossRef] [PubMed]
- Blanckaert, V.; Ulmann, L.; Mimouni, V.; Antol, J.; Brancquart, L.; Chénais, B. Docosahexaenoic acid intake decreases proliferation, increases apoptosis and decreases the invasive potential of the human breast carcinoma cell line MDA-MB-231. Int. J. Oncol. 2010, 36, 737–742. [Google Scholar] [CrossRef]
- Blanckaert, V.; Kerviel, V.; Lépinay, A.; Joubert-Durigneux, V.; Hondermarck, H.; Chénais, B. Docosahexaenoic acid inhibits the invasion of MDA-MB-231 breast cancer cells through upregulation of cytokeratin-1. Int. J. Oncol. 2015, 46, 2649–2655. [Google Scholar] [CrossRef] [PubMed]
- Brown, I.; Lee, J.; Sneddon, A.A.; Cascio, M.G.; Pertwee, R.G.; Wahle, K.W.J.; Rotondo, D.; Heys, S.D. Anticancer effects of n-3 EPA and DHA and their endocannabinoid derivatives on breast cancer cell growth and invasion. Prostaglandins Leukot. Essent. Fatty Acids 2019, 102024. [Google Scholar] [CrossRef]
- Javadian, M.; Shekari, N.; Soltani-Zangbar, M.S.; Mohammadi, A.; Mansoori, B.; Maralbashi, S.; Shanehbandi, D.; Baradaran, B.; Darabi, M.; Kazemi, T. Docosahexaenoic acid suppresses migration of triple-negative breast cancer cell through targeting metastasis-related genes and microRNA under normoxic and hypoxic conditions. J. Cell. Biochem. 2020, 121, 2416–2427. [Google Scholar] [CrossRef]
- Lii, C.-K.; Chang, J.-W.; Chen, J.-J.; Chen, H.-W.; Liu, K.-L.; Yeh, S.-L.; Wang, T.-S.; Liu, S.-H.; Tsai, C.-H.; Li, C.-C. Docosahexaenoic acid inhibits 12-O-tetradecanoylphorbol-13- acetate-induced fascin-1-dependent breast cancer cell migration by suppressing the PKCδ- and Wnt-1/β-catenin-mediated pathways. Oncotarget 2016, 7, 25162–25179. [Google Scholar] [CrossRef]
- Yun, E.-J.; Song, K.-S.; Shin, S.; Kim, S.; Heo, J.-Y.; Kweon, G.-R.; Wu, T.; Park, J.-I.; Lim, K. Docosahexaenoic acid suppresses breast cancer cell metastasis by targeting matrix-metalloproteinases. Oncotarget 2016, 7, 49961–49971. [Google Scholar] [CrossRef]
- Zheng, W.; Li, J.; Wang, X.; Yuan, Y.; Zhang, J.; Xiu, Z. Effects of Antarctic krill docosahexaenoic acid on MCF-7 cell migration and invasion induced by the interaction of CD95 with caveolin-1. Life Sci. 2018, 192, 270–277. [Google Scholar] [CrossRef]
- Kang, J.X. Fat-1 transgenic mice: A new model for omega-3 research. Prostaglandins Leukot. Essent. Fatty Acids 2007, 77, 263–267. [Google Scholar] [CrossRef] [PubMed]
- Corsetto, P.; Colombo, I.; Kopecka, J.; Rizzo, A.; Riganti, C. ω-3 Long Chain Polyunsaturated Fatty Acids as Sensitizing Agents and Multidrug Resistance Revertants in Cancer Therapy. Int. J. Mol. Sci. 2017, 18, 2770. [Google Scholar] [CrossRef] [PubMed]
- Siddiqui, R.A.; Harvey, K.A.; Xu, Z.; Bammerlin, E.M.; Walker, C.; Altenburg, J.D. Docosahexaenoic acid: A natural powerful adjuvant that improves efficacy for anticancer treatment with no adverse effects. BioFactors 2011, 37, 399–412. [Google Scholar] [CrossRef] [PubMed]
- Manni, A.; El-Bayoumy, K.; Thompson, H. Docosahexaenoic Acid in Combination with Dietary Energy Restriction for Reducing the Risk of Obesity Related Breast Cancer. Int. J. Mol. Sci. 2017, 19, 28. [Google Scholar] [CrossRef] [PubMed]
- Serini, S.; Ottes Vasconcelos, R.; Nascimento Gomes, R.; Calviello, G. Protective Effects of ω-3 PUFA in Anthracycline-Induced Cardiotoxicity: A Critical Review. Int. J. Mol. Sci. 2017, 18, 2689. [Google Scholar] [CrossRef]
- Xue, H.; Ren, W.; Denkinger, M.; Schlotzer, E.; Wischmeyer, P.E. Nutrition Modulation of Cardiotoxicity and Anticancer Efficacy Related to Doxorubicin Chemotherapy by Glutamine and ω-3 Polyunsaturated Fatty Acids. J. Parenter. Enter. Nutr. 2016, 40, 52–66. [Google Scholar] [CrossRef]
- Rabé, M.; Dumont, S.; Álvarez-Arenas, A.; Janati, H.; Belmonte-Beitia, J.; Calvo, G.F.; Thibault-Carpentier, C.; Séry, Q.; Chauvin, C.; Joalland, N.; et al. Identification of a transient state during the acquisition of temozolomide resistance in glioblastoma. Cell Death Dis 2020, 11, 19. [Google Scholar] [CrossRef]
- Livak, K.J.; Schmittgen, T.D. Analysis of relative gene expression data using real-time quantitative PCR and the 2(-Delta Delta C(T)) Method. Methods 2001, 25, 402–408. [Google Scholar] [CrossRef]
- Ravacci, G.R.; Brentani, M.M.; Tortelli, T.C.; Torrinhas, R.S.M.M.; Santos, J.R.; Logullo, A.F.; Waitzberg, D.L. Docosahexaenoic Acid Modulates a HER2-Associated Lipogenic Phenotype, Induces Apoptosis, and Increases Trastuzumab Action in HER2-Overexpressing Breast Carcinoma Cells. Biomed Res. Int. 2015, 2015, 838652. [Google Scholar] [CrossRef] [PubMed]
- Gelsomino, G.; Corsetto, P.A.; Campia, I.; Montorfano, G.; Kopecka, J.; Castella, B.; Gazzano, E.; Ghigo, D.; Rizzo, A.M.; Riganti, C. Omega 3 fatty acids chemosensitize multidrug resistant colon cancer cells by down-regulating cholesterol synthesis and altering detergent resistant membranes composition. Mol. Cancer 2013, 12, 137. [Google Scholar] [CrossRef]
- Jakobsen, C.H.; Størvold, G.L.; Bremseth, H.; Follestad, T.; Sand, K.; Mack, M.; Olsen, K.S.; Lundemo, A.G.; Iversen, J.G.; Krokan, H.E.; et al. DHA induces ER stress and growth arrest in human colon cancer cells: Associations with cholesterol and calcium homeostasis. J. Lipid Res. 2008, 49, 2089–2100. [Google Scholar] [CrossRef] [PubMed]
- Li, J.; Takaishi, K.; Cook, W.; McCorkle, S.K.; Unger, R.H. Insig-1 “brakes” lipogenesis in adipocytes and inhibits differentiation of preadipocytes. Proc. Natl. Acad. Sci. USA 2003, 100, 9476–9481. [Google Scholar] [CrossRef] [PubMed]
- Han, Y.; Hu, Z.; Cui, A.; Liu, Z.; Ma, F.; Xue, Y.; Liu, Y.; Zhang, F.; Zhao, Z.; Yu, Y.; et al. Post-translational regulation of lipogenesis via AMPK-dependent phosphorylation of insulin-induced gene. Nat. Commun. 2019, 10, 623. [Google Scholar] [CrossRef] [PubMed]
- Sugden, M.C.; Holness, M.J. Recent advances in mechanisms regulating glucose oxidation at the level of the pyruvate dehydrogenase complex by PDKs. Am. J. Physiol. Endocrinol. Metab. 2003, 284, E855–E862. [Google Scholar] [CrossRef]
- Casey, W.M.; Brodie, T.; Yoon, L.; Ni, H.; Jordan, H.L.; Cariello, N.F. Correlation analysis of gene expression and clinical chemistry to identify biomarkers of skeletal myopathy in mice treated with PPAR agonist GW610742X. Biomarkers 2008, 13, 364–376. [Google Scholar] [CrossRef]
- Imanishi, T.; Hano, T.; Sawamura, T.; Takarada, S.; Nishio, I. Oxidized low density lipoprotein potentiation of Fas-induced apoptosis through lectin-like oxidized-low density lipoprotein receptor-1 in human umbilical vascular endothelial cells. Circ. J. 2002, 66, 1060–1064. [Google Scholar] [CrossRef]
- Kuniyoshi, S.; Miki, Y.; Sasaki, A.; Iwabuchi, E.; Ono, K.; Onodera, Y.; Hirakawa, H.; Ishida, T.; Yoshimi, N.; Sasano, H. The significance of lipid accumulation in breast carcinoma cells through perilipin 2 and its clinicopathological significance. Pathol. Int. 2019, 69, 463–471. [Google Scholar] [CrossRef]
- Sztalryd, C.; Brasaemle, D.L. The perilipin family of lipid droplet proteins: Gatekeepers of intracellular lipolysis. Biochim. Biophys. Acta Mol. Cell Biol. Lipids 2017, 1862, 1221–1232. [Google Scholar] [CrossRef]
- Giudetti, A.M.; De Domenico, S.; Ragusa, A.; Lunetti, P.; Gaballo, A.; Franck, J.; Simeone, P.; Nicolardi, G.; De Nuccio, F.; Santino, A.; et al. A specific lipid metabolic profile is associated with the epithelial mesenchymal transition program. Biochim. Biophys. Acta Mol. Cell Biol. Lipids 2019, 1864, 344–357. [Google Scholar] [CrossRef]
- Chowdhury, U.R.; Samant, R.S.; Fodstad, O.; Shevde, L.A. Emerging role of nuclear protein 1 (NUPR1) in cancer biology. Cancer Metastasis Rev. 2009, 28, 225–232. [Google Scholar] [CrossRef]
- Clark, D.W.; Mitra, A.; Fillmore, R.A.; Jiang, W.G.; Samant, R.S.; Fodstad, O.; Shevde, L.A. NUPR1 interacts with p53, transcriptionally regulates p21 and rescues breast epithelial cells from doxorubicin-induced genotoxic stress. Curr. Cancer Drug Targets 2008, 8, 421–430. [Google Scholar] [CrossRef] [PubMed]
- Katoh, M.; Nakagama, H. FGF Receptors: Cancer Biology and Therapeutics. Med. Res. Rev. 2014, 34, 280–300. [Google Scholar] [CrossRef] [PubMed]
- L’Hôte, C.G.M.; Knowles, M.A. Cell responses to FGFR3 signalling: Growth, differentiation and apoptosis. Exp. Cell Res. 2005, 304, 417–431. [Google Scholar] [CrossRef] [PubMed]
- Colicino, E.G.; Hehnly, H. Regulating a key mitotic regulator, polo-like kinase 1 (PLK1). Cytoskeleton 2018, 75, 481–494. [Google Scholar] [CrossRef]
- Kumar, S.; Sharma, A.R.; Sharma, G.; Chakraborty, C.; Kim, J. PLK-1: Angel or devil for cell cycle progression. Biochim. Biophys. Acta Rev. Cancer 2016, 1865, 190–203. [Google Scholar] [CrossRef]
- Schultz, D.J.; Krishna, A.; Vittitow, S.L.; Alizadeh-Rad, N.; Muluhngwi, P.; Rouchka, E.C.; Klinge, C.M. Transcriptomic response of breast cancer cells to anacardic acid. Sci. Rep. 2018, 8, 8063. [Google Scholar] [CrossRef]
- Chen, X.; Huang, L.; Yang, Y.; Chen, S.; Sun, J.; Ma, C.; Xie, J.; Song, Y.; Yang, J. ASPM promotes glioblastoma growth by regulating G1 restriction point progression and Wnt-β-catenin signaling. Aging 2020, 12, 224–241. [Google Scholar] [CrossRef]
- Jia, X.; Niu, P.; Xie, C.; Liu, H. Long noncoding RNA PXN-AS1-L promotes the malignancy of nasopharyngeal carcinoma cells via upregulation of SAPCD2. Cancer Med. 2019, 8, 4278–4291. [Google Scholar] [CrossRef]
- Pai, V.C.; Hsu, C.-C.; Chan, T.-S.; Liao, W.-Y.; Chuu, C.-P.; Chen, W.-Y.; Li, C.-R.; Lin, C.-Y.; Huang, S.-P.; Chen, L.-T.; et al. ASPM promotes prostate cancer stemness and progression by augmenting Wnt-Dvl-3-β-catenin signaling. Oncogene 2019, 38, 1340–1353. [Google Scholar] [CrossRef]
- Sun, W.; Dong, W.-W.; Mao, L.-L.; Li, W.-M.; Cui, J.-T.; Xing, R.; Lu, Y.-Y. Overexpression of p42.3 promotes cell growth and tumorigenicity in hepatocellular carcinoma. World J. Gastroenterol. 2013, 19, 2913–2920. [Google Scholar] [CrossRef]
- Yuan, X.-S.; Zhang, Y.; Guan, X.-Y.; Dong, B.; Zhao, M.; Mao, L.-L.; Lu, Y.-Y.; Tian, X.-Y.; Hao, C.-Y. p42.3: A promising biomarker for the progression and prognosis of human colorectal cancer. J. Cancer Res. Clin. Oncol. 2013, 139, 1211–1220. [Google Scholar] [CrossRef] [PubMed]
- Ord, T.; Ord, T. Mammalian Pseudokinase TRIB3 in Normal Physiology and Disease: Charting the Progress in Old and New Avenues. Curr. Protein Pept. Sci. 2017, 18, 819–842. [Google Scholar] [CrossRef] [PubMed]
- Rozpedek, W.; Pytel, D.; Mucha, B.; Leszczynska, H.; Diehl, J.A.; Majsterek, I. The Role of the PERK/eIF2α/ATF4/CHOP Signaling Pathway in Tumor Progression During Endoplasmic Reticulum Stress. Curr. Mol. Med. 2016, 16, 533–544. [Google Scholar] [CrossRef] [PubMed]
- Dombroski, B.A.; Nayak, R.R.; Ewens, K.G.; Ankener, W.; Cheung, V.G.; Spielman, R.S. Gene Expression and Genetic Variation in Response to Endoplasmic Reticulum Stress in Human Cells. Am. J. Hum. Genet. 2010, 86, 719–729. [Google Scholar] [CrossRef]
- Jeong, S.; Kim, D.Y.; Kang, S.H.; Yun, H.K.; Kim, J.L.; Kim, B.R.; Park, S.H.; Na, Y.J.; Jo, M.J.; Jeong, Y.A.; et al. Docosahexaenoic Acid Enhances Oxaliplatin-Induced Autophagic Cell Death via the ER Stress/Sesn2 Pathway in Colorectal Cancer. Cancers 2019, 11. [Google Scholar] [CrossRef]
- Samdal, H.; Sandmoe, M.A.; Olsen, L.C.; Jarallah, E.A.H.; Høiem, T.S.; Schønberg, S.A.; Pettersen, C.H.H. Basal level of autophagy and MAP1LC3B-II as potential biomarkers for DHA-induced cytotoxicity in colorectal cancer cells. FEBS J. 2018, 285, 2446–2467. [Google Scholar] [CrossRef]
- Shin, J.-I.; Jeon, Y.-J.; Lee, S.; Lee, Y.G.; Kim, J.B.; Lee, K. G-Protein-Coupled Receptor 120 Mediates DHA-Induced Apoptosis by Regulating IP3R, ROS and, ER Stress Levels in Cisplatin-Resistant Cancer Cells. Mol. Cells 2019, 42, 252–261. [Google Scholar] [CrossRef]
- Okada, L.S.D.R.R.; Oliveira, C.P.; Stefano, J.T.; Nogueira, M.A.; Silva, I.D.C.G.d.; Cordeiro, F.B.; Alves, V.A.F.; Torrinhas, R.S.; Carrilho, F.J.; Puri, P.; et al. Omega-3 PUFA modulate lipogenesis, ER stress, and mitochondrial dysfunction markers in NASH—Proteomic and lipidomic insight. Clin. Nutr. 2018, 37, 1474–1484. [Google Scholar] [CrossRef]
- Mungrue, I.N.; Pagnon, J.; Kohannim, O.; Gargalovic, P.S.; Lusis, A.J. CHAC1/MGC4504 Is a Novel Proapoptotic Component of the Unfolded Protein Response, Downstream of the ATF4-ATF3-CHOP Cascade. J. Immunol. 2009, 182, 466–476. [Google Scholar] [CrossRef]
- Hopkins, M.M.; Zhang, Z.; Liu, Z.; Meier, K.E. Eicosopentaneoic Acid and Other Free Fatty Acid Receptor Agonists Inhibit Lysophosphatidic Acid- and Epidermal Growth Factor-Induced Proliferation of Human Breast Cancer Cells. J. Clin. Med. 2016, 5. [Google Scholar] [CrossRef]
- Davydov, I.V.; Bohmann, D.; Krammer, P.H.; Li-Weber, M. Cloning of the cDNA encoding human C/EBP gamma, a protein binding to the PRE-I enhancer element of the human interleukin-4 promoter. Gene 1995, 161, 271–275. [Google Scholar] [CrossRef]
- Wang, Y.; Zhang, Y.; Zhu, Y.; Zhang, P. Lipolytic inhibitor G0/G1 switch gene 2 inhibits reactive oxygen species production and apoptosis in endothelial cells. Am. J. Physiol. Cell Physiol. 2015, 308, C496–C504. [Google Scholar] [CrossRef] [PubMed]
- Welch, C.; Santra, M.K.; El-Assaad, W.; Zhu, X.; Huber, W.E.; Keys, R.A.; Teodoro, J.G.; Green, M.R. Identification of a protein, G0S2, that lacks Bcl-2 homology domains and interacts with and antagonizes Bcl-2. Cancer Res. 2009, 69, 6782–6789. [Google Scholar] [CrossRef] [PubMed]
- Chen, N.; Nishio, N.; Ito, S.; Tanaka, Y.; Sun, Y.; Isobe, K.-I. Growth arrest and DNA damage-inducible protein (GADD34) enhanced liver inflammation and tumorigenesis in a diethylnitrosamine (DEN)-treated murine model. Cancer Immunol. Immunother. 2015, 64, 777–789. [Google Scholar] [CrossRef] [PubMed]
- Hollander, M.C.; Zhan, Q.; Bae, I.; Fornace, A.J. Mammalian GADD34, an Apoptosis- and DNA Damage-inducible Gene. J. Biol. Chem. 1997, 272, 13731–13737. [Google Scholar] [CrossRef] [PubMed]
- Moriguchi, M.; Watanabe, T.; Fujimuro, M. Capsaicin Induces ATF4 Translation with Upregulation of CHOP, GADD34 and PUMA. Biol. Pharm. Bull. 2019, 42, 1428–1432. [Google Scholar] [CrossRef] [PubMed]
- Du, F.; Sun, L.; Chu, Y.; Li, T.; Lei, C.; Wang, X.; Jiang, M.; Min, Y.; Lu, Y.; Zhao, X.; et al. DDIT4 promotes gastric cancer proliferation and tumorigenesis through the p53 and MAPK pathways. Cancer Commun. 2018, 38, 45. [Google Scholar] [CrossRef]
- Park, H.-W.; Park, H.; Ro, S.-H.; Jang, I.; Semple, I.A.; Kim, D.N.; Kim, M.; Nam, M.; Zhang, D.; Yin, L.; et al. Hepatoprotective role of Sestrin2 against chronic ER stress. Nat. Commun. 2014, 5, 4233. [Google Scholar] [CrossRef]
- Bae, S.H.; Sung, S.H.; Oh, S.Y.; Lim, J.M.; Lee, S.K.; Park, Y.N.; Lee, H.E.; Kang, D.; Rhee, S.G. Sestrins activate Nrf2 by promoting p62-dependent autophagic degradation of Keap1 and prevent oxidative liver damage. Cell Metab. 2013, 17, 73–84. [Google Scholar] [CrossRef]
- Fontanil, T.; Mohamedi, Y.; Esteban, M.M.; Obaya, A.J.; Cal, S. Polyserase-1/TMPRSS9 induces pro-tumor effects in pancreatic cancer cells by activation of pro-uPA. Oncol. Rep. 2014, 31, 2792–2796. [Google Scholar] [CrossRef][Green Version]
- Fontanil, T.; Álvarez-Teijeiro, S.; Villaronga, M.Á.; Mohamedi, Y.; Solares, L.; Moncada-Pazos, A.; Vega, J.A.; García-Suárez, O.; Pérez-Basterrechea, M.; García-Pedrero, J.M.; et al. Cleavage of Fibulin-2 by the aggrecanases ADAMTS-4 and ADAMTS-5 contributes to the tumorigenic potential of breast cancer cells. Oncotarget 2017, 8, 13716–13729. [Google Scholar] [CrossRef] [PubMed]
- Mochizuki, S.; Okada, Y. ADAMs in cancer cell proliferation and progression. Cancer Sci. 2007, 98, 621–628. [Google Scholar] [CrossRef] [PubMed]
- Ha, V.L.; Bharti, S.; Inoue, H.; Vass, W.C.; Campa, F.; Nie, Z.; de Gramont, A.; Ward, Y.; Randazzo, P.A. ASAP3 is a focal adhesion-associated Arf GAP that functions in cell migration and invasion. J. Biol. Chem. 2008, 283, 14915–14926. [Google Scholar] [CrossRef] [PubMed]
- Di Blasio, L.; Gagliardi, P.A.; Puliafito, A.; Primo, L. Serine/Threonine Kinase 3-Phosphoinositide-Dependent Protein Kinase-1 (PDK1) as a Key Regulator of Cell Migration and Cancer Dissemination. Cancers 2017, 9. [Google Scholar] [CrossRef]
- Evensen, N.A.; Kuscu, C.; Nguyen, H.-L.; Zarrabi, K.; Dufour, A.; Kadam, P.; Hu, Y.-J.; Pulkoski-Gross, A.; Bahou, W.F.; Zucker, S.; et al. Unraveling the role of KIAA1199, a novel endoplasmic reticulum protein, in cancer cell migration. J. Natl. Cancer Inst. 2013, 105, 1402–1416. [Google Scholar] [CrossRef]
- Jami, M.-S.; Hou, J.; Liu, M.; Varney, M.L.; Hassan, H.; Dong, J.; Geng, L.; Wang, J.; Yu, F.; Huang, X.; et al. Functional proteomic analysis reveals the involvement of KIAA1199 in breast cancer growth, motility and invasiveness. BMC Cancer 2014, 14, 194. [Google Scholar] [CrossRef]
- Duong, L.T.; Wesolowski, G.A.; Leung, P.; Oballa, R.; Pickarski, M. Efficacy of a cathepsin K inhibitor in a preclinical model for prevention and treatment of breast cancer bone metastasis. Mol. Cancer Ther. 2014, 13, 2898–2909. [Google Scholar] [CrossRef]
- Gu, X.; Peng, Y.; Zhao, Y.; Liang, X.; Tang, Y.; Liu, J. A novel derivative of artemisinin inhibits cell proliferation and metastasis via down-regulation of cathepsin K in breast cancer. Eur. J. Pharmacol. 2019, 858, 172382. [Google Scholar] [CrossRef]
- La Paglia, L.; Listì, A.; Caruso, S.; Amodeo, V.; Passiglia, F.; Bazan, V.; Fanale, D. Potential Role of ANGPTL4 in the Cross Talk between Metabolism and Cancer through PPAR Signaling Pathway. PPAR Res. 2017, 2017, 8187235. [Google Scholar] [CrossRef]
- Cazes, A.; Galaup, A.; Chomel, C.; Bignon, M.; Bréchot, N.; Le Jan, S.; Weber, H.; Corvol, P.; Muller, L.; Germain, S.; et al. Extracellular matrix-bound angiopoietin-like 4 inhibits endothelial cell adhesion, migration, and sprouting and alters actin cytoskeleton. Circ. Res. 2006, 99, 1207–1215. [Google Scholar] [CrossRef]
- Hsieh, H.-Y.; Jou, Y.-C.; Tung, C.-L.; Tsai, Y.-S.; Wang, Y.-H.; Chi, C.-L.; Lin, R.-I.; Hung, S.-K.; Chuang, Y.-M.; Wu, S.-F.; et al. Epigenetic silencing of the dual-role signal mediator, ANGPTL4 in tumor tissues and its overexpression in the urothelial carcinoma microenvironment. Oncogene 2018, 37, 673–686. [Google Scholar] [CrossRef] [PubMed]
- Shin, S.-S.; Song, J.-H.; Hwang, B.; Park, S.L.; Kim, W.T.; Park, S.-S.; Kim, W.-J.; Moon, S.-K. Angiopoietin-like protein 4 potentiates DATS-induced inhibition of proliferation, migration, and invasion of bladder cancer EJ cells; involvement of G2/M-phase cell cycle arrest, signaling pathways, and transcription factors-mediated MMP-9 expression. Food Nutr. Res. 2017, 61, 1338918. [Google Scholar] [CrossRef] [PubMed]
- Adhikary, T.; Brandt, D.T.; Kaddatz, K.; Stockert, J.; Naruhn, S.; Meissner, W.; Finkernagel, F.; Obert, J.; Lieber, S.; Scharfe, M.; et al. Inverse PPARβ/δ agonists suppress oncogenic signaling to the ANGPTL4 gene and inhibit cancer cell invasion. Oncogene 2013, 32, 5241–5252. [Google Scholar] [CrossRef] [PubMed]
- Tripathy, J.; Tripathy, A.; Thangaraju, M.; Suar, M.; Elangovan, S. α-Lipoic acid inhibits the migration and invasion of breast cancer cells through inhibition of TGFβ signaling. Life Sci. 2018, 207, 15–22. [Google Scholar] [CrossRef]
- Inácio Pinto, N.; Carnier, J.; Oyama, L.M.; Otoch, J.P.; Alcântara, P.S.; Tokeshi, F.; Nascimento, C.M. Cancer as a Proinflammatory Environment: Metastasis and Cachexia. Mediat. Inflamm. 2015, 2015, 791060. [Google Scholar] [CrossRef]
- Fortenberry, Y.M.; Brandal, S.M.; Carpentier, G.; Hemani, M.; Pathak, A.P. Intracellular Expression of PAI-1 Specific Aptamers Alters Breast Cancer Cell Migration, Invasion and Angiogenesis. PLoS ONE 2016, 11, e0164288. [Google Scholar] [CrossRef]
- Melzer, C.; von der Ohe, J.; Otterbein, H.; Ungefroren, H.; Hass, R. Changes in uPA, PAI-1, and TGF-β Production during Breast Cancer Cell Interaction with Human Mesenchymal Stroma/Stem-Like Cells (MSC). Int. J. Mol. Sci. 2019, 20. [Google Scholar] [CrossRef]
- Zhang, X.; Huang, S.; Guo, J.; Zhou, L.; You, L.; Zhang, T.; Zhao, Y. Insights into the distinct roles of MMP-11 in tumor biology and future therapeutics (Review). Int. J. Oncol. 2016, 48, 1783–1793. [Google Scholar] [CrossRef]
- Gao, S.-P.; Sun, H.-F.; Li, L.-D.; Fu, W.-Y.; Jin, W. UHRF1 promotes breast cancer progression by suppressing KLF17 expression by hypermethylating its promoter. Am. J. Cancer Res. 2017, 7, 1554–1565. [Google Scholar]
- Gumireddy, K.; Li, A.; Gimotty, P.A.; Klein-Szanto, A.J.; Showe, L.C.; Katsaros, D.; Coukos, G.; Zhang, L.; Huang, Q. KLF17 is a negative regulator of epithelial-mesenchymal transition and metastasis in breast cancer. Nat. Cell Biol. 2009, 11, 1297–1304. [Google Scholar] [CrossRef]
- Ismail, I.A.; Kang, H.S.; Lee, H.-J.; Kim, J.-K.; Hong, S.-H. DJ-1 upregulates breast cancer cell invasion by repressing KLF17 expression. Br. J. Cancer 2014, 110, 1298–1306. [Google Scholar] [CrossRef] [PubMed]
- Corsa, C.A.S.; Brenot, A.; Grither, W.R.; Van Hove, S.; Loza, A.J.; Zhang, K.; Ponik, S.M.; Liu, Y.; DeNardo, D.G.; Eliceiri, K.W.; et al. The Action of Discoidin Domain Receptor 2 in Basal Tumor Cells and Stromal Cancer-Associated Fibroblasts Is Critical for Breast Cancer Metastasis. Cell Rep. 2016, 15, 2510–2523. [Google Scholar] [CrossRef] [PubMed]
- Jiang, H.; Hu, H.; Tong, X.; Jiang, Q.; Zhu, H.; Zhang, S. Calcium-binding protein S100P and cancer: Mechanisms and clinical relevance. J. Cancer Res. Clin. Oncol. 2012, 138, 1–9. [Google Scholar] [CrossRef] [PubMed]
- Gibadulinova, A.; Tothova, V.; Pastorek, J.; Pastorekova, S. Transcriptional regulation and functional implication of S100P in cancer. Amino Acids 2011, 41, 885–892. [Google Scholar] [CrossRef] [PubMed]
- Venkateswaran, K.; Verma, A.; Bhatt, A.N.; Shrivastava, A.; Manda, K.; Raj, H.G.; Prasad, A.; Len, C.; Parmar, V.S.; Dwarakanath, B.S. Emerging Roles of Calreticulin in Cancer: Implications for Therapy. Curr. Protein Pept. Sci. 2018, 19, 344–357. [Google Scholar] [CrossRef]
- Lu, Y.-C.; Weng, W.-C.; Lee, H. Functional roles of calreticulin in cancer biology. Biomed Res. Int. 2015, 2015, 526524. [Google Scholar] [CrossRef]
- Mazzio, E.A.; Lewis, C.A.; Soliman, K.F.A. Transcriptomic Profiling of MDA-MB-231 Cells Exposed to Boswellia Serrata and 3-O-Acetyl-B-Boswellic Acid; ER/UPR Mediated Programmed Cell Death. Cancer Genom. Proteom. 2017, 14, 409–425. [Google Scholar] [CrossRef]
- Schmiech, M.; Lang, S.J.; Werner, K.; Rashan, L.J.; Syrovets, T.; Simmet, T. Comparative Analysis of Pentacyclic Triterpenic Acid Compositions in Oleogum Resins of Different Boswellia Species and Their In Vitro Cytotoxicity against Treatment-Resistant Human Breast Cancer Cells. Molecules 2019, 24, 2153. [Google Scholar] [CrossRef]


| Official Symbol * | Official Full Name (According to GeneCards®) | Main Functions (According to GeneCards®) | Log2 Fold Change | |
|---|---|---|---|---|
| 12h | 24h | |||
| DLEC1 | DLEC1 Cilia and Flagella Associated Protein | May act as a tumor suppressor by inhibiting cell proliferation | 4.93 | |
| ESRP1 | pithelial Splicing Regulatory Protein 1 | mRNA splicing factor | 4.12 | |
| C5AR1 | Complement C5a Receptor 1 | Signal transduction; immune response | 3.96 | |
| GDF15 | Growth Differentiation Factor 15 | Signal transduction | 3.95 | |
| SHANK2 | SH3 And Multiple Ankyrin Repeat Domains 2 | Synapse component | 3.73 | |
| MOV10L1 | Mov10 Like RISC Complex RNA Helicase 1 | piRNA processing; transposable element inhibition | 3.67 | |
| INHBE | Inhibin Subunit Beta E | Apoptosis inductor; proliferation inhibitor, ER stress response | 3.43 | |
| FLRT1 | Fibronectin Leucine Rich Transmembrane Protein 1 | Signal transduction; cell adhesion | 3.39 | |
| ANGPTL4 | Angiopoietin Like 4 | Lipoprotein metabolism; Regulation of lipid metabolism by PPARalpha | 3.58 | 3.06 |
| SPX (C12orf39) | Spexin Hormone |
modulation of cardiovascular and renal function; energy metabolism and storage; inhibits adrenocortical cell proliferation | 2.96 | |
| KLHDC7B | Kelch Domain Containing 7B | Unknown | 2.91 | |
| ASNS | Asparagine Synthetase (Glutamine-Hydrolyzing) | Asparagin synthesis | 2.81 | |
| ECM2 | Extracellular Matrix Protein 2 | Cell adhesion | 2.78 | |
| EPGN | Epithelial Mitogen | Signal transduction; proliferation | 1.23 | 2.67 |
| CTH | Cystathionine Gamma-Lyase | Cysteine metabolism | 2.59 | |
| NUPR1 | Nuclear Protein 1, Transcriptional Regulator | Transcriptional regulator; stress response | 2.48 | |
| CLDN1 | Claudin 1 | Tight junction component; water permeability | 2.43 | |
| IL1A | Interleukin 1 Alpha | Signal transduction; inflammatory response | 2.39 | |
| SLC16A1 | Solute Carrier Family 16 Member 1 | Monocarboxylate transporter | 2.37 | |
| HSPA5 | Heat Shock Protein Family A (Hsp70) Member 5 | Endoplasmic reticulum chaperone; ER stress response | 2.28 | |
| AKR1C1 | Aldo-Keto Reductase Family 1 Member C1 | Progesterone metabolism | 1.26 | 2.25 |
| TRIB3 | Tribbles Pseudokinase 3 | Signal transduction; inhibition of NF-KB pathway | 2.22 | |
| SLC6A9 | Solute Carrier Family 6 Member 9 | Glycine transporter | 2.18 | |
| HMOX1 | Heme Oxygenase 1 | Heme catabolism | 1.47 | 2.17 |
| PLIN2 | Perilipin 2 | Lipid droplets component; marker of lipid accumulation; Regulation of lipid metabolism by PPARalpha | 1.86 | 2.12 |
| Official Symbol * | Official Full Name (According to GeneCards®) | Main Functions (According to GeneCards®) | Log2 Fold Change | |
|---|---|---|---|---|
| 12h | 24h | |||
| INSIG1 | Insulin Induced Gene 1 | Regulation of cholesterol biosynthesis by SREBP (SREBF). | −1.95 | −2.50 |
| SCD | Stearoyl-CoA Desaturase | Fatty Acyl-CoA Biosynthesis; Regulation of cholesterol biosynthesis by SREBP (SREBF). | −1.82 | −2.28 |
| PLEKHS1 | Pleckstrin Homology Domain Containing S1 | Unknow | −1.07 | −2.21 |
| SORBS2 | Sorbin And SH3 Domain Containing 2 | Signal transduction; adaptator protein | −2.15 | |
| SHISA3 | Shisa Family Member 3 | Signal transduction; adaptator protein; Wnt pathway | −2.05 | |
| LINC00263 | Long Intergenic Non-Protein Coding RNA 263 | Unknow | −1.64 | −1.92 |
| PDE4B | Phosphodiesterase 4B | Signal transduction | −1.86 | |
| NEURL1B | Neuralized E3 Ubiquitin Protein Ligase 1B | E3 ubiquitin-protein ligase; Notch pathway | −1.82 | |
| F13A1 | Coagulation Factor XIII A Chain | Clotting | −1.82 | |
| LIPG | Lipase G, Endothelial Type | Lipoprotein metabolism | −1.55 | −1.82 |
| WT1 | Wilms’ Tumor-1 Transcription Factor | Transcription factor; cell proliferation; tumor suppressor | −1.81 | |
| CD34 | CD-34 molecule | Surface antigen; possible adhesion molecule | −1.26 | −1.80 |
| MEOX1 | Mesenchyme Homeobox 1 | Transcription factor | −1.08 | −1.76 |
| FADS2 | Fatty Acid Desaturase 2 | Biosynthesis of highly unsaturated fatty acids | −1.03 | −1.74 |
| MVK | Mevalonate Kinase | Terpenoid backbone biosynthesis; Regulation of cholesterol biosynthesis by SREBP | −1.19 | −1.72 |
| OLFML2B | Olfactomedin Like 2B | Extracellular matrix binding | −1.63 | |
| CAVIN2 (SDPR) | Caveolae Associated Protein 2 | Regulation of caveolae morphology | −1.62 | |
| ACOT1 | Acyl-CoA Thioesterase 1 | Fatty acid biosynthesis | −1.46 | −1.61 |
| TENT5C (FAM46C) | Terminal Nucleotidyltransferase 5C | mRNA stability; Mainly targets mRNAs encoding endoplasmic Reticulum-targeted protein; may be involved in the induction of cell death | −1.61 | |
| RHOV | Ras Homolog Family Member V | Signal transduction | −1.60 | |
| IDI1 | Isopentenyl-Diphosphate Delta Isomerase 1 | Terpenoid backbone biosynthesis; Regulation of cholesterol biosynthesis by SREBP | −1.11 | −1.60 |
| ANO1 | Anoctamin 1 | Calcium-activated chloride channel | −1.57 | |
| HMGCS1 | 3-Hydroxy-3-Methylglutaryl-CoA Synthase 1 | Regulation of lipid metabolism by PPARalpha | −1.32 | −1.56 |
| SESN3 | Sestrin 3 | Protection against oxidative stress; negative regulation of mTOR pathway | −1.55 | |
| FAM13C | Family With Sequence Similarity 13 Member C | Unknow | −1.55 | |
© 2020 by the authors. Licensee MDPI, Basel, Switzerland. This article is an open access article distributed under the terms and conditions of the Creative Commons Attribution (CC BY) license (http://creativecommons.org/licenses/by/4.0/).
Share and Cite
Chénais, B.; Cornec, M.; Dumont, S.; Marchand, J.; Blanckaert, V. Transcriptomic Response of Breast Cancer Cells MDA-MB-231 to Docosahexaenoic Acid: Downregulation of Lipid and Cholesterol Metabolism Genes and Upregulation of Genes of the Pro-Apoptotic ER-Stress Pathway. Int. J. Environ. Res. Public Health 2020, 17, 3746. https://doi.org/10.3390/ijerph17103746
Chénais B, Cornec M, Dumont S, Marchand J, Blanckaert V. Transcriptomic Response of Breast Cancer Cells MDA-MB-231 to Docosahexaenoic Acid: Downregulation of Lipid and Cholesterol Metabolism Genes and Upregulation of Genes of the Pro-Apoptotic ER-Stress Pathway. International Journal of Environmental Research and Public Health. 2020; 17(10):3746. https://doi.org/10.3390/ijerph17103746
Chicago/Turabian StyleChénais, Benoît, Marine Cornec, Solenne Dumont, Justine Marchand, and Vincent Blanckaert. 2020. "Transcriptomic Response of Breast Cancer Cells MDA-MB-231 to Docosahexaenoic Acid: Downregulation of Lipid and Cholesterol Metabolism Genes and Upregulation of Genes of the Pro-Apoptotic ER-Stress Pathway" International Journal of Environmental Research and Public Health 17, no. 10: 3746. https://doi.org/10.3390/ijerph17103746
APA StyleChénais, B., Cornec, M., Dumont, S., Marchand, J., & Blanckaert, V. (2020). Transcriptomic Response of Breast Cancer Cells MDA-MB-231 to Docosahexaenoic Acid: Downregulation of Lipid and Cholesterol Metabolism Genes and Upregulation of Genes of the Pro-Apoptotic ER-Stress Pathway. International Journal of Environmental Research and Public Health, 17(10), 3746. https://doi.org/10.3390/ijerph17103746