Article

Toxicity Evaluation of Quantum Dots (ZnS and CdS) Singly and Combined in Zebrafish (Danio rerio)

1
UCIBIO—Applied Molecular Biosciences Unit, Departamento de Química, Faculdade de Ciências e Tecnologia, Universidade NOVA de Lisboa, 2829-516 Caparica, Portugal
2
MARE—Marine and Environmental Sciences Centre, Departamento de Ciências e Engenharia do Ambiente, Faculdade de Ciências e Tecnologia, Universidade NOVA de Lisboa, 2829-516 Caparica, Portugal
3
LAQV/REQUIMTE—Laboratório Associado para a Química Verde, Departamento de Química, Faculdade de Ciências e Tecnologia, Universidade NOVA de Lisboa, 2829-516 Caparica, Portugal
4
CENIMAT/I3N—Centro de Investigação de Materiais /Institute for Nanostructures, Nanomodelling and Nanofabrication, Departamento de Ciência dos Materiais, Faculdade de Ciências e Tecnologia, Universidade NOVA de Lisboa, 2829-516 Caparica, Portugal
*
Author to whom correspondence should be addressed.
Int. J. Environ. Res. Public Health 2020, 17(1), 232; https://doi.org/10.3390/ijerph17010232
Submission received: 31 October 2019 / Revised: 23 December 2019 / Accepted: 24 December 2019 / Published: 28 December 2019
(This article belongs to the Special Issue Metal Exposure and Health Risk Assessment)

Abstract

:
The exponential growth of nanotechnology has led to the production of large quantities of nanomaterials for numerous industrial, technological, agricultural, environmental, food and many other applications. However, this huge production has raised growing concerns about the adverse effects that the release of these nanomaterials may have on the environment and on living organisms. Regarding the effects of QDs on aquatic organisms, existing data is scarce and often contradictory. Thus, more information is needed to understand the mechanisms associated with the potential toxicity of these nanomaterials in the aquatic environment. The toxicity of QDs (ZnS and CdS) was evaluated in the freshwater fish Danio rerio. The fishes were exposed for seven days to different concentrations of QDs (10, 100 and 1000 µg/L) individually and combined. Oxidative stress enzymes (catalase, superoxide dismutase and glutathione S-transferase), lipid peroxidation, HSP70 and total ubiquitin were assessed. In general, results suggest low to moderate toxicity as shown by the increase in catalase activity and lipid peroxidation levels. The QDs (ZnS and CdS) appear to cause more adverse effects singly than when tested combined. However, LPO results suggest that exposure to CdS singly caused more oxidative stress in zebrafish than ZnS or when the two QDs were tested combined. Levels of Zn and Cd measured in fish tissues indicate that both elements were bioaccumulated by fish and the concentrations increased in tissues according to the concentrations tested. The increase in HSP70 measured in fish exposed to 100 µg ZnS-QDs/L may be associated with high levels of Zn determined in fish tissues. No significant changes were detected for total ubiquitin. More experiments should be performed to fully understand the effects of QDs exposure to aquatic biota.

1. Introduction

It is undeniable that humanity has entered an era of great development regarding nanotechnology. In fact, nanoscale manufacturing and the use of nanomaterials are already part of everyday life [1]. The progress made in this area in recent decades resulted in a tremendous impact on the industry with several uses in biomedicine, pharmaceutical, environment, electronics and many other fields [2,3]. Engineered nanomaterials (ENMs) (e.g., nanoparticles, carbon nanotubes, dendrimers, fullerenes, quantum dots) are usually developed using different types of materials (e.g., carbon, organic polymers, metals or metal oxides) and were defined as materials with sizes below 100 nm [4,5]. ENMs have different chemical and physical properties than those of their bulk counterparts as a result of high surface area to volume ratio and very small size [6]. Furthermore, ENMs can be manufactured with different shapes as tubular, spherical, flat, cubic or pillar [7,8].
Although the economic value of nanotechnology is well recognized, less attention has been given to the potential effects on ecosystems and particularly on the aquatic biota [9,10,11]. For example, much remains to be known about the fate and dispersion of ENMs in the environment and their main exposure routes [4,12,13]. According to a review by Libralato et al. [14], the increasing detection of ENMs in aquatic ecosystems is a direct consequence of the increased production and uses of these materials. Furthermore, developed models estimate that ENMs are present in surface waters ranging from ng/L to µg/L depending on the type of nanomaterial [15,16]. Nonetheless, the potential toxicological effects of ENMs to the aquatic biota are yet to clarify. Additionally, the possibility that ENMs can be bioaccumulated and transferred through trophic levels is also of great concern [17,18].
Quantum dots (QDs) are a distinct type of nanoparticles with several potential applications in the electronics industry and in biomedical applications [19,20]. QDs are semiconductor metalloid nanocrystals (~2–100 nm) showing unique optical and electrical properties [2,21,22]. Furthermore, zinc sulfide (ZnS), zinc–selenium (ZnSe), cadmium sulfide (CdS), cadmium–selenium (CdSe), and cadmium–tellurium (CdTe) cores belong to the group II-IV series QDs and are defined as particles with physical dimensions smaller than the exciton Bohr radius [23,24,25].
They are widely used as therapeutic agents and fluorescent dyes and are useful in the electronic field as LED displays, photovoltaic solar cells, ultrahigh-density data storage and quantum information processing [21,26,27]. The QDs core comprises diverse metal complexes (e.g., semiconductors, noble metals, and magnetic transition metals) and is usually encapsulated by a shell or a “cap” [19,21,28]. The shell improves QDs optical and electronic properties and reduces core metal leaching events, which are a major cause of toxicity [29,30]. The toxicity of QDs is variable as they can vary in their properties depending on the material of which they are made (e.g., core, capping) and other characteristics as size, surface chemistry or QDs concentration [14,23]. In addition, toxicity also depends on the living organism studied since different species may respond in a different way. Consequently, the current scientific literature reports conflicting and inconsistent results [14]. According to a review from Valizadeh et al. [19], QDs caused oxidative stress in plants, provoked toxicity in animal cells, but no effects were observed in amoeba exposed to QDs. Nonetheless, the toxicity caused by different types of QDs was reported in a great number of in vitro and in vivo studies as reviewed by Yong et al. [31]. Some of the major effects on cells and organisms are related to cell viability reduction, increased apoptosis and changes in the organism’s immune responses. Besides, several studies demonstrated that QDs are capable to generate reactive oxygen species (ROS) [32,33,34]. Therefore, the comprehension of the QDs potential toxicity is crucial and requires a fundamental understanding of QDs’ physical and chemical properties [21].
Zebrafish (Danio rerio) is one of the most commonly biological models used in developmental biology and molecular genetics. However, its great value for toxicological studies is now well established [35,36]. Due to their small size, easy maintenance, early morphology, reduced housing area, and low rearing costs, zebrafishes are now part of various risk assessment studies and programs [37].
Oxidative stress biomarkers have been widely used in nanotoxicology providing important information on the effects of exposure to nanomaterials and other environmental contaminants [38,39]. Generally, after exposure of organisms to ENMs, some biochemical and cellular responses may occur and indicate oxidative stress [40,41]. These responses activate the antioxidant defense system to protect the organism’s cells against the excessive production of ROS. Some of the antioxidant enzymes produced to fight oxidative stress are superoxide dismutase (SOD), catalase (CAT), glutathione peroxidase (GPX) or glutathione S-transferase (GSTs) which is an enzyme mainly involved in detoxification processes [11,14]. The impairment of this antioxidant system often results in a reduction of defense capacity and injury to cells by damaging membrane lipids, proteins, and DNA. Therefore, oxidative stress enzymes are a valuable tool to assess the toxic effects of QDs in exposed organisms [38,42,43]. However, much remains to be done regarding the risk assessment of QDs, especially for aquatic ecosystems and their biota, as they are the final repository of wastewater effluents.
Thus, the main objective of the present study is to assess the toxicity of different concentrations of QDs (CdS and ZnS), singly and combined, in the freshwater fish Danio rerio, by measuring the activities of antioxidant enzymes (superoxide dismutase, glutathione-S-transferase and catalase), lipid peroxidation, total antioxidant capacity, ubiquitin and HSP70. This work intends to provide additional information on the toxicity of QDs to fish, as increasing amounts are expected to be produced and used by industry in the coming years. Consequently, large quantities of QDs can be discharged to the aquatic ecosystems with an impact on the environment still unresolved and therefore more data on this subject is needed.

2. Materials and Methods

2.1. Quantum Dots (QDs) Synthesis

The QDs (CdS and ZnS) synthesis followed a method previously described by the authors [44], where zinc acetate dihydrate (ACS reagent, ≥98%) and cadmium acetate dihydrate (purum p.a., ≥98.0% (KT)), were added to 1-dodecanethiol (ACS reagent, ≥98%). The mixtures were purged with industrial-grade nitrogen and transferred to a Monowave 400 microwave reactor (Anton Paar, Graz, Austria) where they were heated to 300 °C in 10 min and kept at that temperature for 25 min. The suspensions were then centrifuged at 9000× rpm, and the pellet washed with ethanol 96%. This procedure was repeated four times. Afterwards, the resultant powders were washed using chloroform and centrifuged at 9000× rpm. The pellets were stored in the dark.

2.2. Preparation and Characterization of QDs (CdS and ZnS) Suspensions

The stock solutions of both QDs (1.0 g/L) were prepared using distilled water and then ultra-sonicated (10 min, 35 KHz at room temperature) using an ultrasonic bath (J-P Selecta Ultrasons HD, Barcelona, Spain). Subsequently, the stock solutions were stored in the dark at 4 °C until further use. To perform the bioassays, QDs suspensions were added to 10 exposure glass containers (1.0 L volume), containing previously filtered and de-chlorinated tap water, to obtain the following nominal concentrations: 10 µg CdS-QDs/L and 10 µg ZnS-QDs /L; 100 µg CdS-QDs /L and 100 µg ZnS-QDs/L; 1000 µg CdS-QDs/L and 1000 µg ZnS-QDs/L; 10 µg CdS-QDs /L plus 10 µg ZnS-QDs /L; 100 µg CdS-QDs /L plus 100 µg ZnS-QDs /L; 1000 µg CdS-QDs /L plus 1000 µg ZnS-QDs /L, which were selected based on models that estimate nanomaterial concentrations in aquatic systems [15,45].
The QDs were analyzed by scanning electron microscopy (SEM), transmission electron microscopy (TEM) and dynamic light scattering (DLS). For the SEM analysis, dispersions of all the QDs (CdS and ZnS) were applied on a carbon-coated adhesive, dried at room temperature and examined with a 1.00 to 2.00 keV field; scanning electron microscope (AURIGA microscope, Carl Zeiss, Oberkochen, Germany). For the TEM analysis, samples were dispersed in ethanol, dried on a Formvar and carbon coated 200 mesh copper grid and examined on a H-8100 II instrument (Hitachi, Tokyo, Japan) with a 200 kV electron beam at the MicroLab of the Instituto Superior Técnico (IST). The transformation of the QDs TEM images was performed with the aid of Gatan digital micrographs. Image J software was used to assess the size of the QDs by analyzing TEM images.
Dynamic Light Scattering (DLS) analyses were carried out in QDs suspensions (singly and combined) collected from the test glass containers, using a Nano particle Analyzer SZ-100 (HORIBA, Kyoto, Japan), with a Laser Diode (JUNO10G-HO, Showa. Optronics Co., Ltd., Yokohama, Japan) with an output of 10 mW (wavelength: 532 nm) and operating at 2 °C. Measurements obtained were processed using HORIBA SZ-100 software, furnished by HORIBA.

2.3. Bioassays

The test fish, D. rerio (N = 50 (× 2); 0.27 ± 0.15 g average weight; 2.74 ± 0.37 cm standard length), were obtained from commercial suppliers (Aquaplante, Lisbon, Portugal) and acclimated for one week in a closed-circuit system with filtered (activated carbon filtering) and de-chlorinated tap water. The fish were subjected to a photoperiod of 12h light to 12h darkness ratio, a temperature of 20 ± 1 °C and a pH of 7.4 ± 0.2, with continuous aeration enough for keeping the dissolved oxygen always higher than 6.0 mg/L. Then, zebrafish of both sexes, with less than one year of age, were randomly distributed by 10 glass containers, in groups of four fishes per container. The exposure assay was performed in duplicate. The glass containers had a capacity of 1.0 L volume of de-chlorinated water and the assay conditions (temperature, pH and dissolved oxygen) were the same as described before for the acclimation period. Some physical and chemical parameters as temperature (°C) (manual thermometer), ammonia (test kit API, Chalfont, PA, USA), pH and dissolved oxygen (Hanna Instrumentation, USA) were monitored during the assay. Fish were exposed for seven days to different concentrations of ZnS QDs and CdS QDs (10 µg/L, 100 µg/L and 1000 µg/L) singly and combined. Three containers containing filtered (carbon activated) and de-chlorinated tap water were used as controls. The experiment conditions in each container were renewed every 48 h. During the experiment period, fish were daily fed ad libitum (except 48 h before the end of the experiment) with commercial dry food (Eco vita - Anivite, Lisboa, Portugal) and the mortality rate was monitored daily. After the exposure period, fish were sampled and euthanized by freezing at - 80° for 5 min. Then fish were weighed and measured. Afterwards, the whole fish was homogenized as previously described [11,38]. In brief, fish were homogenized on ice-cold conditions, with the aid of a Tissue Homogenizer (Tissue Master 125, Omni, Kennesaw, GA, USA), in 3.0 mL of phosphate-buffered saline solution (PBS; 140 mM NaCl, (Panreac, Barcelona, Spain); 10 mM Na2HPO4, (Sigma-Aldrich, St. Louis, MO USA); 3 mM KCl, (Merck, Darmstadt, Germany); 2 mM KH2PO4, pH = 7.40, (Sigma-Aldrich). Tissue homogenates were transferred to microtubes (1.5 mL) and centrifuged 10,000×g (15 min at 4 °C) (VWR, model CT 15RE from Hitachi Koki Co., Ltd., Tokyo, Japan) and frozen at -80 °C until further analyses. All biochemical analyses were performed at least in duplicate. For normalizing results, the total protein mass (mg) was determined according to the Bradford (1976) method. A calibration curve was built using bovine serum albumin (BSA) standards (0 to 2.0 mg/mL).

2.4. Antioxidant Enzymes

2.4.1. Catalase

The catalase (CAT) activity was determined as described by Johansson and Borg [46] following adaptation to 96-well microplates. This method is based on the reaction of the enzyme with methanol in the presence of an optimal concentration of H2O2. The formaldehyde produced is measured using 4-amino-3-hydrazino-5-mercapto-1,2,4-triazole (Purpald) as a chromogen. Briefly, 20 µL of each sample or standard, 100 µL of assay buffer (100 mM potassium phosphate) and 30 µL of methanol (Scharlab, Barcelona, Spain) were added to each well of a 96-well microplate (Greiner Bio-One GmbH, Frickenhausen, Germany). Then, the reaction was initiated by adding 20 µL of 0.035 M Hydrogen peroxide (30%) (Sigma-Aldrich) to all the wells and the microplate was incubated for 20 min on a shaker. Afterwards, 30 µL of 10 M potassium hydroxide (Chem-Lab, Zedelgem, Belgium) and 30 µL of 34.2 mM Purpald in 0.5M HCl (Sigma-Aldrich) were added into each well and incubated for 10 min in a shaker at room temperature. Afterwards, 10 µL of 65.2 mM Potassium periodate in 0.5 M KOH (Sigma-Aldrich, St. Louis, MO USA) was added to each well and allowed to incubate for 5 min. Then, the absorbance was read at 540 nm in a microplate reader (Synergy HTX, BioTek, Winooski, VT, USA). Formaldehyde concentration of the samples was determined based on a calibration curve using formaldehyde standards and prepared from a 4.25 mM formaldehyde (Sigma-Aldrich) stock solution to obtain a range of concentrations from 0 to 75 µM. Results are expressed in relation to the total protein concentration (nmol/min/mg).

2.4.2. Superoxide Dismutase

The superoxide dismutase (SOD) assay was carried out using the nitroblue tetrazolium (NBT) method adapted from Sun et al. [47] for 96-well microplates. In this method, superoxide radicals (∙O2) are generated by a reaction of xanthine with xanthine-oxidase (XOD) that reduces NBT to formazan. SOD competes with NBT for the dismutation of ∙O2, inhibiting its reduction. In brief, 200 µL of 50 mM phosphate buffer (pH 8.0) (Sigma-Aldrich) was added to a 96-well microplate (Greiner, Bio-One GmbH, Frickenhausen, Germany), followed by adding 10 µL of 3 mM EDTA (Honey Well Riedel-de-Haën, Seelze, Germany), 10 µL of 3 mM xanthine (Sigma-Aldrich), 10 µL of 0.75 mM NBT (Sigma-Aldrich) and 10 µL of sample. Then, the reaction was initiated by adding 10 μL of XOD (Sigma-Aldrich) and the absorbance read at 560 nm, every 5 min, until reach 15 min, using a microplate reader (Synergy HTX, BioTek). The SOD results are expressed as a percentage (%) of inhibition of NBT-diformazan. For normalization purposes, the results were expressed in relation to the total protein concentration of the sample.

2.4.3. Glutathione S-Transferase

The activity of glutathione-S-transferase (GST) was measured using a modified method originally described by Habig et al. [48] and optimized for 96-well microplates. In this assay, a conjugate of 1-chloro-2,4-dinitrobenzene (CDNB) and glutathione (GSH) is formed resulting in an increase in absorbance at 340 nm. The assay was performed by preparing a reaction mixture solution composed of 9.8 mL phosphate-buffered saline solution (PBS, pH 7.4), 100 µL of 200 mM L-glutathione reduced (Sigma-Aldrich) and 100 µL of 100 mM CDNB (Sigma-Aldrich). Then, 180 µL of this mixed solution plus 20 µL of sample or GST standard were added into each well of a 96-well microplate (Greiner). The absorbance was read at 340 nm at each minute for six minutes, using a microplate reader (Synergy HTX, BioTek). The change in absorbance per minute was then estimated and the reaction rate was determined using a CDNB extinction coefficient of 5.3 mM/cm. The results are expressed in relation to the total protein concentration of the sample.

2.5. Lipid Peroxides Assay (MDA Content)

The lipid peroxides assay followed the thiobarbituric acid reactive substances (TBARS) protocol as described by Uchiyama and Mihara [49]. Five μL of each sample was added to 45 μL of 50 mM monobasic sodium phosphate buffer. Next, 12.5 μL of sodium dodecyl sulfate (SDS 8.1%), 93.5 μL of trichloroacetic acid (TCA 20%, pH = 3.5) and 93.5 μL of thiobarbituric acid (TBA 1%) were added to each microtube. Then, 50.5 μL of MilliQ-grade ultrapure water was added into each microtube and agitated for 30s in a vortex. Subsequently, microtube lids were punctured with the aid of a needle and incubated in water (10 min. at 100 °C). Afterwards, they were placed on ice for a few minutes and allowed to cool, followed by adding 62.5 μL of MilliQ-grade ultrapure water and 312.5 μL of n-butanol pyridine (15:1, v/v) into each well. Then, microtubes were centrifuged at 5000× g for 5 min. Duplicates of 150 μL of the supernatant of each reaction were added into a 96-well microplate (Greiner) and absorbance was read at 530 nm (Synergy HTX, BioTek). The lipid peroxides were quantified by building a calibration curve (0–0.1 μM TBARS) using malondialdehyde bis(dimethyl acetal) (MDA) (Merck) as standard and, normalized dividing by the total amount of protein (mg).

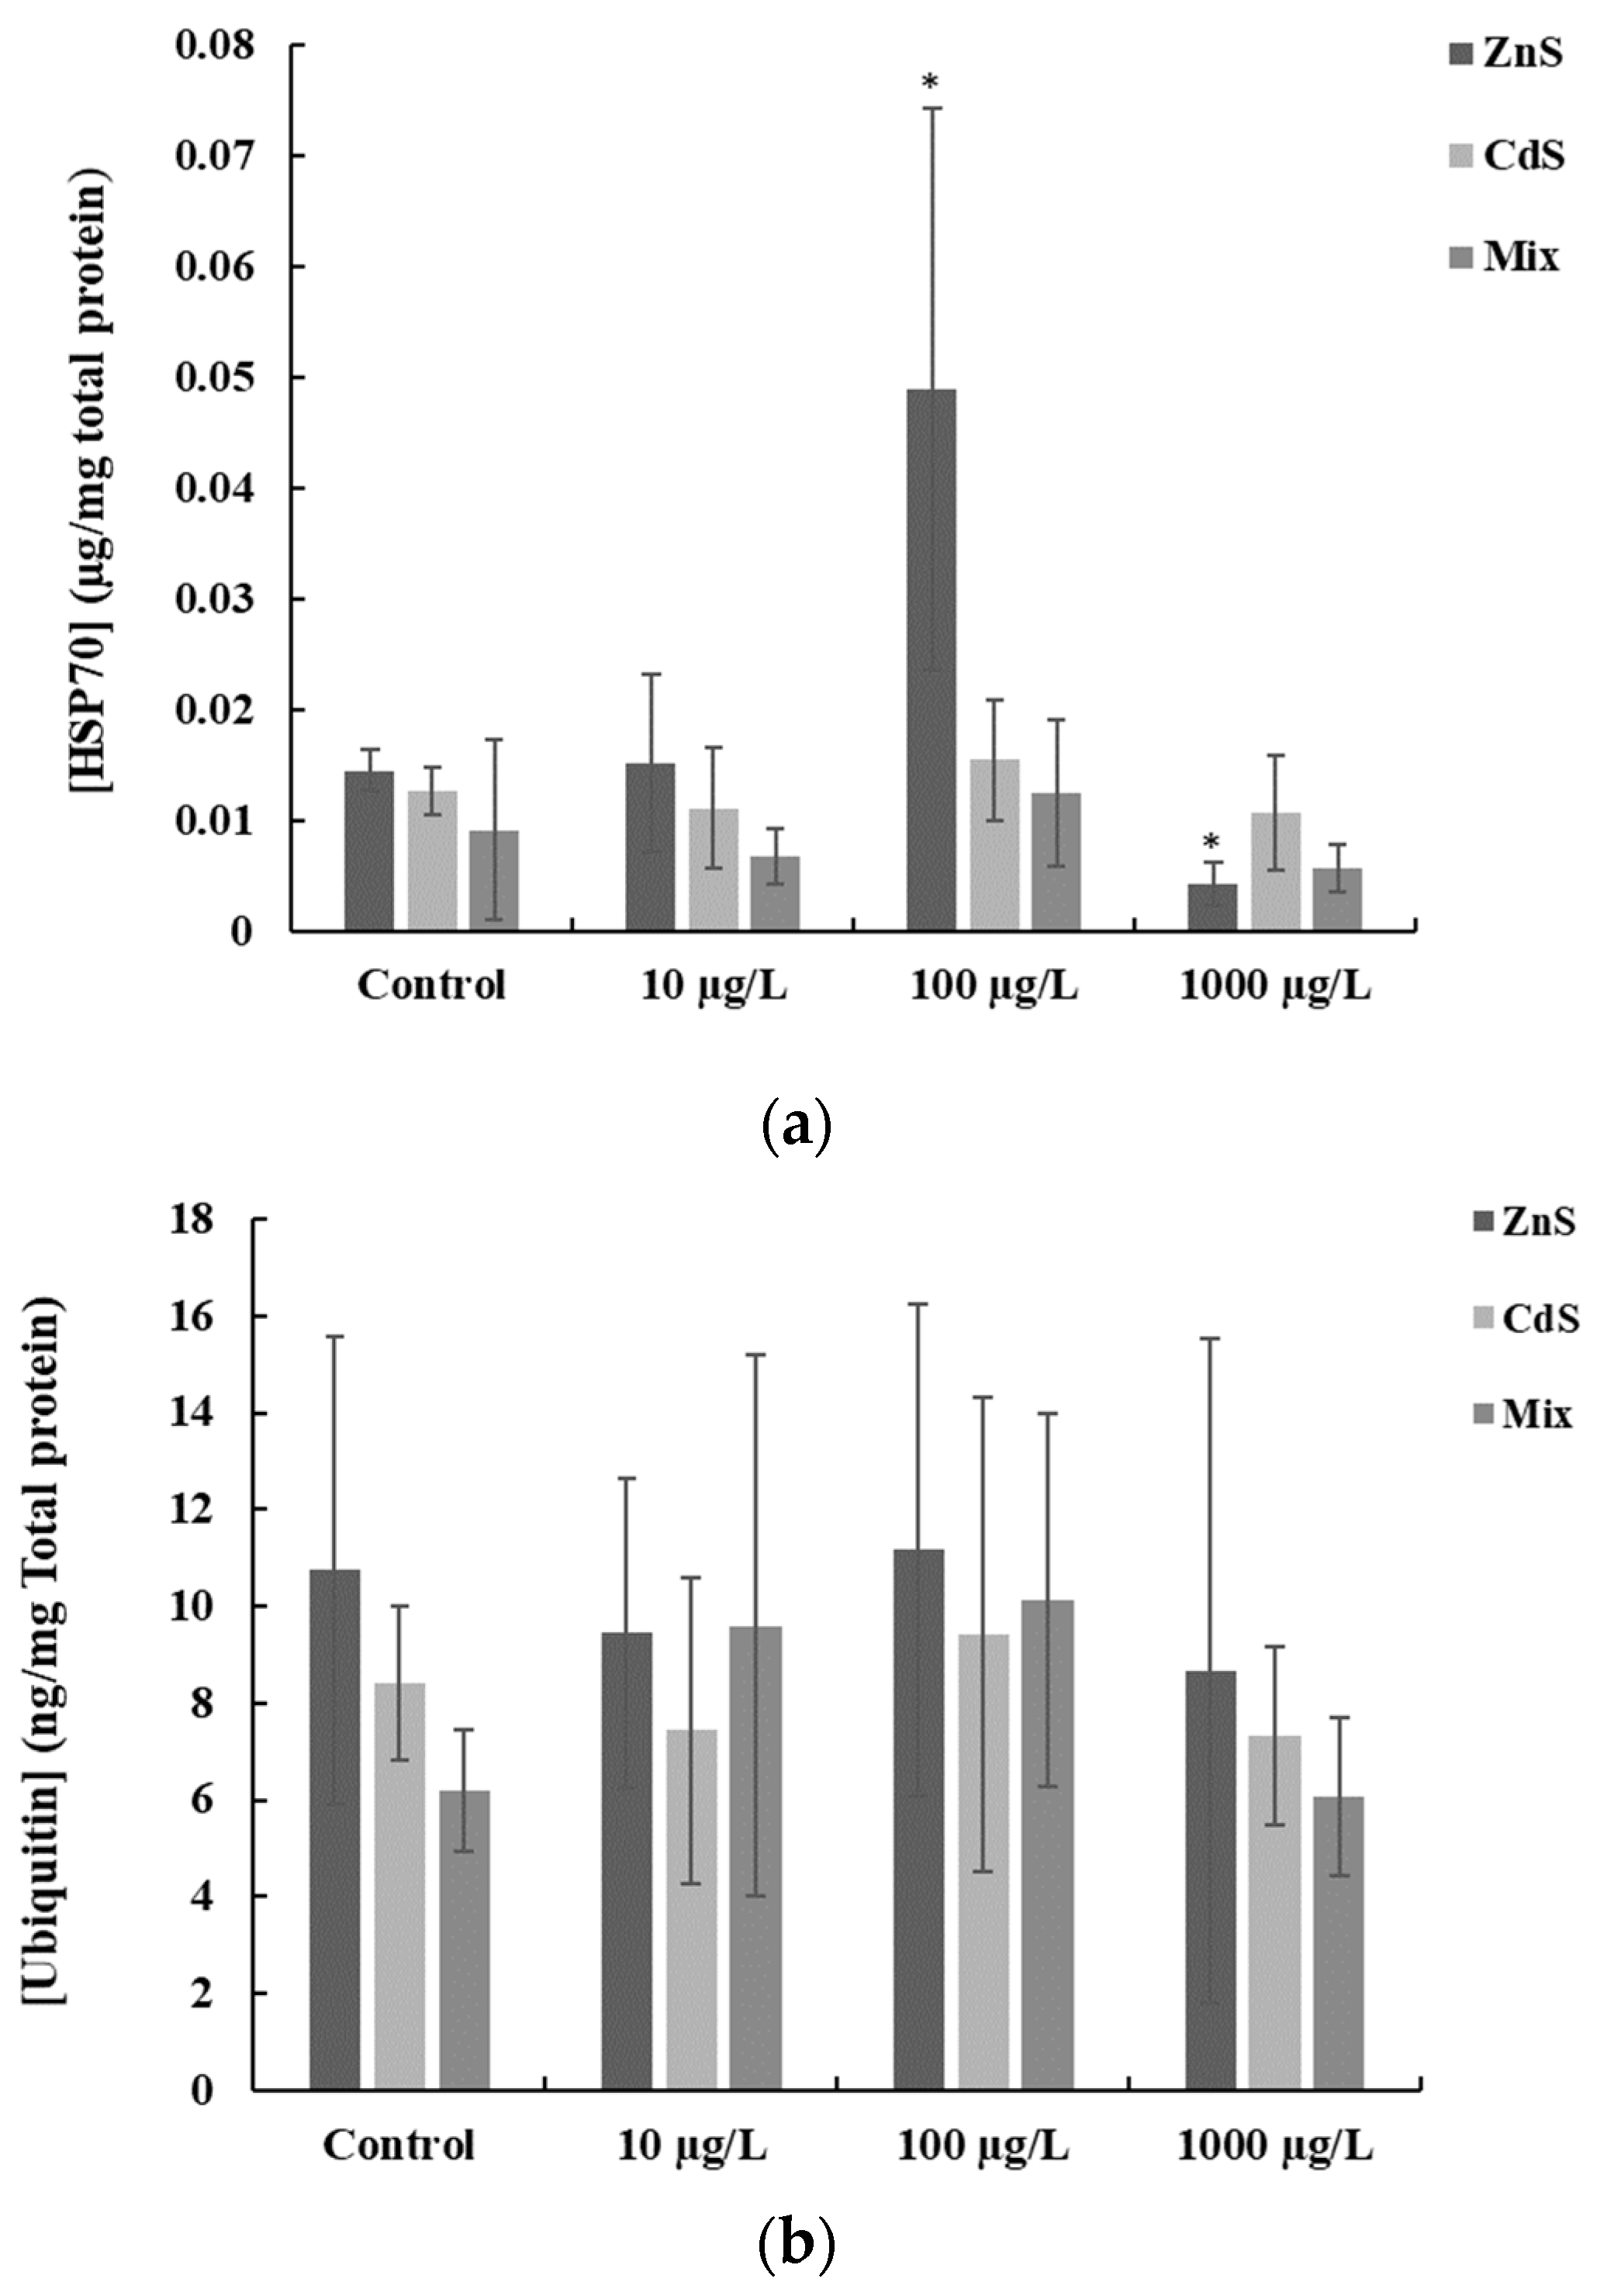
2.6. Heat Shock Protein (HSP70) and Total Ubiquitin

Heat shock protein 70 (HSP70) and total ubiquitin were quantified through an indirect Enzyme-linked Immunosorbent Assay (ELISA) as previously described by Madeira et al. [50]. For HSP70 or total ubiquitin (TUb), 50 μL of each sample or respective standards were added to a 96-well microplate (Greiner Bio One) and incubated overnight at 4 °C. Then, the microplates were washed three times with a 0.05% PBS Tween-20 solution (Sigma-Aldrich) and 200 μL of blocking solution (PBS with 1% BSA) (Nzytech, Lisboa, Portugal) was added to each well and then incubated at 37 °C for 90 min (Labnet, Edison, NJ, USA). Afterwards, the microplates were washed again (PBS with 0.05% Tween-20) and the primary antibodies (HSP70 or TUb) were added to the respective microplates after proper dilution (0.5 μg/mL). Subsequently, for HSP70 50 μL of primary antibody (anti-HSP70/HSC70, Acris GmbH, Herford, Germany) or for total ubiquitin, 50 μL of primary antibody (Ub P4D1 (sc-8017, Santa Cruz, Dallas, TX, USA) were added into the microplate wells. After another washing step, 50 μL of secondary antibody (anti-mouse IgG Fc specific - alkaline phosphatase, Sigma-Aldrich; diluted to 1:1000 in 1% BSA) was added to each microplate well and incubated for 90 min. at 37 °C. Then, 100 μL of alkaline-phosphatase substrate (composed of 100 mM NaCl (Panreac, Barcelona, Spain), 100 mM Tris-HCl (Sigma-Aldrich), 50 mM MgCl2 (Sigma-Aldrich) and 27 mM PnPP (4-nitrophenyl phosphate disodium salt hexahydrate, pH 8.5, Sigma-Aldrich), were added to each microplate well and incubated for 30 min at room temperature. Finally, 50 μL of stop solution (3M NaOH, Panreac) was added to each microplate well and the absorbance measured at 405 nm, using a microplate reader (Synergy HTX, BioTek). For quantification purposes, a calibration curve was built using purified HSP70 active protein (OriGene, Rockville, MD, USA) to give a range of 0 to 2.0 μg/mL. Ubiquitin standards of purified ubiquitin (UBpBio, E-1100, Aurora, CO, USA), were prepared to use a concentration range of 0 to 0.8 µg/mL to construct a standard curve. The results for Hsp70 and total ubiquitin were expressed in relation to the total protein concentration (mg) of the sample.

2.7. Element Analysis (ICP-EAS)

The QDs concentrations were measured as total Zn and Cd in fish tissues and water samples by inductively coupled plasma atomic emission spectrometry (ICP-EAS) using a model Ultima apparatus (Horiba-Jobin Yvon, Kyoto, Japan). In brief, fish tissues (homogenates) were dried (70 °C), weighed, and then digested with 0.5 mL HNO3 (Merck) and by adding 10 µL of H2O2 (Sigma-Aldrich) plus 490 µL of H2O into each microtube. The water from bioassays was collected and samples were transferred to 1.5 mL microtubes. Then they were processed by adding 50 μL of HNO3 (Merck) into each microtube. Additionally, another assay was performed to investigate metal ion dissociation from QDs following the same experimental conditions described for the bioassays, except that no fishes or food was added to the experiment. After 48 h, water samples were collected from the test glass containers and then centrifuged in 2.0 mL microtubes (20,000× g for 60 min. at 4 °C). Then, samples were processed as previously described by Benavides et al. [11]. In Brief, after centrifugation, the supernatant was filtered through a 0.1-μm syringe filter and transferred to new microtubes (1.5 mL), followed by acid digestion with HNO3 (Merck) and H2O2 (Panreac). All samples were analyzed in triplicate. Analysis of certified biological material (ERM®-CE278k) was performed to validate the results. The total Cd and Zn (mg/Kg) measured in digested samples of reference material (Cd 0.336 ± 0.018; Zn 79.23 ± 3.95) were in accordance with the certified values (Cd 0.358 ± 0.025; Zn 71 ± 4).

2.8. Statistical Analysis

The statistical analysis of the results was carried out by using the non-parametric Mann-Whitney U test the statistical assumptions required for ANOVA were not accomplished. Statistical analyses were performed with a significance level of 5%, using the STATISTICA TM software 8.0 (StatSoft Inc., Palo Alto, CA, USA).

3. Results

Representative images from the transmission electron microscope (TEM) analysis of the QDs (CdS and ZnS), singly and combined in H2O, are presented in Figure 1. Macroscopic observation of the QDs showed that the CdS were orange in color, and the Zn had a pale pink appearance. The TEM images were analyzed with Image J software and showed an average size of 10 ± 2 nm and an irregular shape for ZnS QDs and an average size of 8 ± 2 nm and a spherical shape for CdS QDs. SEM analyses were also carried confirming the sizes of both QDs estimated from TEM images. Regarding DLS analysis, results are shown in Table 1. The results indicate that both QDs (ZnS and CdS) singly and combined show a trend to aggregate in water forming large aggregates. The Largest aggregates were found at the highest concentration (1000 μg/L) of QDs (ZnS and Cds) tested alone.
During the exposure period, no changes were observed for the water quality parameters (pH, temperature, and ammonia) monitored in the test glass containers, remaining at normal levels. Throughout the exposure period no significant mortality was observed (less than 10%).
The results for the different QDs (ZnS and CdS) concentrations tested (singly and combined) determined in the water samples by ICP-AES are presented in Table 2. The results show a great reduction of both QDs (singly and combined) in the water samples in comparison to the nominal concentrations. The results of metal ion dissociation from QDs are presented in Table S1.
The results suggest that both Zn and Cd are present in the water samples as metal ions. However, a significant reduction was observed, varying from about 18 to 95%, depending on the tested dose and when compared to the total amount of Zn and Cd shown in Table 2.
The results from CAT, SOD, GST, and LPO in zebrafish exposed to the different QDs concentrations (singly and combined) are presented in Figure 2.
Regarding CAT specific activity (Figure 2a), a significant increase (p < 0.05) was found in fish exposed to 10 and 100 µg ZnS-QDs/L which showed the highest CAT average activities (17.42 ± 4.62 nmol/min/mg total protein). The lowest CAT average activities (6.76 ± 1.58 nmol/min/mg total protein) were measured in zebrafish exposed to 10 µg QDs/L (combined). Moreover, the statistical analysis revealed a significant increase (p < 0.05) in CAT activities in fish exposed to 100 and 1000 µg CdS-QDs/L.
The results from SOD expressed as percentage (%) of inhibition of NBT-diformazan (normalized to the total protein mass in the samples) in exposed zebrafish are shown in Figure 2b. No significant differences were found for all tested QDs concentrations (alone and combined). However, a general trend to increase of SOD was observed in accordance with the tested QDs concentrations (Figure 2b). The highest average SOD as percentage of inhibition (18.59 ± 5.02, % inhibition/ mg total protein) was found in fish exposed to 1000 µg/L CdS (QDs) (18.89 ± 3.55 % inhibition), whereas the lowest average levels (8.13 ± 3.40, % inhibition/ mg total protein) were measured in fish exposed to 10 µg QDs/L, combined.
With respect to GST activity (Figure 2c), no significant differences were found for all treatments in comparison to the controls. The highest GST average activities (43.10 ± 13.0 nmol/min/mg total protein) were measured in fish exposed to 100 µg ZnS-QDs/L and the lowest GST average activities (14.71 ± 2.91 nmol/min/mg total protein) were found in fish exposed to 1000 µg QDs/L combined. Additionally, it was registered a trend to increase in GST activities in fish exposed to both 10 and 100 µg/L QDs (ZnS and CdS) alone, followed by a trend to decrease in fish exposed to the highest concentration (1000 µg QDs/L) as shown in Figure 2c.
The results of lipid peroxidation analysis (MDA content) are presented in Figure 2d, showing the highest MDA average levels (17.11 ± 1.96 nmol/ mg of total protein) in fish exposed to 10 µg CdS-QDs/L, whereas the lowest average levels (6.90 ± 2.39 nmol /mg total protein) were detected in fish exposed to 10 µg QDs/L (combined). A significant increase was found in fish exposed to 10 µg CdS-QDs/L (p < 0.05) and in fish exposed to 1000 µg CdS-QDs/L (p < 0.05), in comparison to the respective controls (Figure 2d).
The results from HSP70 and total ubiquitin are presented in Figure 3. The HSP70 results show that the highest average levels of HSP70 (0.049 ± 0.025 μg/mg total protein) were determined in fish exposed to 100 µg/L ZnS (QDs). While the lowest average levels (0.0042 ± 0.0019 μg/mg total protein) were measured in fish exposed to 1000 µg ZnS-QDs/L.
The statistical analysis revealed a significant increase (p < 0.05) in HSP70 production which was measured in fish exposed to 100 µg ZnS-QDs/L (Figure 3a), whereas a significant decrease (p < 0.05) was found in the fish exposed to 1000 µg ZnS-QDs/L. With respect to total ubiquitin, the highest average levels (11.16 ± 5.08 ng/mg total protein) were detected in fish exposed to 100 µg ZnS-QDs/L, whereas the lowest average levels (6.05 ± 1.64 ng/mg total protein) were measured in fish exposed to 1000 µg QDs/L (combined). Additionally, the statistics revealed a significant increase (p < 0.05) in total ubiquitin in fish exposed to 100 µg QDs/L, while no significant differences (p > 0.05) were found for the other QDs tested concentrations, alone and combined.
The results for the different concentrations of QDs (ZnS and CdS) tested (alone and combined) determined in the whole fish tissues are presented in Table 3.
The elemental analysis (Cd and Zn) revealed that both elements accumulated in the whole fish tissues. Cadmium was below LOD in control fish. The statistics showed a significant increase (p < 0.05) in fish exposed to 10 and 100 µg ZnS-QDs/L, whereas a significant increase (p < 0.05) was found for al tested QDs concentrations in fish exposed to CdS and in fish exposed to the QDs combined.

4. Discussion

It is well known that aquatic ecosystems are particularly vulnerable to anthropogenic activities resulting in environmental pollution [51,52,53,54,55]. Regarding the behavior, fate and the effects of QDs on aquatic ecosystems, little is known. Furthermore, the great development of nanotechnology in recent decades led to the production of numerous new nanomaterials being discharged into the environment, especially to aquatic ecosystems [16,45,56].
With respect to the QDs used in the present work, the results from electron microscopy (TEM and SEM) confirmed an average size of ~5 to 10 nm for CdS-QDs and ~8 to 12nm for ZnS-QDs. This is important because particles with this size can easily enter organisms following exposure and be distributed through organisms’ tissues and cells causing injury. In fact, other studies demonstrated this capability of QDs to enter organisms’ cells and cause damage to several organisms as mice [57,58], fish [34,59], Daphnia [60,61], mussels [62,63] or cell lines (e.g., see for a review [43]) among others species.
Nonetheless, the DLS results from the present study suggest that the QDs tended to form large aggregates in water suspensions. The tendency of ENMs (e.g., nanoparticles, quantum dots, nanotubes) to aggregate in aqueous suspensions was also reported by other authors [4,64,65]. On the other hand, the ICP-AES results from the water samples show a reduction in the actual concentrations of QDs in the water compared to the nominal concentrations, which was higher at the highest concentrations tested (a reduction of more than 90% depending on the assay). A possible explanation is that this reduction is linked to the QDs aggregation, as shown by the DLS and ICP-AES analyzes, and thus lower amounts are dispersed in the medium. This is in agreement with other studies reporting that QDs in water tend to aggregate to some extent, depending on several physical and chemical factors [60,66,67,68]. In fact, the ENMs fate and behavior in the aquatic environment are dependent on several factors (e.g., size, shape, charge, coating and chemical composition) and the presence of organic matter which will influence particle aggregation [69]. We can also hypothesize that some Cd and Zn analyzed in the samples (water and tissues) were metal ions released from the QDs. The results from the metal ion dissociation from the QDs core may explain some effects observed in fish, suggesting that there is some degree of metal ion release which is contributing to the sub-lethal effects observed for some biomarkers analyzed. In fact, previous studies showed that metal NPs ion dissociation was dependent on size decreasing with larger aggregates [11,66], which is compatible with the results from the present study.
Indeed, other authors have attributed observed toxicity to metal ions leaching from the QDs core [34,70,71,72,73]. Similar results were also reported by Benavides et al. [11] after exposing C. auratus to AlO3 and ZnO nanoparticles (NPs). It must be highlighted that surface charge plays also an important role in ENMS toxicity as it decisively influences interactions with biological systems. According to a review from Gatoo et al. [7], positively charged NPs show higher cellular internalization compared to negatively charged NPs. On the other hand, surface charge alters ENMs shape and size by forming aggregates or agglomerates [74].
Regarding the water contaminated with nominal 100 µg Zn-QDs/L, ICP-AES results showed levels of total Zn greater than expected. The determined total Zn levels were above the nominal concentration only for the Zn-QDs tested alone. This higher value must be interpreted with caution. Nonetheless, we can attribute this result to excess of aggregates as upon sample collection a few more aggregates can be collected influencing the total amount of Zn in the sample. In fact, if some aggregates are present in the water samples, then the ICP-AES measurements can overestimate the amount of the total element in the sample. Moreover, this suggests that the use of other quantitative techniques (e.g., ICP-MS, XRF) could be useful to complement the QDs analysis and provide more accuracy on results. In addition, Mourdikoudis et al. [75] stated that there are significant challenges in the analysis of ENMs due to the interdisciplinary nature of the field, the lack of suitable reference materials for the calibration of analytical tools, the difficulties associated to the sample preparation and the interpretation of the data.
In the present study, the results show that no significant mortality occurred during the exposure period. This means that none of the different QDs concentrations tested were enough to cause death in fish. The results from ICP-AES analyzes in tissues showed that fish accumulated both elements in accordance with the increasing concentrations of QDs tested even though a great reduction of the nominal concentrations was observed. However, the results from the biochemical analyses suggest that fish exposed to 10 and 100 µg QDs/L revealed more pronounced adverse effects.
SOD and CAT are the first enzymes acting sequentially by transforming ROS into H2O2 and then into H2O and O2 [11,76,77]. In general, the biochemical results showed low or moderate sub-lethal effects in exposed fish. Although there was a tendency for SOD to increase according to the concentrations of QDs tested no significant differences were found. However, CAT activities showed an overall increase in fish exposed to ZnS and CdS, suggesting that CAT is counteracting H2O2 overproduction. GST activities in exposed fish showed a similar trend to that observed for CAT, however, fish exposed to QDs combined (ZnS + CdS) showed decreasing GST activities compared to controls. For example, although there are some contradictory results, a study by Sadicck et al. [78] showed that CAT and GST activities increase after exposure of freshwater fish (Oreochromis niloticus and Tilapia zillii) to ZnNPs.
Since GST can fight oxidative stress, we can hypothesize that GST is also fighting against oxidative stress induced by exposure to QDs. In fact, living organisms have defense mechanisms to counteract the ROS overproduction, usually a set of enzymes (e.g., CAT, SOD, GPx) but also other compounds as tocopherols, carotenes, vitamin A, and ubiquinols. When the capacity of the antioxidant system is exceeded then negative effects on the organisms arise [76,77].
The MDA content in an organism is usually used as an indicator of lipid peroxidation due to oxidative stress in cells [11,79]. The results from LPO showed variable values for the different QDs concentrations tested. However, an increase was noticed in fish exposed to the different concentrations of CdS suggesting that it caused more pronounced effects in the cell’s membranes than ZnS. Interestingly, in this work when QDs were tested combined, lipid peroxidation decreased. Thus, higher QDs concentrations produced lesser toxicity than lower concentrations, which can be partially attributed to QDs aggregation. Furthermore, Gatoo et al. [7] stated that with an increase in the concentration of nanoparticles, the toxicity decreases and Lewinski et al. [27] reported that higher QDs concentrations caused less toxicity in zebrafish because after ingestion they suffer minor chemical degradation due to the absence of a stomach and no acid phase digestion in this species. Still, the higher results for antioxidant enzymes in fish exposed to 100 µg QDs/L can be explained by the action of the antioxidant system to counteract the oxidative stress caused by the exposure to QDs.
The HSP70 production in D. rerio exposed to the different QDs concentrations (tested singly or combined) showed an increase in fish exposed to 100 µg ZnS-QDs/L. These results are compatible with CAT, SOD and GST results. However, caution is advised when interpreting the results since the increase in GST and CAT activities can be associated with the unexpected elevated levels of Zn in fish exposed to nominal 100 µg ZnS-QDs/L. Similarly, high zinc levels may be related to the increase in HSP70 observed at this exposure concentration. In fact, several studies showed that Zn induces the production of HSP70 to protect cells [80,81].
Gagné et al. [82]) exposed primary cultures of rainbow trout hepatocytes to CdTe-QDs showing induction of HSP70 and suggested that the cytotoxic response was due to Cd ions release. It is known that beyond HSP70 induction during thermal stress, HSP70 acts also as a chaperone to protect cells functioning [83,84]. Thus, the rise of HSP70 detected in fish exposed to 100 µg QDs/L can be attributed to a biochemical response to protect cells. In addition, heat shock proteins were associated with membrane lipids, preserving cell membrane structure and integrity during the early stages of stress conditions, regulating membrane fluidity [85] and preventing cell death by stabilizing the lysosomal membrane [86].
Concerning total ubiquitin, the results were variable, and no significant differences were found in comparison to the respective controls. Since ubiquitin targets damaged proteins to be degraded in the proteasome preventing cytotoxicity [87], this can suggest that the antioxidant defense system is acting to protect cells.
Additionally, the high variability found in the controls for some biomarkers (e.g., SOD, ubiquitin) can be attributed to factors such as individual variability, sex, genetic heritage or other biological and environmental factors to which the animal has been subjected [88]. Nonetheless, the statistics showed no significant differences between each group of controls.
Overall, it can be stated that after zebrafish exposure to QDs the cellular system fought oxidative stress and prevented the development of marked adverse effects. The fact that QDs are functionalized with 1-dodecanethiol (C12H25SH) and aggregated in the medium also contributed to the reduced toxicity.
The current scientific literature shows apparently contradictory results. For instance, there are studies showing low or no significant toxicity: Blickley et al. [34] fed estuarine fish (Fundulus heteroclitus) with one or 10 μg of lecithin-encapsulated CdSe/ZnS QD/day and no significant changes in hepatic total glutathione, lipid peroxidation or oxidative stress was observed, Guo et al. [89] exposed zebrafish embryo to graphene QDs (12.5–200 μg/mL for up to 96h and no significant toxicity was observed at concentrations below 50 μg/mL, Galdiero et al. [90] showed that QDs functionalized with indolicidin caused low toxicity to D. magna, Lewinski et al. [27] studied the trophic transfer of amphiphilic polymer-coated CdSe/ZnS QDs by feeding fish (10 QD contaminated Daphnia) to D. rerio, but no significant adverse effects were noticed. On the other hand, several studies showed that QDs caused different degrees of toxicity in vivo and in vitro. Though, it depends on the physical and chemical properties of the QDs, capping, dose, model organisms and exposure time (e.g., for a review see [14,21,22]).
Furthermore, although some studies indicate low toxicity for short-term QDs exposure, other studies point increased toxicity when longer exposure periods are considered, as shown by Aye et al. [91], who studied the long-term in vitro toxicity effects of lipid-coated CdSe/ZnS QDs or Galeone et al. [92] that found long-term toxicity of CdSe-ZnS QDs in Drosophila melanogaster.
In general, the low or moderate sub-lethal effects found in the present study can be attributed to multiple factors as QDs aggregation, functionalized group, dose, physical and chemical characteristics of QDs and the organism’s capability to counteract oxidative stress. Nonetheless, since studies report conflicting results more studies should be conducted to a better comprehension of the QDs effects on the aquatic biota.

5. Conclusions

The short-term exposure of adult D. rerio to different QDs concentrations (ZnS and CdS), singly and combined, did not cause significant mortality in fish. In addition, the exposure to QDs caused a low to moderate stress oxidative response, as shown mainly by the CAT and LPO responses. The results suggest that ZnS and CdS tested alone caused more pronounced effects than when combined. In addition, LPO results suggest that CdS caused more damage to cell’s membrane than ZnS or when QDs were tested combined. It was observed a great reduction of QDs (measured as total Zn and Cd) concentrations in the water from the bioassays. Nonetheless, total Zn and Cd measured in whole fish tissues show bioaccumulation according to increasing concentrations. Additionally, more studies using different species, testing other types of QDs, including relevant concentrations and mixtures are required. This is essential to clarify the possible effects and mechanisms involved in the toxicity of QDs to aquatic organisms. Moreover, further studies need to be conducted to understand what happens to this type of nanomaterials in the environment. That is, what changes occur at the physical and chemical level and what are the implications in terms of toxicity.

Supplementary Materials

The following is available online at https://www.mdpi.com/1660-4601/17/1/232/s1, Table S1: Results from ICP-AES analysis for Zn and Cd in water samples following centrifugation.

Author Contributions

Conceptualization, M.S.D.; Formal analysis, M.M., A.C.S. and M.S.D.; Funding acquisition, M.S.D.; Investigation, B.M., M.M., A.C.S., D.S., I.F. and M.S.D.; Methodology, B.M., M.M., A.C.S. and M.S.D.; Supervision, M.M. and M.S.D.; Writing—original draft, B.M. and M.S.D.; Writing—review & editing, M.M. and M.S.D. All authors have read and agreed to the published version of the manuscript.

Funding

This work was supported by the Applied Molecular Biosciences Unit- UCIBIO which is financed by national funds from FCT/MCTES (UID/Multi/04378/2019) and by the Associate Laboratory for Green Chemistry- LAQV which is financed by national funds from FCT/MCTES (UID/QUI/50006/2019) and by the Marine and Environmental Sciences Centre (MARE) which is financed by national funds from FCT/MCTES (UID/MAR/04292/2019).

Conflicts of Interest

The authors declare no conflict of interest. The funders had no role in the design of the study; in the collection, analyses, or interpretation of data; in the writing of the manuscript, or in the decision to publish the results.

References

  1. Reshma, V.G.; Mohanan, P.V. Quantum dots: Applications and safety consequences. J. Lumin. 2019, 205, 287–298. [Google Scholar] [CrossRef]
  2. Mansur, H.S.; Mansur, A.A.P.; González, J.C. Synthesis and characterization of CdS quantum dots with carboxylic-functionalized poly (vinyl alcohol) for bioconjugation. Polym. Guildf. 2011, 52, 1045–1054. [Google Scholar] [CrossRef] [Green Version]
  3. Roberts, J.R.; Antonini, J.M.; Porter, D.W.; Chapman, R.S.; Scabilloni, J.F.; Young, S.H.; Schwegler-Berry, D.; Castranova, V.; Mercer, R.R. Lung toxicity and biodistribution of Cd/Se-ZnS quantum dots with different surface functional groups after pulmonary exposure in rats. Part. Fibre Toxicol. 2013, 10, 1. [Google Scholar] [CrossRef] [PubMed] [Green Version]
  4. Rana, S.; Kalaichelvan, P.T. Ecotoxicity of Nanoparticles. ISRN Toxicol. 2013, 2013, 1–11. [Google Scholar] [CrossRef] [PubMed] [Green Version]
  5. Bandala, E.R.; Berli, M. Engineered nanomaterials (ENMs) and their role at the nexus of Food, Energy, and Water. Mater. Sci. Energy Technol. 2019, 2, 29–40. [Google Scholar] [CrossRef]
  6. Farré, M.; Sanchís, J.; Barceló, D. Analysis and assessment of the occurrence, the fate and the behavior of nanomaterials in the environment. TrAC Trends Anal. Chem. 2011, 30, 517–527. [Google Scholar] [CrossRef]
  7. Gatoo, M.A.; Naseem, S.; Arfat, M.Y.; Mahmood Dar, A.; Qasim, K.; Zubair, S. Physicochemical properties of nanomaterials: Implication in associated toxic manifestations. Biomed Res. Int. 2014, 2014, 498420. [Google Scholar] [CrossRef]
  8. Gentile, A.; Ruffino, F.; Grimaldi, M.G. Complex-morphology metal-based nanostructures: Fabrication, characterization, and applications. Nanomaterials 2016, 6, 110. [Google Scholar] [CrossRef] [Green Version]
  9. Hoet, P.H.M.; Brüske-Hohlfeld, I.; Salata, O.V. Nanoparticles-Known and unknown health risks. J. Nanobiotechnol. 2004, 2, 1–15. [Google Scholar] [CrossRef] [Green Version]
  10. Picado, A.; Paixão, S.M.; Moita, L.; Silva, L.; Diniz, M.S.; Lourenço, J.; Peres, I.; Castro, L.; Correia, J.B.; Pereira, J.; et al. A multi-integrated approach on toxicity effects of engineered TiO2 nanoparticles. Front. Environ. Sci. Eng. 2015, 9, 793–803. [Google Scholar] [CrossRef] [Green Version]
  11. Benavides, M.; Fernández-Lodeiro, J.; Coelho, P.; Lodeiro, C.; Diniz, M.S. Single and combined effects of aluminum (Al2O3) and zinc (ZnO) oxide nanoparticles in a freshwater fish, Carassius auratus. Environ. Sci. Pollut. Res. 2016, 23, 24578–24591. [Google Scholar] [CrossRef] [PubMed]
  12. Nowack, B.; Bucheli, T.D. Occurrence, behavior and effects of nanoparticles in the environment. Environ. Pollut. 2007, 150, 5–22. [Google Scholar] [CrossRef] [PubMed]
  13. Maurer-Jones, M.A.; Gunsolus, I.L.; Murphy, C.J.; Haynes, C.L. Toxicity of engineered nanoparticles in the environment. Anal. Chem. 2013, 85, 3036–3049. [Google Scholar] [CrossRef] [PubMed] [Green Version]
  14. Libralato, G.; Galdiero, E.; Falanga, A.; Carotenuto, R.; De Alteriis, E.; Guida, M. Toxicity Effects of Functionalized Quantum Dots, Gold and Polystyrene Nanoparticles on Target Aquatic Biological Models: A Review. Molecules 2017, 22, 1439. [Google Scholar] [CrossRef] [Green Version]
  15. Gottschalk, F.; Sonderer, T.; Scholz, R.W.; Nowack, B. Modeled environmental concentrations of engineered nanomaterials (TiO2, ZnO, Ag, CNT, fullerenes) for different regions. Environ. Sci. Technol. 2009, 43, 9216–9222. [Google Scholar] [CrossRef]
  16. Bundschuh, M.; Filser, J.; Lüderwald, S.; McKee, M.S.; Metreveli, G.; Schaumann, G.E.; Schulz, R.; Wagner, S. Nanoparticles in the environment: where do we come from, where do we go to? Environ. Sci. Eur. 2018, 30, 1–17. [Google Scholar] [CrossRef] [Green Version]
  17. Tangaa, S.R.; Selck, H.; Winther-Nielsen, M.; Khan, F.R. Trophic transfer of metal-based nanoparticles in aquatic environments: A review and recommendations for future research focus. Environ. Sci. Nano 2016, 3, 966–981. [Google Scholar] [CrossRef] [Green Version]
  18. Maharramov, A.M.; Hasanova, U.A.; Suleymanova, I.A.; Osmanova, G.E.; Hajiyeva, N.E. The engineered nanoparticles in food chain: Potential toxicity and effects. SN Appl. Sci. 2019, 1, 1362. [Google Scholar] [CrossRef] [Green Version]
  19. Valizadeh, A.; Mikaeili, H.; Samiei, M.; Farkhani, S.M.; Zarghami, N.; Kouhi, M.; Akbarzadeh, A.; Davaran, S. Quantum dots: Synthesis, bioapplications, and toxicity. Nanoscale Res. Lett. 2012, 7, 1. [Google Scholar] [CrossRef] [Green Version]
  20. Matea, C.T.; Mocan, T.; Tabaran, F.; Pop, T.; Mosteanu, O.; Puia, C.; Iancu, C.; Mocan, L. Quantum dots in imaging, drug delivery and sensor applications. Int. J. Nanomed. 2017, 12, 5421–5431. [Google Scholar] [CrossRef] [Green Version]
  21. Hardman, R. A toxicologic review of quantum dots: Toxicity depends on physicochemical and environmental factors. Environ. Health Perspect. 2006, 114, 165–172. [Google Scholar] [CrossRef] [PubMed]
  22. Rocha, T.L.; Mestre, N.C.; Sabóia-Morais, S.M.T.; Bebianno, M.J. Environmental behaviour and ecotoxicity of quantum dots at various trophic levels: A review. Environ. Int. 2017, 98, 1–17. [Google Scholar] [CrossRef] [PubMed]
  23. Jamieson, T.; Bakhshi, R.; Petrova, D.; Pocock, R.; Imani, M.; Seifalian, A.M. Biological applications of quantum dots. Biomaterials 2007, 28, 4717–4732. [Google Scholar] [CrossRef] [PubMed]
  24. Borovaya, M.N.; Naumenko, A.P.; Matvieieva, N.A.; Blume, Y.B.; Yemets, A.I. Biosynthesis of luminescent CdS quantum dots using plant hairy root culture. Nanoscale Res. Lett. 2014, 9, 1–7. [Google Scholar] [CrossRef] [Green Version]
  25. Wang, Y.; Tang, M. Dysfunction of various organelles provokes multiple cell death after quantum dot exposure. Int. J. Nanomed. 2018, 13, 2729–2742. [Google Scholar] [CrossRef] [Green Version]
  26. Wu, Y.; Li, X.; Steel, D.; Gammon, D.; Sham, L.J. Coherent optical control of semiconductor quantum dots for quantum information processing. Phys. E Low-Dimens. Syst. Nanostruct. 2004, 25, 242–248. [Google Scholar] [CrossRef]
  27. Lewinski, N.A.; Zhu, H.; Ouyang, C.R.; Conner, G.P.; Wagner, D.S.; Colvin, V.L.; Drezek, R.A. Trophic transfer of amphiphilic polymer coated CdSe/ZnS quantum dots to Danio rerio. Nanoscale 2011, 3, 3080–3083. [Google Scholar] [CrossRef]
  28. Pelley, J.L.; Daar, A.S.; Saner, M.A. State of academic knowledge on toxicity and biological fate of quantum dots. Toxicol. Sci. 2009, 112, 276–296. [Google Scholar] [CrossRef] [Green Version]
  29. Chang, E.; Thekkek, N.; Yu, W.W.; Colvin, V.L.; Drezek, R. Evaluation of quantum dot cytotoxicity based on intracellular uptake. Small 2006, 2, 1412–1417. [Google Scholar] [CrossRef]
  30. King-Heiden, T.C.; Wiecinski, P.N.; Mangham, A.N.; Metz, K.M.; Nesbit, D.; Pedersen, J.A.; Hamers, R.J.; Heideman, W.; Peterson, R.E. Quantum dot nanotoxicity assessment using the zebrafish embryo. Environ. Sci. Technol. 2009, 43, 1605–1611. [Google Scholar] [CrossRef] [Green Version]
  31. Yong, K.T.; Law, W.C.; Hu, R.; Ye, L.; Liu, L.; Swihart, M.T.; Prasad, P.N. Nanotoxicity assessment of quantum dots: From cellular to primate studies. Chem. Soc. Rev. 2013, 42, 1236–1250. [Google Scholar] [CrossRef] [PubMed]
  32. Liang, J.; He, Z.; Zhang, S.; Huang, S.; Ai, X.; Yang, H.; Han, H. Study on DNA damage induced by CdSe quantum dots using nucleic acid molecular “light switches” as probe. Talanta 2007, 71, 1675–1678. [Google Scholar] [CrossRef] [PubMed]
  33. Kirchner, C.; Liedl, T.; Kudera, S.; Pellegrino, T.; Javier, A.M.; Gaub, H.E.; Stölzle, S.; Fertig, N.; Parak, W.J. Cytotoxicity of colloidal CdSe and CdSe/ZnS nanoparticles. Nano Lett. 2005, 5, 331–338. [Google Scholar] [CrossRef] [PubMed]
  34. Blickley, T.M.; Matson, C.W.; Vreeland, W.N.; Rittschof, D.; Di Giulio, R.T.; McClellan-Green, P.D. Dietary CdSe/ZnS quantum dot exposure in estuarine fish: Bioavailability, oxidative stress responses, reproduction, and maternal transfer. Aquat. Toxicol. 2014, 148, 27–39. [Google Scholar] [CrossRef] [PubMed]
  35. Hill, A.J.; Teraoka, H.; Heideman, W.; Peterson, R.E. Zebrafish as a model vertebrate for investigating chemical toxicity. Toxicol. Sci. 2005, 86, 6–19. [Google Scholar] [CrossRef] [PubMed] [Green Version]
  36. Dai, Y.J.; Jia, Y.F.; Chen, N.; Bian, W.P.; Li, Q.K.; Ma, Y.B.; Chen, Y.L.; Pei, D.S. Zebrafish as a model system to study toxicology. Environ. Toxicol. Chem. 2014, 33, 11–17. [Google Scholar] [CrossRef]
  37. Bambino, K.; Chu, J. Zebrafish in Toxicology and Environmental Health, 1st ed.; Elsevier Inc.: Amsterdam, The Netherlands, 2017; Volume 124. [Google Scholar]
  38. Diniz, M.S.; de Matos, A.P.A.; Lourenço, J.; Castro, L.; Peres, I.; Mendonça, E.; Picado, A. Liver alterations in two freshwater fish species (Carassius auratus and Danio rerio) following exposure to different TiO₂ nanoparticle concentrations. Microsc. Microanal. 2013, 19, 1131–1140. [Google Scholar] [CrossRef]
  39. Manke, A.; Wang, L.; Rojanasakul, Y. Mechanisms of nanoparticle-induced oxidative stress and toxicity. Biomed Res. Int. 2013, 2013, 942916. [Google Scholar] [CrossRef] [Green Version]
  40. Sayes, C.M. The relationships among structure, activity, and toxicity of engineered nanoparticles. KONA Powder Part. J. 2014, 31, 10–21. [Google Scholar] [CrossRef]
  41. Fu, P.P.; Xia, Q.; Hwang, H.M.; Ray, P.C.; Yu, H. Mechanisms of nanotoxicity: Generation of reactive oxygen species. J. Food Drug Anal. 2014, 22, 64–75. [Google Scholar] [CrossRef] [Green Version]
  42. Liu, F.; Ye, W.; Wang, J.; Song, F.; Cheng, Y.; Zhang, B. Parallel comparative studies on toxicity of quantum dots synthesized and surface engineered with different methods in vitro and in vivo. Int. J. Nanomed. 2017, 12, 5135–5148. [Google Scholar] [CrossRef] [PubMed] [Green Version]
  43. Wang, Y.; Tang, M. Review of in vitro toxicological research of quantum dot and potentially involved mechanisms. Sci. Total Environ. 2018, 625, 940–962. [Google Scholar] [CrossRef] [PubMed]
  44. Sousa, D.M.; Alves, L.C.; Marques, A.; Gaspar, G.; Lima, J.C.; Ferreira, I. Facile Microwave-assisted Synthesis Manganese Doped Zinc Sulfide Nanoparticles. Sci. Rep. 2018, 8, 1–7. [Google Scholar] [CrossRef] [PubMed]
  45. Gottschalk, F.; Ort, C.; Scholz, R.W.; Nowack, B. Engineered nanomaterials in rivers-Exposure scenarios for Switzerland at high spatial and temporal resolution. Environ. Pollut. 2011, 159, 3439–3445. [Google Scholar] [CrossRef] [PubMed]
  46. Johansson, L.H.; Hakan Borg, L.A. A spectrophotometric method for determination of catalase activity in small tissue samples. Anal. Biochem. 1988, 174, 331–336. [Google Scholar] [CrossRef]
  47. Sun, Y.I.; Oberley, L.W.; Li, Y. A simple method for clinical assay of superoxide dismutase. Clin. Chem. 1988, 34, 497–500. [Google Scholar] [PubMed]
  48. Keen, J.H.; Habig, W.H.; Jakoby, W.B. Mechanism for the several activities of the glutathione S transferases. J. Biol. Chem. 1976, 251, 6183–6188. [Google Scholar]
  49. Uchiyama, M.; Mihara, M. Determination of malonaldehyde precursor in tissues by thiobarbituric acid test. Anal. Biochem. 1978, 86, 271–278. [Google Scholar] [CrossRef]
  50. Madeira, D.; Costa, P.M.; Vinagre, C.; Diniz, M.S. When warming hits harder: survival, cellular stress and thermal limits of Sparus aurata larvae under global change. Mar. Biol. 2016, 163, 91. [Google Scholar] [CrossRef]
  51. Islam, M.S.; Tanaka, M. Impacts of pollution on coastal and marine ecosystems including coastal and marine fisheries and approach for management: A review and synthesis. Mar. Pollut. Bull. 2004, 48, 624–649. [Google Scholar] [CrossRef]
  52. Hook, S.E.; Gallagher, E.P.; Batley, G.E. The role of biomarkers in the assessment of aquatic ecosystem health. Integr. Environ. Assess. Manag. 2014, 10, 327–341. [Google Scholar] [CrossRef] [PubMed] [Green Version]
  53. Reish, D.J.; Oshida, P.S.; Mearns, A.J.; Ginn, T.C.; Buchman, M. Effects of Pollution on Marine Organisms. Water Environ. Res. 1999, 71, 1100–1115. [Google Scholar] [CrossRef]
  54. Žukiene, R.; Snitka, V. Zinc oxide nanoparticle and bovine serum albumin interaction and nanoparticles influence on cytotoxicity in vitro. Colloids Surf. B Biointerfaces 2015, 135, 316–323. [Google Scholar] [CrossRef]
  55. Sheedy, B.R.; Lazorchak, J.M.; Grunwald, D.J.; Pickering, Q.H.; Pilli, A.; Hall, D.; Webb, R. Effects of pollution on freshwater organisms. Res. J. Water Pollut. Control Fed. 1991, 63, 619–696. [Google Scholar]
  56. Ju-Nam, Y.; Lead, J.R. Manufactured nanoparticles: An overview of their chemistry, interactions and potential environmental implications. Sci. Total Environ. 2008, 400, 396–414. [Google Scholar] [CrossRef] [PubMed]
  57. Kim, Y.R.; Park, J., II; Lee, E.J.; Park, S.H.; Seong, N.W.; Kim, J.H.; Kim, G.Y.; Meang, E.H.; Hong, J.S.; Kim, S.H.; et al. Toxicity of 100 nm zinc oxide nanoparticles: A report of 90-day repeated oral administration in Sprague Dawley rats. Int. J. Nanomed. 2014, 9, 109–126. [Google Scholar]
  58. Hong, J.; Zhang, Y.Q. Murine liver damage caused by exposure to nano-titanium dioxide. Nanotechnology 2016, 27, 112001. [Google Scholar] [CrossRef] [Green Version]
  59. Lacave, J.M.; Bilbao, E.; Gilliland, D.; Mura, F.; Dini, L.; Cajaraville, M.P.; Orbea, A. Bioaccumulation, cellular and molecular effects in adult zebrafish after exposure to cadmium sulphide nanoparticles and to ionic cadmium. Chemosphere 2020, 238, 124588. [Google Scholar] [CrossRef]
  60. Jackson, B.P.; Bugge, D.; Ranville, J.F.; Chen, C.Y. Bioavailability, toxicity, and bioaccumulation of quantum dot nanoparticles to the amphipod leptocheirus plumulosus. Environ. Sci. Technol. 2012, 46, 5550–5556. [Google Scholar] [CrossRef] [Green Version]
  61. Feswick, A.; Griffitt, R.J.; Siebein, K.; Barber, D.S. Uptake, retention and internalization of quantum dots in Daphnia is influenced by particle surface functionalization. Aquat. Toxicol. 2013, 130–131, 210–218. [Google Scholar] [CrossRef]
  62. Katsumiti, A.; Gilliland, D.; Arostegui, I.; Cajaraville, M.P. Cytotoxicity and cellular mechanisms involved in the toxicity of CdS quantum dots in hemocytes and gill cells of the mussel Mytilus galloprovincialis. Aquat. Toxicol. 2014, 153, 39–52. [Google Scholar] [CrossRef] [PubMed]
  63. Jimeno-Romero, A.; Bilbao, E.; Valsami-Jones, E.; Cajaraville, M.P.; Soto, M.; Marigómez, I. Bioaccumulation, tissue and cell distribution, biomarkers and toxicopathic effects of CdS quantum dots in mussels, Mytilus galloprovincialis. Ecotoxicol. Environ. Saf. 2019, 167, 288–300. [Google Scholar] [CrossRef] [PubMed]
  64. Jiang, J.; Oberdörster, G.; Biswas, P. Characterization of size, surface charge, and agglomeration state of nanoparticle dispersions for toxicological studies. J. Nanoparticle Res. 2009, 11, 77–89. [Google Scholar] [CrossRef]
  65. Baun, A.; Hartmann, N.B.; Grieger, K.; Kusk, K.O. Ecotoxicity of engineered nanoparticles to aquatic invertebrates: A brief review and recommendations for future toxicity testing. Ecotoxicology 2008, 17, 387–395. [Google Scholar] [CrossRef] [PubMed]
  66. Bian, S.W.; Mudunkotuwa, I.A.; Rupasinghe, T.; Grassian, V.H. Aggregation and dissolution of 4 nm ZnO nanoparticles in aqueous environments: Influence of pH, ionic strength, size, and adsorption of humic acid. Langmuir 2011, 27, 6059–6068. [Google Scholar] [CrossRef]
  67. Zhang, S.; Jiang, Y.; Chen, C.S.; Spurgin, J.; Schwehr, K.A.; Quigg, A.; Chin, W.C.; Santschi, P.H. Aggregation, dissolution, and stability of quantum dots in marine environments: Importance of extracellular polymeric substances. Environ. Sci. Technol. 2012, 46, 8764–8772. [Google Scholar] [CrossRef]
  68. Xiao, Y.; Ho, K.T.; Burgess, R.M.; Cashman, M. Aggregation, Sedimentation, Dissolution, and Bioavailability of Quantum Dots in Estuarine Systems. Environ. Sci. Technol. 2017, 51, 1357–1363. [Google Scholar] [CrossRef]
  69. Petosa, A.R.; Jaisi, D.P.; Quevedo, I.R.; Elimelech, M.; Tufenkji, N. Aggregation and deposition of engineered nanomaterials in aquatic environments: Role of physicochemical interactions. Environ. Sci. Technol. 2010, 44, 6532–6549. [Google Scholar] [CrossRef] [Green Version]
  70. Xu, M.; Deng, G.; Liu, S.; Chen, S.; Cui, D.; Yang, L.; Wang, Q. Free cadmium ions released from CdTe-based nanoparticles and their cytotoxicity on Phaeodactylum tricornutum. Metallomics 2010, 2, 469–473. [Google Scholar] [CrossRef] [Green Version]
  71. Gomes, S.A.O.; Vieira, C.S.; Almeida, D.B.; Santos-Mallet, J.R.; Menna-Barreto, R.F.S.; Cesar, C.L.; Feder, D. CdTe and CdSe quantum dots cytotoxicity: A comparative study on microorganisms. Sensors 2011, 11, 11664–11678. [Google Scholar] [CrossRef]
  72. Nagy, A.; Steinbrück, A.; Gao, J.; Doggett, N.; Hollingsworth, J.A.; Iyer, R. Comprehensive analysis of the effects of CdSe quantum dot size, surface charge, and functionalization on primary human lung cells. ACS Nano 2012, 6, 4748–4762. [Google Scholar] [CrossRef] [PubMed]
  73. Tang, Y.; Han, S.; Liu, H.; Chen, X.; Huang, L.; Li, X.; Zhang, J. The role of surface chemistry in determining invivo biodistribution and toxicity of CdSe/ZnS core-shell quantum dots. Biomaterials 2013, 34, 8741–8755. [Google Scholar] [CrossRef] [PubMed]
  74. Hoshino, A.; Fujioka, K.; Oku, T.; Suga, M.; Sasaki, Y.F.; Ohta, T.; Yasuhara, M.; Suzuki, K.; Yamamoto, K. Physicochemical properties and cellular toxicity of nanocrystal quantum dots depend on their surface modification. Nano Lett. 2004, 4, 2163–2169. [Google Scholar] [CrossRef]
  75. Mourdikoudis, S.; Pallares, R.M.; Thanh, N.T.K. Characterization techniques for nanoparticles: Comparison and complementarity upon studying nanoparticle properties. Nanoscale 2018, 10, 12871–12934. [Google Scholar] [CrossRef] [Green Version]
  76. Lesser, M.P. OXIDATIVE STRESS IN MARINE ENVIRONMENTS: Biochemistry and Physiological Ecology. Annu. Rev. Physiol. 2006, 68, 253–278. [Google Scholar] [CrossRef] [Green Version]
  77. Cook, C.; Petrucelli, L. Oxidative stress. Park. Dis. Second Ed. 2012, 559–582. [Google Scholar]
  78. Saddick, S.; Afifi, M.; Abu Zinada, O.A. Effect of Zinc nanoparticles on oxidative stress-related genes and antioxidant enzymes activity in the brain of Oreochromis niloticus and Tilapia zillii. Saudi J. Biol. Sci. 2017, 24, 1672–1678. [Google Scholar] [CrossRef]
  79. Del Rio, D.; Stewart, A.J.; Pellegrini, N. A review of recent studies on malondialdehyde as toxic molecule and biological marker of oxidative stress. Nutr. Metab. Cardiovasc. Dis. 2005, 15, 316–328. [Google Scholar] [CrossRef]
  80. Putics, Á.; Vödrös, D.; Malavolta, M.; Mocchegiani, E.; Csermely, P.; Soti, C. Zinc supplementation boosts the stress response in the elderly: Hsp70 status is linked to zinc availability in peripheral lymphocytes. Exp. Gerontol. 2008, 43, 452–461. [Google Scholar] [CrossRef] [Green Version]
  81. Park, K.H.; Cozier, F.; Ong, O.C.; Caprioli, J. Induction of heat shock protein 72 protects retinal ganglion cells in a rat glaucoma model. Investig. Ophthalmol. Vis. Sci. 2001, 42, 1522–1530. [Google Scholar]
  82. Gagné, F.; Maysinger, D.; André, C.; Blaise, C. Cytotoxicity of aged cadmium-telluride quantum dots to rainbow trout hepatocytes. Nanotoxicology 2008, 2, 113–120. [Google Scholar] [CrossRef]
  83. Kalmar, B.; Greensmith, L. Induction of heat shock proteins for protection against oxidative stress. Adv. Drug Deliv. Rev. 2009, 61, 310–318. [Google Scholar] [CrossRef] [PubMed]
  84. Madeira, C.; Mendonça, V.; Flores, A.A.V.; Diniz, M.S.; Vinagre, C. High thermal tolerance does not protect from chronic warming-A multiple end-point approach using a tropical gastropod, Stramonita haemastoma. Ecol. Indic. 2018, 91, 626–635. [Google Scholar] [CrossRef]
  85. Li, P.; Wang, J.; Zou, Y.; Sun, Z.; Zhang, M.; Geng, Z.; Xu, W.; Wang, D. Interaction of Hsp90AA1 with phospholipids stabilizes membranes under stress conditions. Biochim. Biophys. Acta Biomembr. 2019, 1861, 457–465. [Google Scholar] [CrossRef]
  86. McCallister, C.; Kdeiss, B.; Nikolaidis, N. Biochemical characterization of the interaction between HspA1A and phospholipids. Cell Stress Chaperones 2016, 21, 41–53. [Google Scholar] [CrossRef] [Green Version]
  87. Tang, C.H.; Leu, M.Y.; Shao, K.; Hwang, L.Y.; Chang, W.B. Short-term effects of thermal stress on the responses of branchial protein quality control and osmoregulation in a reef-associated fish, Chromis viridis. Zool. Stud. 2014, 53, 1–9. [Google Scholar] [CrossRef] [Green Version]
  88. Gagnon, M.M.; Hodson, P.V. Field studies using fish biomarkers-How many fish are enough? Mar. Pollut. Bull. 2012, 64, 2871–2876. [Google Scholar] [CrossRef]
  89. Wang, Z.G.; Zhou, R.; Jiang, D.; Song, J.E.; Xu, Q.; Si, J.; Chen, Y.P.; Zhou, X.; Gan, L.; Li, J.Z.; et al. Toxicity of graphene quantum dots in zebrafish embryo. Biomed. Environ. Sci. 2015, 28, 341–351. [Google Scholar]
  90. Galdiero, E.; Siciliano, A.; Maselli, V.; Gesuele, R.; Guida, M.; Fulgione, D.; Galdiero, S.; Lombardi, L.; Falanga, A. An integrated study on antimicrobial activity and ecotoxicity of quantum dots and quantum dots coated with the antimicrobial peptide indolicidin. Int. J. Nanomed. 2016, 11, 4199–4211. [Google Scholar] [CrossRef] [Green Version]
  91. Aye, M.; Di Giorgio, C.; Berque-Bestel, I.; Aime, A.; Pichon, B.P.; Jammes, Y.; Barthélémy, P.; De Méo, M. Genotoxic and mutagenic effects of lipid-coated CdSe/ZnS quantum dots. Mutat. Res. Genet. Toxicol. Environ. Mutagen. 2013, 750, 129–138. [Google Scholar] [CrossRef]
  92. Galeone, A.; Vecchio, G.; Malvindi, M.A.; Brunetti, V.; Cingolani, R.; Pompa, P.P. In vivo assessment of CdSe-ZnS quantum dots: Coating dependent bioaccumulation and genotoxicity. Nanoscale 2012, 4, 6401–6407. [Google Scholar] [CrossRef] [PubMed]
Figure 1. Representative TEM images of QDs: (a) ZnS and (b) CdS.
Ijerph 17 00232 g001
Figure 2. Antioxidant enzymes activities (mean ± SD): (a) CAT, (b) SOD (c) GST; and (d) Lipid peroxidation (MDA content) in zebrafish exposed to different concentrations of QDs, alone and combined (Mix). Asterisk means significant differences (p < 0.05) in comparison to the respective controls.
Ijerph 17 00232 g002
Figure 3. (a) HSP70 and (b) total ubiquitin (mean ± SD) in zebrafish exposed to different concentrations of QDs, alone and combined (Mix). Asterisk means significant differences (p < 0.05) from the respective controls.
Ijerph 17 00232 g003
Table 1. Results from DLS analysis (mean ± sd), potential zeta and electrophoretic mobility in water samples.
Quantum DotMean Size ± sdPotential ZetaElectrophoretic Mobility
Mean (cm2/V)
ZnS 10289 ± 18 nm (PDI 1.027)−26.8 mV−0.000208
ZnS 100511 ± 163 nm (PDI 0.938)−15.5 mV−0.000120
ZnS 10001062 ± 363 nm (PDI 0.804)−60.8 mV−0.000316
CdS10566 ± 61 nm (PDI 1.268)−40.8 mV−0.000316
CdS100416 ± 55 nm (PDI 1.784)−24.2 mV−0.000188
CdS 10004671 ± 825 nm (PDI 0.557)−76.7 mV−0.000397
ZnS + CdS 10658 ± 310 nm (PDI 1.145)−24.5 mV−0.000191
ZnS + CdS 100770 ± 108 nm (PDI 0.467)−22.8 mV−0.000770
ZnS + CdS 1000596 ± 119 nm (PDI 0.013)−42.9 mV−0.000222
PDI: polydispersity index.
Table 2. Results from ICP-AES analysis of Zn and Cd in water samples.
Element Analysed (μg/L)
AssayZnCd
Control 2.88 ± 0.14<LOQ
10 µg ZnS/L5.93 ± 0.36-
100 µg ZnS/L123.96 ± 12.39-
1000 µg ZnS/L43.02 ± 4.15-
10 µg CdS/L-7.05 ± 0.57
100 µg CdS/L-50.22 ± 9.87
1000 µg CdS/L-71.31 ± 15.22
10 µg (ZnS + CdS)/L4.17 ± 0.319.24 ± 1.46
100 µg (ZnS + CdS)/L31.45 ± 3.2040.04 ± 6.11
1000 µg (ZnS + CdS)/L50.69 ± 8.5474.85 ± 11.30
Significant differences from controls if (*). LOD: Cd (0.6 μg/L); Zn (0.3 μg/L). LOQ: Cd (2.0 μg/L); Zn (1.0 μg/L). n = 3.
Table 3. Results from ICP-AES analysis of Zn and Cd in whole fish tissues exposed to the different concentrations of QDs (singly and combined).
Element Analysed (g/Kg Dry Weight)
AssayZnCd
Control (ZnS)55.98 ± 9.42-
10 µg ZnS/L76.0 ± 22.31-
100 µg ZnS/L105.81 ± 26.63 *-
1000 µg ZnS/L106.58 ± 13.14 *-
Control (CdS)-<LOD
10 µg CdS/L-0.05 ± 0.02 *
100 µg CdS/L-0.86 ± 0.52 *
1000 µg CdS/L-3.14 ± 1.45 *
Control (ZnS + CdS)293.0 ± 8.14<LOD
10 µg (ZnS + CdS)/L311.32 ± 15.410.14 ± 0.02 *
100 µg (ZnS + CdS)/L292.41 ± 33.681.62 ± 0.77 *
1000 µg (ZnS + CdS)/L289.32 ± 19.915.28 ± 2.72 *
Significant differences from controls if (*). LOD: Cd (0.6 μg/L); Zn (0.3 μg/L). LOQ: Cd (2.0 μg/L); Zn (1.0 μg/L). n = 4.

