Development of Dietary Knowledge and Adherence Questionnaires for Lebanese Adolescents and Their Parents


Abstract
1. Introduction
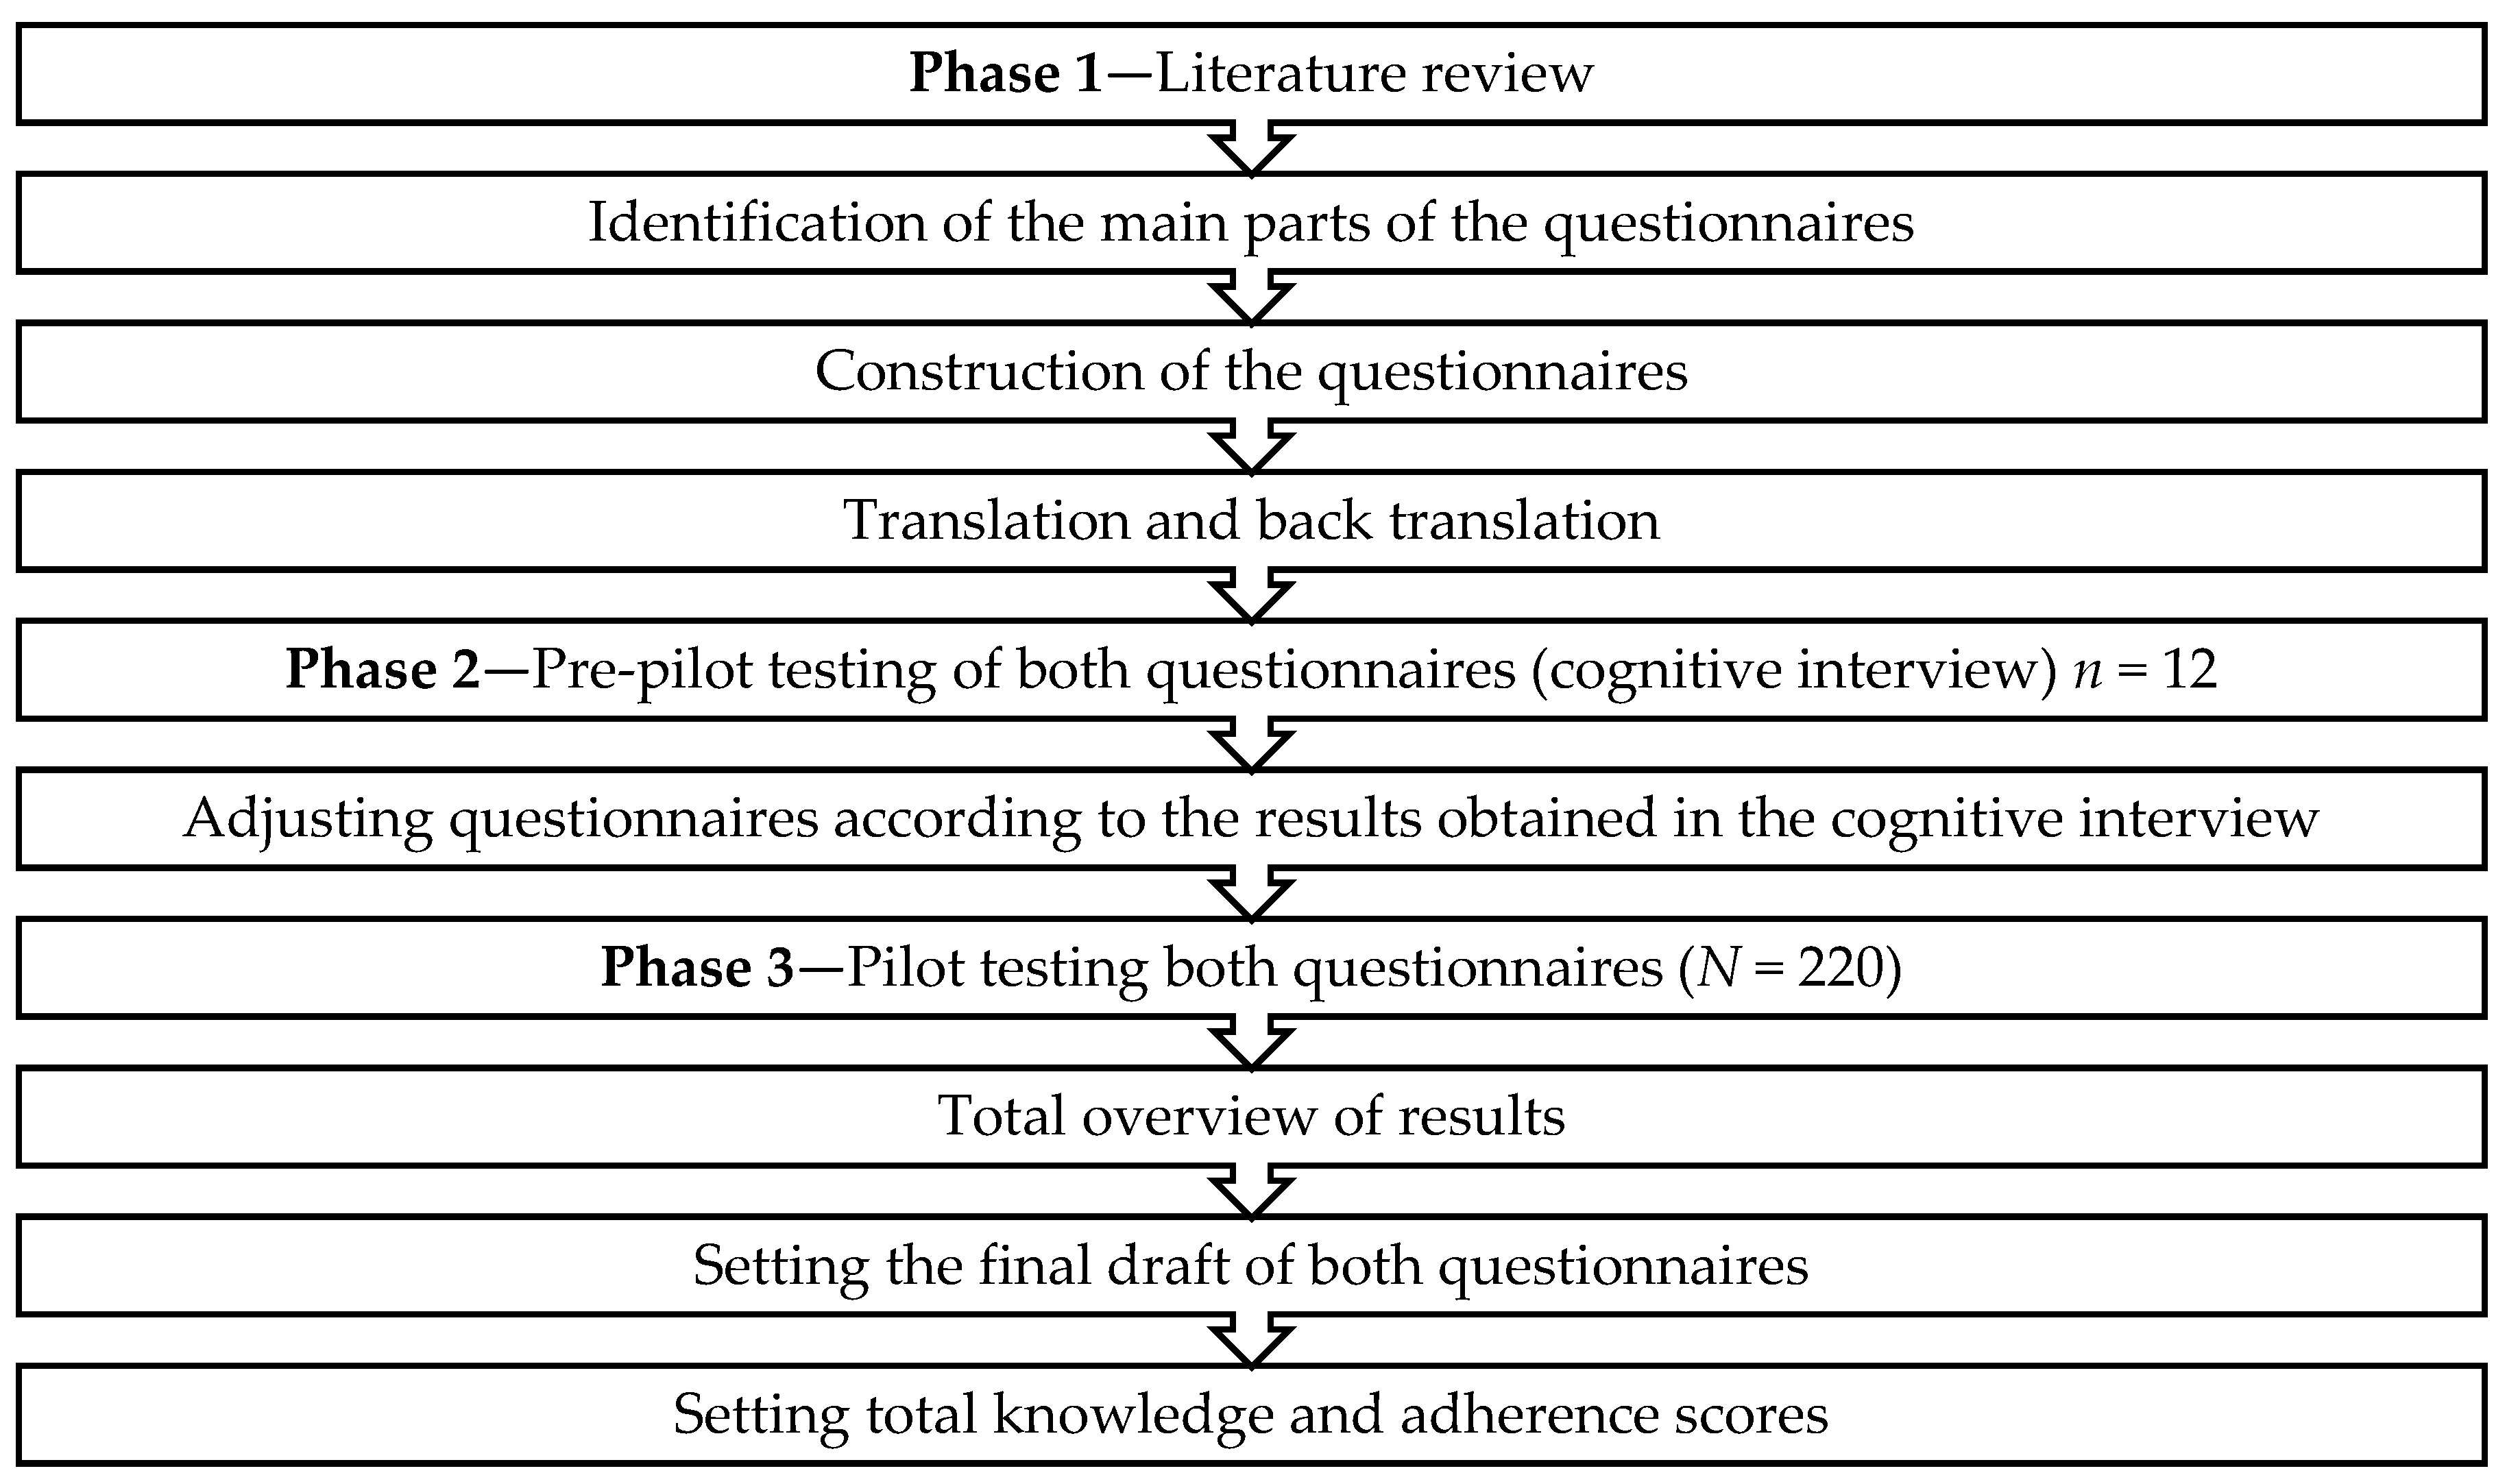
2. Materials and Methods
2.1. Phase 1—Literature Review
2.1.1. Dietary Knowledge Questionnaire
2.1.2. Dietary Adherence Questionnaire
2.2. Phase 2—Cognitive Interview
2.3. Phase 3—Pilot Testing the Questionnaires
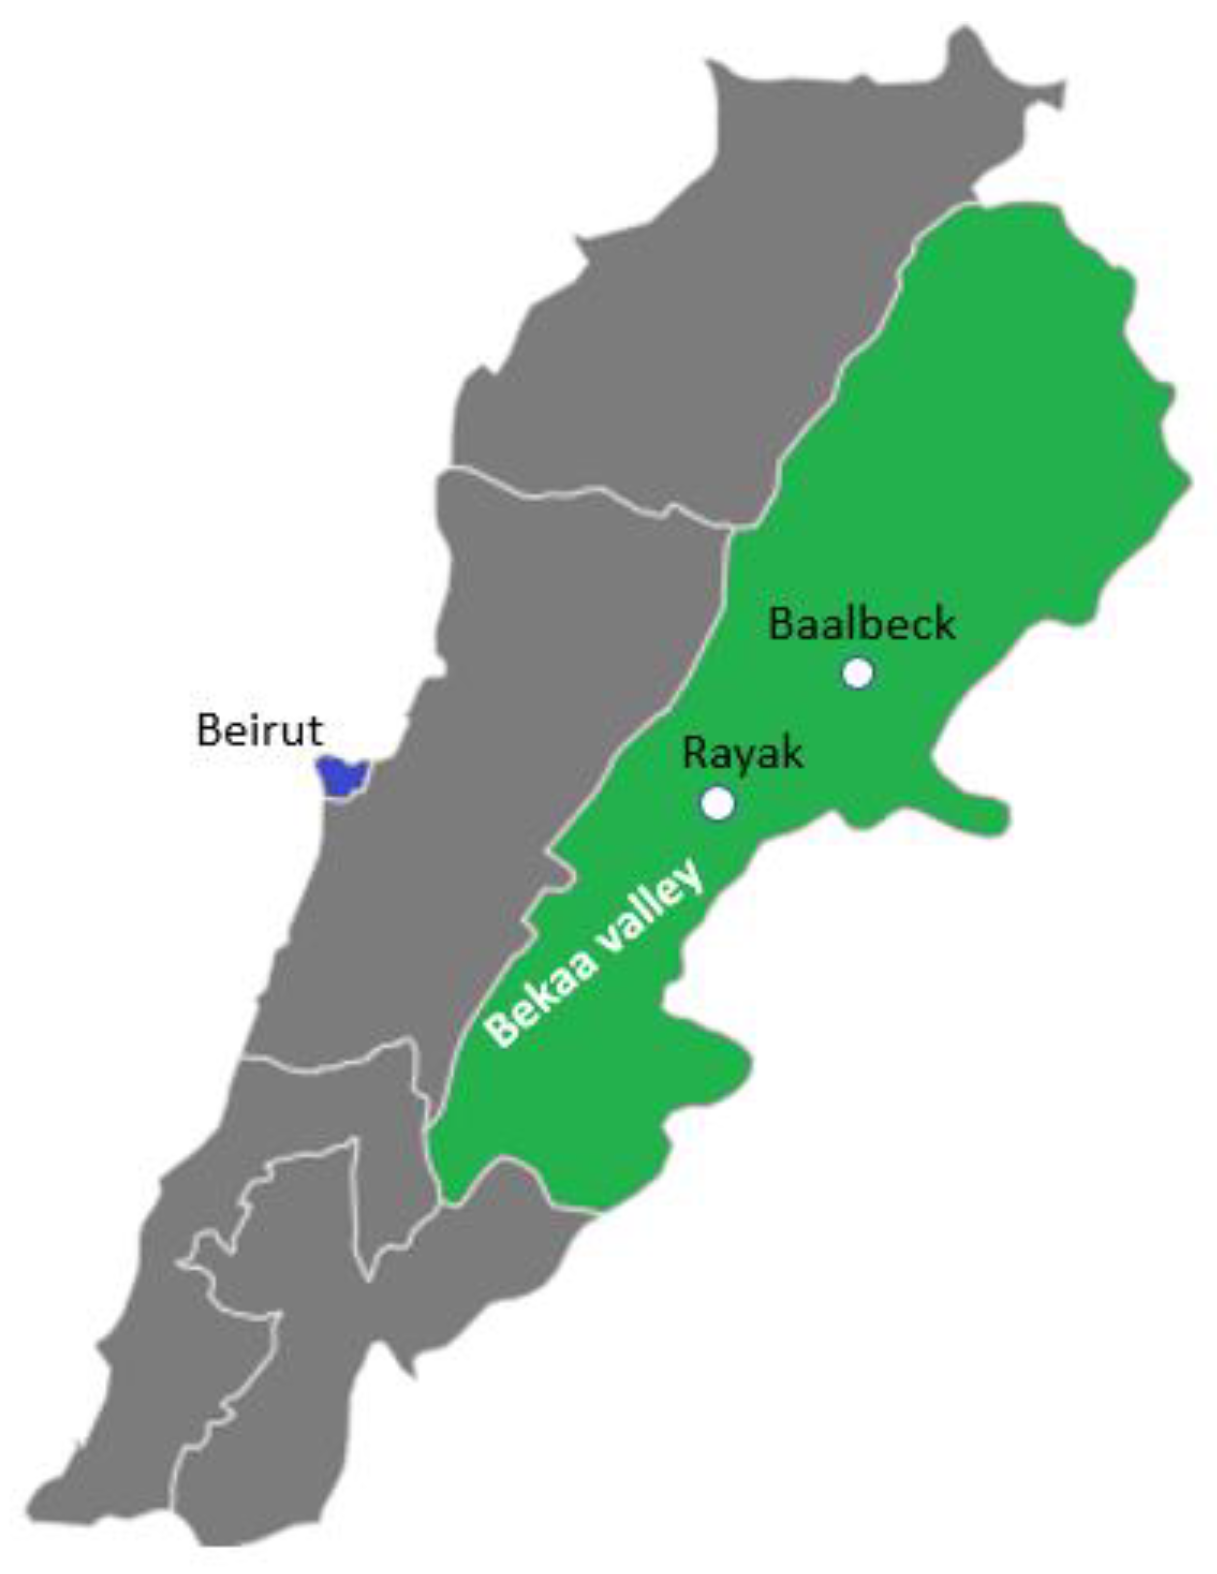
2.3.1. Inclusion Criteria and Sampling Method
- α = 0.05; Zα = 1.96; β = 0.2; Zβ = 0.842
- r = 0.3 (according to Asaad et al. [36], the obtained correlation between fruits and vegetable servings, high sugar foods and high fiber foods obtained from the perceived dietary adherence questionnaire and the 24 h recalls were 0.30, 0.40 and 0.46, respectively. Other correlations were not considered, as they were irrelevant in our case, e.g., low glycemic index foods)
- C = 0.5 × ln [(1 + r)/(1 − r)]
2.3.2. Questionnaire Administration and Data Collection
2.4. Statistical Analyses
3. Results
3.1. Cognitive Interview
3.2. Demographic Characteristics
3.3. Feasibility
3.4. Internal Reliability
3.5. Dietary Knowledge and Adherence Scores
3.6. Correlations between Scores
4. Discussion
4.1. Feasibility
4.2. Internal Reliability
4.3. Dietary Knowledge and Adherence Scores
4.4. Correlations Between Scores
4.5. Strengths and Limitations
4.6. Implications for Research
4.7. Implications for Practice
5. Conclusions
Supplementary Materials
Author Contributions
Funding
Acknowledgments
Conflicts of Interest
Appendix A

| Parts | Subject | Purpose | Number of Items/maximum Points a |
|---|---|---|---|
| 1 | Knowledge of dietary recommendations | To determine whether participants are familiar with the current dietary recommendations | 6 |
| 2 | Knowledge of nutrient sources | To determine whether participants know if the indicated food items are good or bad sources of the nutrient in question | 37 |
| 3 | Knowledge of common misconceptions in nutrition | To determine whether participants are aware of some misconceptions related to nutrition | 4 |
| 4 | Using knowledge in nutrition to make dietary choices | To determine whether participants are able to choose the healthiest option when given different food choices | 4 |
| 5 | Knowledge of associations between nutrition and diseases | To determine whether participants are aware about the correlation between eating habits/smoking and health | 5 |
| Total | 56 |
Appendix B
| Parts | Subject | Number of Items |
|---|---|---|
| 1 | Food choices | 21 |
| 2 | Eating habits | 4 |
| 3 | PA and screen-viewing time | 4 |
| 4 | Smoking | 1 |
| Questions | Options | Points |
|---|---|---|
| 1–21 | No, I did not eat any of the foods listed above | 0 |
| Yes, I ate it once | 1 | |
| Yes, I ate it twice | 2 | |
| Yes, I ate it three times or more | 3 | |
| 22 | Yes | 2 |
| No | 0 | |
| 23 and 25 | No, I did not have any meal | 0 |
| Yes, I had one meal | 1 | |
| Yes, I had two meals | 2 | |
| Yes, I had 3 meals | 3 | |
| 26 and 27 | Yes | 1 |
| No | 0 | |
| 28 | 0 h | 0 |
| 1 h | 1 | |
| 2–4 h | 2 | |
| ≥5 h | 3 | |
| 30 | Yes | 2 |
| No/stopped smoking | 1 |
| Items | Questions | Maximum Points |
|---|---|---|
| Healthy Items | 1—Yesterday, did you eat meat (like chopped meat in stews), chicken breast (grilled/boiled/not fried), or fish (grilled/boiled/not fried)? 4—Yesterday, did you eat any of these foods? Labneh, shanklish, kareesha 5—Yesterday, did you eat any of these cheeses: Mozzarella, feta, akawi, baladiye, khadra? 8—Yesterday, did you drink skimmed milk (reduced or 0% fat) or skimmed laban? 10—Yesterday, did you eat whole bread, oat bread, brown bread, tortillas? 12—Yesterday, did you eat beans like lentils, white beans, fava beans (do not count green beans)? 13—Yesterday, did you eat any vegetables (do not count potatoes)? 14—Yesterday, did you eat fresh fruits? Do not count fruit juice and dried fruits. 22—Yesterday, did you have breakfast? 23—Yesterday, how many meals did you eat (meals include breakfast, lunch and dinner)? 26—Do you practice physical activity regularly? 27—How many hours per week do you exercise? | 33 |
| Unhealthy Items | 2—Yesterday, did you eat fried chicken, chicken nuggets, fried fish, fried meat, hot dogs, sausage, mortadella, or ham? 3—Yesterday, did you eat chocolate cream or potato chips? 6—Yesterday, did you eat any of these foods: Cheddar cheese, gruyere, edam, goat cheese, gouda, parmesan, Roquefort, kashkawan, cream cheese, kishk? 7—Yesterday, did you drink whole milk or whole laban? 11—Yesterday, did you eat French fries (fried potatoes)? 17—Yesterday, did you drink soft drinks (Pepsi, 7up, Miranda, Sprite, Coca Cola, Fanta …)? 19—Yesterday, did you drink energy drinks (Red Bull, AMP, …)? 20—Yesterday, did you eat any sweets such as sweet rolls, cookies, cakes, pies, brownies, cheesecake, doughnuts? 21—Yesterday, did you eat any Arabic sweets (namoura, knefeh, halewet el jibn, znood el sitt …)? 25—Yesterday, how many times did you eat food from outside of your house? (restaurants, fast food restaurants, pizza places, and cafeterias) 30—Do you smoke? (cigarettes and narjileh are included) | 32 |
- To improve reliability, by removing the question related to refined bread and commercial juices, our Cronbach’s alpha value increases.
- Some items are acceptable to eat by children, but are then less recommended to consume as adults, and vice versa. This explains the reason behind considering whole milk/laban as part of the unhealthy items for adults.
- To avoid controversy, diet soft drinks were removed from both scores for adults, as it depends on the overall health of each individual separately.
Appendix C
| Number of Answers | Percent | |
|---|---|---|
| Recommended number of fruit and vegetable servings per day | ||
| False/Do not know | 198 | 90.0 |
| Correct answers | 22 | 10.0 |
| Type of fat to cut down on | ||
| False/Do not know | 117 | 53.2 |
| Correct answers | 103 | 46.8 |
| Recommended type of dairy products | ||
| False/Do not know | 160 | 72.7 |
| Correct answers | 60 | 27.3 |
| Recommended daily water intake | ||
| False/Do not know | 105 | 47.7 |
| Correct answers | 115 | 52.3 |
| Recommended duration of daily physical activity | ||
| False/Do not know | 93 | 42.3 |
| Correct answers | 127 | 57.7 |
| Recommended intake of energy drinks per day | ||
| False/Don’t know | 102 | 46.4 |
| Correct answers | 118 | 53.6 |
| Do you think these are high or low in added sugar? | ||
| Apples | ||
| False/Do not know | 53 | 24.1 |
| Correct answers | 167 | 75.9 |
| Ice cream | ||
| False/Do not know | 47 | 21.4 |
| Correct answers | 173 | 78.6 |
| Commercial juices | ||
| False/Do not know | 12 | 5.5 |
| Correct answers | 208 | 94.5 |
| Soft drinks | ||
| False/Do not know | 26 | 11.8 |
| Correct answers | 194 | 88.2 |
| Grapes | ||
| False/Do not know | 66 | 30.0 |
| Correct answers | 154 | 70.0 |
| Do you think these foods are high or low in fat? | ||
| Pasta | ||
| False/Do not know | 83 | 37.7 |
| Correct answers | 137 | 62.3 |
| Beans | ||
| False/Do not know | 60 | 27.3 |
| Correct answers | 160 | 72.7 |
| Honey | ||
| False/Do not know | 152 | 69.1 |
| Correct answers | 68 | 30.9 |
| Nuts | ||
| False/Do not know | 88 | 40.0 |
| Correct answers | 132 | 60.0 |
| Bread | ||
| False/Do not know | 128 | 58.2 |
| Correct answers | 92 | 41.8 |
| Cheddar cheese | ||
| False/Do not know | 90 | 40.9 |
| Correct answers | 130 | 59.1 |
| Chips | ||
| False/Do not know | 60 | 27.3 |
| Correct answers | 160 | 72,7 |
| Kashkawan cheese | ||
| False/Do not know | 63 | 28.6 |
| Correct answers | 157 | 71.4 |
| Mortadella | ||
| False/Do not know | 85 | 38.6 |
| Correct answers | 135 | 61.4 |
| Do you think these are high or low in SFA? | ||
| Whole milk | ||
| False/Do not know | 103 | 46.8 |
| Correct answers | 117 | 53.2 |
| Olive oil | ||
| False/Do not know | 112 | 50.9 |
| Correct answers | 108 | 49.1 |
| Margarine | ||
| False/Do not know | 38 | 17.3 |
| Correct answers | 182 | 82.7 |
| Chocolate cream | ||
| False/Do not know | 70 | 31.8 |
| Correct answers | 150 | 68.2 |
| Do you think these are high or low in salt? | ||
| Sausage | ||
| False/Do not know | 121 | 55.0 |
| Correct answers | 99 | 45.0 |
| Meat | ||
| False/Do not know | 83 | 37.7 |
| Correct answers | 137 | 62.3 |
| Vegetables | ||
| False/Do not know | 24 | 10.9 |
| Correct answers | 196 | 89.1 |
| Potato chips | ||
| False/Do not know | 23 | 10.5 |
| Correct answers | 197 | 89.5 |
| Fries | ||
| False/Do not know | 46 | 20.9 |
| Correct answers | 174 | 79.1 |
| Do you think these are high or low in protein? | ||
| Chicken | ||
| False/Do not know | 45 | 20.5 |
| Correct answers | 175 | 79.5 |
| Cheese | ||
| False/Do not know | 128 | 58.2 |
| Correct answers | 92 | 41.8 |
| Fruits | ||
| False/Do not know | 150 | 68.2 |
| Correct answers | 70 | 31.8 |
| Beans | ||
| False/Do not know | 39 | 17.7 |
| Correct answers | 181 | 82.3 |
| Butter | ||
| False/Do not know | 77 | 35.0 |
| Correct answers | 143 | 65.0 |
| Eggs | ||
| False/Do not know | 24 | 10.9 |
| Correct answers | 196 | 89.1 |
| Do you think these are high or low in fibers? | ||
| Eggs | ||
| False/Do not know | 122 | 55.5 |
| Correct answers | 98 | 44.5 |
| Meat | ||
| False/Do not know | 132 | 60.0 |
| Correct answers | 88 | 40.0 |
| Broccoli | ||
| False/Do not know | 89 | 40.5 |
| Correct answers | 131 | 59.5 |
| Nuts | ||
| False/Do not know | 169 | 76.8 |
| Correct answers | 51 | 23.2 |
| Fish | ||
| False/Do not know | 155 | 70.5 |
| Correct answers | 65 | 29.5 |
| Beans | ||
| False/Do not know | 117 | 53.2 |
| Correct answers | 103 | 46.8 |
| Rice | ||
| False/Do not know | 153 | 69.5 |
| Correct answers | 67 | 30.5 |
| Bulgur | ||
| False/Do not know | 142 | 64.5 |
| Correct answers | 78 | 35.5 |
| True/False (T/F): Some foods contain a lot of fat, but no cholesterol | ||
| False/Do not know | 165 | 75.0 |
| Correct answers | 55 | 25.0 |
| T/F: Brown sugar is a healthy alternative to white sugar | ||
| False/Do not know | 180 | 81.8 |
| Correct answers | 40 | 18.2 |
| T/F: There is more protein in a glass of whole milk than in a glass of skimmed milk | ||
| False/Do not know | 173 | 78.6 |
| Correct answers | 47 | 21.4 |
| A type of oil which contains mostly unsaturated fatty acids is: | ||
| False/Do not know | 160 | 72.7 |
| Correct answers | 60 | 27.3 |
| Which of these breads contain the most vitamins and minerals? | ||
| False/Do not know | 133 | 60.5 |
| Correct answers | 87 | 39.5 |
| T/F: There is more Calcium in a glass of whole milk than a glass of skimmed milk | ||
| False/Do not know | 195 | 88.6 |
| Correct answers | 25 | 11.4 |
| If a person wanted to reduce the amount of fat in their diet, which would be the best choice? | ||
| False/Do not know | 99 | 45.0 |
| Correct answers | 121 | 55.0 |
| Which cheese would be the best choice as a lower fat option? | ||
| False/Do not know | 173 | 78.6 |
| Correct answers | 47 | 21.4 |
| What do you think will help prevent heart diseases? | ||
| Increasing fiber intake | ||
| False/Do not know | 96 | 43.6 |
| Correct answers | 124 | 56.4 |
| Decreasing salt intake | ||
| False/Do not know | 42 | 19.1 |
| Correct answers | 178 | 80.9 |
| Increasing saturated fatty acid intake | ||
| False/Do not know | 63 | 28.6 |
| Correct answers | 157 | 71.4 |
| Are you aware that many chronic diseases (such as diabetes, heart diseases and certain types of cancer) are related to a low intake of fruits and vegetables? | ||
| False/Do not know | 119 | 54.1 |
| Correct answers | 101 | 45.9 |
| Are you aware that smoking causes many chronic diseases (such as lung cancer and heart diseases)? | ||
| False/Do not know | 21 | 9.5 |
| Correct answers | 199 | 90.5 |
| Frequency | Percent | |
|---|---|---|
| Yesterday, did you eat meat (like chopped meat in stews), chicken breast (not fried), or fish (not fried)? * | ||
| None | 109 | 49.5 |
| Once | 95 | 43.2 |
| Twice | 11 | 5.0 |
| ≥Three times | 3 | 1.4 |
| Yesterday, did you eat fried chicken, chicken nuggets, fried fish, fried meat, hot dogs, sausage, mortadella, or ham? ** | ||
| None | 160 | 72.7 |
| Once | 51 | 23.2 |
| Twice | 4 | 1.8 |
| ≥Three times | 2 | 0.9 |
| Yesterday, did you eat chocolate cream or potato chips? ** | ||
| None | 62 | 28.2 |
| Once | 121 | 55.0 |
| Twice | 21 | 9.5 |
| ≥Three times | 14 | 6.4 |
| Yesterday, did you eat any of these foods? Labneh, shanklish, kareesha? * | ||
| None | 109 | 49.5 |
| Once | 94 | 42.7 |
| Twice | 12 | 5.5 |
| ≥Three times | 1 | 0.5 |
| Yesterday, did you eat any of these cheeses? Mozzarella, feta, akawi, baladiye, khadra? * | ||
| None | 139 | 63.2 |
| Once | 69 | 31.4 |
| Twice | 7 | 3.2 |
| ≥Three times | 2 | 0.9 |
| Yesterday, did you eat any of these foods? Cheddar cheese, gruyere, edam, goat cheese, gouda, parmesan, Roquefort, kashkawan, cream cheese, kishk ** | ||
| None | 180 | 81.8 |
| Once | 35 | 15.9 |
| Twice | 1 | 0.5 |
| ≥Three times | 2 | 0.9 |
| Yesterday, did you drink milk or laban? * | ||
| None | 144 | 65.5 |
| Once | 71 | 32.3 |
| Twice | 2 | 0.9 |
| ≥Three times | 1 | 0.5 |
| Yesterday, did you drink skimmed milk (reduced or 0% fat) or skimmed laban? * | ||
| None | 184 | 83.6 |
| Once | 31 | 14.1 |
| Twice | 2 | 0.9 |
| ≥Three times | 1 | 0.5 |
| Yesterday, did you eat white Arabic bread, kaak, franjeh bread? ** | ||
| None | 49 | 22.3 |
| Once | 119 | 54.1 |
| Twice | 38 | 17.3 |
| ≥Three times | 12 | 5.5 |
| Yesterday, did you eat whole bread, oat bread, brown bread, tortillas? * | ||
| None | 142 | 64.5 |
| Once | 59 | 26.8 |
| Twice | 9 | 4.1 |
| ≥Three times | 7 | 3.2 |
| Yesterday, did you eat French fries (fried potatoes)? ** | ||
| None | 127 | 57.7 |
| Once | 81 | 36.8 |
| Twice | 8 | 3.6 |
| ≥Three times | 2 | 0.9 |
| Yesterday, did you eat beans like lentils, white beans, fava beans (do not count green beans)? * | ||
| None | 172 | 78.2 |
| Once | 44 | 20.0 |
| Twice | 1 | 0.5 |
| ≥Three times | 1 | 0.5 |
| Yesterday, did you eat any vegetables (do not count potatoes)? * | ||
| None | 60 | 27.3 |
| Once | 131 | 59.5 |
| Twice | 19 | 8.6 |
| ≥Three times | 8 | 3.6 |
| Yesterday, did you eat fresh fruits? Do not count fruit juice and dried fruits * | ||
| None | 81 | 36.8 |
| Once | 110 | 50.0 |
| Twice | 18 | 8.2 |
| ≥Three times | 9 | 4.1 |
| Yesterday, did you drink natural fruit juice? | ||
| None | 153 | 69.5 |
| Once | 61 | 27.7 |
| Twice | 3 | 1.4 |
| ≥Three times | 1 | 0.5 |
| Yesterday, did you drink commercial fruit juice? ** | ||
| None | 150 | 68.2 |
| Once | 59 | 26.8 |
| Twice | 4 | 1.8 |
| ≥Three times | 3 | 1.4 |
| Yesterday, did you drink soft drinks (Pepsi, 7up, Miranda, Sprite, Coca Cola, Fanta …)? ** | ||
| None | 98 | 44.5 |
| Once | 85 | 38.6 |
| Twice | 26 | 11.8 |
| ≥Three times | 9 | 4.1 |
| Yesterday, did you drink diet soft drinks (Pepsi diet, 7up diet, Coca Cola diet, …)? ** | ||
| None | 207 | 94.1 |
| Once | 8 | 3.6 |
| Twice | 2 | 0.9 |
| ≥Three times | 0 | 0 |
| Yesterday, did you drink energy drinks (Red Bull, AMP, …)? ** | ||
| None | 198 | 90.0 |
| Once | 15 | 6.8 |
| Twice | 3 | 1.4 |
| ≥Three times | 1 | 0.5 |
| Yesterday, did you eat any sweets such as sweet rolls, cookies, cakes, pies, brownies, cheesecake, doughnuts? ** | ||
| None | 156 | 70.9 |
| Once | 50 | 22.7 |
| Twice | 10 | 4.5 |
| ≥Three times | 0 | 0 |
| Yesterday, did you eat any Arabic sweets (namoura, knefeh, halewet el jibn, znood el sitt …)? ** | ||
| None | 169 | 76.8 |
| Once | 47 | 21.4 |
| Twice | 2 | 0.9 |
| ≥Three times | 0 | 0 |
| Yesterday, did you have breakfast? * | ||
| No | 49 | 22.3 |
| Yes | 168 | 76.4 |
| Yesterday, how many meals did you eat (meals include breakfast, lunch, and dinner)? * | ||
| None | 1 | 0.5 |
| One meal | 36 | 16.4 |
| 2 meals | 100 | 45.5 |
| 3 meals | 81 | 36.8 |
| Yesterday, did you have a snack? A snack is a food or drink (except for water) that you eat or drink between meals. | ||
| None | 63 | 28.6 |
| 1 snack | 93 | 42.3 |
| 2 snacks | 42 | 19.1 |
| ≥3 snacks | 17 | 7.7 |
| Yesterday, how many times did you eat food from outside of your house? (restaurants, fast food restaurants, pizza places and cafeterias) ** | ||
| None | 169 | 76.8 |
| One meal | 36 | 16.4 |
| 2 meals | 10 | 4.5 |
| ≥3 meals | 3 | 1.4 |
| Do you participate in physical education sessions at school? * | ||
| No | 60 | 27.3 |
| Yes | 158 | 71.8 |
| Do you participate in any sports activity (other than physical education session at schools)? * | ||
| No | 99 | 45.0 |
| Yes | 117 | 53.2 |
| How many hours per week do you exercise? * | ||
| 0 h | 36 | 16.4 |
| 1 h | 68 | 30.9 |
| 2–4 h | 66 | 30.0 |
| ≥5 h | 48 | 21.8 |
| How many hours per day do you usually spend playing video games, watching TV, using tablets and chatting on the phone? | ||
| 0 h | 9 | 4.1 |
| 1 h | 39 | 17.7 |
| 2 h | 36 | 16.4 |
| 3 h | 31 | 14.1 |
| 4 h | 36 | 16.4 |
| 5 h | 20 | 9.1 |
| ≥6 h | 48 | 21.8 |
| Do you smoke? (cigarettes and narjileh are included) ** | ||
| No | 149 | 67.7 |
| Yes | 65 | 29.5 |
| Stopped smoking | 4 | 1.8 |
Appendix D
| Total Knowledge Score | Mean Difference (SE) |
|---|---|
| Beirut vs. Baalbeck | 3.14 * (1.14) |
| Beirut vs. Rayak | 2.82 (1.35) |
| Baalbeck vs. Rayak | −0.32 (1.16) |
| Total Adherence Score | Mean Difference (SE) |
|---|---|
| Beirut vs. Baalbeck | 0.61 * (0.25) |
| Beirut vs. Rayak | 0.40 (0.30) |
| Baalbeck vs. Rayak | −0.20 (0.26) |
Appendix E
| Number of Answers | Percent | |
|---|---|---|
| Recommended number of fruit and vegetable servings per day | ||
| False/Do not know | 98 | 90.7 |
| Correct answers | 10 | 9.3 |
| Type of fat to cut down | ||
| False/Do not know | 28 | 25.9 |
| Correct answers | 80 | 74.1 |
| Recommended type of dairy products | ||
| False/Do not know | 74 | 68.5 |
| Correct answers | 34 | 31.5 |
| Recommended daily water intake | ||
| False/Do not know | 58 | 53.7 |
| Correct answers | 50 | 46.3 |
| Recommended duration of daily physical activity | ||
| False/Do not know | 41 | 38.0 |
| Correct answers | 67 | 62.0 |
| Recommended intake of energy drinks per day | ||
| False/Do not know | 35 | 32.4 |
| Correct answers | 73 | 67.6 |
| Do you think these are high or low in added sugar? | ||
| Apples | ||
| False/Do not know | 33 | 30.6 |
| Correct answers | 75 | 69.4 |
| Ice cream | ||
| False/Do not know | 22 | 20.4 |
| Correct answers | 86 | 79.6 |
| Commercial juices | ||
| False/Do not know | 16 | 14.8 |
| Correct answers | 92 | 85.2 |
| Soft drinks | ||
| False/Do not know | 15 | 13.9 |
| Correct answers | 93 | 86.1 |
| Grapes | ||
| False/Do not know | 40 | 37.0 |
| Correct answers | 68 | 63.0 |
| Do you think these foods are high or low in fat? | ||
| Pasta | ||
| False/Do not know | 39 | 36.1 |
| Correct answers | 69 | 63.9 |
| Beans | ||
| False/Do not know | 26 | 24.1 |
| Correct answers | 82 | 75.9 |
| Honey | ||
| False/Do not know | 53 | 49.1 |
| Correct answers | 55 | 50.9 |
| Nuts | ||
| False/Do not know | 31 | 28.7 |
| Correct answers | 77 | 71.3 |
| Bread | ||
| False/Do not know | 65 | 60.2 |
| Correct answers | 43 | 39.8 |
| Cheddar cheese | ||
| False/Do not know | 24 | 22.2 |
| Correct answers | 84 | 77.8 |
| Chips | ||
| False/Do not know | 32 | 29.6 |
| Correct answers | 76 | 70.4 |
| Kashkawan cheese | ||
| False/Do not know | 22 | 20.4 |
| Correct answers | 86 | 79.6 |
| Mortadella | ||
| False/Do not know | 36 | 33.3 |
| Correct answers | 72 | 66.7 |
| Do you think these are high or low in saturated fatty acids? | ||
| Whole milk | ||
| False/Do not know | 37 | 34.9 |
| Correct answers | 69 | 65.1 |
| Olive oil | ||
| False/Do not know | 43 | 40.6 |
| Correct answers | 63 | 59.4 |
| Margarine | ||
| False/Do not know | 13 | 12.3 |
| Correct answers | 93 | 87.7 |
| Chocolate cream | ||
| False/Do not know | 27 | 25.5 |
| Correct answers | 79 | 74.5 |
| Do you think these are high or low in salt? | ||
| Sausage | ||
| False/Do not know | 39 | 36.8 |
| Correct answers | 67 | 63.2 |
| Meat | ||
| False/Do not know | 49 | 46.2 |
| Correct answers | 57 | 53.8 |
| Vegetables | ||
| False/Do not know | 15 | 14.2 |
| Correct answers | 91 | 85.8 |
| Potato chips | ||
| False/Do not know | 9 | 8.6 |
| Correct answers | 96 | 91.4 |
| Fries | ||
| False/Do not know | 25 | 23.8 |
| Correct answers | 80 | 76.2 |
| Do you think these are high or low in protein? | ||
| Chicken | ||
| False/Do not know | 25 | 23.8 |
| Correct answers | 80 | 76.2 |
| Cheese | ||
| False/Do not know | 59 | 56.2 |
| Correct answers | 46 | 43.8 |
| Fruits | ||
| False/Do not know | 56 | 53.8 |
| Correct answers | 48 | 46.2 |
| Beans | ||
| False/Do not know | 32 | 30.8 |
| Correct answers | 72 | 69.2 |
| Butter | ||
| False/Do not know | 51 | 49.0 |
| Correct answers | 53 | 51.0 |
| Eggs | ||
| False/Do not know | 12 | 11.5 |
| Correct answers | 92 | 88.5 |
| Do you think these are high or low in fiber? | ||
| Eggs | ||
| False/Do not know | 44 | 42.3 |
| Correct answers | 60 | 57.7 |
| Meat | ||
| False/Do not know | 57 | 54.8 |
| Correct answers | 47 | 45.2 |
| Broccoli | ||
| False/Do not know | 31 | 30.1 |
| Correct answers | 72 | 69.9 |
| Nuts | ||
| False/Do not know | 87 | 83.7 |
| Correct answers | 17 | 16.3 |
| Fish | ||
| False/Do not know | 60 | 57.7 |
| Correct answers | 44 | 42.3 |
| Beans | ||
| False/Do not know | 46 | 44.2 |
| Correct answers | 58 | 55.8 |
| Rice | ||
| False/Do not know | 52 | 50.0 |
| Correct answers | 52 | 50.0 |
| Bulgur | ||
| False/Do not know | 61 | 58.7 |
| Correct answers | 43 | 41.3 |
| T/F: Some foods contain a lot of fat but no cholesterol | ||
| False/Do not know | 71 | 68.3 |
| Correct answers | 33 | 31.7 |
| T/F: Brown sugar is a healthy alternative to white sugar | ||
| False/Do not know | 88 | 84.6 |
| Correct answers | 16 | 15.4 |
| T/F: There is more protein in a glass of whole milk than in a glass of skimmed milk | ||
| False/Do not know | 79 | 76.0 |
| Correct answers | 25 | 24.0 |
| A type of oil which contains mostly unsaturated fatty acids is: | ||
| False/Do not know | 62 | 59.6 |
| Correct | 42 | 40.4 |
| Which of the indicated breads contain the most vitamins and minerals | ||
| False/Do not know | 46 | 44.2 |
| Correct answers | 58 | 55.8 |
| T/F: There is more Calcium in a glass of whole milk than a glass of skimmed milk | ||
| False/Do not know | 72 | 69.2 |
| Correct answers | 32 | 30.8 |
| If a person wanted to reduce the amount of fat in their diet, which type of meat would be the best choice? | ||
| False/Do not know | 35 | 33.7 |
| Correct answers | 69 | 66.3 |
| Which cheese would be the best choice as a lower fat option? | ||
| False/Do not know | 86 | 82.7 |
| Correct answers | 18 | 17.3 |
| What do you think will help prevent heart diseases? | ||
| Increasing fiber intake | ||
| False/Do not know | 37 | 35.6 |
| Correct answers | 67 | 64.4 |
| Decreasing salt intake | ||
| False/Do not know | 25 | 24.0 |
| Correct answers | 79 | 76.0 |
| Increasing saturated fatty acid intake | ||
| False/Do not know | 33 | 31.7 |
| Correct answers | 71 | 68.3 |
| Are you aware that many chronic diseases (such as diabetes, heart diseases and certain types of cancer) are related to a low intake of fruits and vegetables? | ||
| False/Do not know | 54 | 51.9 |
| Correct answers | 50 | 48.1 |
| Are you aware that smoking causes many chronic diseases (such as lung cancer and heart diseases)? | ||
| False/Do not know | 13 | 12.5 |
| Correct answers | 91 | 87.5 |
| Number of Answers | Percent | |
|---|---|---|
| Yesterday, did you eat meat (like chopped meat in stews), chicken breast (not fried), or fish (not fried)? * | ||
| None | 44 | 44.0 |
| Once | 53 | 53.0 |
| Twice | 3 | 3.0 |
| ≥Three times | 0 | 0 |
| Yesterday, did you eat fried chicken, chicken nuggets, fried fish, fried meat, hot dogs, sausage, mortadella, or ham? ** | ||
| None | 74 | 74.0 |
| Once | 24 | 24.0 |
| Twice | 2 | 2.0 |
| ≥Three times | 0 | 0 |
| Yesterday, did you eat chocolate cream or potato chips? ** | ||
| None | 40 | 40.0 |
| Once | 51 | 51.0 |
| Twice | 8 | 8.0 |
| ≥Three times | 1 | 1.0 |
| Yesterday, did you eat any of these foods? Labneh, shanklish, kareesha? * | ||
| None | 42 | 42.0 |
| Once | 55 | 55.0 |
| Twice | 2 | 2.0 |
| ≥Three times | 1 | 1.0 |
| Yesterday, did you eat any of these cheeses? Mozzarella, feta, akawi, baladiye, khadra? * | ||
| None | 72 | 72.0 |
| Once | 26 | 26.0 |
| Twice | 2 | 2.0 |
| ≥Three times | 0 | 0 |
| Yesterday, did you eat any of these foods? Cheddar cheese, gruyere, edam, goat cheese, gouda, parmesan, Roquefort, kashkawan, cream cheese, kishk ** | ||
| None | 77 | 77.0 |
| Once | 21 | 21.0 |
| Twice | 1 | 1.0 |
| ≥Three times | 1 | 1.0 |
| Yesterday, did you drink milk or laban? ** | ||
| None | 44 | 44.0 |
| Once | 51 | 51.0 |
| Twice | 3 | 3.0 |
| ≥Three times | 2 | 2.0 |
| Yesterday, did you drink skimmed milk (reduced or 0% fat) or skimmed laban? * | ||
| None | 80 | 80.0 |
| Once | 16 | 16.0 |
| Twice | 3 | 3.0 |
| ≥Three times | 1 | 1.0 |
| Yesterday, did you eat white Arabic bread, kaak, franjeh bread? | ||
| None | 17 | 17.2 |
| Once | 53 | 53.5 |
| Twice | 23 | 23.2 |
| ≥Three times | 6 | 6.1 |
| Yesterday, did you eat whole bread, oat bread, brown bread, tortillas? * | ||
| None | 66 | 66.7 |
| Once | 23 | 23.2 |
| Twice | 7 | 7.1 |
| ≥Three times | 3 | 3.0 |
| Yesterday, did you eat French fries (fried potatoes)? ** | ||
| None | 46 | 46.0 |
| Once | 47 | 47.0 |
| Twice | 3 | 3.0 |
| ≥Three times | 4 | 4.0 |
| Yesterday, did you eat beans (do not count green beans) like lentils, white beans, fava beans? * | ||
| None | 72 | 72.0 |
| Once | 22 | 22.0 |
| Twice | 6 | 6.0 |
| ≥Three times | 0 | 0 |
| Yesterday, did you eat any vegetables (do not count potatoes)? * | ||
| None | 19 | 19.0 |
| Once | 67 | 67.0 |
| Twice | 12 | 12.0 |
| ≥Three times | 2 | 2.0 |
| Yesterday, did you eat fresh fruits? Do not count fruit juice and dried fruits? * | ||
| None | 26 | 25.7 |
| Once | 52 | 51.5 |
| Twice | 20 | 19.8 |
| ≥Three times | 3 | 3.0 |
| Yesterday, did you drink natural fruit juice? | ||
| None | 68 | 67.3 |
| Once | 29 | 28.7 |
| Twice | 4 | 4.0 |
| ≥Three times | 0 | 0 |
| Yesterday, did you drink commercial fruit juice? | ||
| None | 72 | 71.3 |
| Once | 24 | 23.8 |
| Twice | 1 | 1.0 |
| ≥Three times | 4 | 4.0 |
| Yesterday, did you drink soft drinks (Pepsi, 7up, Miranda, Sprite, Coca Cola, Fanta …)? ** | ||
| None | 55 | 54.5 |
| Once | 37 | 36.6 |
| Twice | 8 | 7.9 |
| ≥Three times | 1 | 1.0 |
| Yesterday, did you drink diet soft drinks (Pepsi diet, 7up diet, Coca Cola diet, …)? | ||
| None | 90 | 90.0 |
| Once | 7 | 7.0 |
| Twice | 2 | 2.0 |
| ≥Three times | 1 | 1.0 |
| Yesterday, did you drink energy drinks (Red Bull, AMP, …)? ** | ||
| None | 95 | 93.1 |
| Once | 4 | 3.9 |
| Twice | 2 | 2.0 |
| ≥Three times | 1 | 1.0 |
| Yesterday, did you eat any sweets such as sweet rolls, cookies, cakes, pies, brownies, cheesecake, doughnuts? ** | ||
| None | 72 | 70.6 |
| Once | 24 | 23.5 |
| Twice | 4 | 3.9 |
| ≥Three times | 2 | 2.0 |
| Yesterday, did you eat any Arabic sweets (namoura, knefeh, halewet el jibn, znood el sitt …)? ** | ||
| None | 75 | 72.8 |
| Once | 26 | 25.2 |
| Twice | 1 | 1.0 |
| ≥Three times | 1 | 1.0 |
| Yesterday, did you have breakfast? * | ||
| No | 14 | 13.9 |
| Yes | 87 | 86.1 |
| Yesterday, how many meals did you eat (meals include breakfast, lunch and dinner)? * | ||
| None | 3 | 3.0 |
| One meal | 10 | 9.9 |
| 2 meals | 28 | 27.7 |
| 3 meals | 60 | 59.4 |
| Yesterday, did you have a snack? A snack is a food or drink (except for water) that you eat or drink between meals. | ||
| None | 37 | 36.6 |
| 1 snack | 44 | 43.6 |
| 2 snacks | 15 | 14.9 |
| ≥3 snacks | 5 | 5.0 |
| Yesterday, how many times did you eat food from outside of your house? (restaurants, fast food restaurants, pizza places and cafeterias) ** | ||
| None | 87 | 87.9 |
| One meal | 11 | 11.1 |
| 2 meals | 1 | 1.0 |
| ≥3 meals | 0 | 0 |
| Do you practice physical activity on a regular basis? And for how many hours per week? * | ||
| No | 51 | 50.0 |
| Yes | 51 | 50.0 |
| 0 h | 26 | 26.0 |
| 1 h | 30 | 30.0 |
| 2–4 h | 24 | 24.0 |
| ≥5 h | 20 | 20.0 |
| How many hours per day do you usually spend playing video games, watching TV, using tablets and chatting on the phone? | ||
| 0 h | 3 | 3.0 |
| 1 h | 22 | 21.8 |
| 2 h | 25 | 24.8 |
| 3 h | 21 | 20.8 |
| 4 h | 14 | 13.9 |
| 5 h | 6 | 5.9 |
| ≥6 h | 10 | 9.9 |
| Do you smoke? (cigarettes and narjileh are included) ** | ||
| No | 60 | 60.0 |
| Yes | 35 | 35.0 |
| Stopped smoking | 5 | 5.0 |
Appendix F
| Items | Pearson Correlation |
|---|---|
| Lean meat | 0.29 *** |
| High fat meat | 0.30 *** |
| Unhealthy snacks (potato chips and chocolate cream) | 0.48 *** |
| Low fat dairy | 0.54 *** |
| Medium fat dairy | 0.30 *** |
| High fat dairy | 0.32 *** |
| Whole milk | 0.42 *** |
| Skimmed milk | 0.14 † |
| Refined bread | 0.27 *** |
| Whole bread | 0.15 * |
| French fries | 0.53 *** |
| Beans | 0.45 *** |
| Vegetables | 0.38 *** |
| Fruits | 0.49 *** |
| Natural juices | 0.52 *** |
| Commercial fruit juices | 0.45 *** |
| Soft drinks | 0.56 *** |
| Diet soft drinks | 0.13 † |
| Energy drinks | 0.51 *** |
| Sweets | 0.30 *** |
| Arabic sweets | 0.33 *** |
| Breakfast | 0.66 *** |
| Number of meals | 0.61 *** |
| Number of snacks | 0.20 ** |
| Meals eaten outside | 0.40 *** |
References
- Stewart, L. Obesity. In Clinical Paediatric Dietetics, 4th ed.; Shaw, V., Ed.; John Wiley & Sons, Ltd.: West Sussex, UK, 2015; pp. 798–808. [Google Scholar]
- Gungor, N.K. Overweight and obesity in children and adolescents. J. Clin. Res. Pediatr. Endocrinol. 2014, 6, 129–143. [Google Scholar] [CrossRef]
- Yanovski, J.A. Pediatric obesity. An introduction. Appetite 2015, 93, 3–12. [Google Scholar] [CrossRef] [PubMed]
- Finkelstein, E.A.; Graham, W.C.K.; Malhotra, R. Lifetime Direct Medical Costs of Childhood Obesity. Pediatrics 2014, 133, 854–862. [Google Scholar] [CrossRef] [PubMed]
- WHO. Obesity and Overweight. Available online: https://www.who.int/en/news-room/fact-sheets/detail/obesity-and-overweight (accessed on 13 September 2019).
- Nasreddine, L.; Naja, F.; Akl, C.; Chamieh, M.C.; Karam, S.; Sibai, A.-M.; Hwalla, N. Dietary, Lifestyle and Socio-Economic Correlates of Overweight, Obesity and Central Adiposity in Lebanese Children and Adolescents. Nutrients 2014, 6, 1038–1062. [Google Scholar] [CrossRef]
- Musaiger, A.O.; Hassan, A.S.; Obeid, O. The Paradox of Nutrition-Related Diseases in the Arab Countries: The Need for Action. Int. J. Environ. Res. Public Health 2011, 8, 3637–3671. [Google Scholar] [CrossRef]
- Kremers, S.P.J.; Visscher, T.L.S.; Seidell, J.C.; van Mechelen, W.; Brug, J. Cognitive Determinants of Energy Balance-Related Behaviours. Sports Med. 2005, 35, 923–933. [Google Scholar] [CrossRef]
- Stok, M.; Hoffmann, S.; Volkert, D.; Boeing, H.; Ensenauer, R.; Stelmach-Mardas, M.; Kiesswetter, E.; Weber, A.; Rohm, H.; Lien, N.; et al. The DONE framework: Creation, evaluation, and updating of an interdisciplinary, dynamic framework 2.0 of determinants of nutrition and eating. PLoS ONE 2017, 12, e0171077. [Google Scholar] [CrossRef]
- Bixby, H.; Bentham, J.; Zhou, B.; Di Cesare, M.; Paciorek, C.J.; Bennett, J.E.; Taddei, C.; Stevens, G.A.; Rodriguez-Martinez, A.; Carrillo-Larco, R.M.; et al. Rising rural body-mass index is the main driver of the global obesity epidemic in adults. Nature 2019, 569, 260–264. [Google Scholar] [CrossRef]
- Yadav, K.; Krishnan, A. Changing patterns of diet, physical activity and obesity among urban, rural and slum populations in north India. Obes. Rev. Off. J. Int. Assoc. Study Obes. 2008, 9, 400–408. [Google Scholar] [CrossRef]
- Gidding, S.S.; Dennison, B.A.; Birch, L.L.; Daniels, S.R.; Gilman, M.W.; Lichtenstein, A.H.; Rattay, K.T.; Steinberger, J.; Stettler, N.; Van Horn, L. Dietary Recommendations for Children and Adolescents A Guide for Practitioners: Consensus Statement From the American Heart Association. Circulation 2005, 112, 2061–2075. [Google Scholar] [CrossRef]
- Batis, C.; Aburto, T.C.; Sanchez-Pimienta, T.G.; Pedraza, L.S.; Rivera, J.A. Adherence to Dietary Recommendations for Food Group Intakes Is Low in the Mexican Population. J. Nutr. 2016, 146, 1897s–1906s. [Google Scholar] [CrossRef] [PubMed]
- Milosavljević, D.; Mandić, M.L.; Banjari, I. Nutritional knowledge and dietary habits survey in high school population. Coll. Antropol. 2015, 39, 101–107. [Google Scholar] [PubMed]
- Argolo, D.; Borges, J.; Cavalcante, A.; Silva, G.; Maia, S.; Moraes, A.; Oliveira, E.; Nascimento, M. Poor dietary intake and low nutritional knowledge in adolescent and adult competitive athletes: A warning to table tennis players. Nutr. Hosp. 2018, 35, 1124–1130. [Google Scholar] [CrossRef]
- Wardle, J.; Parmenter, K.; Waller, J. Nutrition knowledge and food intake. Appetite 2000, 34, 269–275. [Google Scholar] [CrossRef]
- Parmenter, K.; Wardle, J. Development of a general nutrition knowledge questionnaire for adults. Eur. J. Clin. Nutr. 1999, 53, 298–308. [Google Scholar] [CrossRef]
- Story, M.; Neumark-Sztainer, D.; French, S. Individual and Environmental Influences on Adolescent Eating Behaviors. J. Am. Diet. Assoc. 2002, 102, S40–S51. [Google Scholar] [CrossRef]
- Ball, G.D.C.; Mushquash, A.R.; Keaschuk, R.A.; Ambler, K.A.; Newton, A.S. Using Intervention Mapping to develop the Parents as Agents of Change (PAC©) intervention for managing pediatric obesity. BMC Res. Notes 2017, 10, 43. [Google Scholar] [CrossRef]
- Romanos-Nanclares, A.; Zazpe, I.; Santiago, S.; Marin, L.; Rico-Campa, A.; Martin-Calvo, N. Influence of Parental Healthy-Eating Attitudes and Nutritional Knowledge on Nutritional Adequacy and Diet Quality among Preschoolers: The SENDO Project. Nutrients 2018, 10. [Google Scholar] [CrossRef]
- McPherson, R.S.; Hoelscher, D.M.; Alexander, M.; Scanlon, K.S.; Serdula, M.K. Dietary Assessment Methods among School-Aged Children: Validity and Reliability. Prev. Med. 2000, 31, S11–S33. [Google Scholar] [CrossRef]
- Wilson, A.; Magarey, A.; Mastersson, N. Reliability of Questionnaires to Assess the Healthy Eating and Activity Environment of a Child’s Home and School. J. Obes. 2013, 2013, 720368. [Google Scholar] [CrossRef]
- World Health Organization. Foodborne Disease Outbreaks: Guidelines for Investigation and Control; World Health Organization: Geneva, Switzerland, 2008. [Google Scholar]
- Sapp, S.G.; Jensen, H.H. Reliability and Validity of Nutrition Knowledge and Diet-Health Awareness Tests Developed from the 1989–1991 Diet and Health Knowledge Surveys. J. Nutr. Educ. 1997, 29, 63–72. [Google Scholar] [CrossRef]
- Habib-Mourad, C.; Ghandour, L.A.; Moore, H.J.; Nabhani-Zeidan, M.; Adetayo, K.; Hwalla, N.; Summerbell, C. Promoting healthy eating and physical activity among school children: Findings from Health-E-Pals, the first pilot intervention from Lebanon. BMC Public Health 2014, 14, 940. [Google Scholar] [CrossRef] [PubMed]
- Kothari, C. Research Methodology: Methods and Techniques, 2nd ed.; New Age International: New Delhi, India, 2004. [Google Scholar]
- Guillemin, F.; Bombardier, C.; Beaton, D. Cross-cultural adaptation of health-related quality of life measures: Literature review and proposed guidelines. J. Clin. Epidemiol. 1993, 46, 1417–1432. [Google Scholar] [CrossRef]
- Quaidoo, E.Y.; Ohemeng, A.; Amankwah-Poku, M. Sources of nutrition information and level of nutrition knowledge among young adults in the Accra metropolis. BMC Public Health 2018, 18, 1323. [Google Scholar] [CrossRef] [PubMed]
- Choi, B.C.K.; Pak, A.W.P. A catalog of biases in questionnaires. Prev. Chronic Dis. 2004, 2, A13. [Google Scholar]
- Jordao, L.M.R.; Malta, D.C.; Freire, M. Clustering patterns of oral and general health-risk behaviours in Brazilian adolescents: Findings from a national survey. Community Dent. Oral Epidemiol. 2018, 46, 194–202. [Google Scholar] [CrossRef]
- Kremers, S.P.; de Bruijn, G.-J.; Visscher, T.L.; van Mechelen, W.; de Vries, N.; Brug, J. Environmental influences on energy balance-related behaviors: A dual-process view. Int. J. Behav. Nutr. Phys. Act. 2006, 3, 9. [Google Scholar] [CrossRef]
- Hinds, J.T.; Loukas, A.; Chow, S.; Pasch, K.E.; Harrell, M.B.; Perry, C.L.; Delnevo, C.; Wackowski, O.A. Using Cognitive Interviewing to Better Assess Young Adult E-cigarette Use. Nicotine Tob. Res. 2016, 18, 1998–2005. [Google Scholar] [CrossRef] [PubMed]
- Miller, K.; Willson, S.; Chepp, V.; Padilla, J.L. (Eds.) Cognitive Interviewing Methodology; John Wiley & Sons: Hoboken, NJ, USA, 2014. [Google Scholar]
- Center for Educational Research and Development. Statistical Bulletin for the Academic Year 2016–2017; Center for Educational Research and Development: Beirut, Lebanon, 2017. [Google Scholar]
- Hulley, S.B.; Cummings, S.R.; Browner, W.S.; Grady, D.; Newman, T.B. Designing Clinical Research, 4th ed.; LWW: Philadelphia, PA, USA, 2013. [Google Scholar]
- Asaad, G.; Sadegian, M.; Lau, R.; Xu, Y.; Soria-Contreras, D.C.; Bell, R.C.; Chan, C.B. The Reliability and Validity of the Perceived Dietary Adherence Questionnaire for People with Type 2 Diabetes. Nutrients 2015, 7, 5484–5496. [Google Scholar] [CrossRef]
- Portney, L.G.; Watkins, M.P. Foundations of Clinical Research: Applications to Practice; F. A. Davis Company: Philadelphia, PA, USA, 2015. [Google Scholar]
- Shepherd, J.; Harden, A.; Rees, R.; Brunton, G.; Garcia, J.; Oliver, S.; Oakley, A. Young people and healthy eating: A systematic review of research on barriers and facilitators. Health Educ. Res. 2005, 21, 239–257. [Google Scholar] [CrossRef]
- Hoelscher, D.M.; Day, R.S.; Kelder, S.H.; Ward, J.L. Reproducibility and validity of the secondary level School-Based Nutrition Monitoring student questionnaire. J. Am. Diet. Assoc. 2003, 103, 186–194. [Google Scholar] [CrossRef] [PubMed]
- Habib-Mourad, C.; Ghandour, L.A. Time to Act: Lessons Learnt from the First Pilot School-Based Intervention Study from Lebanon to Prevent and Reduce Childhood Obesity. Front. Public Health 2015, 3. [Google Scholar] [CrossRef] [PubMed]
- Itani, L.; Chatila, H.; Dimassi, H.; El Sahn, F. Development and validation of an Arabic questionnaire to assess psychosocial determinants of eating behavior among adolescents: A cross-sectional study. J. Health Popul. Nutr. 2017, 36, 10. [Google Scholar] [CrossRef] [PubMed]
- Wong, J.E.; Parnell, W.R.; Howe, A.S.; Black, K.E.; Skidmore, P.M.L. Development and validation of a food-based diet quality index for New Zealand adolescents. BMC Public Health 2013, 13, 562. [Google Scholar] [CrossRef]
- Grosso, G.; Mistretta, A.; Turconi, G.; Cena, H.; Roggi, C.; Galvano, F. Nutrition knowledge and other determinants of food intake and lifestyle habits in children and young adolescents living in a rural area of Sicily, South Italy. Public Health Nutr. 2013, 16, 1827–1836. [Google Scholar] [CrossRef]
- Kresic, G.; Kendel Jovanovic, G.; Pavicic Zezel, S.; Cvijanovic, O.; Ivezic, G. The effect of nutrition knowledge on dietary intake among Croatian university students. Coll. Antropol. 2009, 33, 1047–1056. [Google Scholar]
- Scaglioni, S.; Salvioni, M.; Galimberti, C. Influence of parental attitudes in the development of children eating behaviour. Br. J. Nutr. 2008, 99, S22–S25. [Google Scholar] [CrossRef]


| Items | Questions | Maximum Points |
|---|---|---|
| Healthy Items | 1—Yesterday, did you eat meat (like chopped meat in stews), chicken breast (grilled/boiled/not fried), or fish (grilled/boiled/not fried)? 4—Yesterday, did you eat any of these foods? Labneh, shanklish, kareesha 5—Yesterday, did you eat any of these cheeses: Mozzarella, feta, akawi, baladiye, khadra? 7—Yesterday, did you drink milk or laban? 8—Yesterday, did you drink skimmed milk (reduced or 0% fat) or skimmed laban? 10—Yesterday, did you eat whole bread, oat bread, brown bread, tortillas? 12—Yesterday, did you eat beans like lentils, white beans, fava beans (do not count green beans)? 13—Yesterday, did you eat any vegetables (do not count potatoes)? 14—Yesterday, did you eat fresh fruits? Do not count fruit juice and dried fruits. 22—Yesterday, did you have breakfast? 23—Yesterday, how many meals did you eat (meals include breakfast, lunch, and dinner)? 26—Do you participate in physical education sessions at school? 27—Do you participate in any sports activity (other than physical education session at schools)? 28—How many hours per week do you exercise? | 37 |
| Unhealthy Items | 2—Yesterday, did you eat fried chicken, chicken nuggets, fried fish, fried meat, hot dogs, sausage, mortadella, or ham? 3—Yesterday, did you eat chocolate cream or potato chips? 6—Yesterday, did you eat any of these foods: Cheddar cheese, gruyere, edam, goat cheese, gouda, parmesan, Roquefort, kashkawan, cream cheese, kishk? 9—Yesterday, did you eat white Arabic bread, kaak, franjeh bread? 11—Yesterday, did you eat French fries (fried potatoes)? 16—Yesterday, did you drink commercial fruit juice? 17—Yesterday, did you drink soft drinks (Pepsi, 7up, Miranda, Sprite, Coca Cola, Fanta …)? 18—Yesterday, did you drink diet soft drinks (Pepsi diet, 7up diet, Coca Cola diet, …)? 19—Yesterday, did you drink energy drinks (Red Bull, AMP, …)? 20—Yesterday, did you eat any sweets such as sweet rolls, cookies, cakes, pies, brownies, cheesecake, doughnuts? 21—Yesterday, did you eat any Arabic sweets (namoura, knefeh, halewet el jibn, znood el sitt …)? 25—Yesterday, how many times did you eat food from outside of your house? (restaurants, fast food restaurants, pizza places and cafeterias) 30—Do you smoke? (cigarettes and narjileh are included) | 38 |
| Feedback Categories | Comments | Adjustments |
|---|---|---|
| 1. Language Problems | DAQ: A participant asked to clarify the part “fish (not fried)”. | The question was modified to include the following words “grilled/boiled/not fried”. |
| DKQ: Many adolescents did not know what fibers and saturated fatty acids are. | No modifications made because this is related to the level of knowledge, and is an essential part of the DKQ. | |
| 2. Logical Problems | DKQ: One of the participants asked if smoking includes water pipes. | The words “cigarettes and waterpipes” were added to make it clear that both ways of smoking are included. |
| DAQ/DKQ: One of the respondents asked if the word “vegetables” in question 10 (DKQ) and question 13 (DAQ) included pickles too, or just fresh vegetables like cucumbers. | In the DKQ, participants are asked if vegetables are high or low in sodium, and the word “fresh” was added to make it clearer. In the DAQ, it was left as is because both pickles and fresh vegetables are included. The purpose of this question is not related to sodium consumption, but rather to fiber intake. |
| Adolescents (N = 220) | Parents (N = 108) | |
|---|---|---|
| Mean (SD) or n (%) | ||
| Age, mean (SD) | 16.8 (0.8) | 44.3 (6.9) |
| Gender, n (%) | ||
| Male | 90 (40.9) | 11 (19.6) |
| Female | 129 (58.6) | 45 (80.4) |
| Location, n (%) | ||
| Beirut (U) | 53 (24.1) | 7 (6.5) |
| Baalbeck (R) | 117 (53.2) | 64 (59.3) |
| Rayak (R) | 50 (22.7) | 37 (34.3) |
| Type of school, n (%) | ||
| Public | 187 (85.0) | 92 (85.2) |
| Private | 33 (15.0) | 16 (14.8) |
| Scores | Value of Cronbach’s Alpha |
|---|---|
| DKQ—Adolescents | 0.78 |
| DKQ—Parents | 0.89 |
| DAQ—Adolescents, Healthy Items | 0.61 |
| DAQ—Adolescents, Unhealthy Items | 0.61 |
| DAQ—Parents, Healthy Items | 0.46 |
| DAQ—Parents, Unhealthy Items | 0.61 |
| Adolescents | Parents | |||||||
|---|---|---|---|---|---|---|---|---|
| Mean Total DKQ Knowledge Score (SD) | p Value | Mean Total DAQ Adherence Index (SD) | p Value | Mean Total DKQ Knowledge Score (SD) | p Value | Mean Total DAQ Adherence Index (SD) | p Value | |
| Gender | ||||||||
| Boys | 30.4 (7.2) | 0.55 | 2.3 (1.8) | 0.20 | 31.0 (10.8) | 0.31 | 2.4 (1.7) | 0.91 |
| Girls | 30.9 (6.8) | 2.0 (1.1) | 33.0 (9.6) | 2.5 (2.4) | ||||
| Age/class | ||||||||
| Grade 11 | 29.8 (7.2) | 0.07 | 2.5 (1.6) | 0.06 | 33.5 (10.6) | 0.20 | 2.0 (1.3) | 0.12 |
| Grade 12 | 31.6 (6.5) | 2.0 (1.4) | 30.8 (10.2) | 2.8 (2.9) | ||||
| Type of school | ||||||||
| Public | 30.5 (7.1) | 0.20 | 2.1 (1.4) | 0.71 | 32.5 (9.9) | 0.77 | 2.4 (2.2) | 0.64 |
| Private | 32.0 (6.1) | 2.2 (2.0) | 31.7 (10.8) | 2.7 (2.5) | ||||
| Location | ||||||||
| Urban | 33.0 (6.9) | <0.01 | 2.6 (1.9) | 0.07 | 38.3 (12.1) | 0.11 | 3.8 (2.3) | 0.13 |
| Rural | 29.9 (6.8) | 2.0 (1.2) | 32.0 (9.8) | 2.4 (2.2) | ||||
| Beirut (U) | 33.0 (6.9) | 0.02 | 2.6 (1.9) | 0.06 | 38.3 (12.1) | 0.27 | 3.8 (2.3) | 0.22 |
| Baalbeck (R) | 29.9 (6.9) | 1.9 (1.0) | 31.9 (10.0) | 2.2 (2.4) | ||||
| Rayak (R) | 30.2 (6.6) | 2.2 (1.7) | 32.3 (9.6) | 2.6 (1.9) | ||||
| Total Adherence Score—Adolescents | Healthy Items—Adolescents (DAQ) | Unhealthy Items—Adolescents (DAQ) | Total Knowledge Score—Parents | |
|---|---|---|---|---|
| Total Knowledge score—Adolescents | 0.10 | 0.01 | −0.16 * | 0.36 ** |
| Total Adherence score—Adolescents | 0.30 ** | −0.58 ** | 0.24 * | |
| Healthy Items—Adolescents | 0.33 ** | 0.05 | ||
| Unhealthy Items—Adolescents | −0.33 ** |
© 2019 by the authors. Licensee MDPI, Basel, Switzerland. This article is an open access article distributed under the terms and conditions of the Creative Commons Attribution (CC BY) license (http://creativecommons.org/licenses/by/4.0/).
Share and Cite
Said, L.; Gubbels, J.S.; Kremers, S.P.J. Development of Dietary Knowledge and Adherence Questionnaires for Lebanese Adolescents and Their Parents. Int. J. Environ. Res. Public Health 2020, 17, 147. https://doi.org/10.3390/ijerph17010147
Said L, Gubbels JS, Kremers SPJ. Development of Dietary Knowledge and Adherence Questionnaires for Lebanese Adolescents and Their Parents. International Journal of Environmental Research and Public Health. 2020; 17(1):147. https://doi.org/10.3390/ijerph17010147
Chicago/Turabian StyleSaid, Liliane, Jessica S. Gubbels, and Stef P. J. Kremers. 2020. "Development of Dietary Knowledge and Adherence Questionnaires for Lebanese Adolescents and Their Parents" International Journal of Environmental Research and Public Health 17, no. 1: 147. https://doi.org/10.3390/ijerph17010147
APA StyleSaid, L., Gubbels, J. S., & Kremers, S. P. J. (2020). Development of Dietary Knowledge and Adherence Questionnaires for Lebanese Adolescents and Their Parents. International Journal of Environmental Research and Public Health, 17(1), 147. https://doi.org/10.3390/ijerph17010147