Old and New Threats—Trace Metals and Fluoride Contamination in Soils at Defunct Smithy Sites

 , , and
Abstract
1. Introduction
2. Materials and Methods
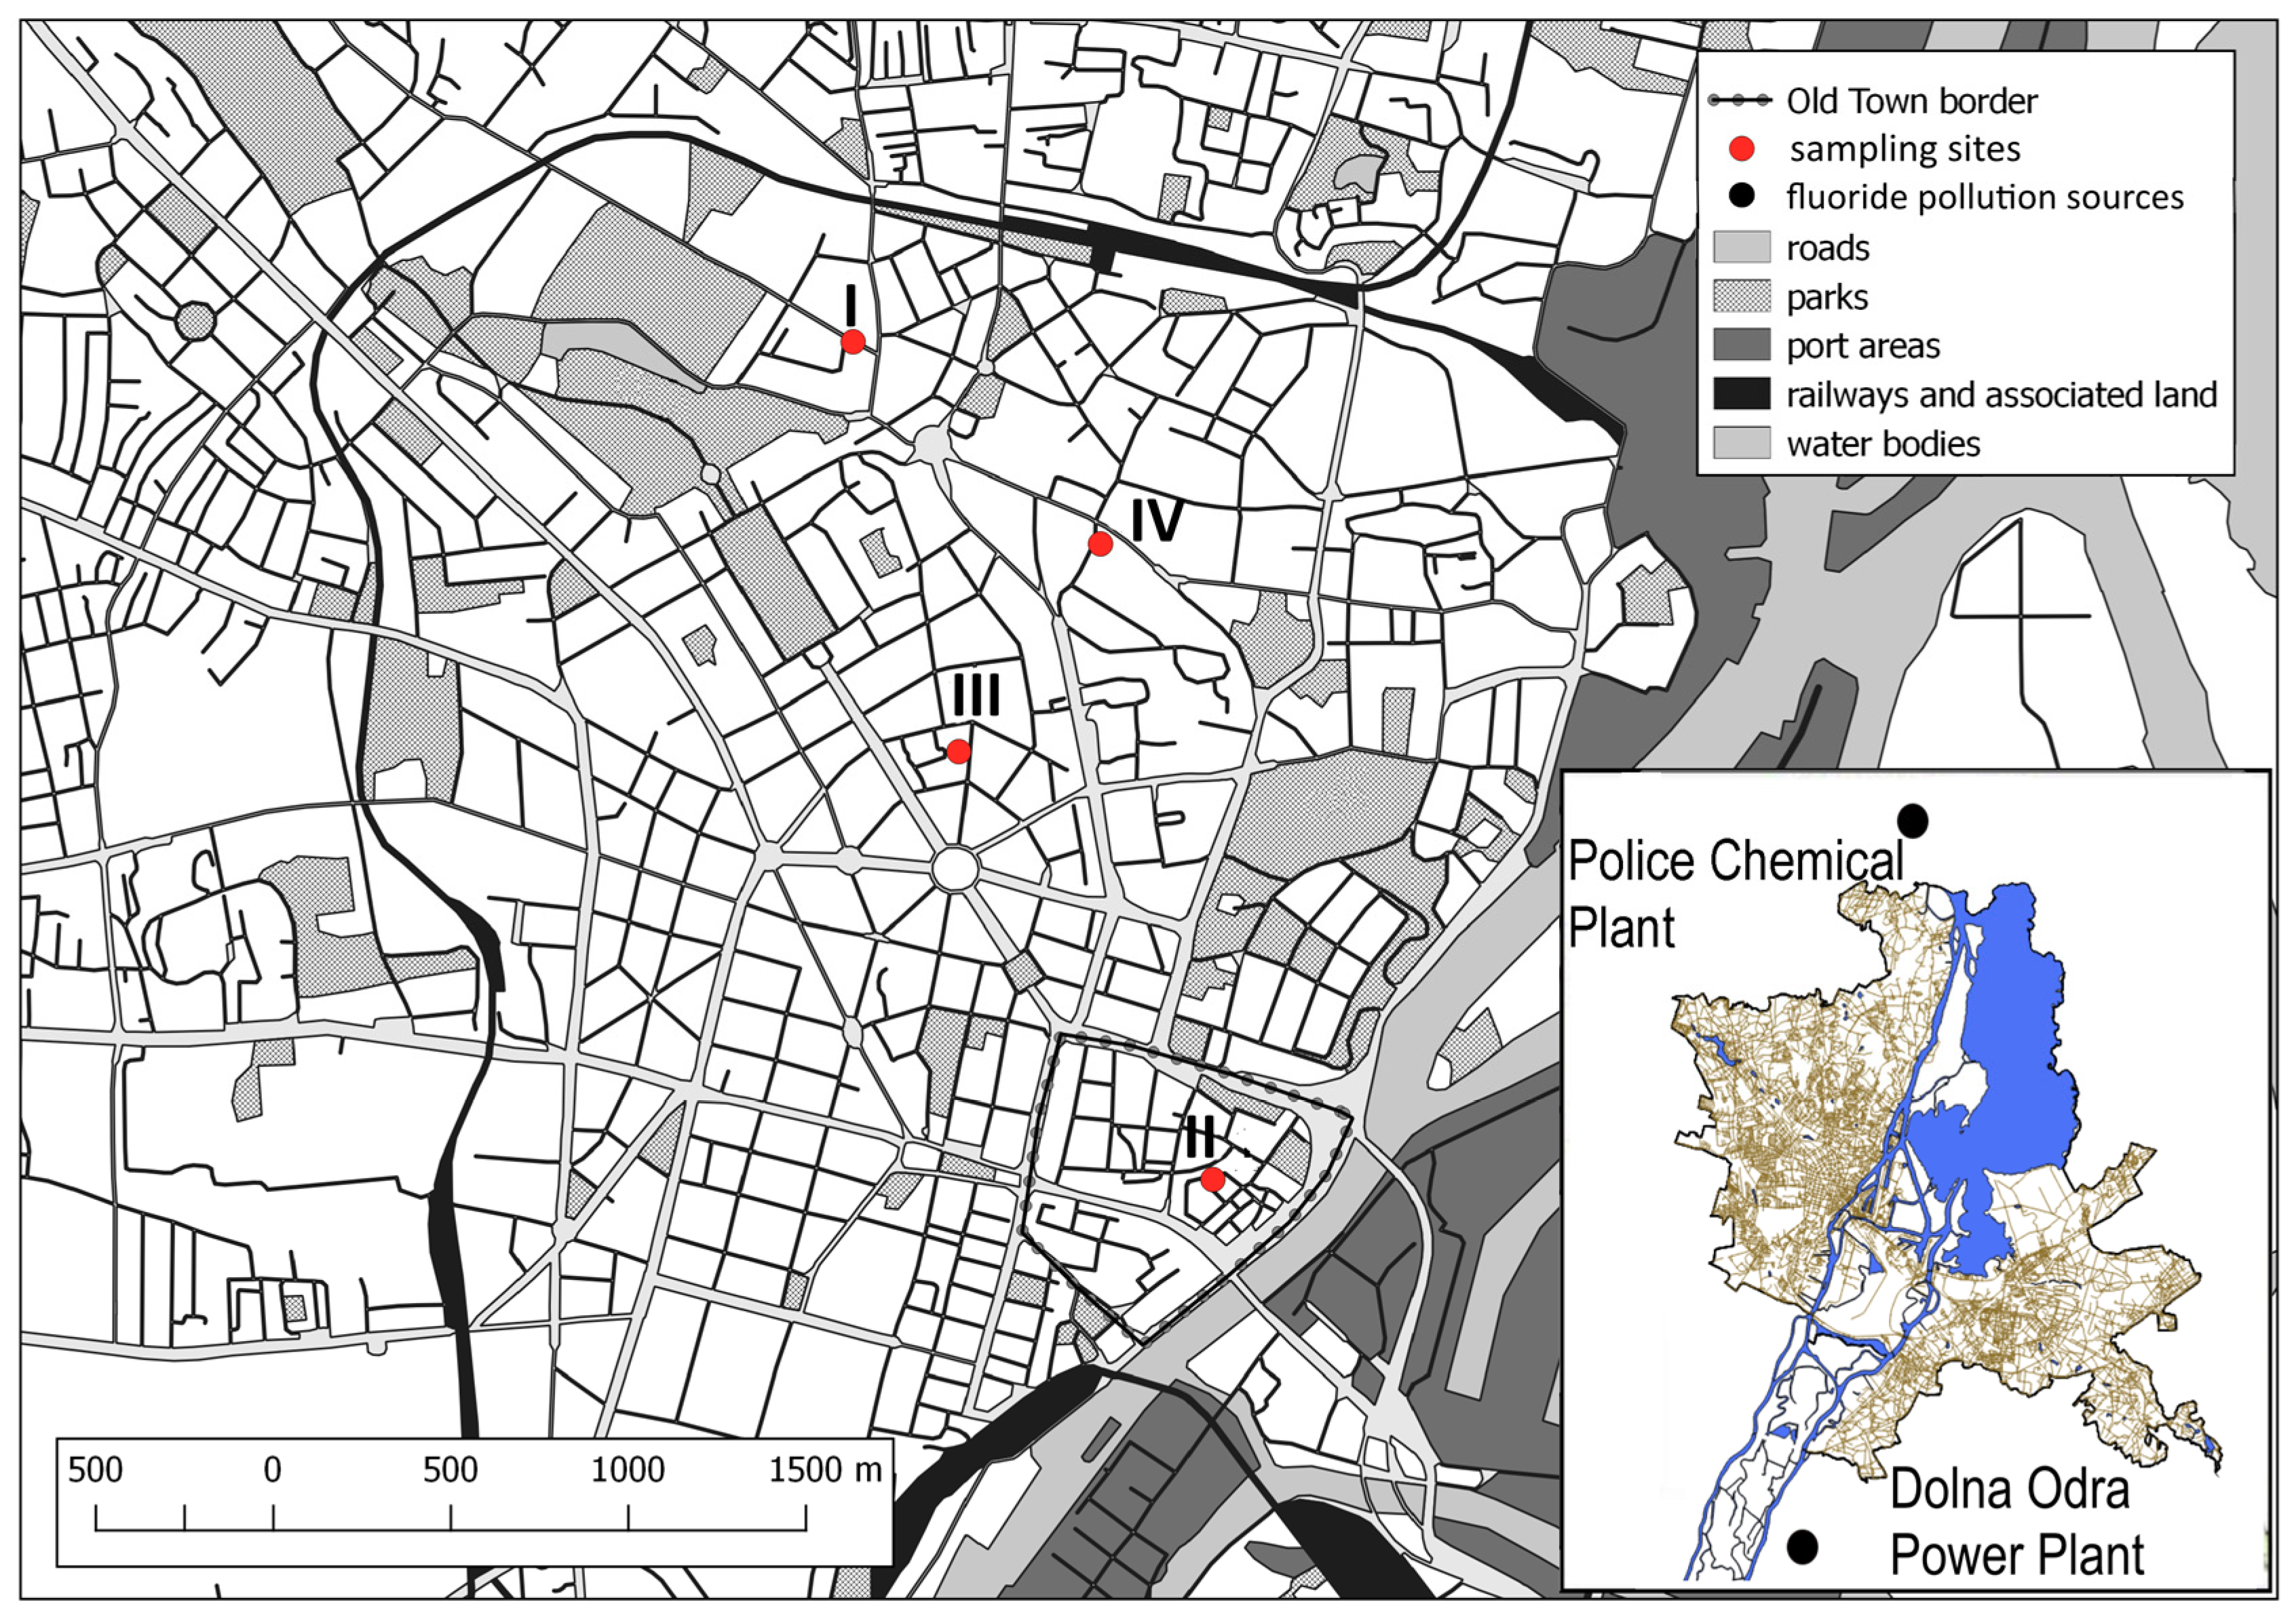
2.1. Study Area
2.1.1. Geological Setting
2.1.2. Industrial and Settlement History
2.1.3. Industrial Sources of Fluorine
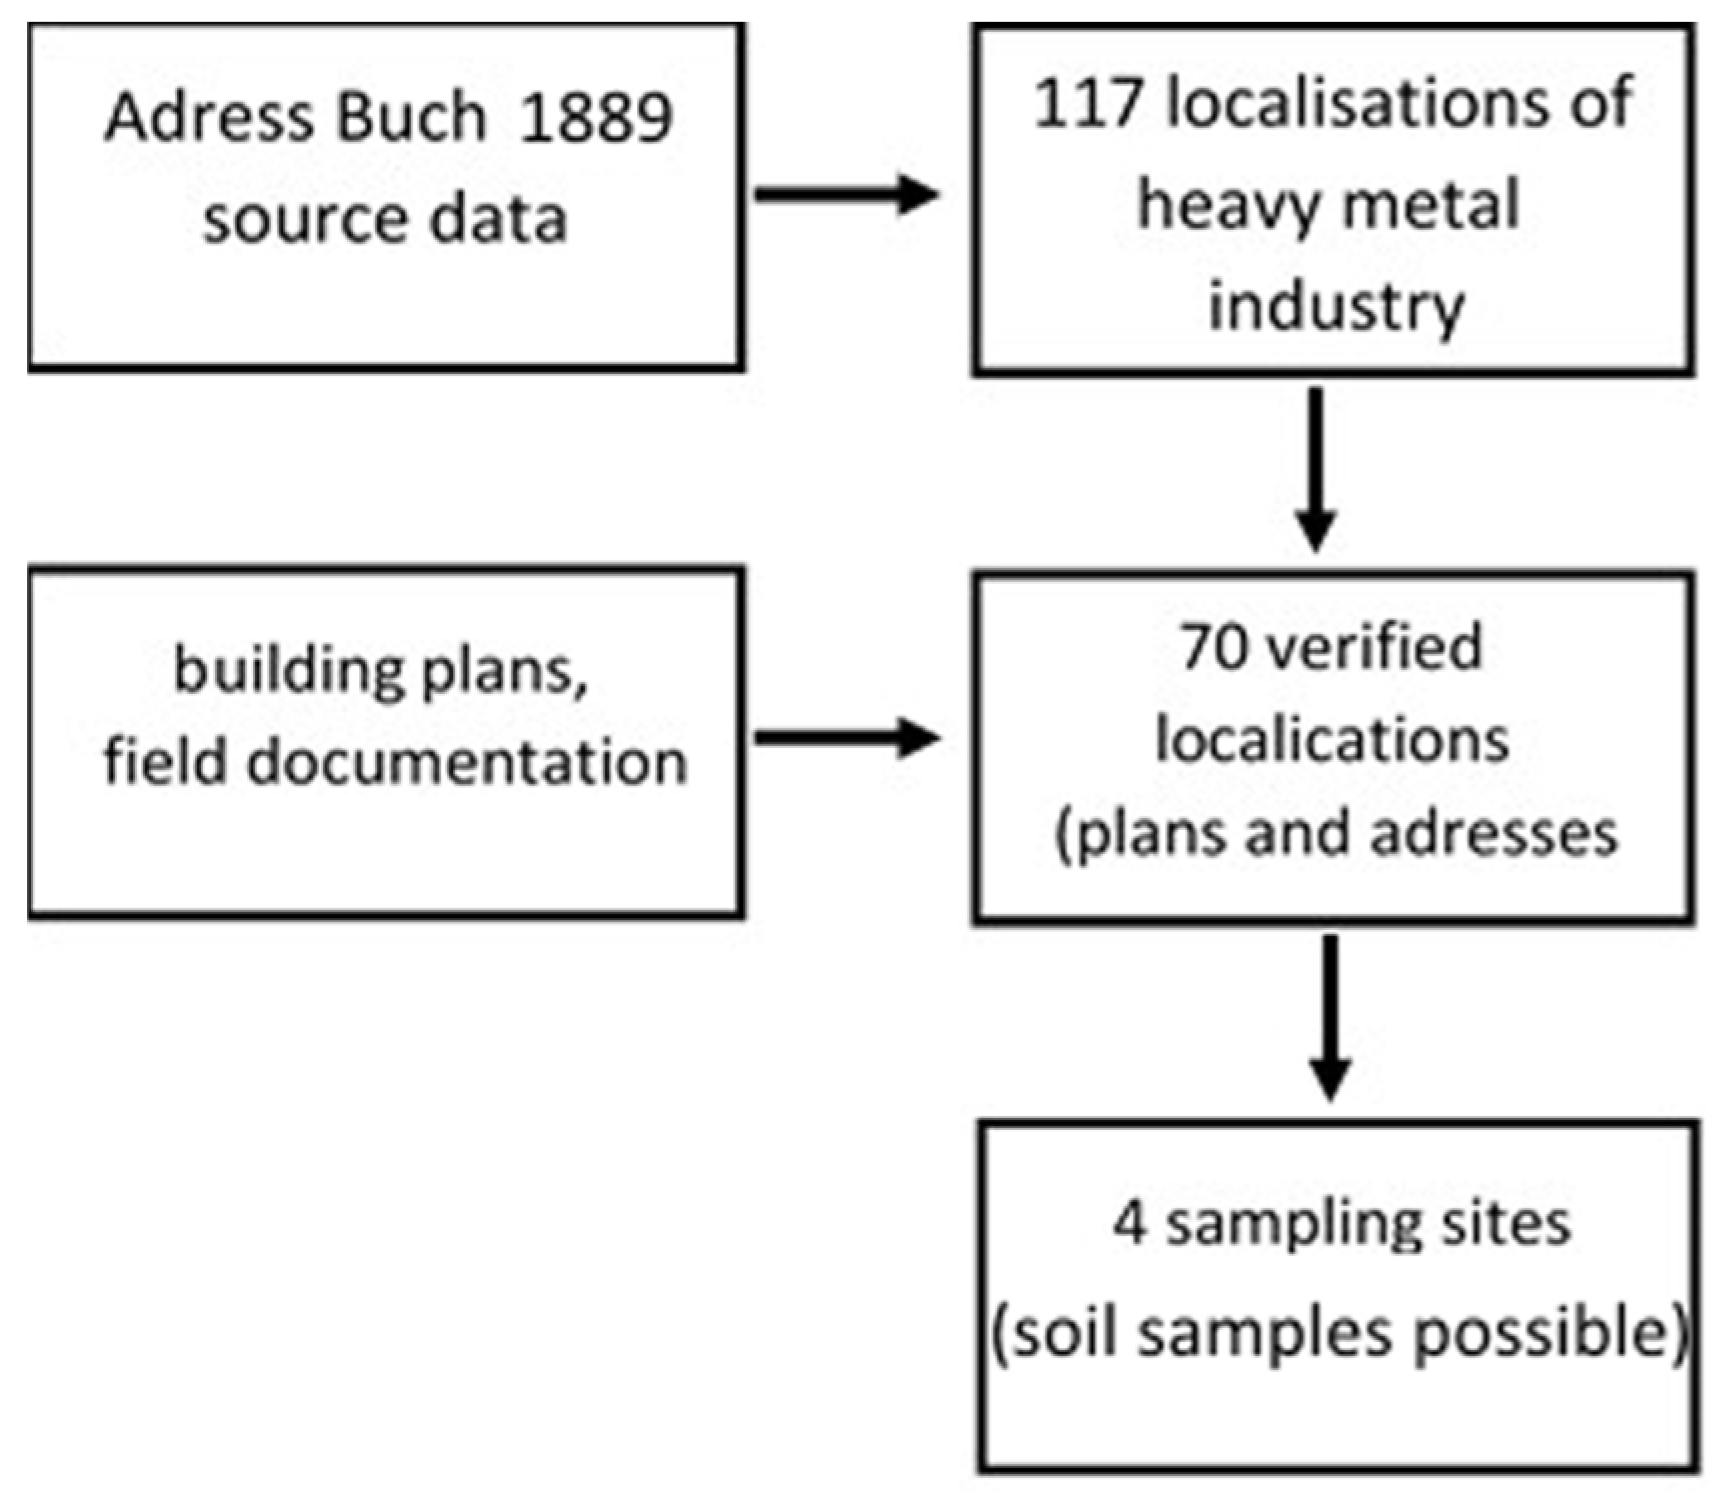
2.2. Sample Collection
2.3. Sample Characteristics
2.4. Quantification of Trace Metals
2.5. Determination of Fluoride
2.6. Statistical Analysis
3. Results
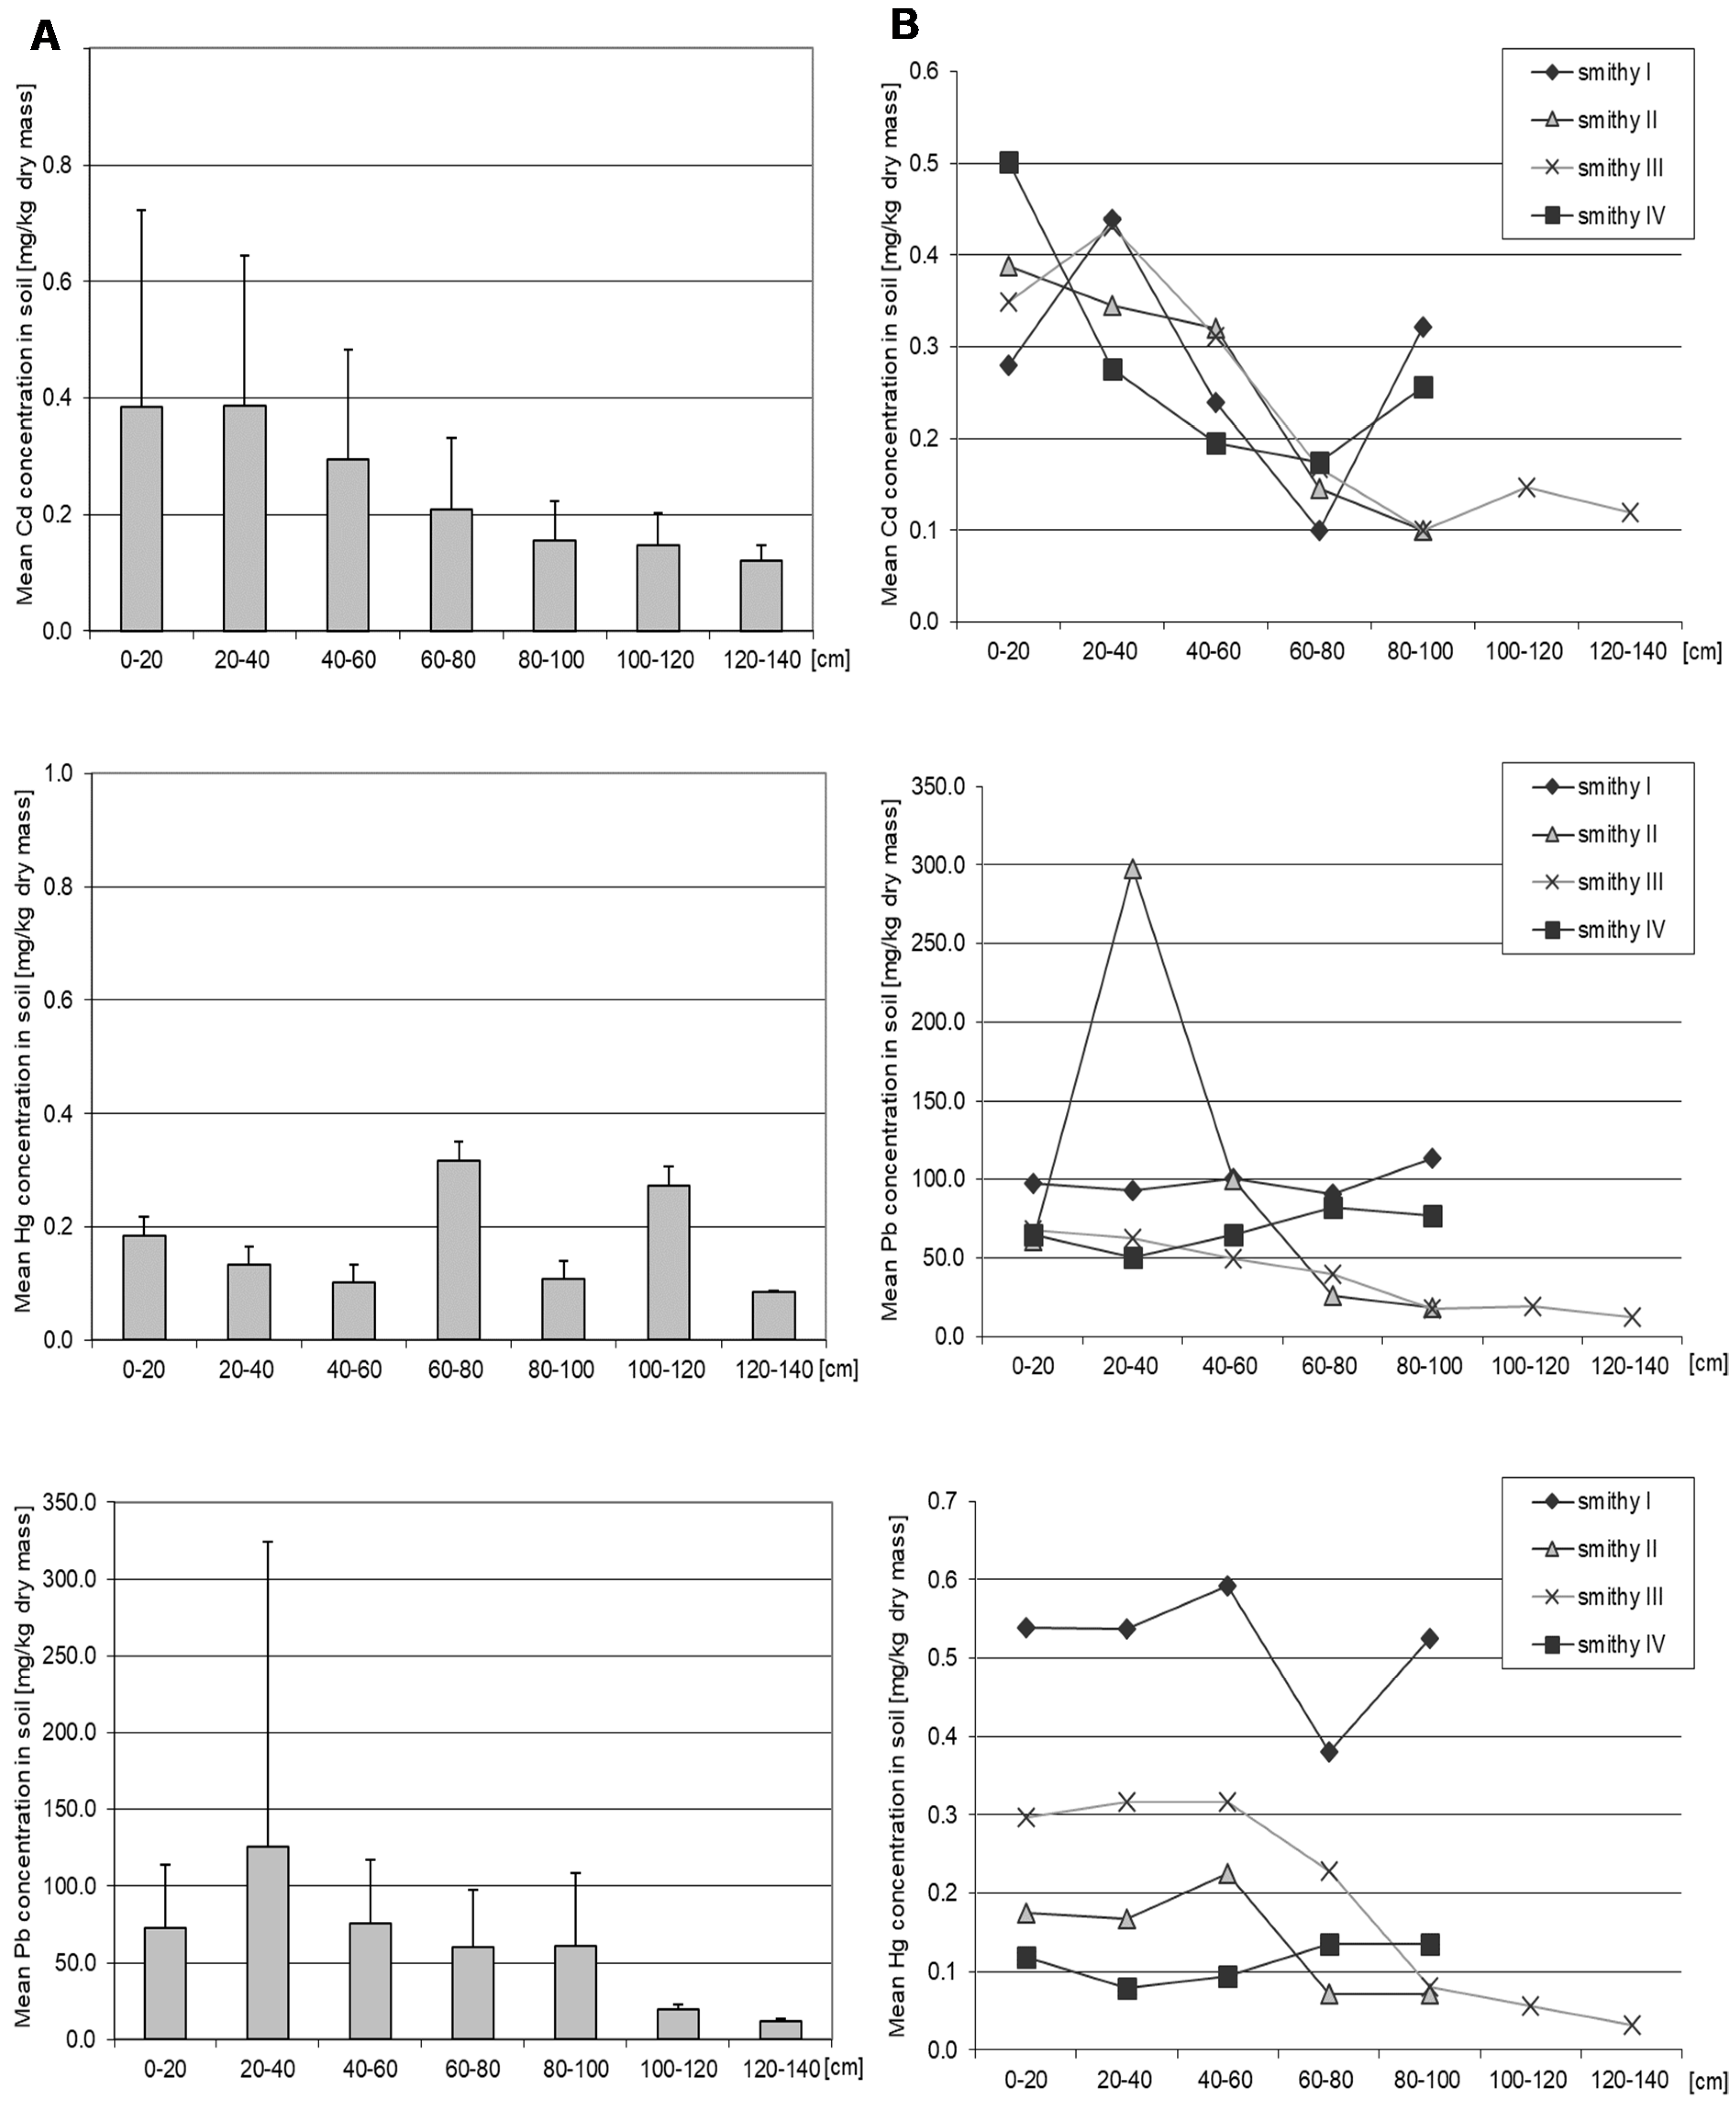
3.1. Cadmium
3.2. Lead
3.3. Mercury
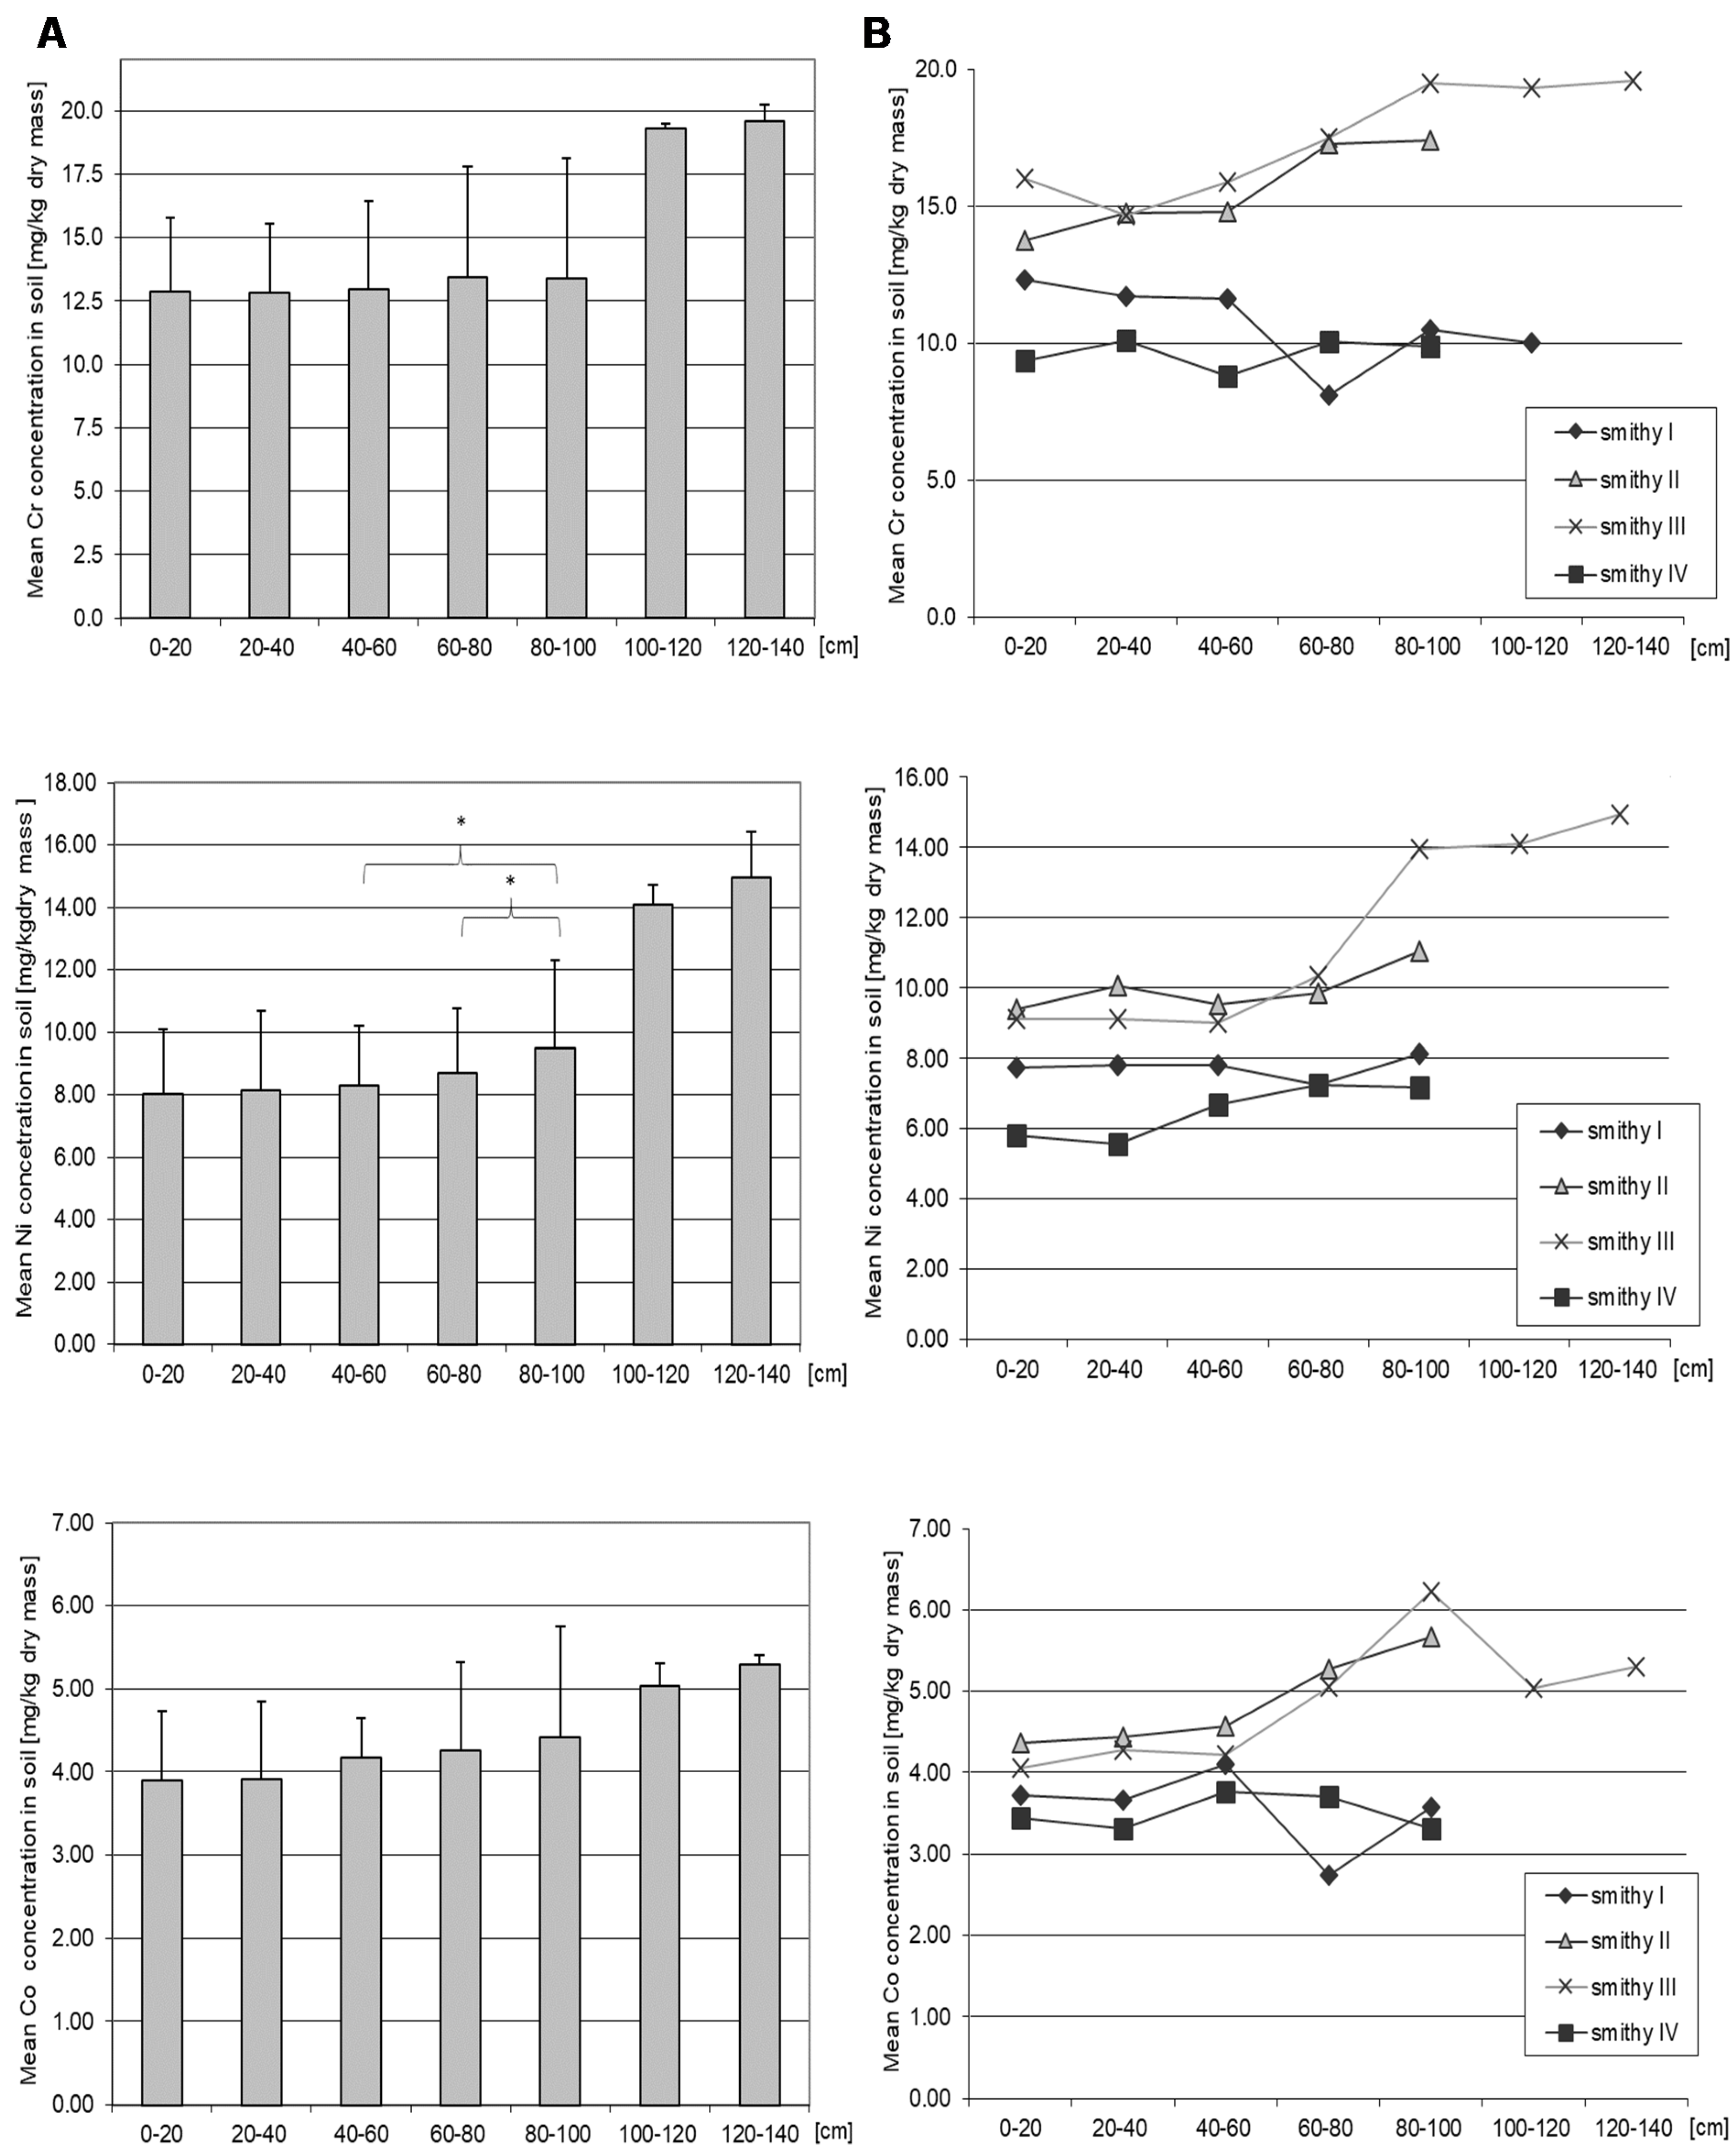
3.4. Chromium
3.5. Nickel
3.6. Cobalt
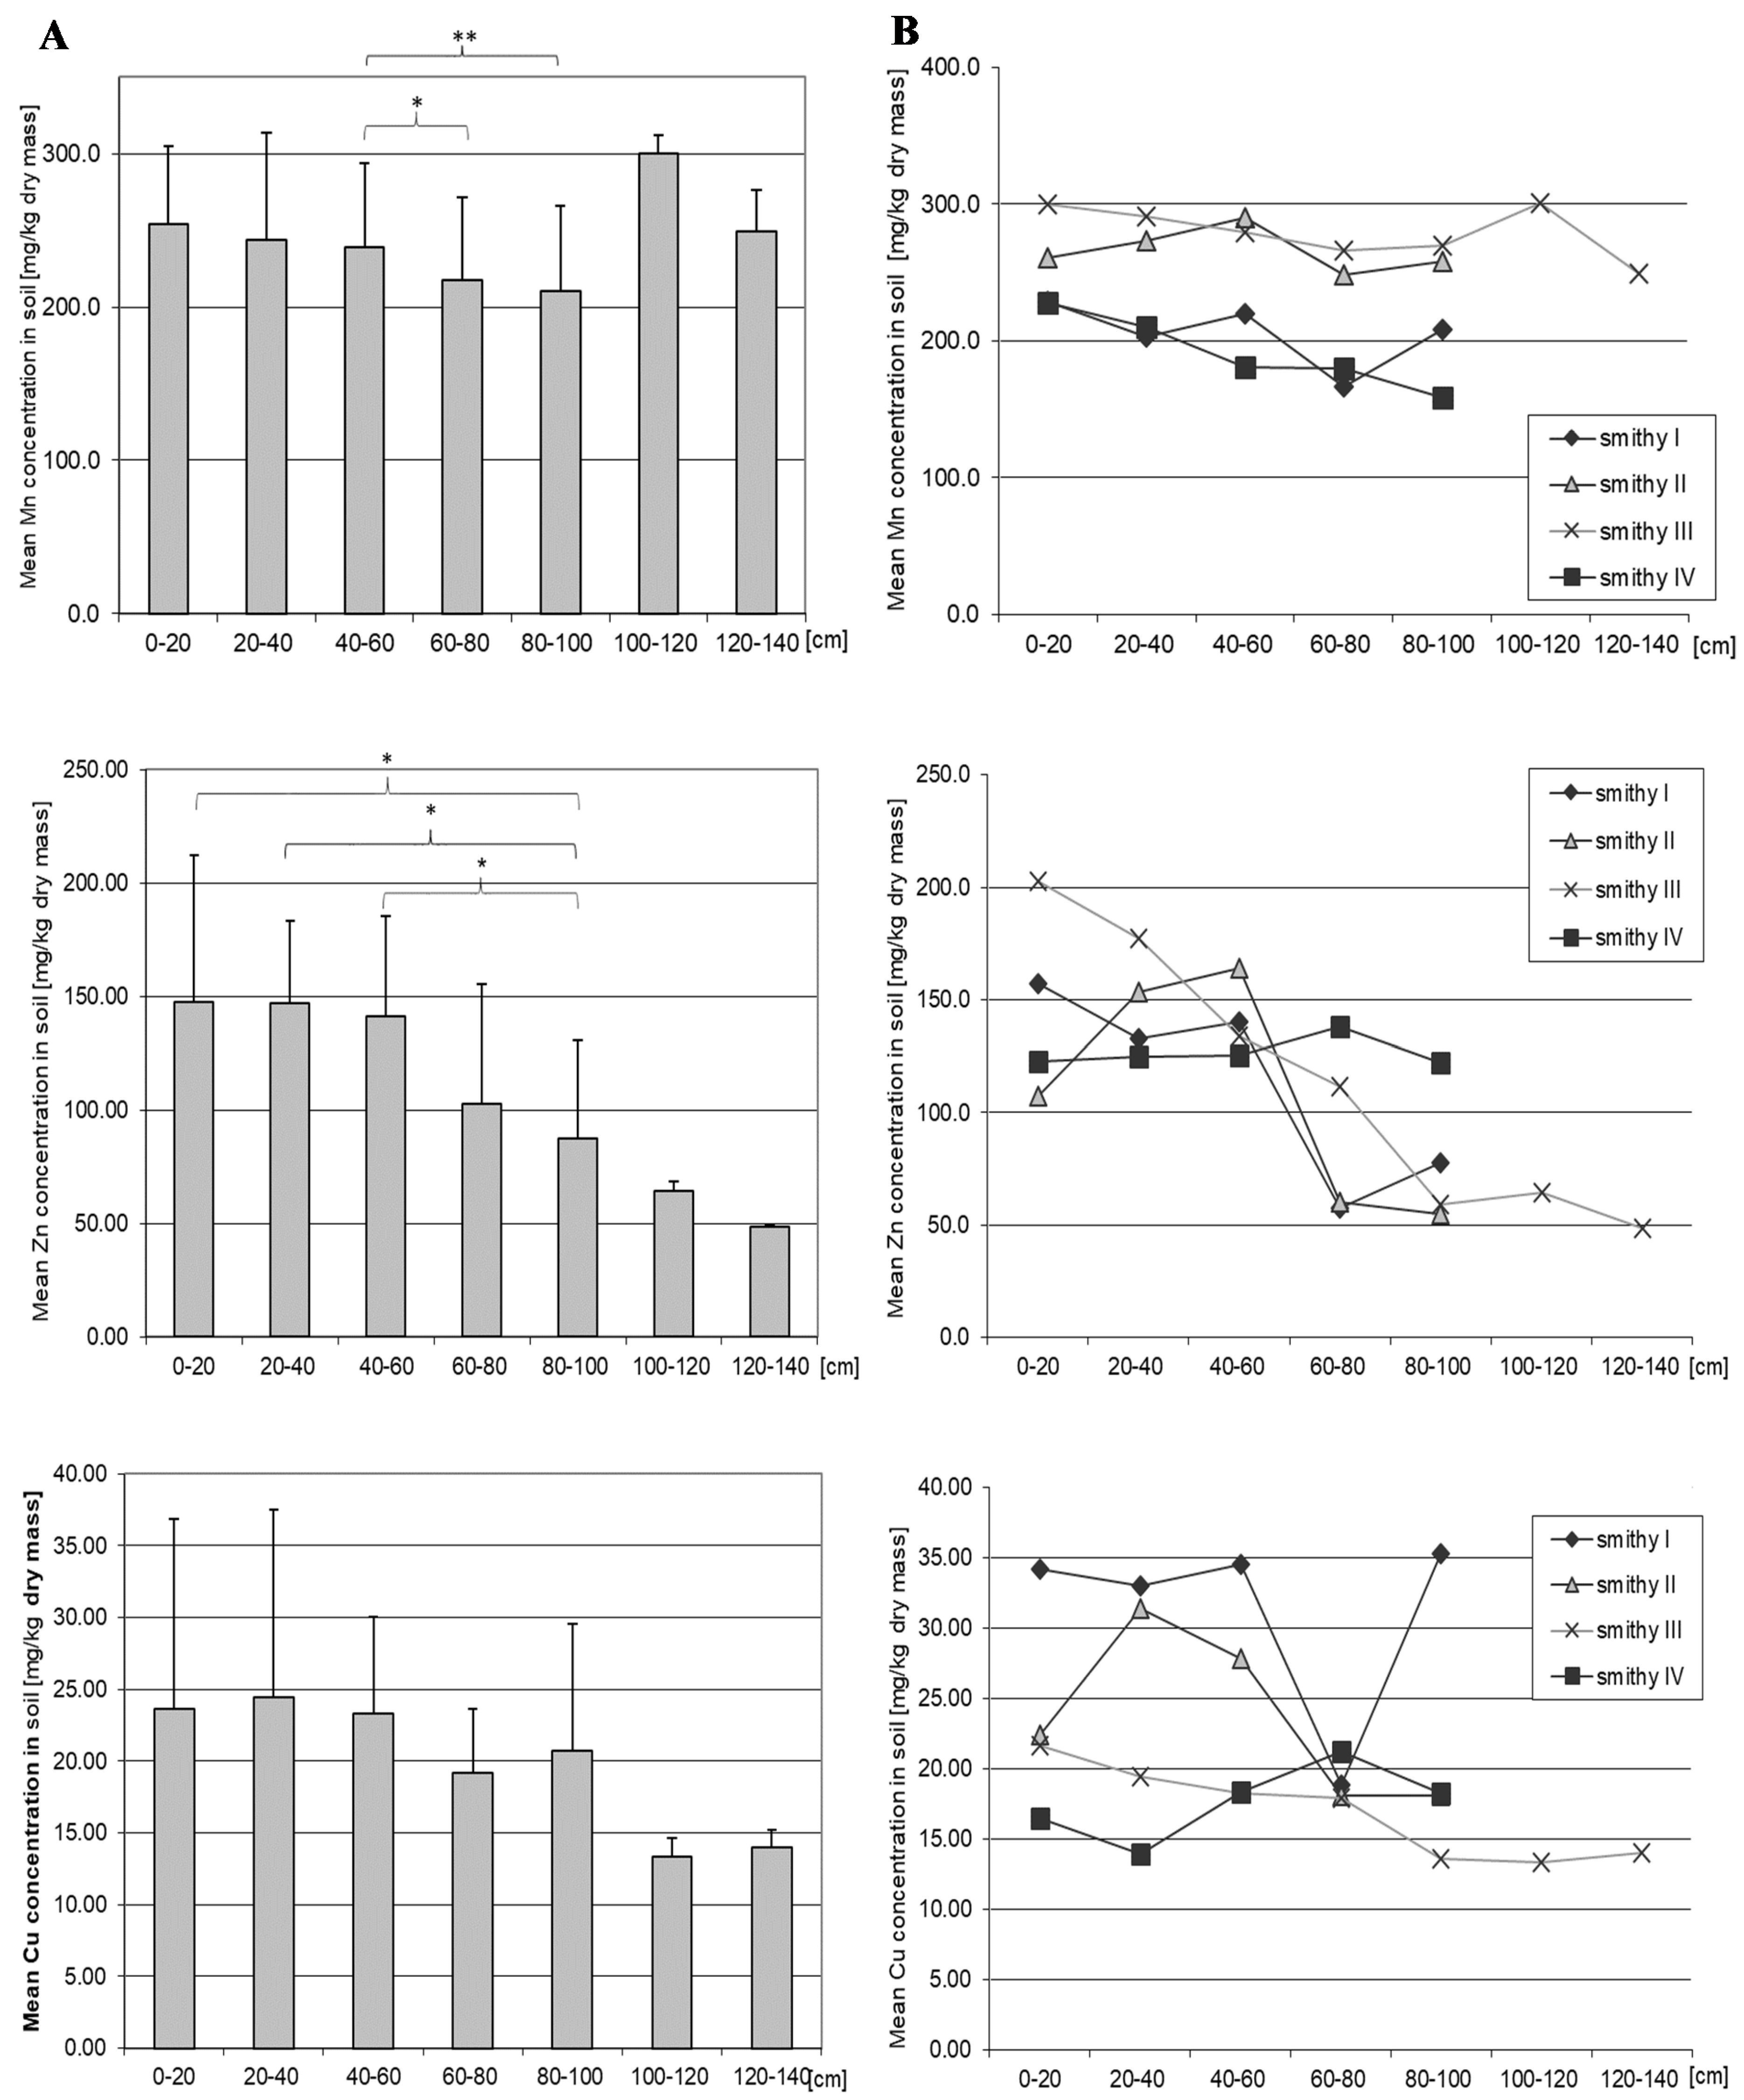
3.7. Manganese
3.8. Zinc
3.9. Copper
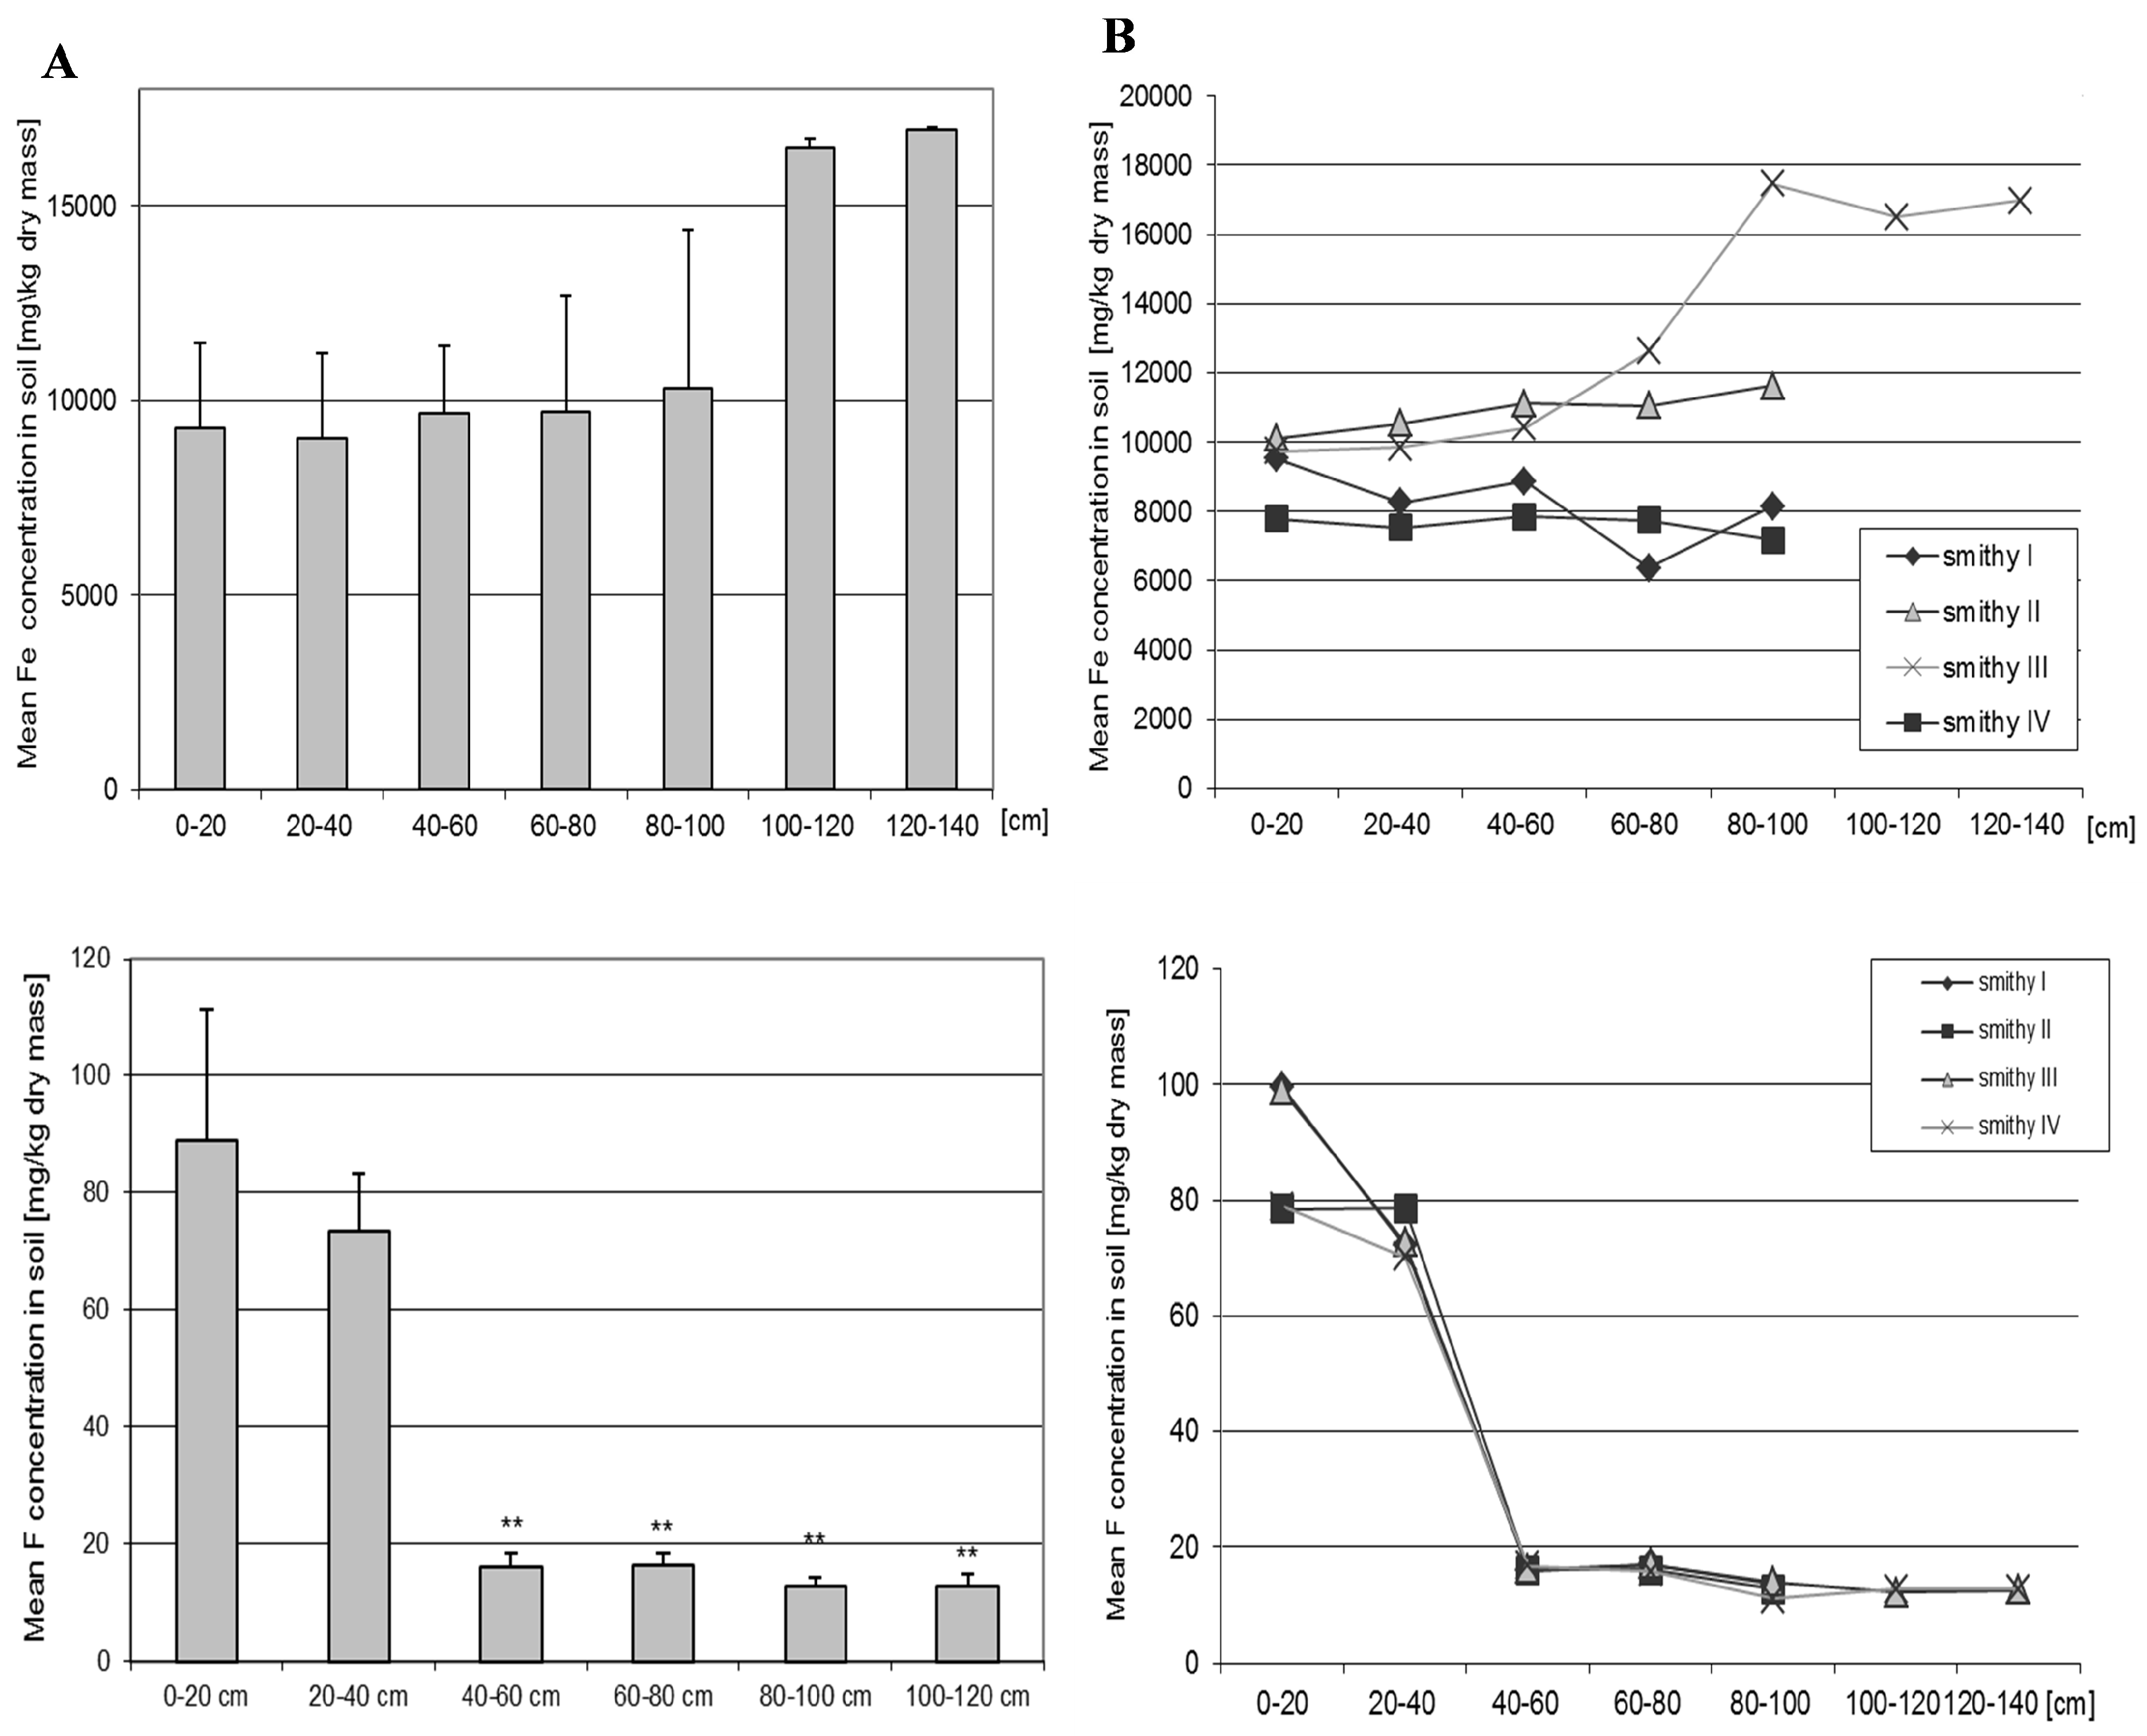
3.10. Iron
3.11. Fluoride
4. Discussion
5. Conclusions
Supplementary Materials
Author Contributions
Funding
Acknowledgments
Conflicts of Interest
References
- Act of 27 July 2001 on the Introduction of the Environmental Protection Act, the Waste Act and Amending Certain Acts. J. Laws, 27 July 2001. No. 100 pos. 1085. (In Polish)
- Act of 13 April 2007 on Preventing and Remediation of Environmental Damage. 2007. No. 75 pos. 493. (In Polish)
- De Kimpe, C.R.; Morel, J.L. Urban soil management: A growing concern. Soil Sci. 2000, 165, 31–40. [Google Scholar] [CrossRef]
- Luo, X.S.; Yu, S.; Zhu, Y.G.; Li, X.D. Trace metal contamination in urban soils of China. Sci. Total Environ. 2012, 421–422, 17–30. [Google Scholar] [CrossRef] [PubMed]
- Poggio, L.; Vrščaj, B.; Schulin, R.; Hepperle, E.; Marsan, F.A. Metals pollution and human bioaccessibility of top soils in Grugliasco (Italy). Environ. Pollut. 2009, 157, 680–689. [Google Scholar] [CrossRef] [PubMed]
- Wei, B.; Yang, L. A review of heavy metal contaminations in urban soils, urban road dusts and agricultural soils from China. Microchem. J. 2010, 94, 99–107. [Google Scholar]
- Wong, C.S.C.; Li, X.D.; Thornton, I. Urban environmental geochemistry of trace metals. Environ. Pollut. 2006, 142, 1–16. [Google Scholar] [CrossRef]
- Madrid, L.; Dıaz-Barrientos, E.; Madrid, F. Distribution of heavy metal contents of urban soils in parks of Seville. Chemosphere 2002, 49, 1301–1308. [Google Scholar] [CrossRef]
- Manta, D.S.; Angelone, M.; Bellanca, A.; Neria, R.; Sprovieri, M. Heavy metals in urban soils: A case study from the city of Palermo (Sicily), Italy. Sci. Total Environ. 2002, 300, 229–243. [Google Scholar] [CrossRef]
- Cannon, W.F.; Horton, J.D. Soil geochemical signature of urbanization and industrialization—Chicago, Illinois, USA. Appl. Geochem. 2009, 24, 1590–1601. [Google Scholar] [CrossRef]
- Davydova, S. Heavy metals as toxicants in big cities. Microchem. J. 2005, 79, 133–136. [Google Scholar] [CrossRef]
- Morton-Bermea, O.; Hernandez-Alvarez, E.; Gonzalez-Hernandez, G.; Romero, F.; Lozano, R.; Beramendi-Orosco, L.E. Assessment of heavy metal pollution in urban top soils from the metropolitan area of MexicoCity. J. Geochem. Explor. 2009, 101, 218–224. [Google Scholar] [CrossRef]
- Zonghui, C.; Ming, H.E.; Katsutoshi, S.; Yumei, K.; Kozo, I. Concentrations and chemical forms of heavy metals in urban soils of Shanghai, China. Soil Sci. Plant Nutr. 2007, 53, 517–529. [Google Scholar] [CrossRef]
- Lu, Y.; Zhu, F.; Chen, J.; Gan, H.; Guo, Y. Chemical fraction at ion of heavy metals in urban soils of Guangzhou, China. Environ. Monit. Assess. 2007, 134, 429–439. [Google Scholar] [CrossRef] [PubMed]
- Sun, Y.B.; Zhou, Q.X.; Xie, X.K.; Liu, R. Spatial, sources and risk assessment of heavy metal contamination of urban soils in typical regions of Shenyang, China. J. Hazard Mater. 2010, 174, 455–462. [Google Scholar] [CrossRef] [PubMed]
- Chen, X.; Lu, X.; Yang, G. Sources identification of heavy metals in urban topsoil from inside the Xi’an second ring road, NW China using multivariate statistical methods. Catena 2012, 98, 73–78. [Google Scholar] [CrossRef]
- Wu, S.; Peng, S.; Zhang, X.; Wu, D.; Luo, W.; Zhang, T.; Zhou, S.; Yang, G.; Wan, H.; Wu, L. Levels and health risk assessments of heavy metals in urban soils in Dongguan, China. J. Geochem. Explor. 2015, 148, 71–78. [Google Scholar] [CrossRef]
- Zhao, L.; Xu, Y.; Hou, H.; Shangguan, Y.; Li, F. Source identification and health risk assessment of metals in urban soils around the Tanggu chemical industrial district, Tianjin, China. Sci. Total Environ. 2014, 468–469, 654–662. [Google Scholar] [CrossRef] [PubMed]
- Chen, H.Y.; Teng, Y.G.; Lu, S.J.; Wang, Y.Y.; Wang, J.S. Contamination features and health risk of soil heavy metals in China. Sci. Total Environ. 2015, 512–513, 143–153. [Google Scholar] [CrossRef]
- Wei, X.; Gao, B.; Wang, P.; Zhou, H.D.; Lu, J. Pollution characteristics and health risk assessment of heavy metals in street dusts from different functional areas in Beijing, China. Ecotoxicol. Environ. Saf. 2015, 112, 186–192. [Google Scholar] [CrossRef] [PubMed]
- Kumar, V.; Sharma, A.; Kaur, P.; Singh Sidhu, G.P.; Bali, A.S.; Bhardwaj, R.; Thukral, A.K.; Cerda, A. Pollution assessment of heavy metals in soils of India and ecological risk assessment: A state-of-the-art. Chemosphere 2019, 216, 449–462. [Google Scholar] [CrossRef] [PubMed]
- Iwegbue, C.M.A.; Martincigh, B.S. Ecological and human health risks arising from exposure to metals in urban soils under different land use in Nigeria. Environ. Sci. Pollut. Res Int. 2018, 25, 12373–12390. [Google Scholar] [CrossRef] [PubMed]
- Bello, O.; Naidu, R.; Rahman, M.M.; Liu, Y.; Dong, Z. Lead concentration in the blood of the general population living near a lead-zinc mine site, Nigeria: Exposure pathways. Sci. Total Environ. 2016, 542, 908–914. [Google Scholar] [CrossRef] [PubMed]
- Bartrem, C.; Tirima, S.; von Lindern, I.; von Braun, M.; Worrell, M.C.; Mohammad Anka, S.; Abdullahi, A.; Moller, G. Unknown risk: Co-exposure to lead and other heavy metals among children living in small-scale mining communities in Zamfara State, Nigeria. Int. J. Environ. Health. Res. 2014, 24, 304–319. [Google Scholar] [CrossRef] [PubMed]
- Chabukdhara, M.; Nema, A. Heavy metals assessment in urban soil around industrial clusters in Ghaziabad, India: Probabilistic health risk approach. Ecotoxicol. Environ. Saf. 2013, 87, 57–64. [Google Scholar] [CrossRef] [PubMed]
- Maanan, M.; Saddik, M.; Chaibi, M.; Assobhei, O.; Zourarah, B. Environmental and ecological risk assessment of heavy metals in sediments of Nador lagoon, Morocco. Ecol. Indic. 2014, 48, 616–626. [Google Scholar] [CrossRef]
- Li, Z.Y.; Ma, Z.W.; van derKuijp, T.J.; Yuan, Z.W.; Huang, L. A review of soil heavy metal pollution from mines in China: Pollution and health risk assessment. Sci. Total Environ. 2014, 468–469, 843–853. [Google Scholar] [CrossRef] [PubMed]
- Abrahams, P.W. Soils: Their implications to human health. Sci. Total Environ. 2002, 291, 1–32. [Google Scholar] [CrossRef]
- Aelion, C.M.; Davis, H.T.; McDermott, S.; Lawson, A.B. Metal concentrations in rural topsoil in South Carolina: Potential for human health impact. Sci. Total Environ. 2008, 402, 149–156. [Google Scholar] [CrossRef] [PubMed]
- De Miguel, E.; Iribarren, I.; Chacón, E.; Ordoñez, A.; Charlesworth, S. Risk-based evaluation of the exposure of children to trace elements in playgrounds in Madrid (Spain). Chemosphere 2007, 66, 505–513. [Google Scholar] [CrossRef] [PubMed]
- Venditti, D.; Durecu, S.; Berthelin, J. A multidisciplinary approach to assess history, environmental risks and remediation feasibility of soils contaminated by metallurgical activities. Part A: Chemical and physical properties of metals and leaching ability. Arch. Environ. Cont. Tox. 2000, 38, 411–420. [Google Scholar] [CrossRef]
- Rehman, K.; Fatima, F.; Waheed, I.; Akash, M.S.H. Prevalence of exposure of heavy metals and their impact on health consequences. J. Cell. Biochem. 2018, 119, 157–184. [Google Scholar] [CrossRef] [PubMed]
- Vassallo, D.V.; Wiggers, G.A.; Padilha, A.S.; Ronacher Simões, M. Endothelium: A target for harmful actions of metals. Curr. Hypertens. Rev. 2019. [Google Scholar] [CrossRef] [PubMed]
- Krechniak, J.; Czarnowski, W. Fluorides in hair and urine of children in the vicinity of a phosphate industry waste disposal site. Fluoride 1990, 23, 119–122. [Google Scholar]
- Kabata-Pendias, A. Trace Elements in Soils and Plants, 4th ed.; Taylor & Francis Group: Boca Raton, FL, USA; London, UK; New York, NY, USA, 2011. [Google Scholar]
- Żyluk, B.; Machoy, Z. Species sensitivity of living organisms to toxic effects of fluoride compounds. Bromat. Chem. Toksykol. 1988, 1, 56–60. (In Polish) [Google Scholar]
- Indulski, J.A. Fluoride and Fluorides. Environmental Health Criteria; T. 36; PZWL: Warszawa, Poland, 1989. (In Polish) [Google Scholar]
- Biasioli, M.; Barberis, R.; Ajmone-Marsan, F. The influence of a large city on some soil properties and metals content. Sci. Total Environ. 2006, 356, 154–164. [Google Scholar] [CrossRef] [PubMed]
- Dobracki, R.; Piotrowski, A. Geographic characterization of the Lower Odra Valley. In Lower Odra Valley; Jasnowska, J., Ed.; A Monograph of the Landscape Park’s Nature; ZAPOL: Szczecin, Poland, 2002; pp. 35–53. (In Polish) [Google Scholar]
- Dobracki, R. Outline of the geological structure of Quaternary deposits in the Szczecin Region. Acta Univ. Nicolai Coperenici. Geogr. 1986, 21, 3–9. (In Polish) [Google Scholar]
- Włodarczyk, E. Economic life in the city of Szczecin 1891–1918. In History of Szczecin; Wachowiak, B., Ed.; National Scientific Publisher: Warsaw–Poznan–Szczecin, Poland, 1994; Volume 3, pp. 365–406. (In Polish) [Google Scholar]
- Gutowska, I.; Machoy, Z.; Chlubek, D.; Machaliński, B. Evaluation of the living conditions of deer species from Western Pomerania and the Lubusz Region based on the content of fluoride, calcium and magnesium in the mandible. I. Relationships between the content of elements in the mandible. Ann. Acad. Med. Stettin 2004, 50, 42–46. (In Polish) [Google Scholar]
- Straszko, J.; Fidecka, M.; Paulo, L.A. Assessment of air quality in industrial regions. Ochrona Środ. 1996, 4, 45–48. (In Polish) [Google Scholar]
- Zabłocki, Z. Changes in the fluorine content in some of the environmental components in the area affected by the emissions of Zakłady Chemiczne “Police” in the years 1977–1996. Met. Fluoru 1998, 1, 16–23. (In Polish) [Google Scholar]
- Borowiec, S.; Zabłocki, Z. Comparison of fluorine accumulation in indicator plants in the area of Chemical Plant “Police”. Impact of emissions of Chemical Plant “Police” in the years 1983–1985 and 1989–1991. Met. Fluoru 1992, 27, 113–115. (In Polish) [Google Scholar]
- Chen, M.; Ma, Q.L. Comparison of four digestion methods for trace metal analysis using certified and Florida soils. J. Environ. Qual. 1998, 27, 1294–1300. [Google Scholar] [CrossRef]
- Gutowska, I.; Baranowska-Bosiacka, I.; Noceń, I.; Dudzińska, W.; Marchlewicz, M.; Wiszniewska, B.; Chlubek, D. Changes in the concentration of elements in the teeth of rats with type 1 diabetes, in the peak stage of the disease with absolute insulin deficit. Biol. Trace Elem. Res. 2011, 139, 332–340. [Google Scholar] [CrossRef] [PubMed]
- The Environmental Status of the City of Szczecin (31 December 2002); Arcadis Ekokonrem Sp. Z o.o.: Wroclaw, Poland, 2004; Available online: http://www.ikzm-oder.de/download.php?fileid=2150 (accessed on 1 February 2017).
- (IUNG) Guidelines of the Institute of Soil Science and Plant Cultivation on Soil Contamination with Heavy Metals. Available online: http://karnet.up.wroc.pl/~kabala/Wytyczne_IUNG.pdf (accessed on 9 October 2017).
- Directive of the Polish Minister of Environment of 9 September 2002 on Soil and Land Standards. Journal of Laws from 23 September 2002, no. 165, pos. 1359. (In Polish)
- Greinert, A. Norms of heavy metal levels in soil in Poland and EU, and heavy metal mobility in urban environment. In Ecotoxicology in Environment Protection; Kołwzan, B., Grabas, K., Eds.; Polish Society of Engineers and Sanitary Technics: Wroclaw, Poland, 2008; pp. 121–128. (In Polish) [Google Scholar]
- Li, X.; Lee, S.; Wong, S.; Shi, W.; Thornton, I. The study of metal contamination in urban soils of Hong Kong using a GIS-based approach. Environ. Pollut. 2004, 129, 113–124. [Google Scholar] [CrossRef] [PubMed]
- Pichtel, J.; Sawyerr, H.T.; Czarnowska, K. Spatial and temporal distribution of metals in soils in Warsaw. Poland. Environ. Pollut. 1998, 9, 169–174. [Google Scholar] [CrossRef]
- Glennon, M.M.; Harris, P.; Ottesen, R.T.; Scanlon, R.P.; O’Connor, P.J. The Dublin SURGE Project: Geochemical baseline for heavy metals in topsoils and spatial correlation with historical industry in Dublin, Ireland. Environ. Geochem. Health 2014, 36, 235–254. [Google Scholar] [CrossRef] [PubMed]
- Remon, E.; Bouchardon, J.L.; Corniera, B.; Guy, B.; Leclerc, J.C.; Faure, O. Soil characteristics, heavy metal availability and vegetation recovery at a former metallurgical landfill: Implications in risk assessment and site restoration. Environ. Pollut. 2005, 137, 316–323. [Google Scholar] [CrossRef] [PubMed]
- Kowalska, J.; Mazurek, R.; Gąsiorek, M.; Setlak, M.; Zaleski, T.; Waroszewski, J. Soil pollution indices conditioned by medieval metallurgical activity—A case study from Krakow. Environ. Pollut. 2016, 218, 1023–1036. [Google Scholar] [CrossRef] [PubMed]
- Chen, T.B.; Zheng, Y.M.; Lei, M.; Huang, Z.C.; Wu, H.T.; Chen, H. Assessment of heavy metal pollution in surface soils of urban parks in Beijing, China. Chemosphere 2005, 60, 542–551. [Google Scholar] [PubMed]
- Lu, Y.; Gong, Z.; Zhang, G.; Burghardt, W. Concentrations and chemical speciations of Cu, Zn, Pb and Cr of urban soils in Nanjing, China. Geoderma 2003, 115, 101–111. [Google Scholar] [CrossRef]
- Zhou, T.; Xi, C.Z.; Dai, T.G.; Huang, D.Y. Comprehensive assessment of urban geological environment in Changsha City. Guangdong. Trace. Elem. Sci. 2008, 15, 32–38. (In Chinese) [Google Scholar]
- Shi, G.T.; Chen, Z.L.; Xu, S.Y.; Zhang, J.; Wang, L.; Bi, C.J.; Teng, J. Potentially toxic metal contamination of urban soils and roadside dust in Shanghai, China. Environ. Pollut. 2008, 156, 251–260. [Google Scholar] [PubMed]
- Linde, M.; Bengtsson, H.; Öborn, I. Concentrations and pools of heavy metals in urban soils in Stockholm, Sweden. Water Air Soil Pollut. Focus 2001, 1, 83–101. [Google Scholar] [CrossRef]
- Leech, T.G.J.; Adams, E.A.; Weathers, T.D.; Staten, L.K.; Filippelli, G.M. Inequitable chronic lead exposure: A dual legacy of social and environmental injustice. Fam. Community Health 2016, 39, 151–159. [Google Scholar] [CrossRef] [PubMed]
- Filippelli, G.M.; Laidlaw, M.A.S. The Elephant in the Playground: Confronting lead-contaminated soils as an important source of lead burdens to urban populations. Perspect. Biol. Med. 2010, 53, 31–45. [Google Scholar] [CrossRef] [PubMed]
- Filippelli, G.M.; Laidlaw, M.A.S.; Raftis, R.; Latimer, J.C. Urban lead poisoning and medical geology: An unfinished story. GSA Today 2005, 15, 4–11. [Google Scholar] [CrossRef]
- Laidlaw, M.A. Association between Soil Lead and Blood Lead e Evidence. 2016. Available online: http://www.urbanleadpoisoning.com/ (accessed on 19 May 2016).
- Laidlaw, M.A.; Zahran, S.; Mielke, H.W.; Taylor, M.P.; Filippelli, G.M. Re-suspension of lead contaminated urban soil as a dominant source of atmospheric lead in Birmingham, Chicago, Detroit and Pittsburgh, USA. Atmos. Environ. 2012, 49, 302–310. [Google Scholar] [CrossRef]
- Laidlaw, M.A.; Zahran, S.; Pingitore, N.; Clague, J.; Devlin, G.; Taylor, M.P. Identification of lead sources in residential environments: Sydney Australia. Environ. Pollut. 2014, 184, 238–246. [Google Scholar] [CrossRef] [PubMed]
- Mielke, H.W.; Gonzales, C.R.; Smith, M.K.; Mielke, P.W. The urban environment and children’s health: Soils as an integrator of lead, zinc, and cadmium in New Orleans, Louisiana, U.S.A. Environ. Res. 1999, 81, 117–129. [Google Scholar] [CrossRef] [PubMed]
- Mielke, H.W.; Gonzales, C.R.; Powel, E.T.; Mielke, P.W., Jr. Spatiotemporal dynamic transformations of soil lead and children’s blood lead ten years after Hurricane Katrina: New grounds for primary prevention. Environ. Int. 2016, 94, 567–575. [Google Scholar] [CrossRef] [PubMed]
- Verner, J.F.; Ramsey, M.H.; Helios-Rybicka, E.; Jędrzejczyk, B. Heavy metal contamination of soils around a Pb/Zn smelter in Bukowno, Poland. Appl. Geochem. 1996, 11, 11–16. [Google Scholar] [CrossRef]
- Thornton, I.; Davies, D.J.; Watt, J.M.; Quinn, M.J. Lead Exposure in Young Children from Dust and Soil in the United Kingdom. Environ. Health Perspect. 1990, 89, 55–60. [Google Scholar] [CrossRef] [PubMed]
- Yang, T.H.; Yuan, T.H.; Hwang, Y.H.; Lian, I.B.; Meng, M.; Su, C.C. Increased inflammation in rheumatoid arthritis patient living where farm soils contain high levels of copper. J. Formosan Med. Assoc. 2016, 115, 991–996. [Google Scholar] [CrossRef] [PubMed]
- Adamo, P.; Arienzo, M.; Bianco, M.R.; Terribile, F.; Violante, P. Heavy metal contamination of the soil used for stocking raw materials in the former ILVA iron-steel industrial plant of Bagnoli (southern Italy). Sci. Total Environ. 2002, 295, 17–34. [Google Scholar] [CrossRef]
- Kicińska, A. Occurrence and mobility of zinc, lead and cadmium in soils polluted by mining and metallurgical industries. Environ. Protect. Nat. Resources 2011, 49, 152–162. (In Polish) [Google Scholar]
- Sanchez-Camazano, M.; Sanchez-Martın, M.J.; Lorenzo, L.F. Lead and cadmium in soils and vegetables from urban gardens of Salamanca (Spain). Sci. Total Environ. 1994, 146, 163–168. [Google Scholar] [CrossRef]
- Bernhoft, R.A. Mercury Toxicity and Treatment: A review of the literature. J. Environ. Public Health 2012, 460–508. [Google Scholar] [CrossRef] [PubMed]
- Plum, L.M.; Rink, L.; Haase, H. The essential toxin: Impact of zinc on human health. Int. J. Environ. Res. Public Health 2010, 7, 1342–1365. [Google Scholar] [CrossRef] [PubMed]
- Duda-Chodak, A.; Błaszczak, U. The impact of nickel on human health. J. Elementol. 2008, 13, 685–696. [Google Scholar]
- Toma, S.; Kreidman, J.; Vedina, O.; Veliksav, S. Some observation of fluoride problems in the Moldova Republic. Fluoride 1999, 32, 67–70. [Google Scholar]
- Vedina, O.; Kreidmann, J. Fluoride distribution in burozems of Moldova. Fluoride 1999, 32, 71. [Google Scholar]


| Facility | Current Function | Location |
|---|---|---|
| (I) smithy of horseshoes and vehicle parts | Parking space | Niemierzyńska Str. 3 |
| (II) smithy of horseshoes and vehicle parts | Small park | Grodzka Str. 10 |
| (III) smithy of horseshoes and vehicle parts | Small park | Śląska Str. 29 |
| (IV) Nail smithy | Kindergarten playground | Ofiar Oświęcimia Str. 12 |
| Element | |||||||||||
|---|---|---|---|---|---|---|---|---|---|---|---|
| Cd | Pb | Hg | Cr | Ni | Co | Mn | Zn | Cu | Fe | ||
| Mean Concentrations (mg/kg d.m.) | |||||||||||
| Depth (cm) | 0–20 | 0.384 | 72.758 | 0.185 | 12.843 | 8.018 | 3.898 | 254.204 | 147.334 | 23.683 | 9297.018 |
| 20–40 | 0.386 | 125.632 | 0.134 | 12.796 | 8.142 | 3.921 | 244.170 | 147.016 | 24.457 | 9039.099 | |
| 40–60 | 0.295 | 75.717 | 0.102 | 12.939 | 8.321 | 4.170 | 239.315 | 140.999 | 23.322 | 9662.139 | |
| 60–80 | 0.209 | 60.082 | 0.318 | 13.407 | 8.720 | 4.252 | 217.856 | 102.842 | 19.213 | 9691.489 | |
| 80–100 | 0.155 | 60.844 | 0.109 | 13.378 | 9.500 | 4.417 | 210.633 | 87.265 | 20.721 | 10,313.838 | |
| 100–120 | 0.119 | 19.320 | 0.273 | 19.301 | 14.099 | 5.040 | 300.485 | 64.471 | 13.355 | 16,501.389 | |
| 120–140 | 0.120 | 12.200 | 0.090 | 19.560 | 14.950 | 5.300 | 249.480 | 48.670 | 14.020 | 16,969.090 | |
| Thresholds (mg/kg d.m.) | |||||||||||
| Surface layer of the soil [49] | 0.5 | 50 | 2 | 150 | 25 | 20 | - | 70 | 25 | - | |
| Deeper layers of the soil [50] | 5 | 100 | 3 | 150 | 50 | 30 | - | 350 | 100 | - | |
| Mean concentration in world soils [35] | 1.1 | 27 | 0.1 | 42 | 18 | 6.9 | 418 | 62 | 14 | 3.5% * | |
| City | Pb | Zn | Cu | Ni | Cr | References |
|---|---|---|---|---|---|---|
| Warsaw (Poland) | 53 | 140 | 25 | - | 13 | [53] |
| Sevilla (Spain) | 137 | 145 | 68 | 22 | 39 | [8] |
| Ghaziabad (India) | 112 | 113 | 27 | - | 24 | [25] |
| Hong Kong (China) | 95 | 125 | 23 | 12 | 23 | [52] |
| Beijing (China) | 66 | 87 | 71 | 22 | - | [57] |
| Nanjing (China) | 104 | 96 | 104 | - | 97 | [58] |
| Changsha (China) | 89 | 276 | 51.4 | - | 121 | [59] |
| Shanghai (China) | 70 | 301 | 59 | 31 | 108 | [60] |
© 2019 by the authors. Licensee MDPI, Basel, Switzerland. This article is an open access article distributed under the terms and conditions of the Creative Commons Attribution (CC BY) license (http://creativecommons.org/licenses/by/4.0/).
Share and Cite
Kupiec, M.; Pieńkowski, P.; Bosiacka, B.; Gutowska, I.; Kupnicka, P.; Prokopowicz, A.; Chlubek, D.; Baranowska-Bosiacka, I. Old and New Threats—Trace Metals and Fluoride Contamination in Soils at Defunct Smithy Sites. Int. J. Environ. Res. Public Health 2019, 16, 819. https://doi.org/10.3390/ijerph16050819
Kupiec M, Pieńkowski P, Bosiacka B, Gutowska I, Kupnicka P, Prokopowicz A, Chlubek D, Baranowska-Bosiacka I. Old and New Threats—Trace Metals and Fluoride Contamination in Soils at Defunct Smithy Sites. International Journal of Environmental Research and Public Health. 2019; 16(5):819. https://doi.org/10.3390/ijerph16050819
Chicago/Turabian StyleKupiec, Michał, Paweł Pieńkowski, Beata Bosiacka, Izabela Gutowska, Patrycja Kupnicka, Adam Prokopowicz, Dariusz Chlubek, and Irena Baranowska-Bosiacka. 2019. "Old and New Threats—Trace Metals and Fluoride Contamination in Soils at Defunct Smithy Sites" International Journal of Environmental Research and Public Health 16, no. 5: 819. https://doi.org/10.3390/ijerph16050819
APA StyleKupiec, M., Pieńkowski, P., Bosiacka, B., Gutowska, I., Kupnicka, P., Prokopowicz, A., Chlubek, D., & Baranowska-Bosiacka, I. (2019). Old and New Threats—Trace Metals and Fluoride Contamination in Soils at Defunct Smithy Sites. International Journal of Environmental Research and Public Health, 16(5), 819. https://doi.org/10.3390/ijerph16050819