Acute Effects of Air Pollution and Noise from Road Traffic in a Panel of Young Healthy Adults

 ,
, 
Abstract
:1. Introduction
2. Materials and Methods
3. Results
3.1. Participants and Exposure
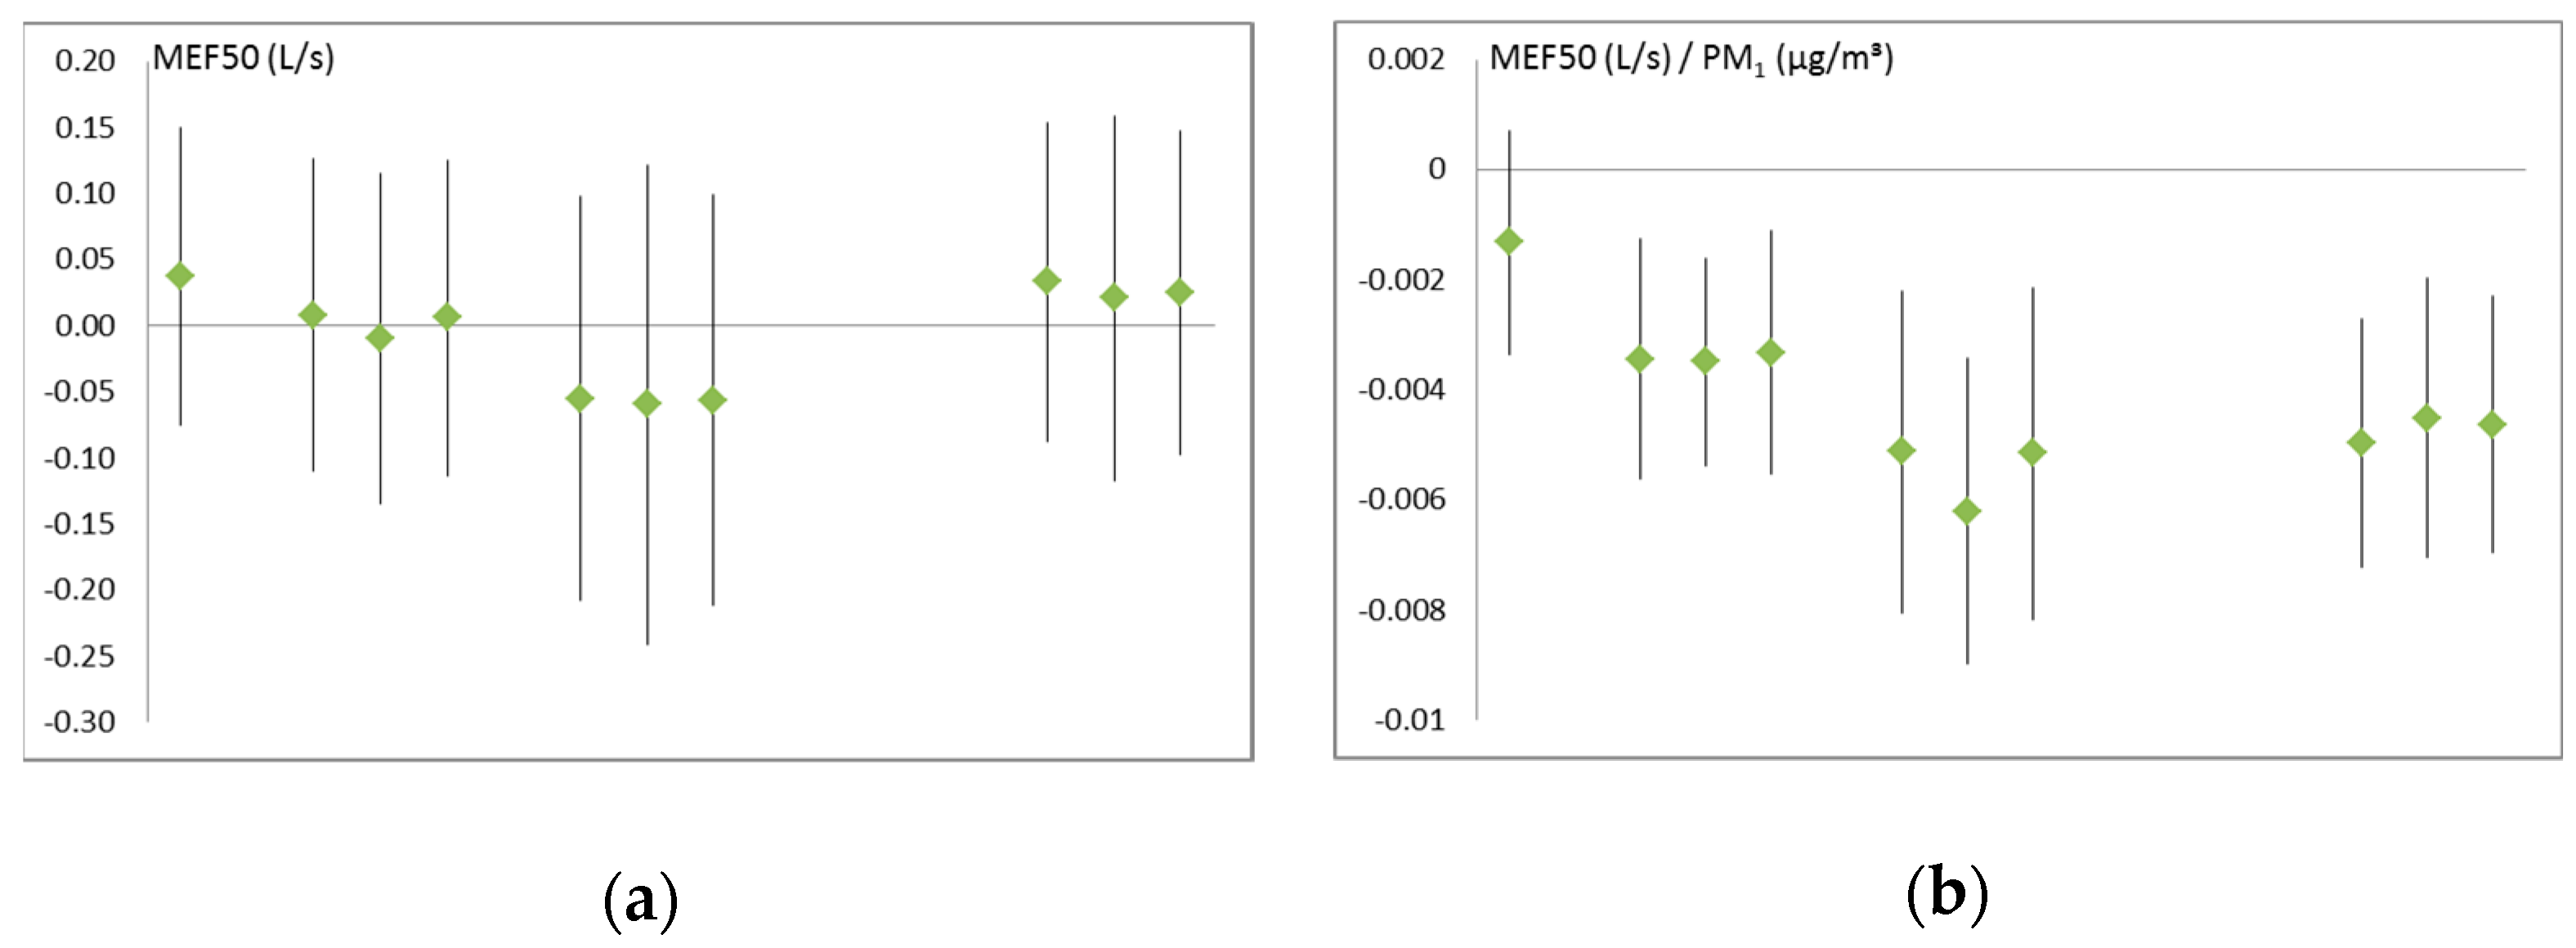
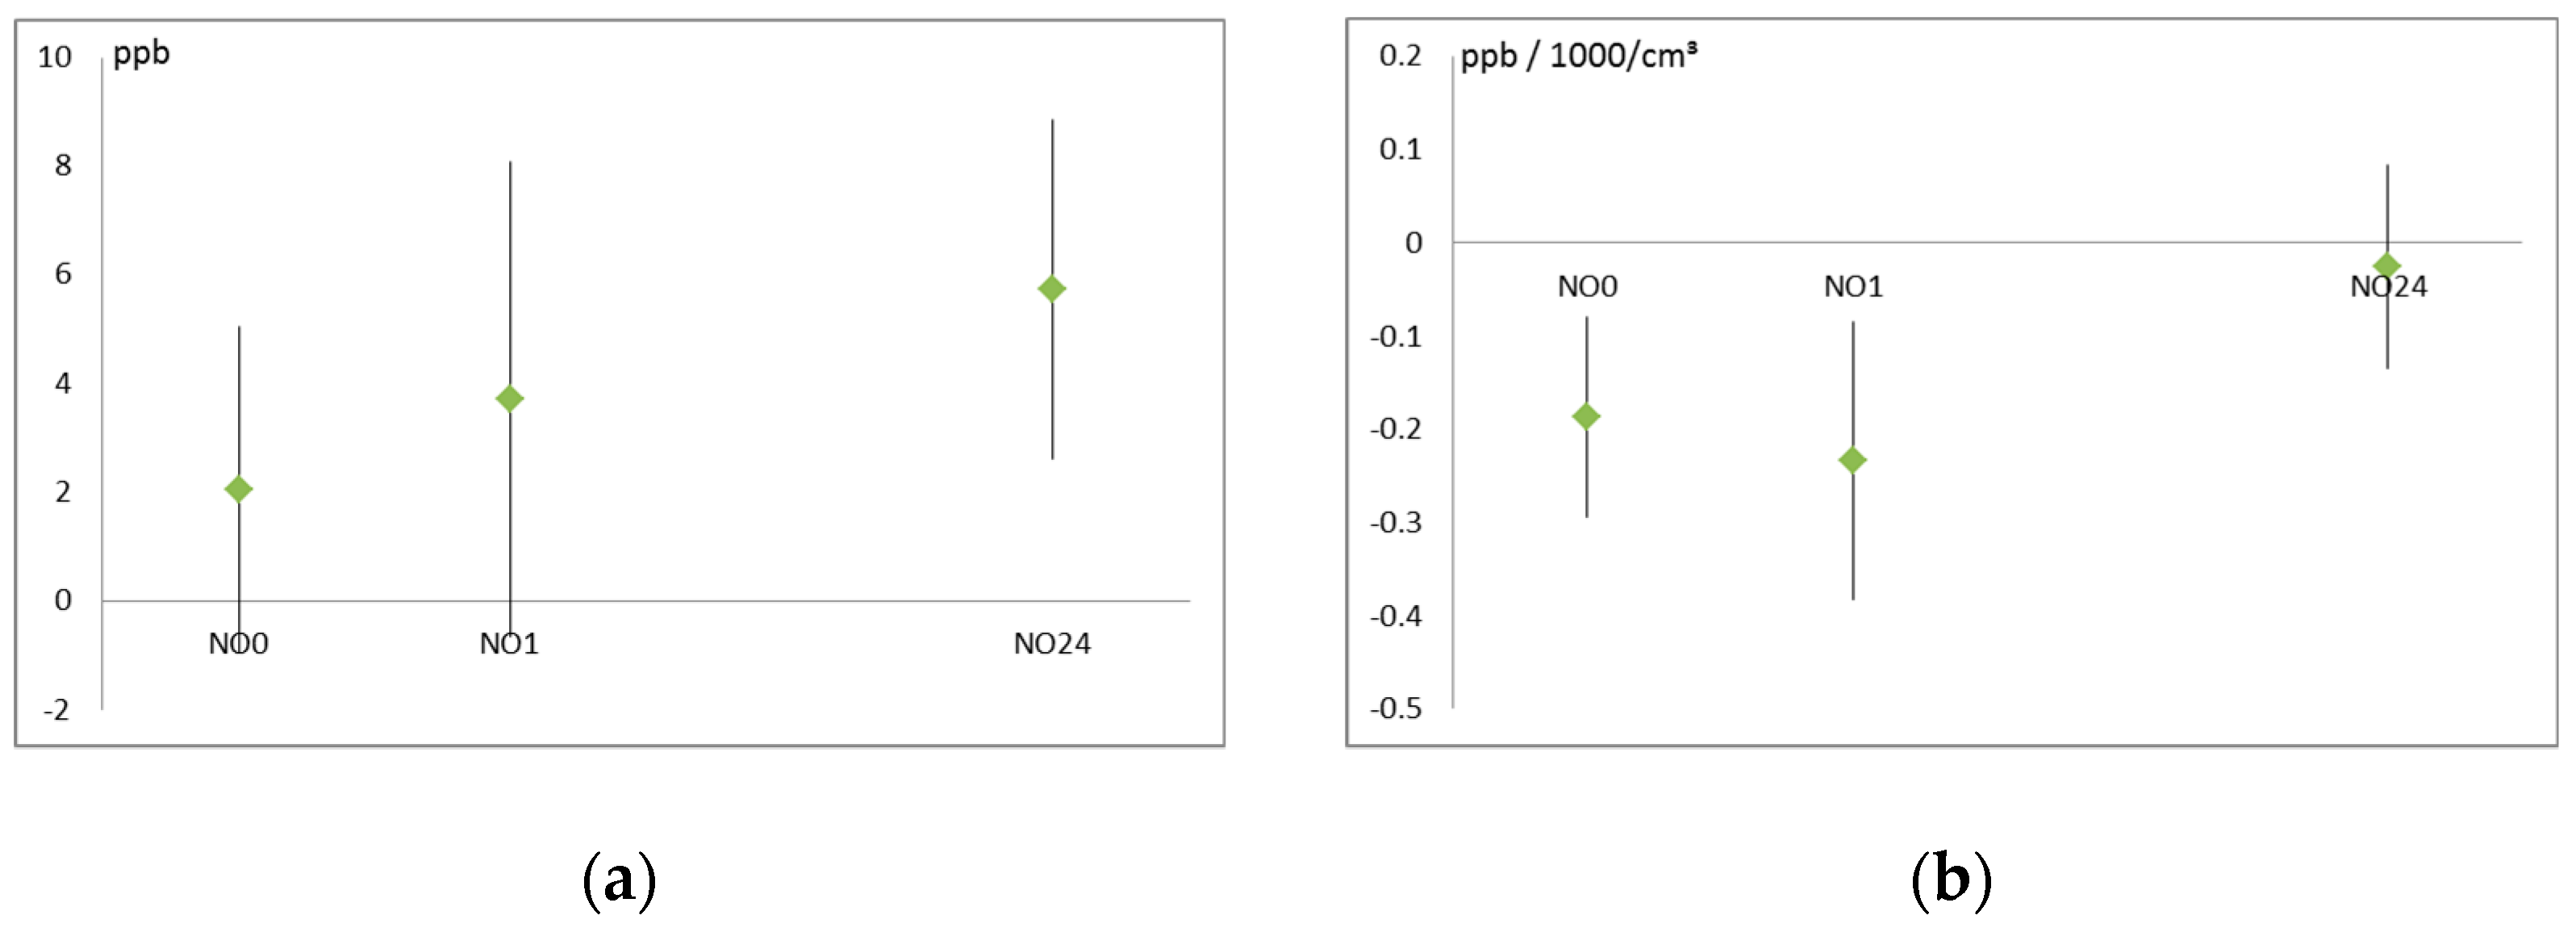
3.2. Air Pollution and Respiratory Health
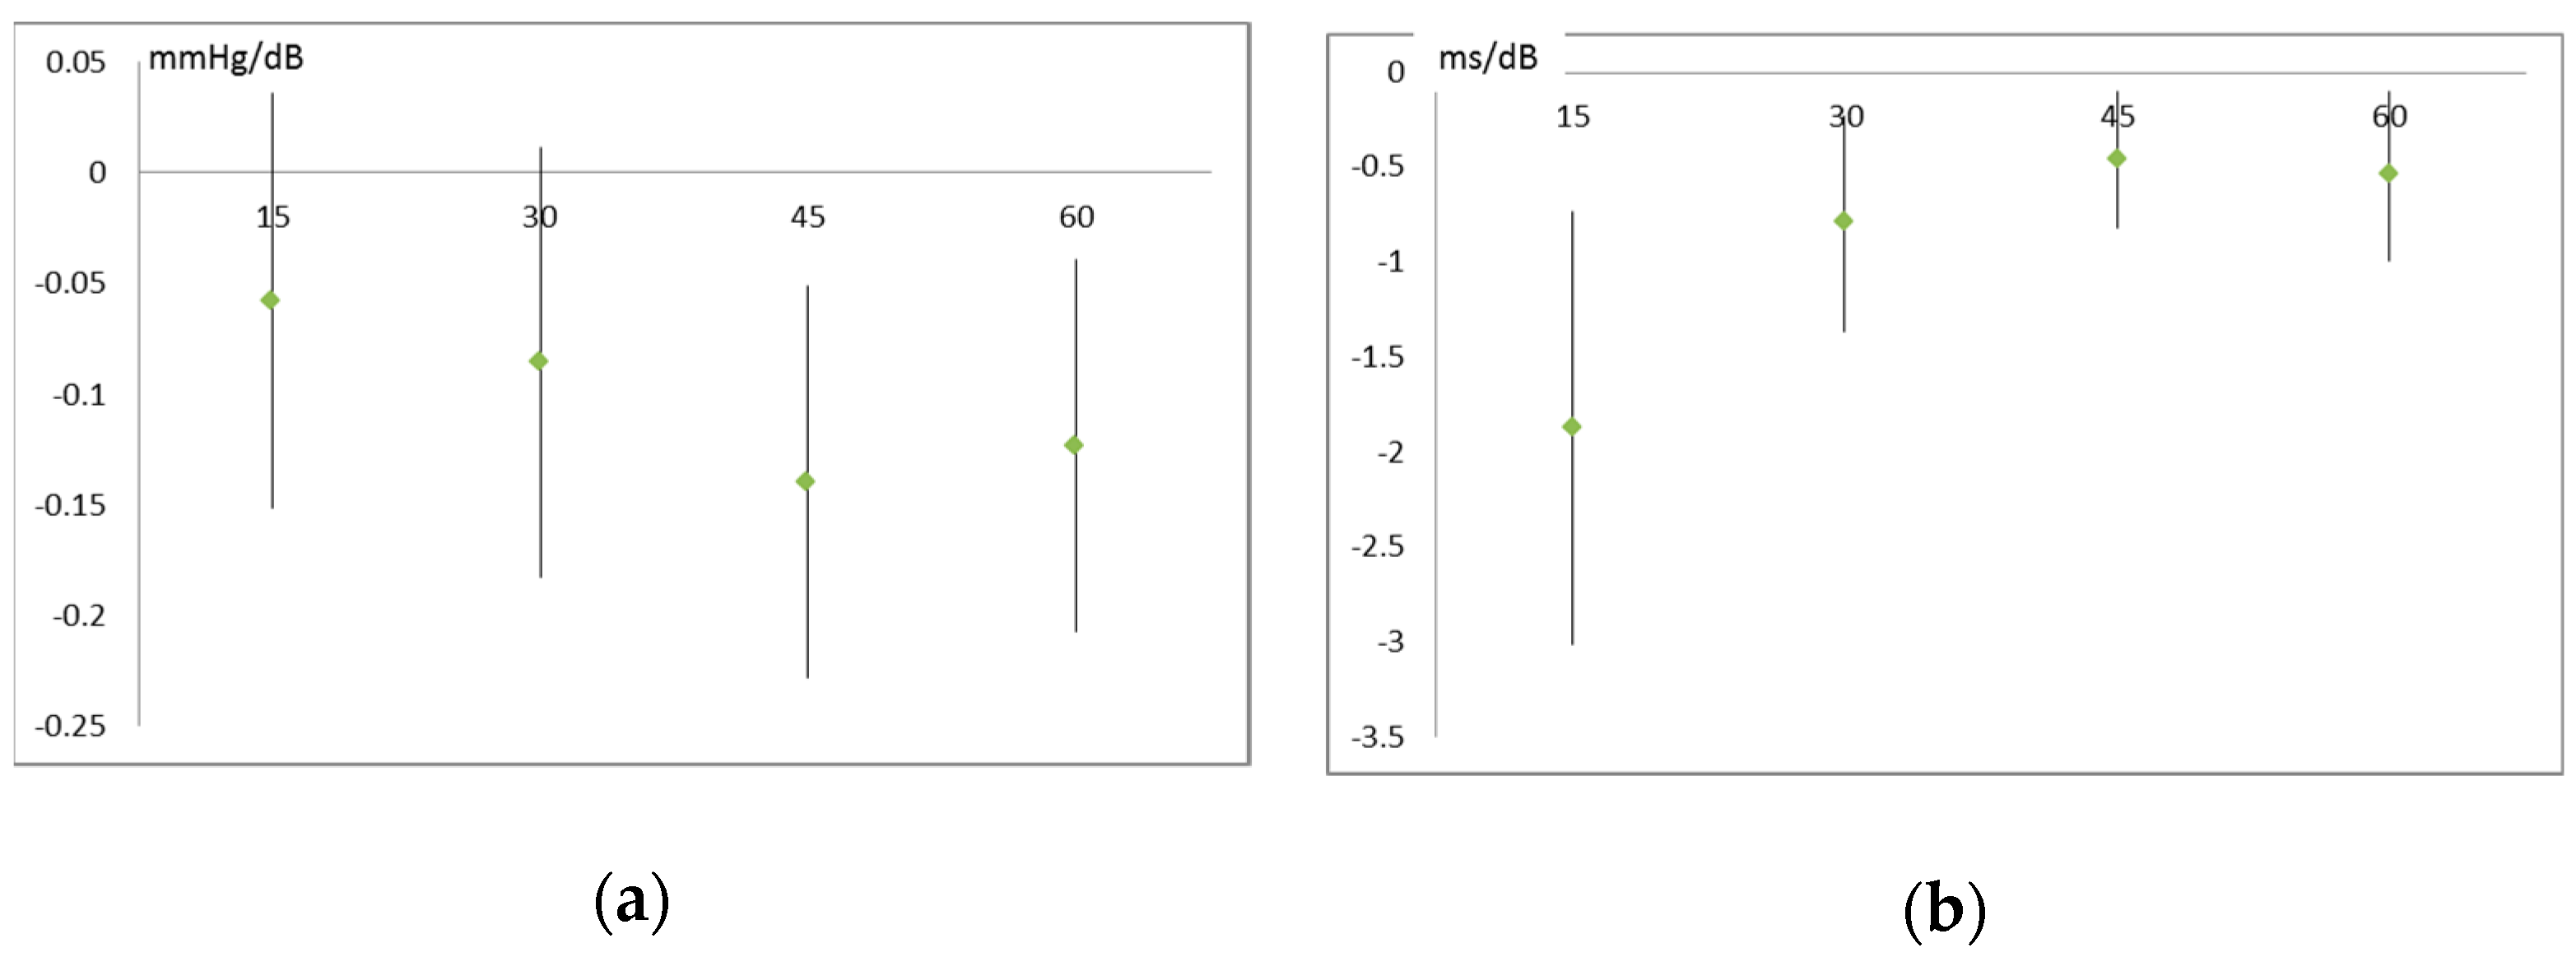
3.3. Air Pollution and Noise Effects on Cardiovascular System
4. Discussion
5. Conclusions
Author Contributions
Funding
Conflicts of Interest
Abbreviations
Appendix A

| Lung Function Value | Immediately After Walk | 1 h After Walk | 24 h After Walk |
|---|---|---|---|
| PM10 Fixed Station (µg/m³) | |||
| FVC (mL) | −0.52 (0.53) | −0.71 (0.25) | 0.05 (0.92) |
| FEV 1 (mL) | −1.39 (0.076) | −1.62 (0.007) | −1.04 (0.048) |
| PEF (mL/s) | −5.47 (0.012) | −4.68 (0.056) | −1.36 (0.48) |
| MMEF (mL/s) | −4.02 (0.004) | −4.13 (0.005) | −4.54 (0.001) |
| MEF 75 (mL/s) | −6.56 (0.002) | −8.79 (<0.001) | −2.05 (0.91) |
| MEF 50 (mL/s) | −4.53 (0.005) | −7.12 (0.001) | −5.78 (0.001) |
| MEF 25 (mL/s) | −2.61 (0.024) | −3.14 (0.076) | −4.93 (<0.001) |
| Road versus park | |||
| FVC (mL) | 3.96 (0.89) | 4.42 (0.85) | −50.03 (0.005) |
| FEV 1 (mL) | 26.28 (0.37) | 20.35 (0.37) | −13.12 (0.49) |
| PEF (mL/s) | 301.01 (<0.001) | 316.2 (0.001) | 85.3 (0.21) |
| MMEF (mL/s) | 12.58 (0.81) | 36.2 (0.51) | 52.03 (0.31) |
| MEF 75 (mL/s) | 90.02 (0.26) | 180.3 (0.06) | 75.02 (0.24) |
| MEF 50 (mL/s) | 7.95 (0.89) | −55.3 (0.48) | 33.1 (0.59) |
| MEF 25 (mL/s) | −15.50 (0.73) | 65.2 (0.34) | 83.4 (0.052) |
| PM1 personal (µg/m³) | |||
| FVC (mL) | -0.21 (0.72) | −0.34 (0.44) | −0.50 (0.16) |
| FEV 1 (mL) | -0.90 (0.11) | −1.05 (0.011) | −1.10 (0.002) |
| PEF (mL/s) | −3.30 (0.043) | −2.07 (0.26) | −1.03 (0.44) |
| MMEF (mL/s) | −2.98 (0.003) | −2.93 (0.004) | −3.69 (<0.001) |
| MEF 75 (mL/s) | −4.15 (0.007) | −5.27 (0.004) | −0.08 (0.95) |
| MEF 50 (mL/s) | −3.44 (0.002) | −5.13 (0.001) | −4.96 (<0.001) |
| MEF 25 (mL/s) | −2.11 (0.011) | −1.87 (0.045) | −3.42 (<0.001) |
| Particle number personal (1000/cm³) | |||
| FVC (mL) | 0.52 (0.66) | −0.58 (0.49) | −1.33 (0.034) |
| FEV 1 (mL) | −1.22 (0.29) | −1.59 (0.041) | −1.44 (0.030) |
| PEF (mL/s) | 2.27 (0.48) | 3.73 (0.29) | 0.67 (0.79) |
| MMEF (mL/s) | −4.42 (0.028) | −5.04 (0.009) | −3.60 (0.052) |
| MEF 75 (mL/s) | −3.67 (0.25) | −5.14 (0.16) | 3.16 (0.17) |
| MEF 50 (mL/s) | −5.22 (0.018) | −8.57 (<0.001) | −6.11 (0.004) |
| MEF 25 (mL/s) | −3.72 (0.022) | −3.59 (0.040) | −2.91 (0.065) |
| Parameter | After 15 min | After 30 min | After 45 min | After 60 min |
|---|---|---|---|---|
| PM2.5 Personal (Per 10 µg/m³) | ||||
| Systolic blood pressure (mm Hg) | 0.76 (<0.001) | 0.50 (0.027) | 0.47 (0.030) | 0.59 (0.005) |
| Diastolic blood pressure (mm Hg) | 0.13 (0.47) | 0.31 (0.065) | 0.24 (0.153) | 0.45 (0.018) |
| RR Distance (ms) | −1.33 (0.38) | −0.76 (0.58) | −1.02 (0.43) | −0.44 (0.75) |
| SDNN (ms) | 0.56 (0.82) | 0.58 (0.66) | −0.21 (0.81) | −0.13 (0.91) |
| RMSSD (ms) | 0.59 (0.86) | 0.66 (0.71) | 0.70 (0.48) | 1.0 (0.46) |
| TINN (ms) | −2.55 (0.26) | −2.58 (0.26) | −4.31 (0.050) | −1.26 (0.66) |
| VLF power (ms²) | −1,450,303 (0.88) | 15,163.69 (0.96) | −37.55 (0.84) | −276.43 (0.95) |
| LF power (ms²) | −37,656.63 (0.88) | 411.598 (0.93) | 79.77 (0.50) | −229.68 (0.96) |
| HF power (ms²) | −406.77 (0.93) | 146.667 (0.64) | 146.4 (0.48) | 176.63 (0.81) |
| Particle number personal (1000/cm³) | ||||
| Systolic blood pressure (mm Hg) | 0.23 (<0.001) | 0.03 (0.48) | 0.04 (0.28) | 0.04 (0.26) |
| Diastolic blood pressure (mm Hg) | 0.06 (0.27) | 0.005 (0.89) | −0.02 (0.54) | 0.02 (0.44) |
| RR Distance (ms) | −0.18 (0.73) | −0.70 (0.004) | −0.35 (0.097) | −0.10 (0.62) |
| SDNN (ms) | 1.91 (0.050) | 0.09 (0.77) | 0.10 (0.57) | 0.15 (0.47) |
| RMSSD (ms) | 2.28 (0.078) | 0.03 (0.95) | 0.08 (0.71) | 0.25 (0.33) |
| TINN (ms) | 1.0 (0.89) | −0.02 (0.96) | −0.73 (0.055) | 0.21 (0.66) |
| VLF power (ms²) | 585,269 (0.12) | 3567.7 (0.96) | 34.1 (0.39) | 1,159.9 (0.22) |
| LF power (ms²) | 152,900 (0.12) | 103.3 (0.93) | 24.0 (0.35) | 1,238.5 (0.22) |
| HF power (ms²) | 2,762 (0.11) | 28.5 (0.71) | 45.5 (0.30) | 217.6 (0.14) |
| Noise personal (dB) | ||||
| Systolic blood pressure (mm Hg) | −0.08 (0.22) | −0.09 (0.083) | −0.14 (0.002) | −0.12 (0.004) |
| Diastolic blood pressure (mm Hg) | −0.04 (031) | −0.10 (0.008) | −0.09 (0.012) | −0.08 (0.045) |
| RR Distance (ms) | −0.53 (0.12) | 0.13 (0.68) | 0.34 (0.19) | 0.11 (0.69) |
| SDNN (ms) | −1.87 (0.001) | −0.79 (0.006) | −0.46 (0.012) | −0.54 (0.018) |
| RMSSD (ms) | −2.27 (0.003) | −1.00 (0.011) | −0.60 (0.004) | −0.55 (0.048) |
| TINN (ms) | −0.74 (0.15) | −0.95 (0.053) | −0.83 (0.076) | −1.25 (0026) |
| VLF power (ms²) | −5,602,436 (0.012) | −147,929 (0.018) | −99.1 (0.013) | −495.9 (0.63) |
| LF power (ms²) | −146,317 (0.012) | −2634 (0.017) | −66.0 (0.008) | −451.5 (0.68) |
| HF power (ms²) | −2,673(0.009) | −156.5 (0.010) | −102.5 (0.018) | −203.3 (0.19) |
| Abbreviation | Explanation |
|---|---|
| Exposure Metrics | |
| PM10 | Mass (in µg/m³) of air-borne particles with an aerodynamic diameter of less than 10 µm |
| PM2.5 | As above, but diameter less than 2.5 µm |
| PM1 | As above, but diameter less than 1 µm |
| PN | Air-borne particle number concentration (in particles/cm³) |
| dB | A-weighted noise pressure level (decibel) |
| Lung function values | |
| FVC | Maximal exhalable air volume (L) |
| FEV 1 | Maximal air volume exhaled in the first second (L) |
| PEF | Peak flow (L/s) |
| MMEF | Maximal mean expiratory flow (between 25 and 75% of FVC, L/s) |
| MEF 75 | Maximal expiratory flow when 75% of FVC are still left in the lung (L/s) |
| MEF 50 | As above, but with 50% of FVC left (L/s) |
| MEF 25 | As above, but with 25% of FVC left (L/s) |
| Heart Rate | |
| RR Distance | Mean distance between two heart-beats (in ms) |
| Heart Rate Variability (HRV) | |
| SDNN | Standard deviation of NN intervals (in ms) |
| RMSSD | Root mean square of successive RR interval differences (in ms) |
| TINN | Baseline width of the RR interval histogram (in ms) |
| VLF power * | Absolute power of the very-low-frequency band (0.0033–0.04 Hz) |
| LF power * | Absolute power of the low-frequency band (0.04–0.15 Hz) |
| HF power * | Absolute power of the high-frequency band (0.15–0.4 Hz) |
References
- Neuberger, M.; Moshammer, H.; Rabczenko, D. Acute and subacute effects of urban air pollution on cardiopulmonary emergencies and mortality: Time series studies in Austrian cities. Int. J. Environ. Res. Public Health 2013, 10, 4728–4751. [Google Scholar] [CrossRef] [PubMed]
- Neuberger, M.; Rabczenko, D.; Moshammer, H. Extended effects of air pollution on cardiopulmonary mortality in Vienna. Atmos. Environ. 2007, 41, 8549–8556. [Google Scholar] [CrossRef]
- Levy, J.I.; Diez, D.; Dou, Y.; Barr, C.D.; Dominici, F. A Meta-Analysis and Multisite Time-Series Analysis of the Differential Toxicity of Major Fine Particulate Matter Constituents. Am. J. Epidemiol. 2012, 175, 1091–1099. [Google Scholar] [CrossRef] [PubMed]
- Lee, H.; Honda, Y.; Hashizume, M.; Guo, Y.L.; Wu, C.F.; Kan, H.; Jung, K.; Lim, Y.H.; Yi, S.; Kim, H. Short-term exposure to fine and coarse particles and mortality: A multicity time-series study in East Asia. Environ. Pollut. 2015, 207, 43–51. [Google Scholar] [CrossRef] [PubMed]
- Katsouyanni, K.; Touloumi, G.; Spix, C.; Schwartz, J.; Balducci, F.; Medina, S.; Rossi, G.; Wojtyniak, B.; Sunyer, J.; Bacharova, L.; et al. Short-term effects of ambient sulphur dioxide and particulate matter on mortality in 12 European cities: Results from time series data from the APHEA project. BMJ 1997, 314, 1658–1663. [Google Scholar] [CrossRef] [PubMed]
- Li, Y.R.; Xiao, C.C.; Li, J.; Tang, J.; Geng, X.Y.; Cui, L.J.; Zhai, J.X. Association between air pollution and upper respiratory tract infection in hospital outpatients aged 0–14 years in Hefei, China: A time series study. Public Health 2018, 156, 92–100. [Google Scholar] [CrossRef] [PubMed]
- Bloemsma, L.D.; Hoek, G.; Smit, L.A. Panel studies of air pollution in patients with COPD: Systematic review and meta-analysis. Environ. Res. 2016, 151, 458–468. [Google Scholar] [CrossRef] [PubMed]
- Buteau, S.; Goldberg, M.S. A structured review of panel studies used to investigate associations between ambient air pollution and heart rate variability. Environ. Res. 2016, 148, 207–247. [Google Scholar] [CrossRef] [PubMed]
- Li, H.; Wu, S.; Pan, L.; Xu, J.; Shan, J.; Yang, X.; Dong, W.; Deng, F.; Chen, Y.; Shima, M.; et al. Short-term effects of various ozone metrics on cardiopulmonary function in chronic obstructive pulmonary disease patients: Results from a panel study in Beijing, China. Environ. Pollut. 2018, 232, 358–366. [Google Scholar] [CrossRef] [PubMed]
- Chen, S.; Gu, Y.; Qiao, L.; Wang, C.; Song, Y.; Bai, C.; Sun, Y.; Ji, H.; Zhou, M.; Wang, H.; et al. Fine Particulate Constituents and Lung Dysfunction: A Time-Series Panel Study. Environ. Sci. Technol. 2017, 51, 1687–1694. [Google Scholar] [CrossRef] [PubMed]
- Ni, Y.; Wu, S.; Ji, W.; Chen, Y.; Zhao, B.; Shi, S.; Tu, X.; Li, H.; Pan, L.; Deng, F.; et al. The exposure metric choices have significant impact on the association between short-term exposure to outdoor particulate matter and changes in lung function: Findings from a panel study in chronic obstructive pulmonary disease patients. Sci. Total Environ. 2016, 542, 264–270. [Google Scholar] [CrossRef] [PubMed]
- Prieto-Parra, L.; Yohannessen, K.; Brea, C.; Vidal, D.; Ubilla, C.A.; Ruiz-Rudolph, P. Air pollution, PM2.5 composition, source factors, and respiratory symptoms in asthmatic and nonasthmatic children in Santiago, Chile. Environ. Int. 2017, 101, 190–200. [Google Scholar] [CrossRef] [PubMed]
- Cortez-Lugo, M.; Ramírez-Aguilar, M.; Pérez-Padilla, R.; Sansores-Martínez, R.; Ramírez-Venegas, A.; Barraza-Villarreal, A. Effect of Personal Exposure to PM2.5 on Respiratory Health in a Mexican Panel of Patients with COPD. Int. J. Environ. Res. Public Health 2015, 12, 10635–10647. [Google Scholar] [CrossRef] [PubMed]
- Wu, S.; Ni, Y.; Li, H.; Pan, L.; Yang, D.; Baccarelli, A.A.; Deng, F.; Chen, Y.; Shima, M.; Guo, X. Short-term exposure to high ambient air pollution increases airway inflammation and respiratory symptoms in chronic obstructive pulmonary disease patients in Beijing, China. Environ. Int. 2016, 94, 76–82. [Google Scholar] [CrossRef] [PubMed]
- Moshammer, H.; Hutter, H.-P.; Hauck, H.; Neuberger, M. Low levels of air pollution induce changes of lung function in a panel of schoolchildren. Eur. Respir. J. 2006, 27, 1138–1143. [Google Scholar] [CrossRef] [PubMed]
- Medina, S.; Plasencia, A.; Ballester, F.; Mücke, H.G.; Schwartz, J.; Apheis group. Apheis: Public health impact of PM10 in 19 European cities. J. Epidemiol. Community Health 2004, 58, 831–836. [Google Scholar] [CrossRef] [PubMed]
- Cole-Hunter, T.; Weichenthal, S.; Kubesch, N.; Foraster, M.; Carrasco-Turigas, G.; Bouso, L.; Martínez, D.; Westerdahl, D.; de Nazelle, A.; Nieuwenhuijsen, M. Impact of traffic-related air pollution on acute changes in cardiac autonomic modulation during rest and physical activity: A cross-over study. J. Expo. Sci. Environ. Epidemiol 2016, 26, 133–140. [Google Scholar] [CrossRef] [PubMed]
- Krishnan, R.M.; Sullivan, J.H.; Carlsten, C.; Wilkerson, H.W.; Beyer, R.P.; Bammler, T.; Farin, F.; Peretz, A.; Kaufman, J.D. A randomized cross-over study of inhalation of diesel exhaust, hematological indices, and endothelial markers in humans. Part Fibre Toxicol. 2013, 10, 7. [Google Scholar] [CrossRef] [PubMed]
- McCreanor, J.; Cullinan, P.; Nieuwenhuijsen, M.J.; Stewart-Evans, J.; Malliarou, E.; Jarup, L.; Harrington, R.; Svartengren, M.; Han, I.K.; Ohman-Strickland, P.; et al. Respiratory effects of exposure to diesel traffic in persons with asthma. N. Engl. J. Med. 2007, 357, 2348–2358. [Google Scholar] [CrossRef] [PubMed]
- Mirabelli, M.C.; Golan, R.; Greenwald, R.; Raysoni, A.U.; Holguin, F.; Kewada, P.; Winquist, A.; Flanders, W.D.; Sarnat, J.A. Modification of Traffic-related Respiratory Response by Asthma Control in a Population of Car Commuters. Epidemiology 2015, 26, 546–555. [Google Scholar] [CrossRef] [PubMed]
- Sarnat, J.A.; Golan, R.; Greenwald, R.; Raysoni, A.U.; Kewada, P.; Winquist, A.; Sarnat, S.E.; Dana Flanders, W.; Mirabelli, M.C.; Zora, J.E.; et al. Exposure to traffic pollution, acute inflammation and autonomic response in a panel of car commuters. Environ. Res. 2014, 133, 66–76. [Google Scholar] [CrossRef] [PubMed]
- Weichenthal, S.; Hatzopoulou, M.; Goldberg, M.S. Exposure to traffic-related air pollution during physical activity and acute changes in blood pressure, autonomic and micro-vascular function in women: A cross-over study. Part Fibre Toxicol. 2014, 11, 70. [Google Scholar] [CrossRef] [PubMed]
- Schmitz, S.; Adams, R.; Walsh, C. The use of continuous data versus binary data in MTC models: A case study in rheumatoid arthritis. BMC Med. Res. Methodol. 2012, 12, 167. [Google Scholar] [CrossRef] [PubMed]
- Magzamen, S.; Oron, A.P.; Locke, E.R.; Fan, V.S. Association of ambient pollution with inhaler use among patients with COPD: A panel study. Occup. Environ. Med. 2018, 75, 382–388. [Google Scholar] [CrossRef] [PubMed]
- Maikawa, C.L.; Weichenthal, S.; Wheeler, A.J.; Dobbin, N.A.; Smargiassi, A.; Evans, G.; Liu, L.; Goldberg, M.S.; Pollitt, K.J. Particulate Oxidative Burden as a Predictor of Exhaled Nitric Oxide in Children with Asthma. Environ. Health Perspect. 2016, 124, 1616–1622. [Google Scholar] [CrossRef] [PubMed]
- Schachter, E.N.; Moshier, E.; Habre, R.; Rohr, A.; Godbold, J.; Nath, A.; Grunin, A.; Coull, B.; Koutrakis, P.; Kattan, M. Outdoor air pollution and health effects in urban children with moderate to severe asthma. Air Qual. Atmos. Health 2016, 9, 251–263. [Google Scholar] [CrossRef]
- Loftus, C.; Yost, M.; Sampson, P.; Arias, G.; Torres, E.; Vasquez, V.B.; Bhatti, P.; Karr, C. Regional PM2.5 and asthma morbidity in an agricultural community: A panel study. Environ. Res. 2015, 136, 505–512. [Google Scholar] [CrossRef] [PubMed]
- Romieu, I.; Meneses, F.; Ruiz, S.; Huerta, J.; Sienra, J.J.; White, M.; Etzel, R.; Hernandez, M. Effects of intermittent ozone exposure on peak expiratory flow and respiratory symptoms among asthmatic children in Mexico City. Arch. Environ. Health 1997, 52, 368–375. [Google Scholar] [CrossRef] [PubMed]
- Hiltermann, T.J.N.; de Bruijne, C.R.; Stolk, J.; Zwinderman, A.H.; Spieksma, F.T.M.; Roemer, W.; Steerenberg, P.A.; Fischer, P.H.; van Bree, L.; Hiemstra, P.S. Effects of photochemical air pollution and allergen exposure on upper respiratory tract inflammation in asthmatics. Am. J. Respir. Crit. Care Med. 1997, 156, 1765–1772. [Google Scholar] [CrossRef] [PubMed]
- Rückerl, R.; Schneider, A.; Hampel, R.; Breitner, S.; Cyrys, J.; Kraus, U.; Gu, J.; Soentgen, J.; Koenig, W.; Peters, A. Association of novel metrics of particulate matter with vascular markers of inflammation and coagulation in susceptible populations—Results from a panel study. Environ. Res. 2016, 150, 337–347. [Google Scholar] [CrossRef] [PubMed]
- Wang, M.; Utell, M.J.; Schneider, A.; Zareba, W.; Frampton, M.W.; Oakes, D.; Hopke, P.K.; Wiltshire, J.; Kane, C.; Peters, A.; et al. Does total antioxidant capacity modify adverse cardiac responses associated with ambient ultrafine, accumulation mode, and fine particles in patients undergoing cardiac rehabilitation? Environ. Res. 2016, 149, 15–22. [Google Scholar] [CrossRef] [PubMed]
- Goldberg, M.S.; Wheeler, A.J.; Burnett, R.T.; Mayo, N.E.; Valois, M.F.; Brophy, J.M.; Giannetti, N. Physiological and perceived health effects from daily changes in air pollution and weather among persons with heart failure: A panel study. J. Expo. Sci. Environ. Epidemiol. 2015, 25, 187–199. [Google Scholar] [CrossRef] [PubMed]
- Link, M.S.; Luttmann-Gibson, H.; Schwartz, J.; Mittleman, M.A.; Wessler, B.; Gold, D.R.; Dockery, D.W.; Laden, F. Acute Exposure to Air Pollution Triggers Atrial Fibrillation. J. Am. Coll. Cardiol. 2013, 62, 816–825. [Google Scholar] [CrossRef] [PubMed]
- Imaizumi, Y.; Eguchi, K.; Kario, K. Coexistence of PM2.5 and low temperature is associated with morning hypertension in hypertensives. Clin. Exp. Hypertens. 2015, 37, 468–472. [Google Scholar] [CrossRef] [PubMed]
- Stieb, D.M.; Shutt, R.; Kauri, L.; Mason, S.; Chen, L.; Szyszkowicz, M.; Dobbin, N.A.; Rigden, M.; Jovic, B.; Mulholland, M.; et al. Cardio-Respiratory Effects of Air Pollution in a Panel Study of Outdoor Physical Activity and Health in Rural Older Adults. J. Occup. Environ. Med. 2017, 59, 356–364. [Google Scholar] [CrossRef] [PubMed]
- Hassanvand, M.; Naddafi, K.; Kashani, H.; Faridi, S.; Kunzli, N.; Nabizadeh, R.; Momeniha, F.; Gholampour, A.; Arhami, M.; Zare, A.; et al. Short-term effects of particle size fractions on circulating biomarkers of inflammation in a panel of elderly subjects and healthy young adults. Environ. Pollut. 2017, 223, 695–704. [Google Scholar] [CrossRef] [PubMed]
- Karottki, D.G.; Spilak, M.; Frederiksen, M.; Jovanovic Andersen, Z.; Madsen, A.M.; Ketzel, M.; Massling, A.; Gunnarsen, L.; Møller, P.; Loft, S. Indoor and outdoor exposure to ultrafine, fine and microbiologically derived particulate matter related to cardiovascular and respiratory effects in a panel of elderly urban citizens. Int. J. Environ. Res. Public Health 2015, 12, 1667–1686. [Google Scholar] [CrossRef] [PubMed]
- Zhang, X.; Staimer, N.; Tjoa, T.; Gillen, D.L.; Schauer, J.J.; Shafer, M.M.; Hasheminassab, S.; Pakbin, P.; Longhurst, J.; Sioutas, C.; et al. Associations between microvascular function and short-term exposure to traffic-related air pollution and particulate matter oxidative potential. Environ. Health 2016, 15, 81. [Google Scholar] [CrossRef] [PubMed]
- Huang, W.; Wang, L.; Li, J.; Liu, M.; Xu, H.; Liu, S.; Chen, J.; Zhang, Y.; Morishita, M.; Bard, R.L.; et al. Short-Term Blood Pressure Responses to Ambient Fine Particulate Matter Exposures at the Extremes of Global Air Pollution Concentrations. Am. J. Hypertens. 2018, 31, 590–599. [Google Scholar] [CrossRef] [PubMed]
- Shutt, R.H.; Kauri, L.M.; Weichenthal, S.; Kumarathasan, P.; Vincent, R.; Thomson, E.M.; Liu, L.; Mahmud, M.; Cakmak, S.; Dales, R. Exposure to air pollution near a steel plant is associated with reduced heart rate variability: A randomised crossover study. Environ. Health 2017, 16, 4. [Google Scholar] [CrossRef] [PubMed]
- Hu, L.-W.; Qian, Z.; Bloom, M.S.; Nelson, E.J.; Liu, E.; Han, B.; Zhang, N.; Liu, Y.; Ma, H.; Chen, D.-H.; et al. A panel study of airborne particulate matter concentration and impaired cardiopulmonary function in young adults by two different exposure measurement. Atmos. Environ. 2018, 180, 103–109. [Google Scholar] [CrossRef]
- Chen, R.; Zhao, Z.; Sun, Q.; Lin, Z.; Zhao, A.; Wang, C.; Xia, Y.; Xu, X.; Kan, H. Size-fractionated Particulate Air Pollution and Circulating Biomarkers of Inflammation, Coagulation, and Vasoconstriction in a Panel of Young Adults. Epidemiology 2015, 26, 328–336. [Google Scholar] [CrossRef] [PubMed]
- Chen, R.; Qiao, L.; Li, H.; Zhao, Y.; Zhang, Y.; Xu, W.; Wang, C.; Wang, H.; Zhao, Z.; Xu, X.; et al. Fine Particulate Matter Constituents, Nitric Oxide Synthase DNA Methylation and Exhaled Nitric Oxide. Environ. Sci. Technol. 2015, 49, 11859–11865. [Google Scholar] [CrossRef] [PubMed]
- Brook, R.D.; Sun, Z.; Brook, J.R.; Zhao, X.; Ruan, Y.; Yan, J.; Mukherjee, B.; Rao, X.; Duan, F.; Sun, L.; et al. Extreme Air Pollution Conditions Adversely Affect Blood Pressure and Insulin Resistance: The Air Pollution and Cardiometabolic Disease Study. Hypertension 2016, 67, 77–85. [Google Scholar] [CrossRef] [PubMed]
- Cole-Hunter, T.; de Nazelle, A.; Donaire-Gonzalez, D.; Kubesch, N.; Carrasco-Turigas, G.; Matt, F.; Foraster, M.; Martínez, T.; Ambros, A.; Cirach, M.; et al. Estimated effects of air pollution and space-time-activity on cardiopulmonary outcomes in healthy adults: A repeated measures study. Environ. Int. 2018, 111, 247–259. [Google Scholar] [CrossRef] [PubMed]
- Day, D.B.; Xiang, J.; Mo, J.; Li, F.; Chung, M.; Gong, J.; Weschler, C.J.; Ohman-Strickland, P.A.; Sundell, J.; Weng, W.; et al. Association of Ozone Exposure with Cardiorespiratory Pathophysiologic Mechanisms in Healthy Adults. JAMA Intern. Med. 2017, 177, 1344–1353. [Google Scholar] [CrossRef] [PubMed]
- Lee, M.S.; Eum, K.D.; Rodrigues, E.G.; Magari, S.R.; Fang, S.C.; Modest, G.A.; Christiani, D.C. Effects of Personal Exposure to Ambient Fine Particulate Matter on Acute Change in Nocturnal Heart Rate Variability in Subjects Without Overt Heart Disease. Am. J. Cardiol. 2016, 117, 151–156. [Google Scholar] [CrossRef] [PubMed]
- Provost, E.B.; Louwies, T.; Cox, B.; Op’t Roodt, J.; Solmi, F.; Dons, E.; Int Panis, L.; De Boever, P.; Nawrot, T.S. Short-term fluctuations in personal black carbon exposure are associated with rapid changes in carotid arterial stiffening. Environ. Int. 2016, 88, 228–234. [Google Scholar] [CrossRef] [PubMed]
- Wu, C.F.; Shen, F.H.; Li, Y.R.; Tsao, T.M.; Tsai, M.J.; Chen, C.C.; Hwang, J.S.; Hsu, S.H.; Chao, H.; Chuang, K.J.; et al. Association of short-term exposure to fine particulate matter and nitrogen dioxide with acute cardiovascular effects. Sci. Total Environ. 2016, 569–570, 300–305. [Google Scholar] [CrossRef] [PubMed]
- Jarjour, S.; Jerrett, M.; Westerdahl, D.; de Nazelle, A.; Hanning, C.; Daly, L.; Lipsitt, J.; Balmes, J. Cyclist route choice, traffic-related air pollution, and lung function: A scripted exposure study. Environ. Health 2013, 12, 14. [Google Scholar] [CrossRef] [PubMed]
- Strak, M.; Boogaard, H.; Meliefste, K.; Oldenwening, M.; Zuurbier, M.; Brunekreef, B.; Hoek, G. Respiratory health effects of ultrafine and fine particle exposure in cyclists. Occup. Environ. Med. 2010, 67, 118–124. [Google Scholar] [CrossRef] [PubMed]
- Muzet, A. Environmental noise, sleep and health. Sleep Med. Rev. 2007, 11, 135–142. [Google Scholar] [CrossRef] [PubMed]
- De Kluizenaar, Y.; Janssen, S.A.; van Lenthe, F.J.; Miedema, H.M.; Mackenbach, J.P. Long-term road traffic noise exposure is associated with an increase in morning tiredness. J. Acoust. Soc. Am. 2009, 126, 626–633. [Google Scholar] [CrossRef] [PubMed]
- Miedema, H.M.; Oudshoorn, C.G. Annoyance from transportation noise: Relationships with exposure metrics DNL and DENL and their confidence intervals. Environ Health Perspect 2001, 109, 409. [Google Scholar] [CrossRef] [PubMed]
- Fredianelli, L.; Carpita, S.; Licitra, G. A procedure for deriving wind turbine noise limits by taking into account annoyance. Sci. Total Environ. 2019, 648, 728–736. [Google Scholar] [CrossRef] [PubMed]
- Babisch, W.; Beule, B.; Schust, M.; Kersten, N.; Ising, H. Traffic noise and risk of myocardial infarction. Epidemiology 2005, 33–40. [Google Scholar] [CrossRef]
- Lercher, P.; Evans, G.W.; Meis, M. Ambient noise and cognitive processes among primary schoolchildren. Environ. Behav. 2003, 35, 725–735. [Google Scholar] [CrossRef]
- Chetoni, M.; Ascari, E.; Bianco, F.; Fredianelli, L.; Licitra, G.; Cori, L. Global noise score indicator for classroom evaluation of acoustic performances in LIFE GIOCONDA project. Noise Mapp. 2016, 3. [Google Scholar] [CrossRef]
- Van Kempen, E.; Babisch, W. The quantitative relationship between road traffic noise and hypertension: A meta-analysis. J. Hypertens. 2012, 30, 1075–1086. [Google Scholar] [CrossRef] [PubMed]
- Zambon, G.; Roman, H.; Smiraglia, M.; Benocci, R. Monitoring and prediction of traffic noise in large urban areas. Appl. Sci. 2018, 8, 251. [Google Scholar] [CrossRef]
- Zambon, G.; Benocci, R.; Bisceglie, A.; Roman, H.E.; Bellucci, P. The LIFE DYNAMAP project: Towards a procedure for dynamic noise mapping in urban areas. Appl. Acoust. 2017, 124, 52–60. [Google Scholar] [CrossRef]
- Licitra, G.; Ascari, E.; Fredianelli, L. Prioritizing Process in Action Plans: A Review of Approaches. Curr. Pollut. Rep. 2017, 3, 151–161. [Google Scholar] [CrossRef]
- Licitra, G.; Fredianelli, L.; Petri, D.; Vigotti, M.A. Annoyance evaluation due to overall railway noise and vibration in Pisa urban areas. Sci. Total Environ. 2016, 568, 1315–1325. [Google Scholar] [CrossRef] [PubMed]
- Bunn, F.; Trombetta Zannin, P.H. Assessment of railway noise in an urban setting. Appl. Acoust. 2016, 104, 16–23. [Google Scholar] [CrossRef]
- Gagliardi, P.; Fredianelli, L.; Simonetti, D.; Licitra, G. ADS-B System as a Useful Tool for Testing and Redrawing Noise Management Strategies at Pisa Airport. Acta Acust. United Acust. 2017, 103, 543–551. [Google Scholar] [CrossRef]
- Iglesias-Merchan, C.; Diaz-Balteiro, L.; Soliño, M. Transportation planning and quiet natural areas preservation: Aircraft overflights noise assessment in a National Park. Transp. Res. Part D Transp. Environ. 2015, 41, 1–12. [Google Scholar] [CrossRef]
- Kephalopoulos, S.; Paviotti, M.; Anfosso-Lédée, F.; Van Maercke, D.; Shilton, S.; Jones, N. Advances in the development of common noise assessment methods in Europe: The CNOSSOS-EU framework for strategic environmental noise mapping. Sci. Total Environ. 2014, 482, 400–410. [Google Scholar] [CrossRef] [PubMed]
- Morel, J.; Marquis-Favre, C.; Gille, L-A. Noise annoyance assessment of various urban road vehicle pass-by noises in isolation and combined with industrial noise: A laboratory study. Appl. Acoust. 2016, 101, 47–57. [Google Scholar] [CrossRef]
- Fredianelli, L.; Del Pizzo, A.; Licitra, G. Recent Developments in Sonic Crystals as Barriers for Road Traffic Noise Mitigation. Environments 2019, 6, 14. [Google Scholar] [CrossRef]
- Miller, M.R.; Crapo, R.; Hankinson, J.; Brusasco, V.; Burgos, F.; Casaburi, R.; Coates, A.; Enright, P.; van der Grinten, C.P.; Gustafsson, P.; et al. ATS/ERS Task Force. General considerations for lung function testing. Eur. Respir. J. 2005, 26, 153–161. [Google Scholar] [CrossRef] [PubMed]
- Miller, M.R.; Hankinson, J.; Brusasco, V.; Burgos, F.; Casaburi, R.; Coates, A.; Crapo, R.; Enright, P.; van der Grinten, C.P.; Gustafsson, P.; et al. ATS/ERS Task Force. Standardisation of spirometry. Eur. Respir. J. 2005, 26, 319–338. [Google Scholar] [CrossRef] [PubMed]
- American Thoracic Society; European Respiratory Society. ATS/ERS recommendations for standardized procedures for the online and offline measurement of exhaled lower respiratory nitric oxide and nasal nitric oxide, 2005. Am. J. Respir. Crit. Care Med. 2005, 171, 912–930. [Google Scholar] [CrossRef] [PubMed]
- Gemicioglu, B.; Musellim, B.; Dogan, I.; Guven, K. Fractional exhaled nitric oxide (FeNo) in different asthma phenotypes. Allergy Rhinol. 2014, 5, e157–e161. [Google Scholar] [CrossRef] [PubMed]
- Price, D.; Ryan, D.; Burden, A.; Von Ziegenweidt, J.; Gould, S.; Freeman, D.; Gruffydd-Jones, K.; Copland, A.; Godley, C.; Chisholm, A.; et al. Using fractional exhaled nitric oxide (FeNO) to diagnose steroid-responsive disease and guide asthma management in routine care. Clin. Transl. Allergy 2013, 3, 37. [Google Scholar] [CrossRef] [PubMed]
- Dweik, R.A.; Boggs, P.B.; Erzurum, S.C.; Irvin, C.G.; Leigh, M.W.; Lundberg, J.O.; Olin, A.C.; Plummer, A.L.; Taylor, D.R.; American Thoracic Society Committee on Interpretation of Exhaled Nitric Oxide Levels (FENO) for Clinical Applications. An official ATS clinical practice guideline: Interpretation of exhaled nitric oxide levels (FENO) for clinical applications. Am. J. Respir. Crit. Care Med. 2011, 184, 602–615. [Google Scholar] [CrossRef] [PubMed]
- Malinovschi, A.; Janson, C.; Holmkvist, T.; Norbäck, D.; Meriläinen, P.; Högman, M. Effect of smoking on exhaled nitric oxide and flow-independent nitric oxide exchange parameters. Eur. Respir. J. 2006, 28, 339–345. [Google Scholar] [CrossRef] [PubMed]
- Jacinto, T.; Malinovschi, A.; Janson, C.; Fonseca, J.; Alving, K. Differential effect of cigarette smoke exposure on exhaled nitric oxide and blood eosinophils in healthy and asthmatic individuals. J. Breath Res. 2017, 11, 036006. [Google Scholar] [CrossRef] [PubMed]
- Kharitonov, S.A.; Robbins, R.A.; Yates, D.; Keatings, V.; Barnes, P.J. Acute and chronic effects of cigarette smoking on exhaled nitric oxide. Am. J. Respir. Crit. Care Med. 1995, 152, 609–612. [Google Scholar] [CrossRef] [PubMed]
- Basner, M.; McGuire, S. WHO environmental noise guidelines for the European Region: A systematic review on environmental noise and effects on sleep. Int. J. Environ. Res. Public Health 2018, 15, 519. [Google Scholar] [CrossRef] [PubMed]
- Brown, A.L.; van Kamp, I. WHO environmental noise guidelines for the European Region: A systematic review of transport noise interventions and their impacts on health. Int. J. Environ. Res. Public Health 2017, 14, 873. [Google Scholar] [CrossRef] [PubMed]
- Clark, C.; Paunovic, K. WHO environmental noise guidelines for the European Region: A systematic review on environmental noise and cognition. Int. J. Environ. Res. Public Health 2018, 15, 285. [Google Scholar] [CrossRef] [PubMed]
- Clark, C.; Paunovic, K. WHO Environmental noise guidelines for the European Region: A systematic review on environmental noise and quality of life, wellbeing and mental health. Int. J. Environ. Res. Public Health 2018, 15, 2400. [Google Scholar] [CrossRef] [PubMed]
- Guski, R.; Schreckenberg, D.; Schuemer, R. WHO environmental noise guidelines for the European Region: A systematic review on environmental noise and annoyance. Int. J. Environ. Res. Public Health 2017, 14, 1539. [Google Scholar] [CrossRef] [PubMed]
- Nieuwenhuijsen, M.J.; Ristovska, G.; Dadvand, P. WHO environmental noise guidelines for the European Region: A systematic review on environmental noise and adverse birth outcomes. Int. J. Environ. Res. Public Health 2017, 14, 1252. [Google Scholar] [CrossRef] [PubMed]
- Śliwińska-Kowalska, M.; Zaborowski, K. WHO environmental noise guidelines for the European Region: A systematic review on environmental noise and permanent hearing loss and tinnitus. Int. J. Environ. Res. Public Health 2017, 14, 1139. [Google Scholar] [CrossRef] [PubMed]
- Van Kempen, E.; Casas, M.; Pershagen, G.; Foraster, M. WHO environmental noise guidelines for the European Region: A systematic review on environmental noise and cardiovascular and metabolic effects: A summary. Int. J. Environ. Res. Public Health 2018, 15, 379. [Google Scholar] [CrossRef] [PubMed]
- Gitanjali, B.; Ananth, R. Effect of acute exposure to loud occupational noise during daytime on the nocturnal sleep architecture, heart rate, and cortisol secretion in healthy volunteers. J. Occup. Health 2003, 45, 146–152. [Google Scholar] [CrossRef] [PubMed]
- Pouryaghoub, G.; Mehrdad, R.; Valipouri, A. Effect of Acute Noise Exposure on Salivary Cortisol: A Randomized Controlled Trial. Acta Med. Iran 2016, 54, 657–661. [Google Scholar] [PubMed]
- Ghotbi, M.R.; Khanjani, N.; Barkhordari, A.; Rahimi Moghadam, S.; Mozaffari, A.; Gozashti, M.H. Changes in urinary catecholamines in response to noise exposure in workers at Sarcheshmeh Copper Complex, Kerman, Iran. Environ. Monit. Assess. 2013, 185, 8809–8814. [Google Scholar] [CrossRef] [PubMed]
- Fruhstorfer, B.; Pritsch, M.G.; Pritsch, M.B.; Clement, H.W.; Wesemann, W. Effects of daytime noise load on the sleep-wake cycle and endocrine patterns in man. III. 24 hours secretion of free and sulfate conjugated catecholamines. Int. J. Neurosci. 1988, 43, 53–62. [Google Scholar] [CrossRef] [PubMed]
- Andrén, L.; Hansson, L.; Eggertsen, R.; Hedner, T.; Karlberg, B.E. Circulatory effects of noise. Acta Med. Scand. 1983, 213, 31–35. [Google Scholar] [CrossRef] [PubMed]
- Chang, L.-T.; Chuang, K.-J.; Yang, W.-T.; Wang, V.-S.; Chuang, H-C.; Bao, B-Y.; Liu, C.-S.; Chang, T.-Y. Short-term exposure to noise, fine particulate matter and nitrogen oxides on ambulatory blood pressure: A repeated-measure study. Environ. Res. 2015, 140, 634–640. [Google Scholar] [CrossRef] [PubMed]
- Wang, C.; Chen, R.; Zhao, Z.; Cai, J.; Lu, J.; Ha, S.; Xu, X.; Chen, X.; Kan, H. Particulate air pollution and circulating biomarkers among type 2 diabetic mellitus patients: The roles of particle size and time windows of exposure. Environ. Res. 2015, 140, 112–118. [Google Scholar] [CrossRef] [PubMed]
- Peters, A.; Hampel, R.; Cyrys, J.; Breitner, S.; Geruschkat, U.; Kraus, U.; Zareba, W.; Schneider, A. Elevated particle number concentrations induce immediate changes in heart rate variability: A panel study in individuals with impaired glucose metabolism or diabetes. Part. Fibre Toxicol. 2015, 12, 7. [Google Scholar] [CrossRef] [PubMed]
- Fernandes, E.C.; Silva, C.A.; Braga, A.L.; Sallum, A.M.; Campos, L.M.; Farhat, S.C. Exposure to air pollutants increased disease activity in childhood-onset systemic lupus erythematosus patients. Arthritis Care Res. (Hoboken) 2015, 67, 1609–1614. [Google Scholar] [CrossRef] [PubMed]
- Peters, A.; Wichmann, H.E.; Tuch, T.; Heinrich, J.; Heyder, J. Respiratory effects are associated with the number of ultrafine particles. Am. J. Respir. Crit. Care Med. 1997, 155, 1376–1383. [Google Scholar] [CrossRef] [PubMed]
- Morishita, M.; Bard, R.L.; Kaciroti, N.; Fitzner, C.A.; Dvonch, T.; Harkema, J.R.; Rajagopalan, S.; Brook, R.D. Exploration of the composition and sources of urban fine particulate matter associated with same-day cardiovascular health effects in Dearborn, Michigan. J. Expo. Sci. Environ. Epidemiol. 2015, 25, 145–152. [Google Scholar] [CrossRef] [PubMed]
- Shaffer, F.; Ginsberg, J.P. An Overview of Heart Rate Variability Metrics and Norms. Front. Public Health 2017, 5, 258. [Google Scholar] [CrossRef] [PubMed]

| Metric | Arithmetic Mean | ± Standard Deviation | Range |
|---|---|---|---|
| PM10 fixed station | 28.0 µg/m³ | 26.5 | 5–95 |
| PM2.5 personal | 38.7 µg/m³ | 43.5 | 2–146 |
| PM1 personal | 31.0 µg/m³ | 38.9 | 1–133 |
| PN personal | 21,347.8/cm³ | 18,826.5 | 41,989–80,0596 |
© 2019 by the authors. Licensee MDPI, Basel, Switzerland. This article is an open access article distributed under the terms and conditions of the Creative Commons Attribution (CC BY) license (http://creativecommons.org/licenses/by/4.0/).
Share and Cite
Moshammer, H.; Panholzer, J.; Ulbing, L.; Udvarhelyi, E.; Ebenbauer, B.; Peter, S. Acute Effects of Air Pollution and Noise from Road Traffic in a Panel of Young Healthy Adults. Int. J. Environ. Res. Public Health 2019, 16, 788. https://doi.org/10.3390/ijerph16050788
Moshammer H, Panholzer J, Ulbing L, Udvarhelyi E, Ebenbauer B, Peter S. Acute Effects of Air Pollution and Noise from Road Traffic in a Panel of Young Healthy Adults. International Journal of Environmental Research and Public Health. 2019; 16(5):788. https://doi.org/10.3390/ijerph16050788
Chicago/Turabian StyleMoshammer, Hanns, Julian Panholzer, Lisa Ulbing, Emanuel Udvarhelyi, Barbara Ebenbauer, and Stefanie Peter. 2019. "Acute Effects of Air Pollution and Noise from Road Traffic in a Panel of Young Healthy Adults" International Journal of Environmental Research and Public Health 16, no. 5: 788. https://doi.org/10.3390/ijerph16050788
APA StyleMoshammer, H., Panholzer, J., Ulbing, L., Udvarhelyi, E., Ebenbauer, B., & Peter, S. (2019). Acute Effects of Air Pollution and Noise from Road Traffic in a Panel of Young Healthy Adults. International Journal of Environmental Research and Public Health, 16(5), 788. https://doi.org/10.3390/ijerph16050788