Effect of Sequence of Fruit Intake in a Meal on Satiety


Abstract
1. Introduction
2. Materials and Methods
2.1. Study Population
2.2. Foods and Beverages
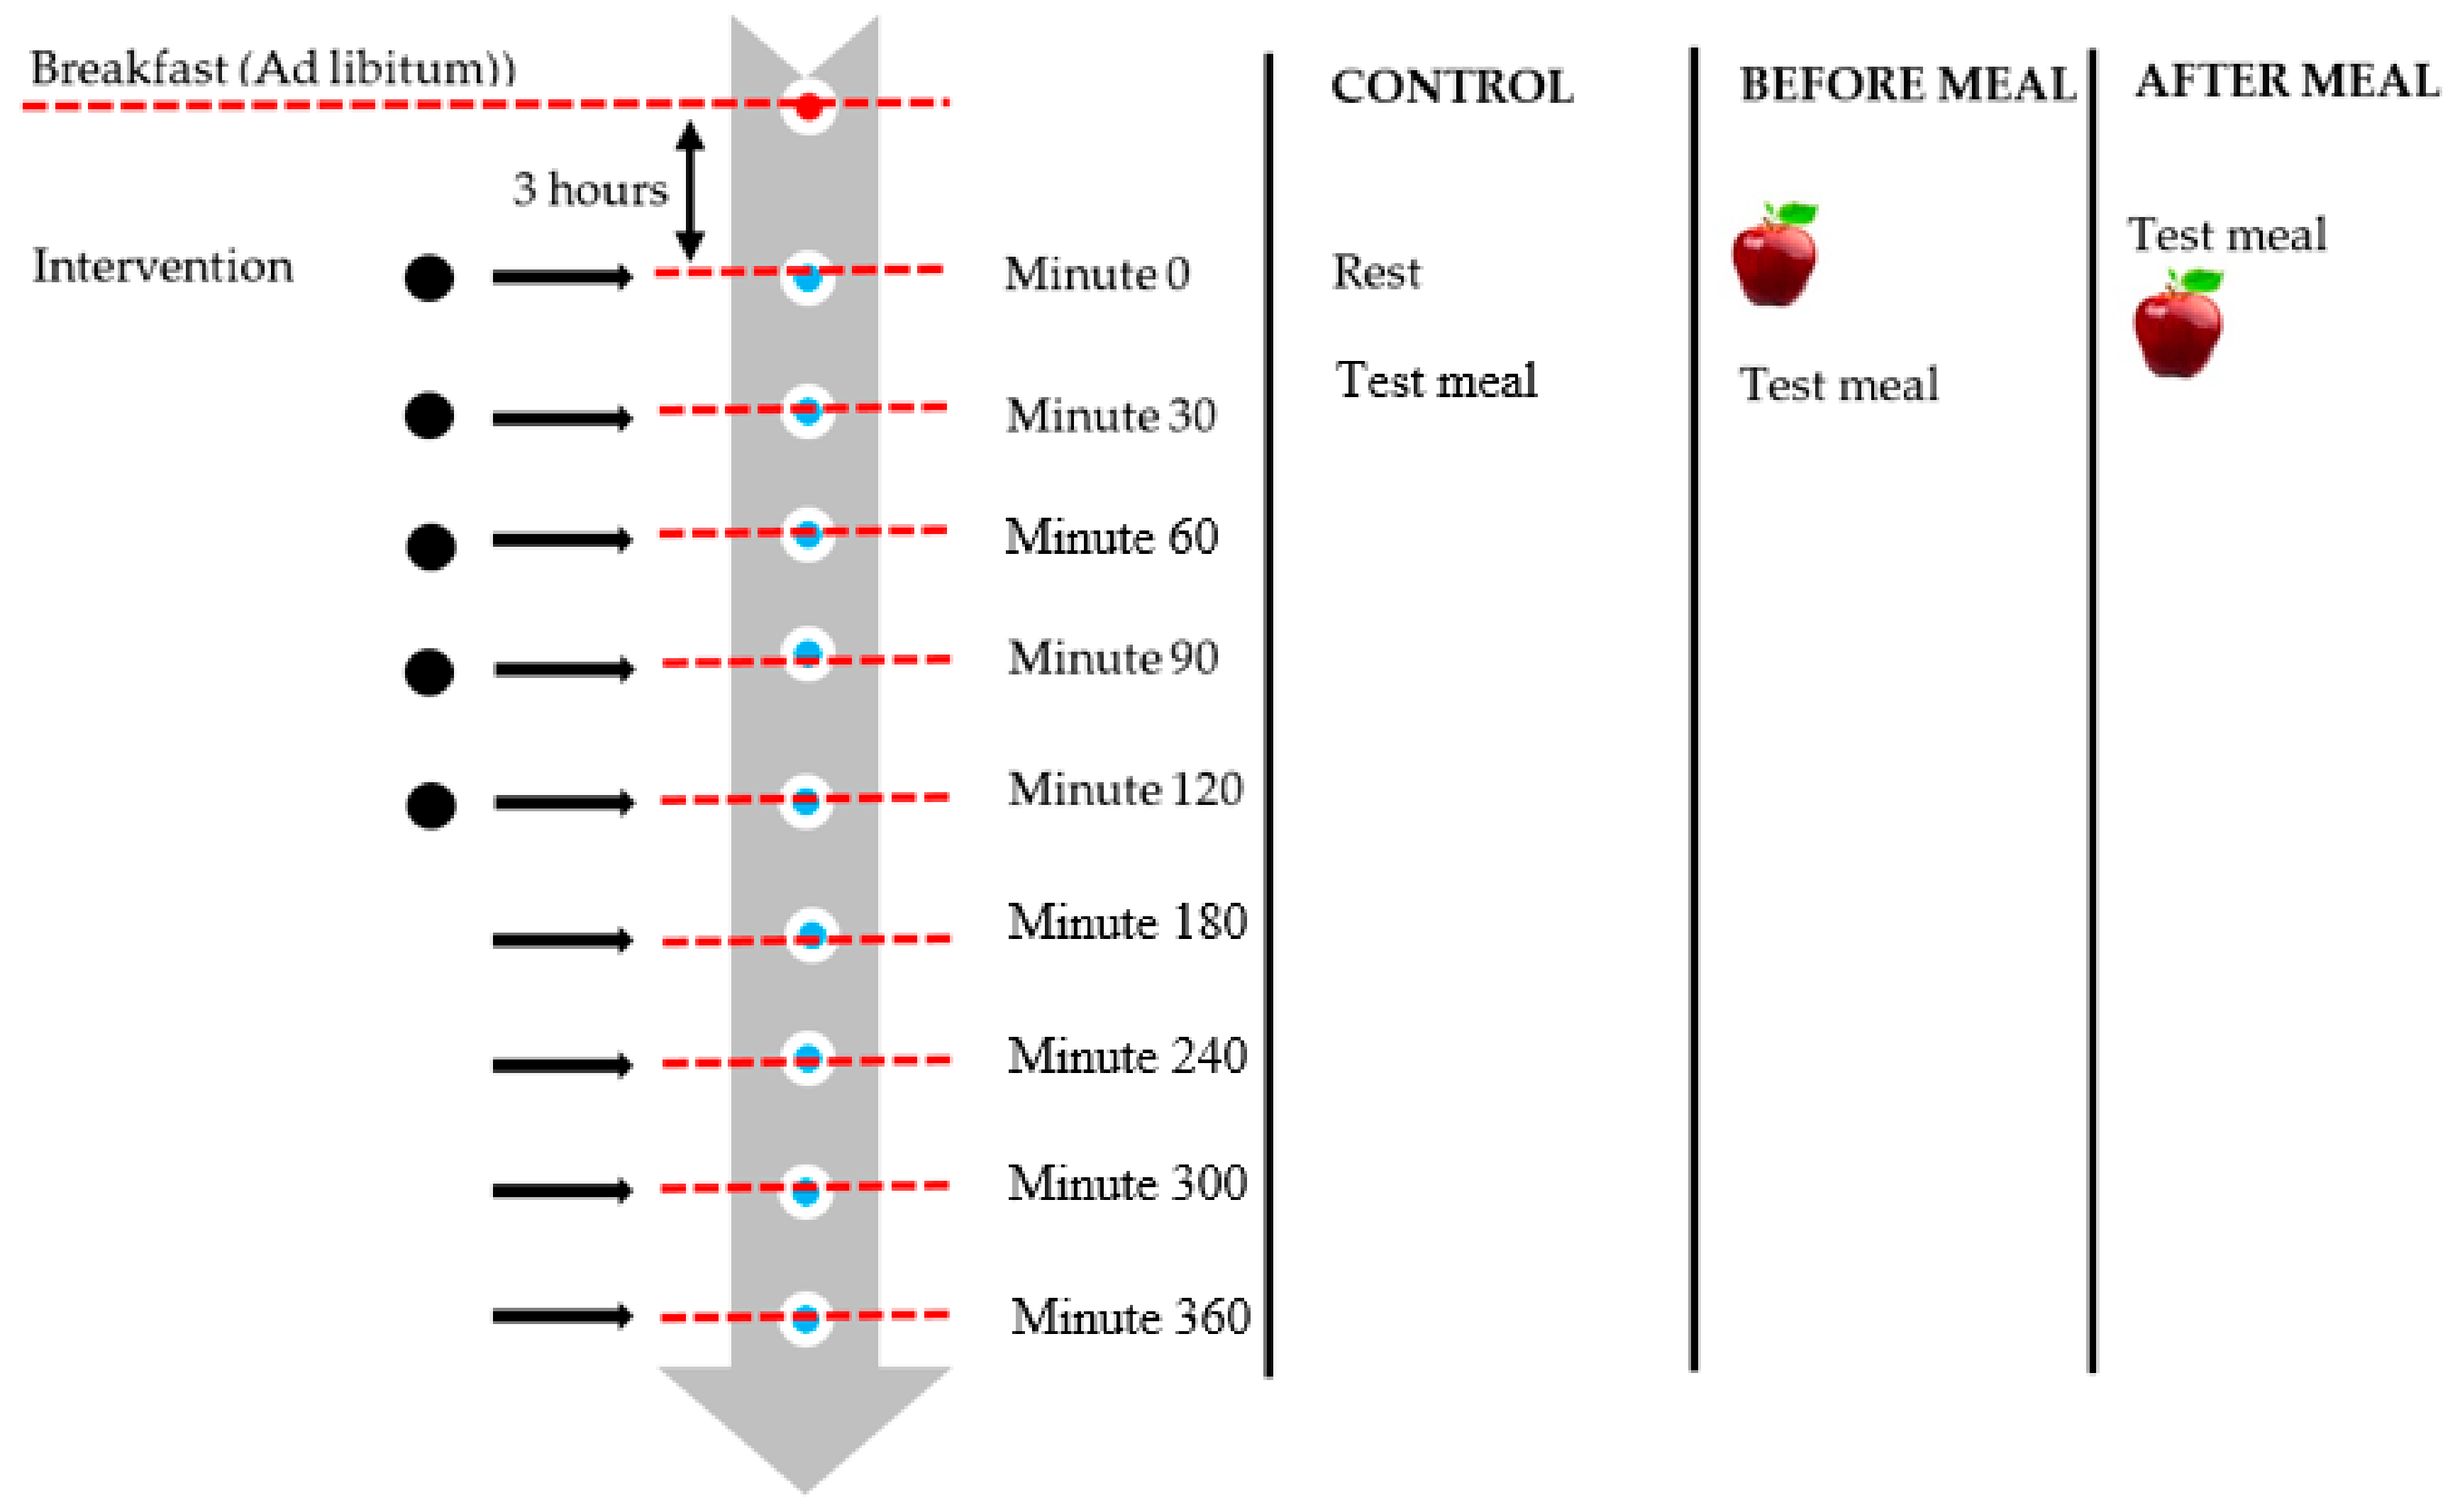
2.3. Experimental Design
2.4. Subjective Appetite Rating
2.5. Blood Analysis
2.6. Power Calculation
2.7. Data Analysis
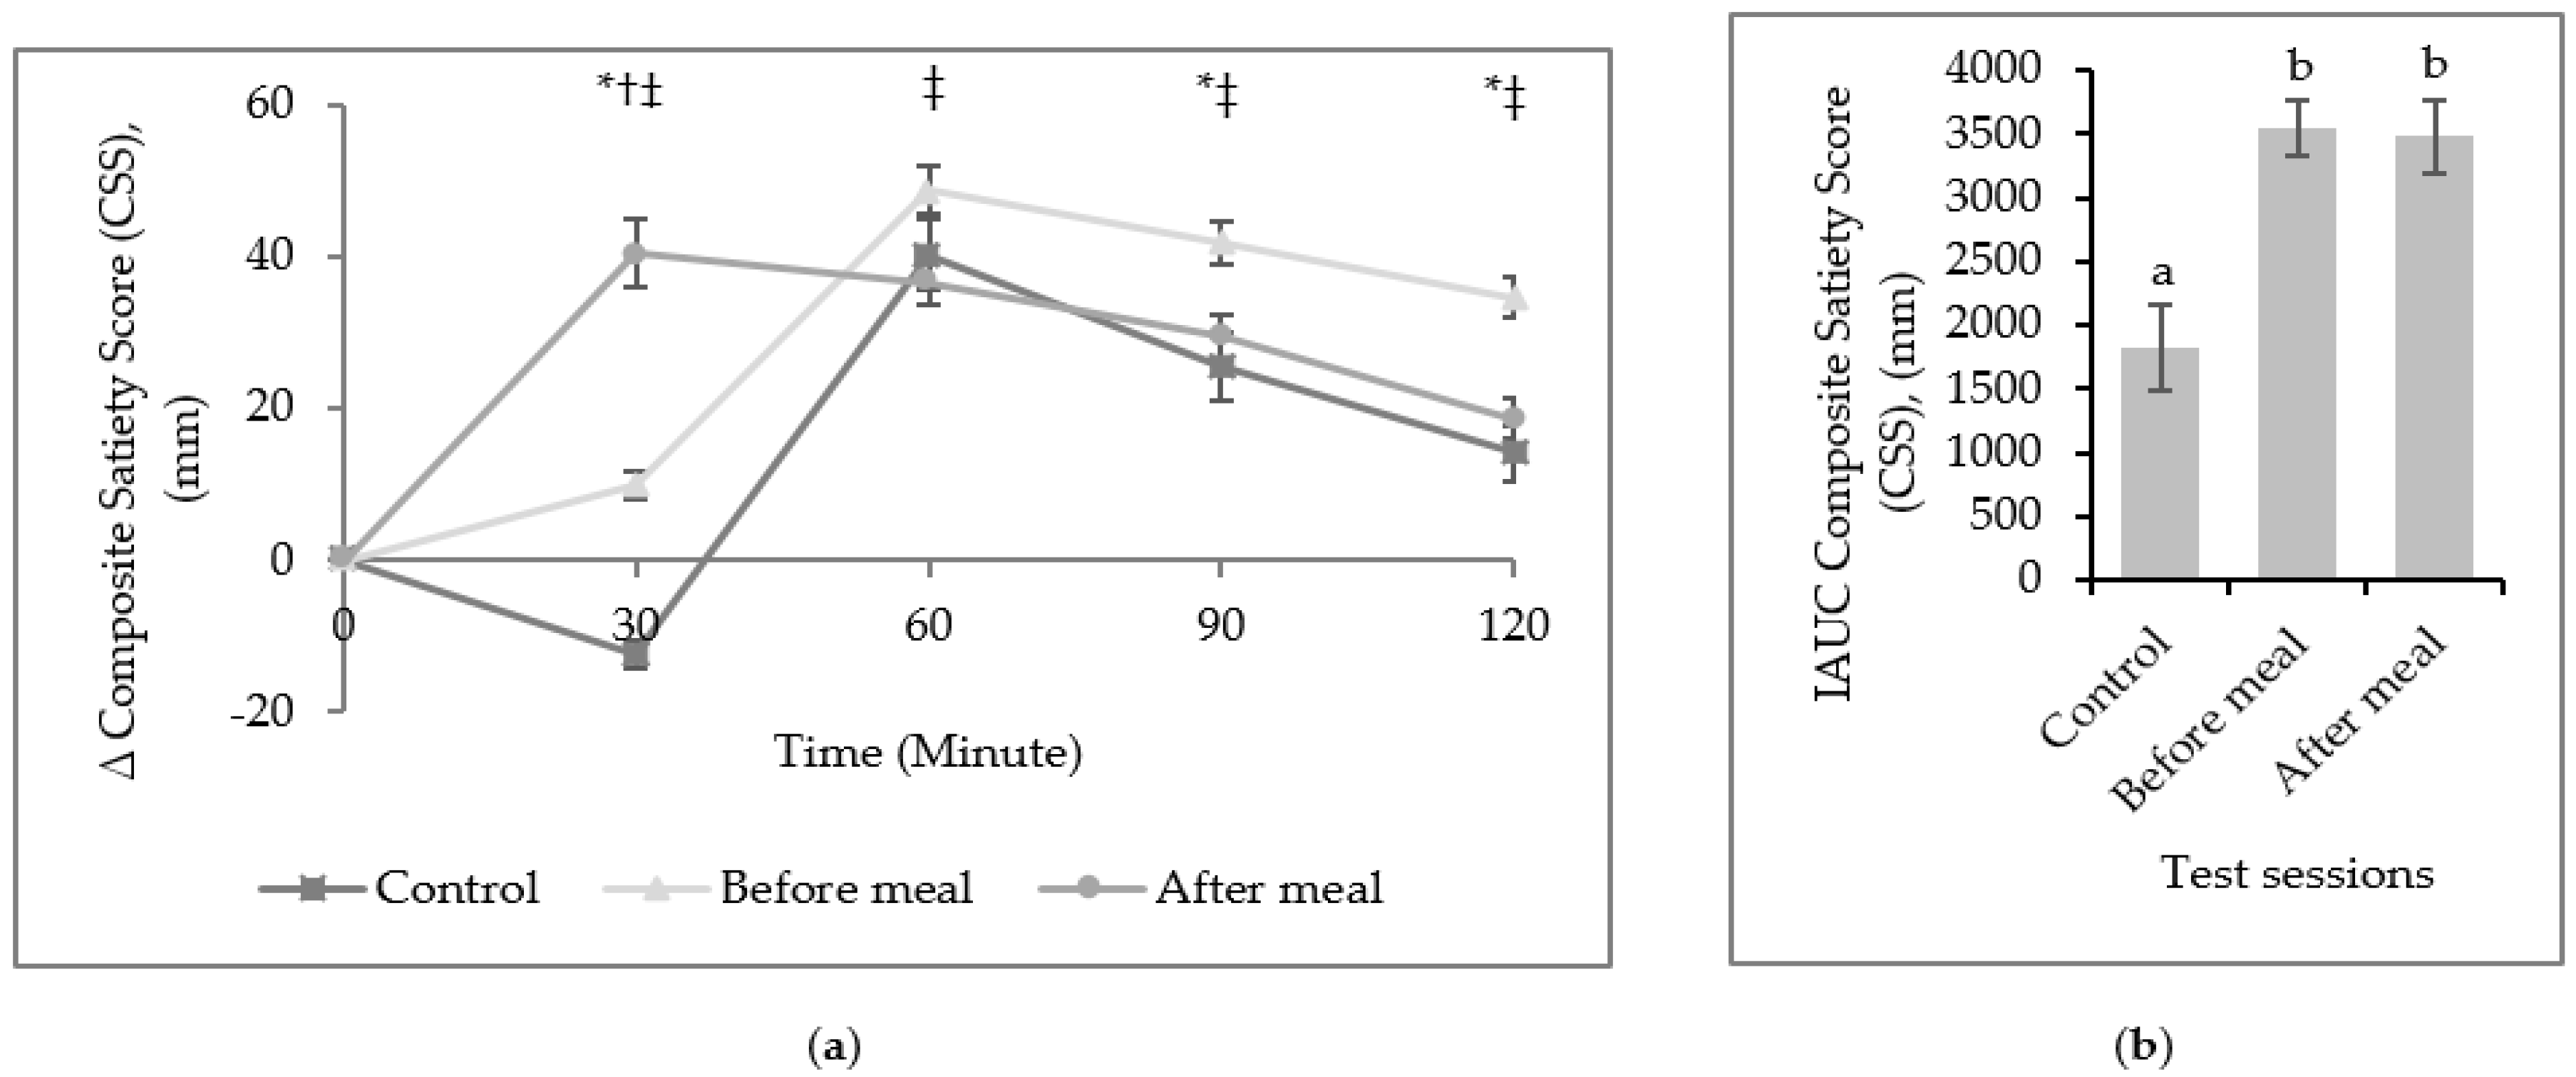
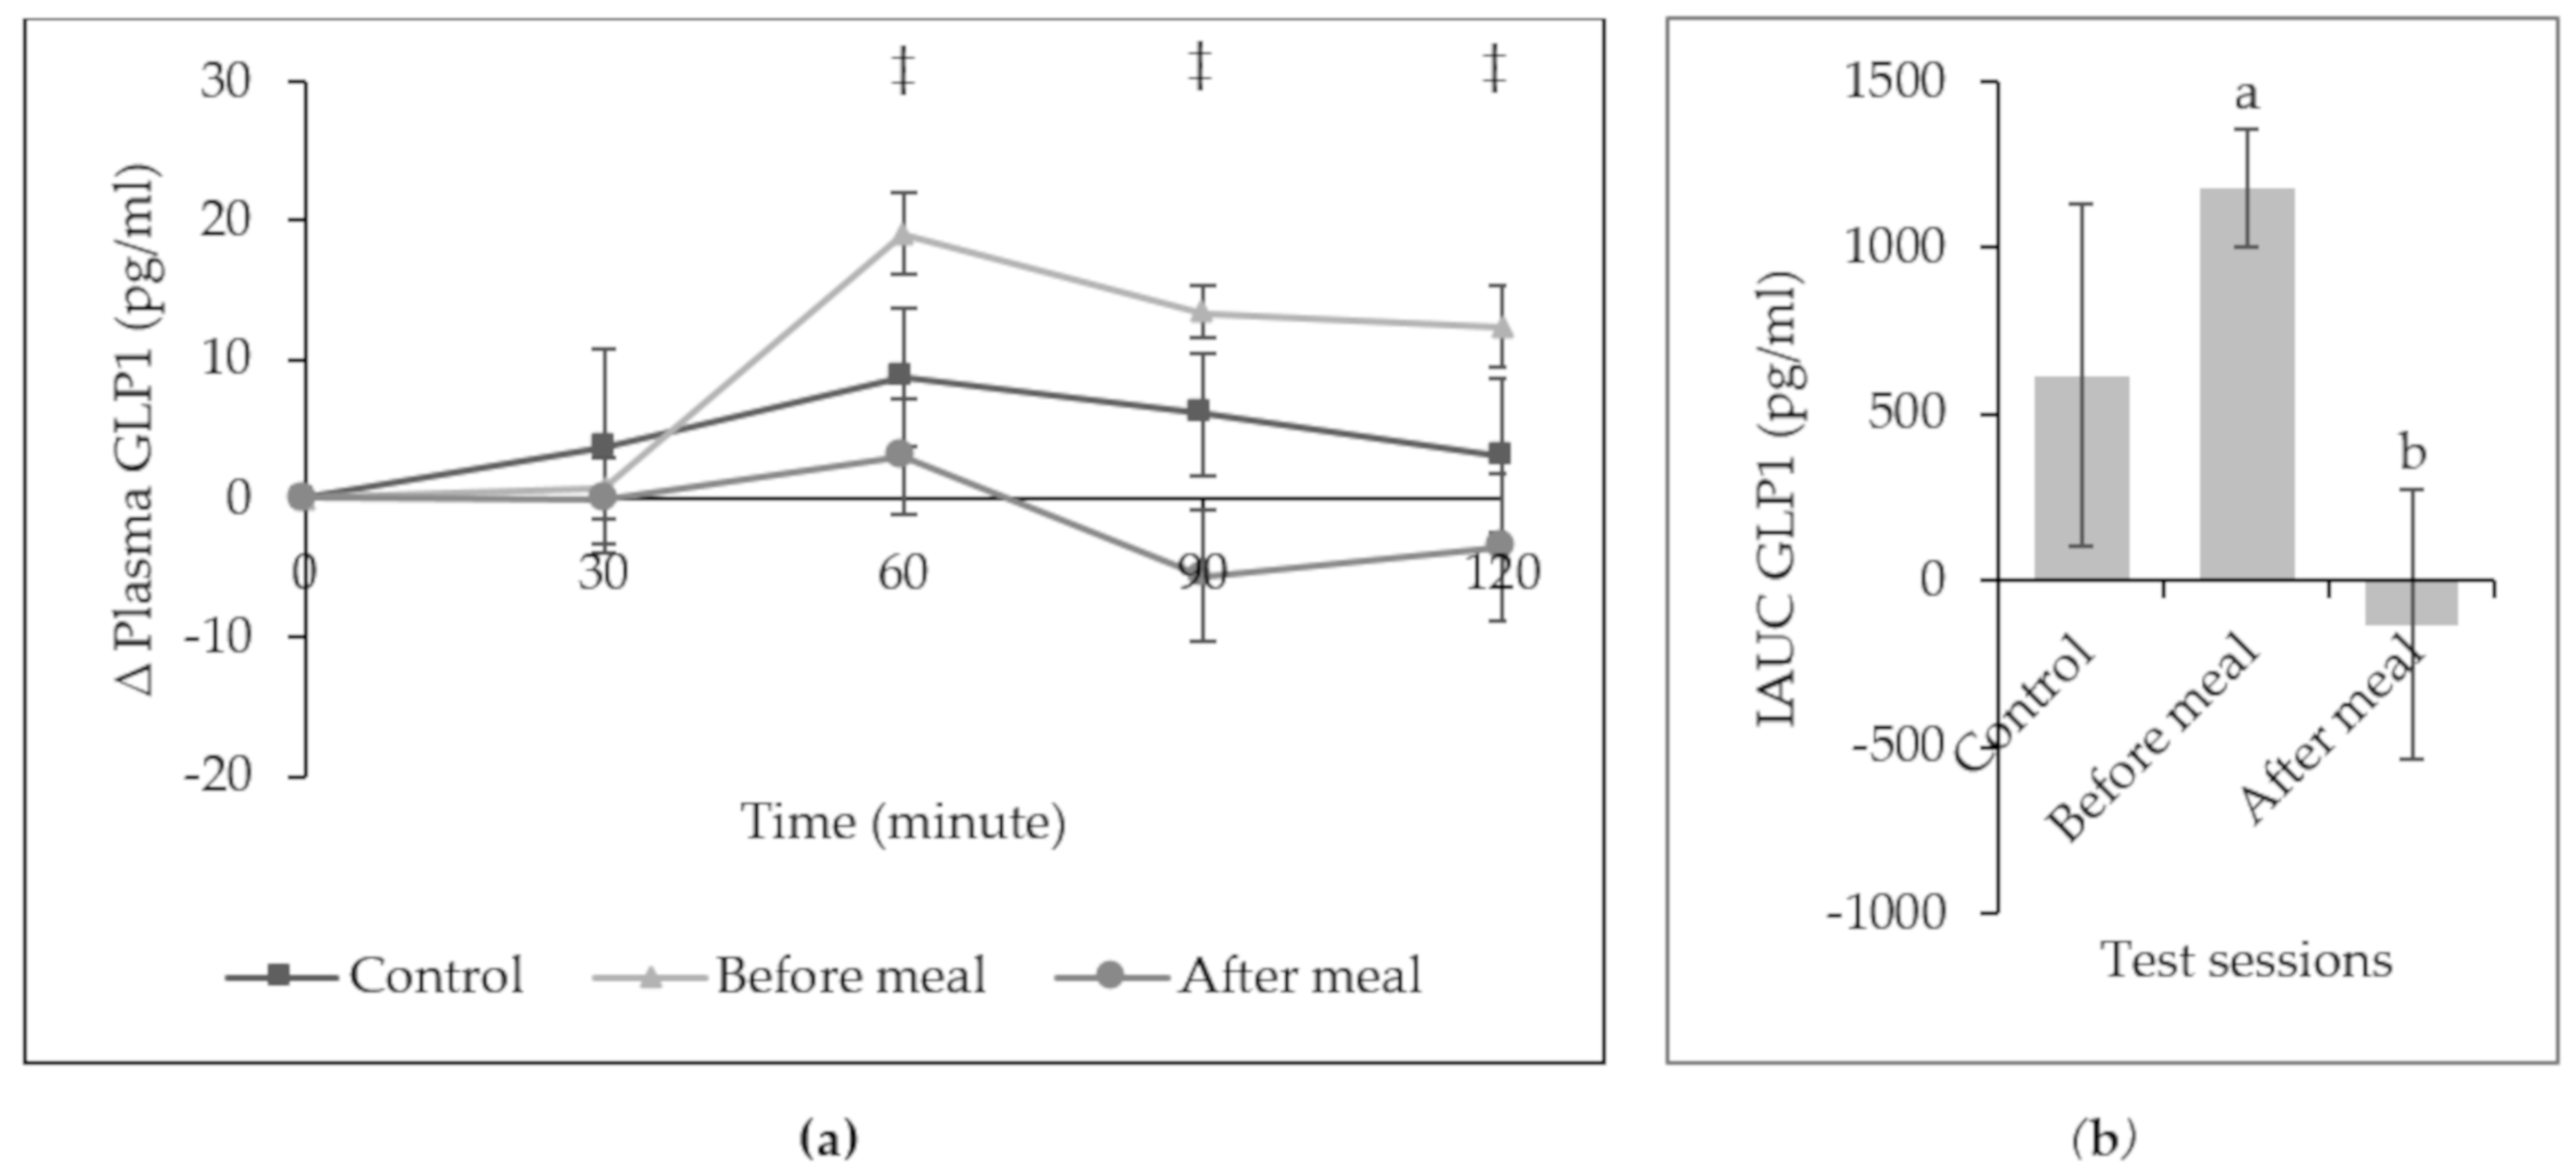
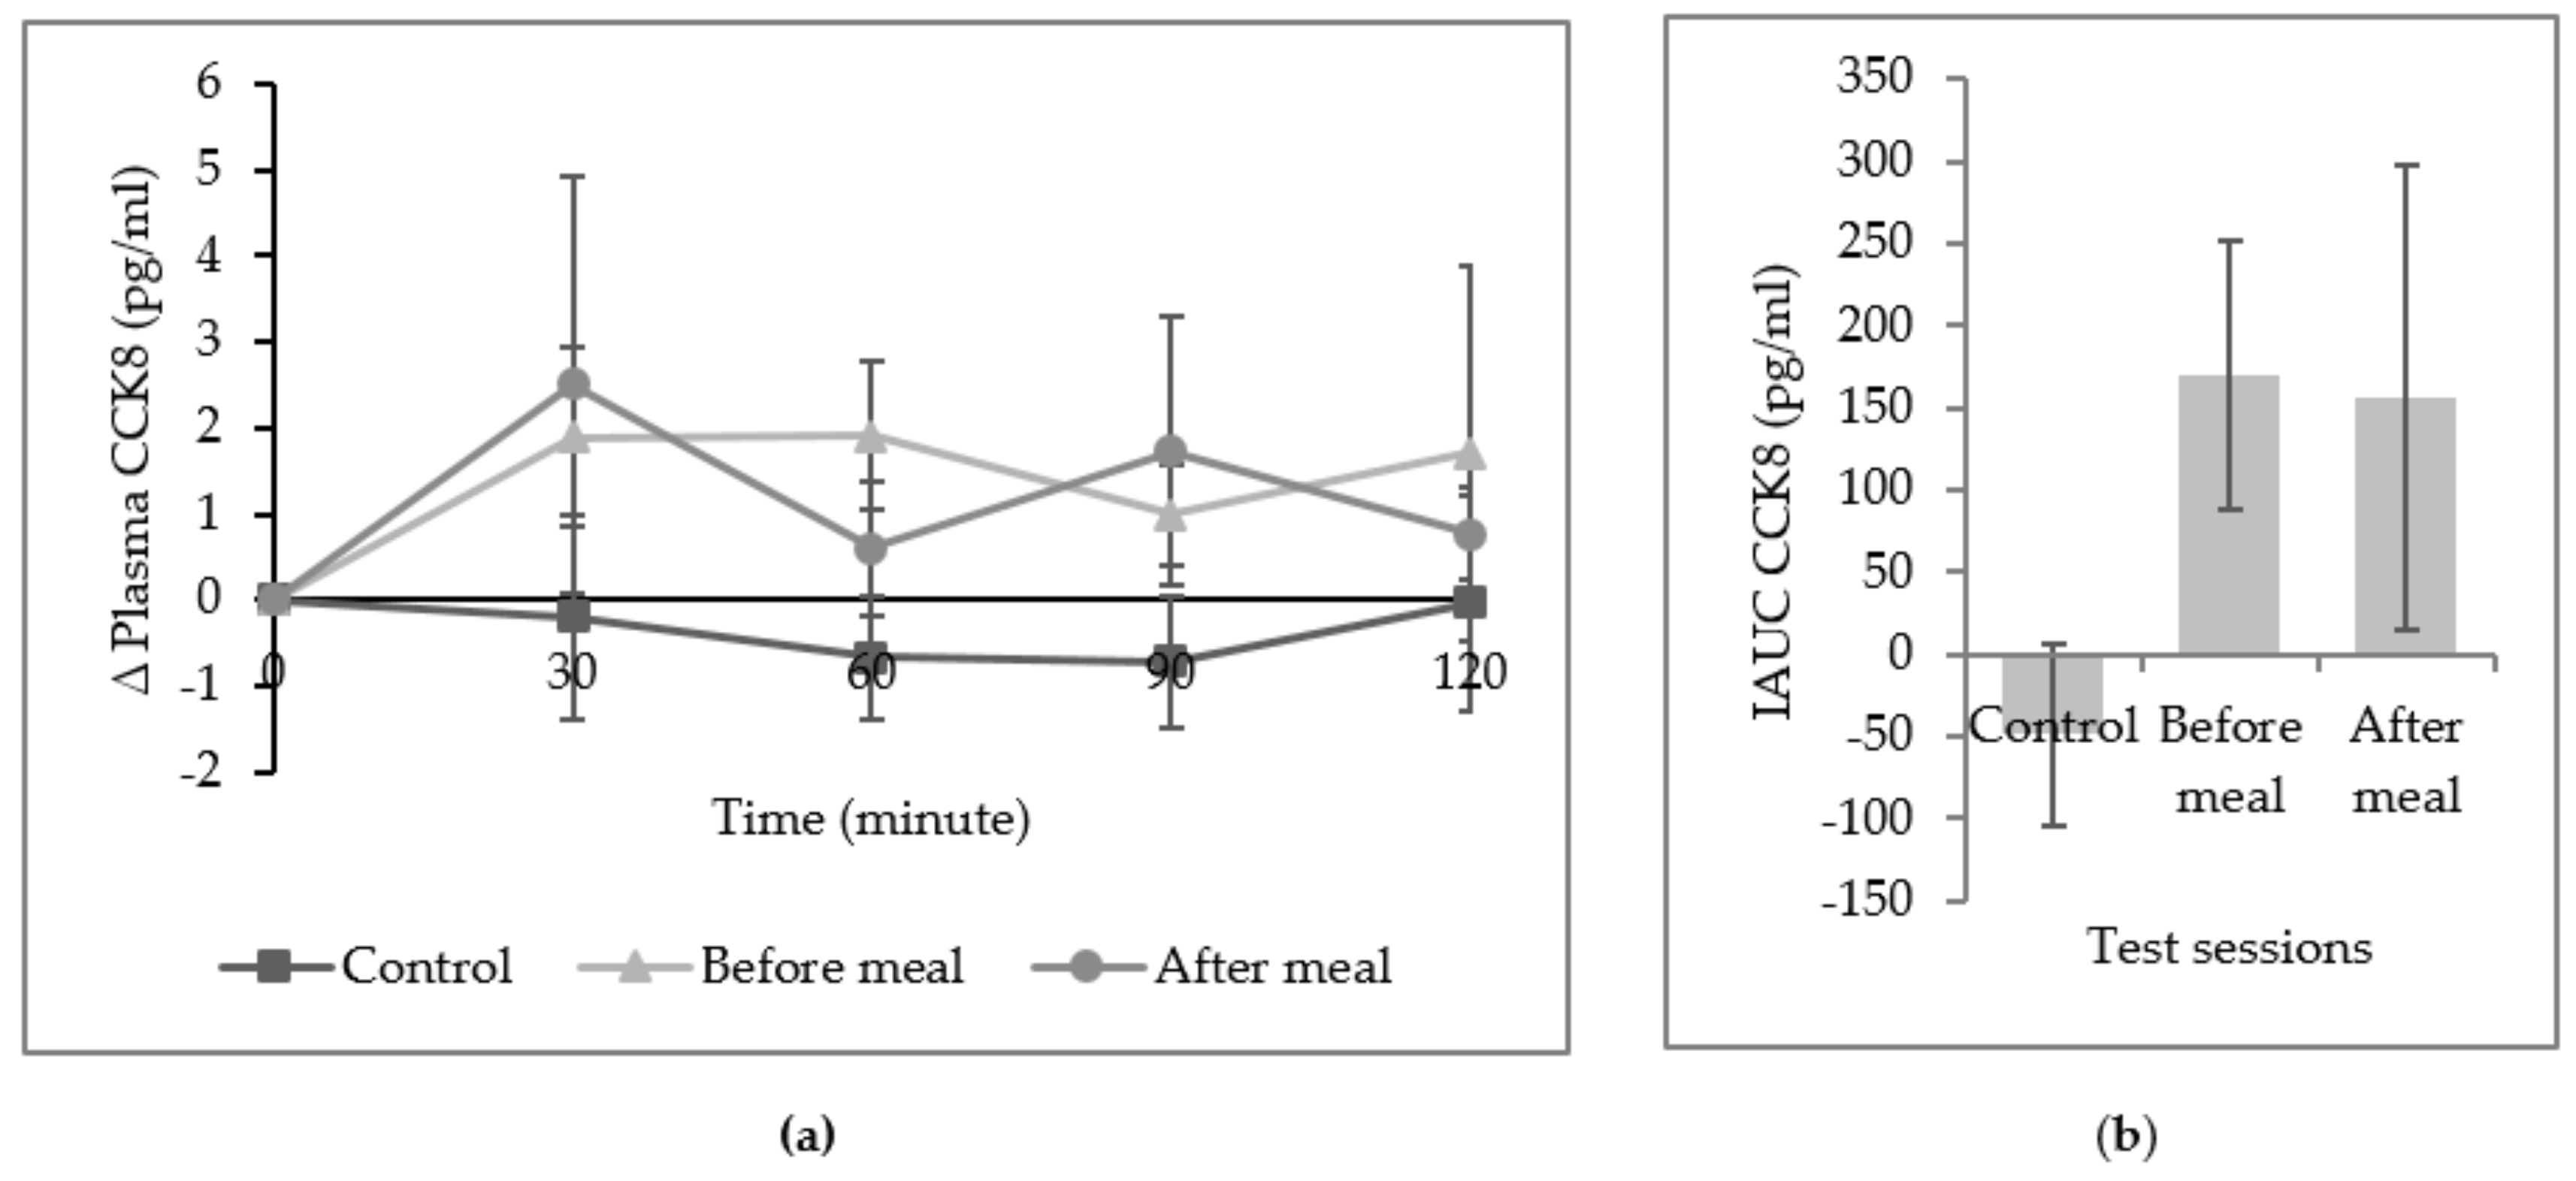
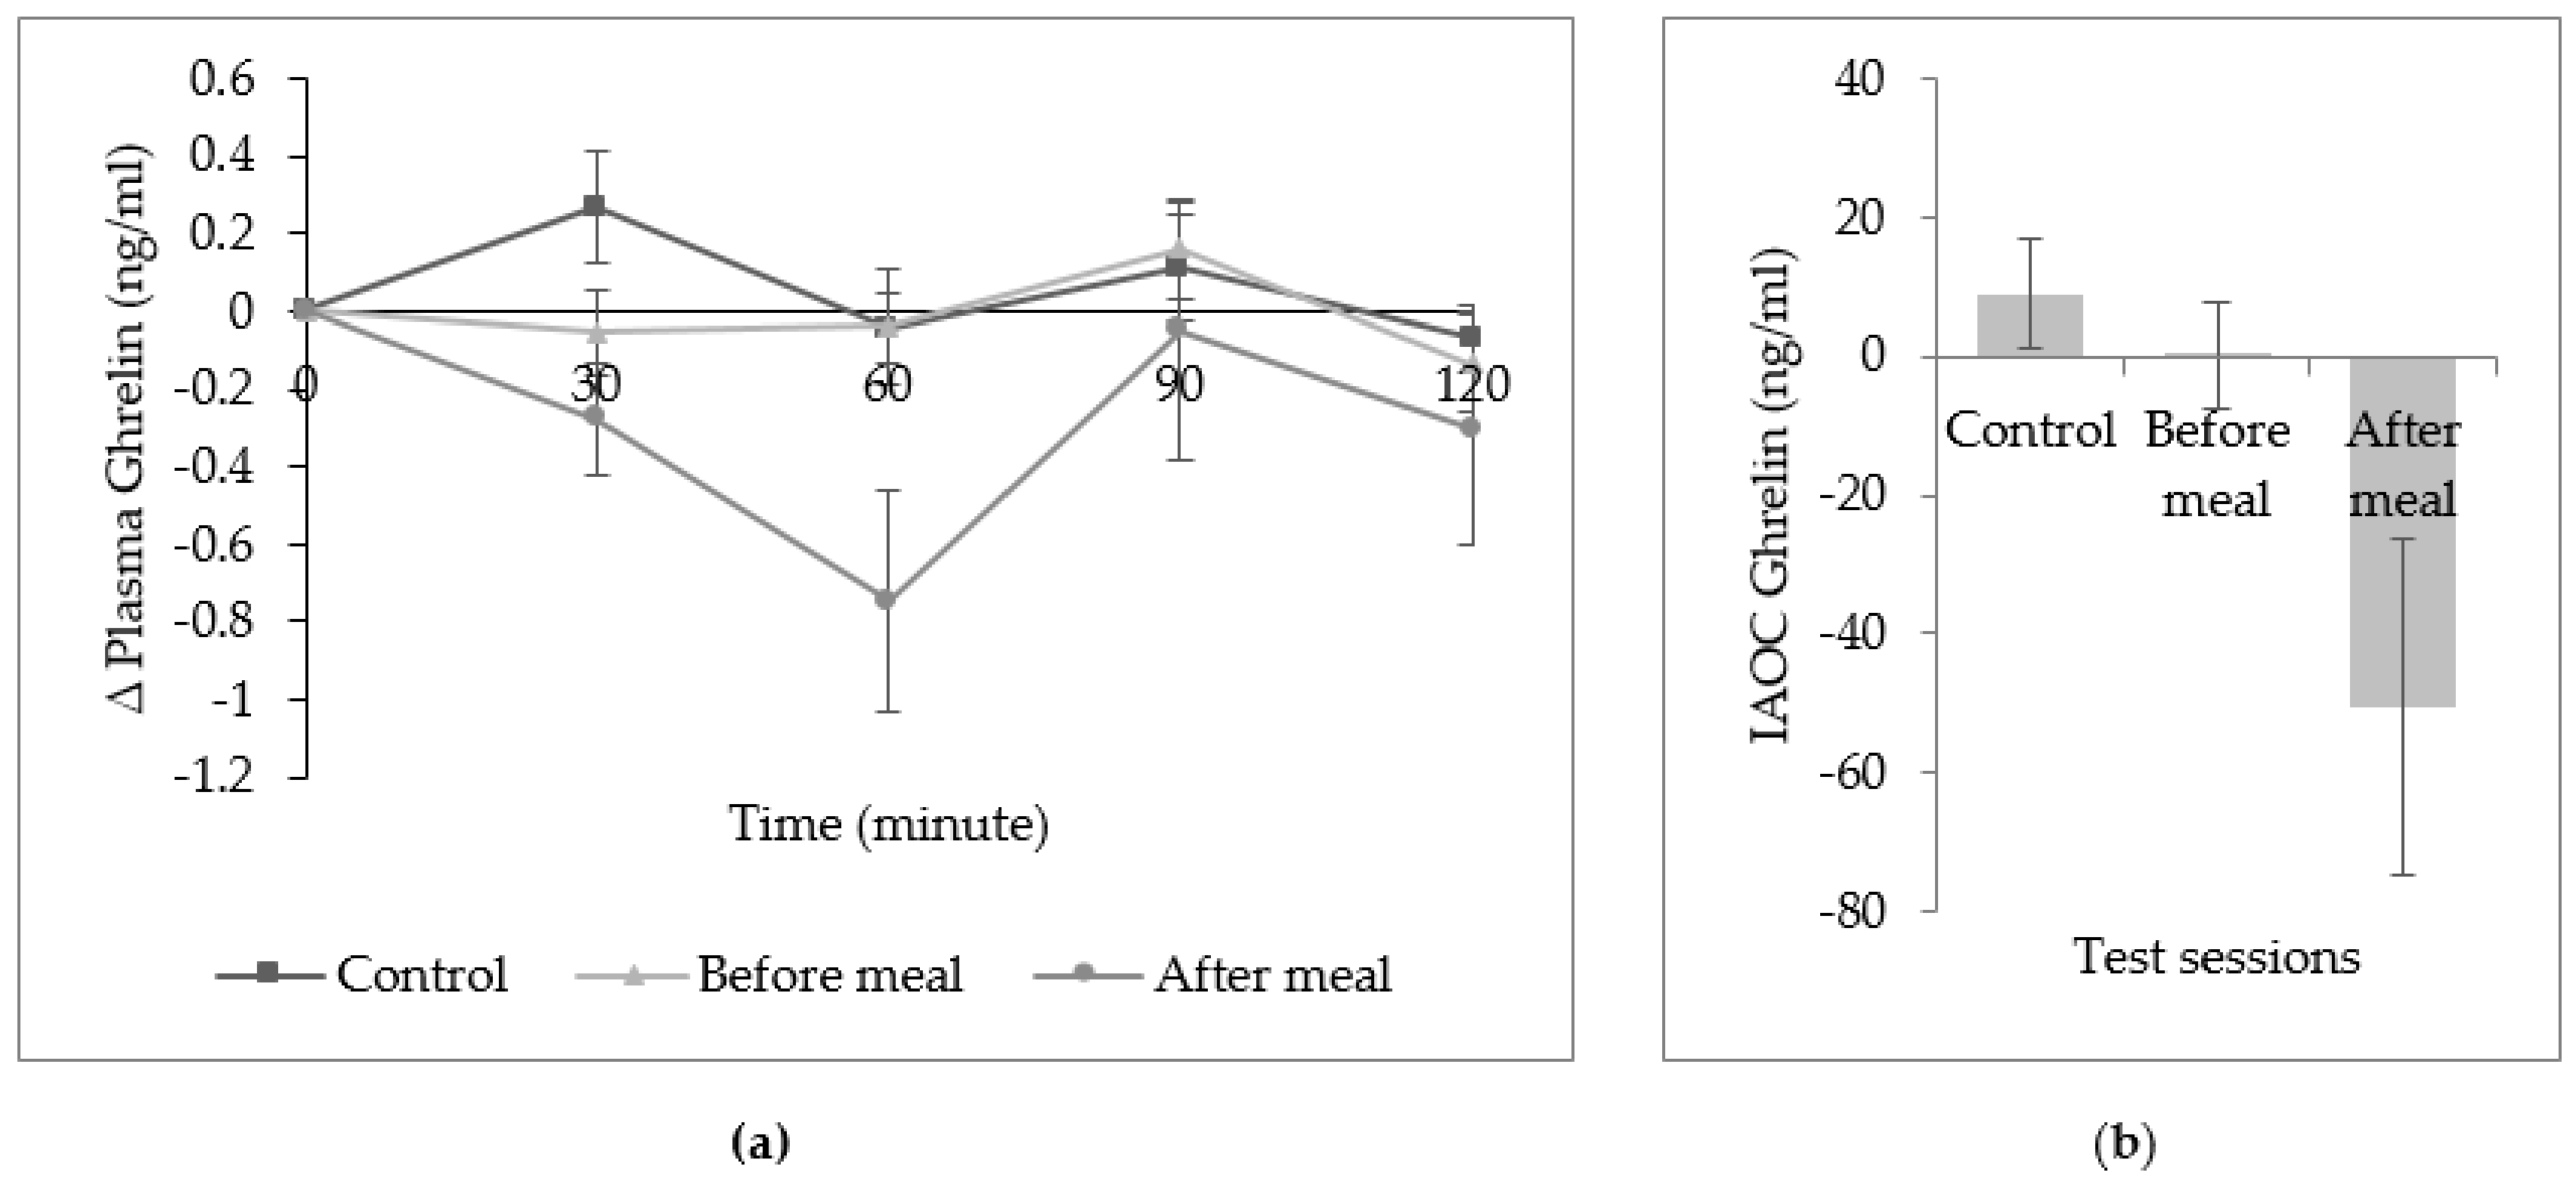
3. Results
4. Discussion
5. Conclusions
Author Contributions
Funding
Conflicts of Interest
References
- Basu, A.; Du, M.; Leyva, M.J.; Sanchez, K.; Betts, N.M.; Wu, M.; Aston, C.E.; Lyons, T.J. Blueberries decrease cardiovascular risk factors in obese men and women with metabolic syndrome. J. Nutr. 2010, 140, 1582–1587. [Google Scholar] [CrossRef]
- Weerts, S.E.; Amoran, A. Pass the fruits and vegetables! A community-university-industry partnership promotes weight loss in African American women. Health Promot. Pract. 2011, 12, 252–260. [Google Scholar] [CrossRef]
- Blundell, J. Making claims: Functional foods for managing appetite and weight. Nat. Rev. Endocrinol. 2010, 6, 53. [Google Scholar] [CrossRef]
- Halford, J.C.; Harrold, J.A. Satiety-enhancing products for appetite control: Science and regulation of functional foods for weight management. Proc. Nutr. Soc. 2012, 71, 350–362. [Google Scholar] [CrossRef]
- Hetherington, M.M.; Cunningham, K.; Dye, L.; Gibson, E.L.; Gregersen, N.T.; Halford, J.C.G.; Lawton, C.L.; Lluch, A.; Mela, D.J.; Van Trijp, H.C.M. Potential benefits of satiety to the consumer: Scientific considerations. Nutr. Res. Rev. 2013, 26, 22–38. [Google Scholar] [CrossRef]
- Mohamad, H.A.; Suzana, S.; Ibrahim, M.S.; Norshafarina, S. Relationship between Appetite, Food Intake and Body Composition among Elderly Malays from an Urban Residential Area in Kuala Lumpur, Malaysia. Malays. J. Nutr. 2010, 16, 339–348. [Google Scholar]
- Slavin, J.L.; Lloyd, B. Health benefits of fruits and vegetables. Adv. Nutr. 2012, 3, 506–516. [Google Scholar] [CrossRef] [PubMed]
- Flood-Obbagy, J.E.; Rolls, B.J. The effect of fruit in different forms on energy intake and satiety at a meal. Appetite 2009, 52, 416–422. [Google Scholar] [CrossRef] [PubMed]
- Tricò, D.; Filice, E.; Trifirò, S.; Natali, A. Manipulating the sequence of food ingestion improves glycemic control in type 2 diabetic patients under free-living conditions. Nutr. Diabetes 2016, 6, e226. [Google Scholar] [CrossRef] [PubMed]
- Shukla, A.P.; Mauer, E.; Igel, L.I.; Truong, W.; Casper, A.; Kumar, R.B.; Saunders, K.H.; Aronne, L.J. Effect of food order on ghrelin suppression. Diabetes Care 2018, 41, e76–e77. [Google Scholar] [CrossRef]
- Shukla, A.P.; Iliescu, R.G.; Thomas, C.E.; Aronne, L.J. Food order has a significant impact on postprandial glucose and insulin levels. Diabetes Care 2015, 38, e98–e99. [Google Scholar] [CrossRef] [PubMed]
- Christensen, A.S.; Viggers, L.; Hasselström, K.; Gregersen, S. Effect of fruit restriction on glycemic control in patients with type 2 diabetes—A randomized trial. Nutr. J. 2013, 12, 29. [Google Scholar] [CrossRef] [PubMed]
- Evert, A.B.; Boucher, J.L.; Cypress, M.; Dunbar, S.A.; Franz, M.J.; Mayer-Davis, E.J.; Neumiller, J.J.; Nwankwo, R.; Verdi, C.L.; Urbanski, P.; et al. Nutrition therapy recommendations for the management of adults with diabetes. Diabetes Care 2013, 36, 3821–3842. [Google Scholar] [CrossRef] [PubMed]
- Hakim, B.N.A.; Yahya, H.M.; Shahar, S.; Manaf, Z.A. Fruit consumption and associated determinants in a sample of young urban Malaysian adults. Nutr. Status Diet. Intake Body Compos. 2018, 24, 567. [Google Scholar]
- Yahya, F.; Othman, Z. Validation of the Malay version of Hospital Anxiety and Depression Scale (HADS) in Hospital Universiti Sains Malaysia. Int. Med. J. 2015, 22, 80–82. [Google Scholar]
- Rosnah, I.; Hassim, I.N.; Shafizah, A.S. A systematic translation and cultural adaptation process for three-factor eating questionnaire (TFEQ-R21). Med. J. Malays. 2013, 68, 425. [Google Scholar]
- Khan, A.R.; Awan, F.R.; Najam, S.; Islam, M.; Siddique, T.; Zain, M. Elevated serum level of human alkaline phosphatase in obesity. Age 2015, 48, 42–45. [Google Scholar]
- NCCFN. Malaysian Dietary Guidelines; National Coordinating Committee on Food and Nutrition (NCCFN), Ministry of Health Malaysia: Putrajaya, Malaysia, 2010.
- Tey, S.; Salleh, N.; Henry, C.; Forde, C. Effects of consuming preloads with different energy density and taste quality on energy intake and postprandial blood glucose. Nutrients 2018, 10, 161. [Google Scholar] [CrossRef]
- Flint, A.; Raben, A.; Blundell, J.; Astrup, A. Reproducibility, power and validity of visual analogue scales in assessment of appetite sensations in single test meal studies. Int. J. Obes. 2000, 24, 38. [Google Scholar] [CrossRef]
- Chaput, J.-P.; Gilbert, J.-A.; Gregersen, N.T.; Pedersen, S.D.; Sjödin, A.M. Comparison of 150-Mm Versus 100-Mm Visual Analogue Scales in free living adult subjects. Appetite 2010, 54, 583–586. [Google Scholar] [CrossRef]
- Sloth, B.; Due, A.; Larsen, T.M.; Holst, J.J.; Heding, A.; Astrup, A. The effect of a high-mufa, low-glycaemic index diet and a low-fat diet on appetite and glucose metabolism during a 6-month weight maintenance period. Br. J. Nutr. 2008, 101, 1846–1858. [Google Scholar] [CrossRef] [PubMed]
- Vuksan, V.; Panahi, S.; Lyon, M.; Rogovik, A.L.; Jenkins, A.L.; Leiter, L.A. Viscosity of fiber preloads affects food intake in adolescents. Nutr. Metab. Cardiovasc. Dis. 2009, 19, 498–503. [Google Scholar] [CrossRef] [PubMed]
- Noordzij, M.; Tripepi, G.; Dekker, F.W.; Zoccali, C.; Tanck, M.W.; Jager, K.J. Sample size calculations: Basic principles and common pitfalls. Nephrol. Dial. Transplant. 2010, 25, 1388–1393. [Google Scholar] [CrossRef] [PubMed]
- Farajian, P.; Katsagani, M.; Zampelas, A. Short-term effects of a snack including dried prunes on energy intake and satiety in normal-weight individuals. Eat. Behav. 2010, 11, 201–203. [Google Scholar] [CrossRef]
- Slavin, J.L. Dietary fiber and body weight. Nutrition 2015, 21, 411–418. [Google Scholar] [CrossRef]
- Li, J.; Zhang, N.; Hu, L.; Li, Z.; Li, R.; Li, C.; Wang, S. Improvement in chewing activity reduces energy intake in one meal and modulates plasma gut hormone concentrations in obese and lean young Chinese men. Am. J. Clin. Nutr. 2011, 94, 709–716. [Google Scholar] [CrossRef]
- Wu, T.; Zhao, B.R.; Bound, M.J.; Checklin, H.L.; Bellon, M.; Little, T.J.; Young, R.L.; Jones, K.L.; Horowitz, M.; Rayner, C.K. Effects of different sweet preloads on incretin hormone secretion, gastric emptying, and postprandial glycemia in healthy humans. Am. J. Clin. Nutr. 2011, 95, 78–83. [Google Scholar] [CrossRef]
- Houchins, J.A.; Tan, S.-Y.; Campbell, W.W.; Mattes, R.D. Effects of fruit and vegetable, consumed in solid vs beverage forms, on acute and chronic appetitive responses in lean and obese adults. Int. J. Obes. 2013, 37, 1109. [Google Scholar] [CrossRef]
- Livingstone, M.B.E.; Robson, P.J.; Welch, R.W.; Burns, A.A.; Burrows, M.S.; McCormack, C. Methodological issues in the assessment of satiety. Näringsforskning 2000, 44, 98–103. [Google Scholar] [CrossRef]
- Almiron-Roig, E.; Palla, L.; Guest, K.; Ricchiuti, C.; Vint, N.; Jebb, S.A.; Drewnowski, A. Factors that determine energy compensation: A systematic review of preload studies. Nutr. Rev. 2013, 71, 458–473. [Google Scholar] [CrossRef]
- Furchner-Evanson, A.; Petrisko, Y.; Howarth, L.S.; Nemoseck, T.; Kern, M. Snack selection influences satiety responses in adult women. Appetite. 2010, 54, 564–569. [Google Scholar] [CrossRef] [PubMed]
- Wien, M.; Haddad, E.; Oda, K.; Sabaté, J. A randomized 3×3 crossover study to evaluate the effect of hass avocado intake on post-ingestive satiety, glucose and insulin levels, and subsequent energy intake in overweight adults. Nutr. J. 2013, 12, 155. [Google Scholar] [CrossRef]
- De Graaf, C.; Hulshof, T. Effects of weight and energy content of preloads on subsequent appetite and food intake. Appetite 1996, 26, 139–151. [Google Scholar] [CrossRef] [PubMed]
- Kaliora, A.C.; Kanellos, P.T.; Gioxari, A.; Karathanos, V.T. Regulation of GIP and ghrelin in healthy subjects fed on sun-dried raisins: A pilot study with a crossover trial design. J. Med. Food 2017, 20, 301–308. [Google Scholar] [CrossRef] [PubMed]
- Burton-Freeman, B.; Liyanage, D.; Rahman, S.; Edirisinghe, I. Ratios of soluble and insoluble dietary fibers on satiety and energy intake in overweight pre- and postmenopausal women. J. Nutr. Health Aging 2017, 4, 157–168. [Google Scholar] [CrossRef]
- Lobley, G.E.; Holtrop, G.; Horgan, G.W.; Bremner, D.M.; Fyfe, C.; Johnstone, A.M. Responses in gut hormones and hunger to diets with either high protein or a mixture of protein plus free amino acids supplied under weight-loss conditions. Br. J. Nutr. 2015, 113, 1254–1270. [Google Scholar] [CrossRef] [PubMed]
- Bédard, A.; Hudon, A.M.; Drapeau, V.; Corneau, L.; Dodin, S.; Lemieux, S. Gender differences in the appetite response to a satiating diet. J. Obes. 2015, 2015, 140139. [Google Scholar] [CrossRef]
- Blundell, J.; De Graaf, C.; Hulshof, T.; Jebb, S.; Livingstone, B.; Lluch, A.; Mela, D.; Salah, S.; Schuring, E.; Van Der Knaap, H.; et al. Appetite control: Methodological aspects of the evaluation of foods. Obes. Rev. 2010, 11, 251–270. [Google Scholar] [CrossRef]
- Alkozei, A.; Killgore, W.D.; Smith, R.; Dailey, N.S.; Bajaj, S.; Raikes, A.C.; Haack, M. Chronic sleep restriction differentially affects implicit biases toward food among men and women: Preliminary evidence. J. Sleep Res. 2017, 27, e12629. [Google Scholar] [CrossRef]
- Parvaneh, K.; Poh, B.K.; Hajifaraji, M.; Ismail, M.N. Sleep deprivation is related to obesity and low intake of energy and carbohydrates among working Iranian adults: A cross sectional study. Asia Pac. J. Clin. Nutr. 2014, 23, 84–90. [Google Scholar]
- Blundell, J.; Finlayson, G.; Axelsen, M.; Flint, A.; Gibbons, C.; Kvist, T.; Hjerpsted, J.B. Effects of once-weekly semaglutide on appetite, energy intake, control of eating, food preference and body weight in subjects with obesity. Diabetes Obes. Metab. 2017, 19, 242–1251. [Google Scholar] [CrossRef] [PubMed]
- Lubransky, A.; Monro, J.; Mishra, S.; Yu, H.; Haszard, J.; Venn, B. Postprandial glycaemic, hormonal and satiety responses to rice and kiwifruit preloads in Chinese adults: A randomised controlled crossover trial. Nutrients 2018, 10, 1110. [Google Scholar] [CrossRef] [PubMed]
- Norhayati, A.H.; Marhazlina, M.; Yusof, R.M.; Rohin, A.K.M. Effects of red pitaya fruit (Hylocereus Polyrhizus) consumption on blood glucose level and lipid profile in type 2 diabetic subjects. Borneo Sci. J. 2012, 31, 113–128. [Google Scholar]
- Steinert, R.; Raederstorff, D.; Wolever, T. Effect of consuming oat bran mixed in water after a meal on glycemic responses in healthy humans-a pilot study. Nutrients 2016, 8, 524. [Google Scholar] [CrossRef] [PubMed]
- Rolls, B.J.; Roe, L.S.; Meengs, J.S. Portion size can be used strategically to increase vegetable consumption in adults. Am. J. Clin. Nutr. 2010, 91, 913–922. [Google Scholar] [CrossRef] [PubMed]
- Roe, L.S.; Meengs, J.S.; Rolls, B.J. Salad and satiety. The effect of timing of salad consumption on meal energy intake. Appetite 2012, 58, 242–248. [Google Scholar] [CrossRef] [PubMed]
- Hazell, T.J.; Islam, H.; Townsend, L.K.; Schmale, M.S.; Copeland, J.L. Effects of exercise intensity on plasma concentrations of appetite-regulating hormones: Potential mechanisms. Appetite 2016, 98, 80–88. [Google Scholar] [CrossRef]
 Measurement of subjective appetite rating;
  Blood samples.


| Parameter | Mean ± SE | Intervention Effect | ||
|---|---|---|---|---|
| P | Partial eta, ηp2 | Power | ||
| Test meal, kcal | 0.419 | 0.049 | 0.156 | |
| Control | 806 ± 46 | |||
| Before a meal | 754 ± 46 | |||
| After a meal | 787 ± 53 | |||
| Test meal + apple, kcal | 0.504 | 0.037 | 0.128 | |
| Control | 806 ± 46 | |||
| Before a meal | 825 ± 46 | |||
| After a meal | 857 ± 53 | |||
| Subsequent energy intake, kcal | 0.031 | 0.195 | 0.660 | |
| Control | 890 ± 55 a | |||
| Before a meal | 725 ± 50 b | |||
| After a meal | 786 ± 58 | |||
| Total daily energy intake, kcal | 0.142 | 0.115 | 0.395 | |
| Control | 2289 ± 59 | |||
| Before a meal | 2156 ± 66 | |||
| After a meal | 2255 ± 78 | |||
| Variable | iAOC Ghrelin | iAUC GLP-1 | iAUC CCK8 | |||
|---|---|---|---|---|---|---|
| r | p | r | p | r | p | |
| Incremental area under the curve CSS | ||||||
| Control | −0.573 | 0.016 * | −0.163 | 0.531 | −0.244 | 0.346 |
| Before a meal | −0.032 | 0.904 | −0.297 | 0.247 | 0.173 | 0.506 |
| After meal | −0.011 | 0.968 | 0.147 | 0.574 | 0.237 | 0.378 |
© 2019 by the authors. Licensee MDPI, Basel, Switzerland. This article is an open access article distributed under the terms and conditions of the Creative Commons Attribution (CC BY) license (http://creativecommons.org/licenses/by/4.0/).
Share and Cite
Abdul Hakim, B.N.; Yahya, H.M.; Shahar, S.; Abdul Manaf, Z.; Damanhuri, H. Effect of Sequence of Fruit Intake in a Meal on Satiety. Int. J. Environ. Res. Public Health 2019, 16, 4464. https://doi.org/10.3390/ijerph16224464
Abdul Hakim BN, Yahya HM, Shahar S, Abdul Manaf Z, Damanhuri H. Effect of Sequence of Fruit Intake in a Meal on Satiety. International Journal of Environmental Research and Public Health. 2019; 16(22):4464. https://doi.org/10.3390/ijerph16224464
Chicago/Turabian StyleAbdul Hakim, Bibi Nabihah, Hanis Mastura Yahya, Suzana Shahar, Zahara Abdul Manaf, and Hanafi Damanhuri. 2019. "Effect of Sequence of Fruit Intake in a Meal on Satiety" International Journal of Environmental Research and Public Health 16, no. 22: 4464. https://doi.org/10.3390/ijerph16224464
APA StyleAbdul Hakim, B. N., Yahya, H. M., Shahar, S., Abdul Manaf, Z., & Damanhuri, H. (2019). Effect of Sequence of Fruit Intake in a Meal on Satiety. International Journal of Environmental Research and Public Health, 16(22), 4464. https://doi.org/10.3390/ijerph16224464