Article

Comparison of Culture- and Quantitative PCR-Based Indicators of Antibiotic Resistance in Wastewater, Recycled Water, and Tap Water

1
CBQF—Centro de Biotecnologia e Química Fina—Laboratório Associado, Escola Superior de Biotecnologia, Universidade Católica Portuguesa, Rua de Diogo Botelho 1327, 4169-005 Porto, Portugal
2
Department of Civil and Environmental Engineering, Virginia Tech, Blacksburg, VA 24061, USA
*
Authors to whom correspondence should be addressed.
Int. J. Environ. Res. Public Health 2019, 16(21), 4217; https://doi.org/10.3390/ijerph16214217
Submission received: 30 September 2019 / Revised: 25 October 2019 / Accepted: 28 October 2019 / Published: 30 October 2019

Abstract

:
Standardized methods are needed to support monitoring of antibiotic resistance in environmental samples. Culture-based methods target species of human-health relevance, while the direct quantification of antibiotic resistance genes (ARGs) measures the antibiotic resistance potential in the microbial community. This study compared measurements of tetracycline-, sulphonamide-, and cefotaxime-resistant presumptive total and fecal coliforms and presumptive enterococci versus a suite of ARGs quantified by quantitative polymerase chain reaction (qPCR) across waste-, recycled-, tap-, and freshwater. Cross-laboratory comparison of results involved measurements on samples collected and analysed in the US and Portugal. The same DNA extracts analysed in the US and Portugal produced comparable qPCR results (variation <28%), except for blaOXA-1 gene (0%–57%). Presumptive total and fecal coliforms and cefotaxime-resistant total coliforms strongly correlated with blaCTX-M and intI1 (0.725 ≤ R2 ≤ 0.762; p < 0.0001). Further, presumptive total and fecal coliforms correlated with the Escherichia coli-specific biomarkers, gadAB, and uidA, suggesting that both methods captured fecal-sourced bacteria. The genes encoding resistance to sulphonamides (sul1 and sul2) were the most abundant, followed by genes encoding resistance to tetracyclines (tet(A) and tet(O)) and β-lactams (blaOXA-1 and, blaCTX-M), which was in agreement with the culture-based enumerations. The findings can help inform future application of methods being considered for international antibiotic resistance surveillance in the environment.

1. Introduction

Antibiotic resistance and the associated increasing failure of therapeutic and life-saving drugs has been recognized to be a major threat to human health in the 21st Century [1,2,3]. In recent years, there is growing interest in implementing monitoring campaigns to better understand sources and pathways by which antibiotic resistance may originate and spread in the general environment, e.g., water, sewage, manure, soil, sediments, and dust [4,5,6]. However, standardized approaches are needed to promote comparability of the data and to address major questions such as the role of various management practices, country to country and region to region, in exacerbating or attenuating antibiotic resistance levels.
Phenotypic antibiotic resistance can be assessed based on culture-based methods or inferred from culture-independent approaches [7,8]. Culture-based methods, often used to assess antibiotic resistance in clinical pathogens, may be of limited value for environmental bacteria, given that most bacteria do not grow well under typical laboratory conditions [7,8,9] and that intrinsic antibiotic resistance phenotypes, common in environmental bacteria, can confound results. Notably, non-culturable bacteria may play an important role in the spread of antibiotic resistance as a reservoir of antibiotic resistance genes (ARGs). Methods based on the direct analysis of environmental DNA have, thus, became popular for quantifying and assessing diversity of ARGs [8,10]. Quantitative PCR (qPCR) is a targeted method that uses DNA primers specific for given genes or gene families, permitting the detection and quantification of a priori selected target genes [8,11]. While newer metagenomics approaches offer promise in non-target ARG profiling, the overall advantage of qPCR remains in more precise quantification of target gene populations and on the possible ability to detect low-abundance genes [8]. qPCR has been used to quantify ARGs in different environments, e.g. clinical samples, groundwater, wastewater, manure, and soil [11,12,13,14,15,16,17,18,19,20]. Nevertheless, qPCR is not exempt from biases, which include the inability to ascertain gene expression (when DNA based), the potential for qPCR inhibition, and the inability to directly discriminate between extracellular and intracellular DNA [13,21,22,23,24].
Traditionally, microbiological water quality is assessed based on coliforms analyses, a method still used widely throughout the world [25,26,27]. Coliforms are thus a target of interest for standardized antibiotic resistance monitoring (Marano et al., in preparation; [28]). Major advantages include feasibility of implementation, low technical requirements, and potential for global data comparability. Among the limitations, neglecting the non-culturable populations, lack of representativeness of the full microbial community, and lack of bench-marking against culture-independent methods remain as challenges.
The purpose of the present study was to comprehensively assess both coliform-based and qPCR-based measures of antibiotic resistance across a spectrum of water types: domestic wastewater, recycled water, river water, and drinking water. In particular, we focused on phenotypic measures of tetracycline, sulphonamide, and 3rd-generation cephalosporin resistance among coliform and enterococci bacteria along with whole-community quantification of ARGs pertaining to corresponding classes: tet(A), tet(O), sul1, sul2, blaOXA-1, and blaCTX-M. Further, the class 1 integrase gene, intI1, was quantified as an indicator of anthropogenic sources of acquired antibiotic resistance and potential to be mobilized [29]. International inter-laboratory comparison of the various methods provides insight into information gained by various approaches and can help inform standardized methods for environmental monitoring in the future.

2. Materials and Methods

2.1. Water Systems and Sampling

Samples were collected in the US and in Portugal. US samples included wastewater influent (RWW), secondary wastewater treatment effluent (sTWW), tertiary wastewater treatment final effluent (tTWW), river water, tap water (TW), and distributed reclaimed (i.e., recycled) water (SRWDS). Each water sample was collected on three different dates (Table S1). The US wastewater treatment plant (WWTP) employed primary and secondary treatments operating with conventional activated sludge and a tertiary treatment based on UV disinfection. River water samples were collected approximately 10 km downstream from the WWTP discharge point. The drinking water was a chloraminated municipal water supply collected from a laboratory tap equipped with a granular activated carbon filter, while the simulated reclaimed water distribution system was chlorinated. Tap water and simulated water distribution system water samples were tested for chlorine residual levels before downstream experiments, in order to neutralize disinfectants [30], however no chlorine was detected in any of the samples.
Portugal (PT) wastewater samples included the influent (RWW) and secondary wastewater treatment effluent (sTWW) of a WWTP, collected during two sampling campaigns (Table S1). The PT WWTP analysed employed primary and secondary treatment, in accordance with conventional activated sludge.

2.2. Culture-Based Methods

For US samples, microbiological water quality was assessed based on presumptive total and fecal coliforms and presumptive enterococci [31], using the membrane filtration method. Membrane fecal coliform medium (mFC agar, Difco, Chicago, USA) was used to enumerate total and fecal coliforms and m-Enterococcus (mEnt) agar medium (Sigma-Aldrich, St Luis, USA) to enumerate enterococci. Antibiotic resistant subpopulations were quantified on these culture media supplemented with one of the following antibiotics: cefotaxime (CTX, 4 mg/L; Sigma-Aldrich, St Luis, USA), tetracycline (TET, 16 mg/L; Sigma-Aldrich, St Luis, USA), or sulfamethoxazole (SMX, 350 mg/L; Sigma-Aldrich, St Luis, USA). The antibiotic concentrations were selected based on the Clinical and Laboratory Standards Institute (CLSI) minimal inhibitory concentrations for Enterobacteriaceae, as previously described [32,33,34]. For PT samples, presumptive total and fecal coliforms were enumerated as described above, as well as the cefotaxime-resistant populations. Volumes ranging from 1 to 100 mL of water or of the adequate serial decimal dilutions were filtered through cellulose nitrate membranes (0.22 μm porosity; Sartorius Stedim Biotech, Göttingen, Germany), placed on the adequate culture medium and incubated at 37 °C for 24 h for total and fecal coliforms and for 48 h for enterococci. Experiments were done in triplicate.

2.3. Culture-Independent Methods

Water samples were filtered in triplicate for each sampling date through polycarbonate membranes (sterile 0.22 μm porosity, Merck Millipore, USA). Filter membranes were stored at −80 °C until DNA extraction using the FastDNA™ SPIN KIT (MP Biomedicals LCC, Illkirch, France) for US samples or PowerWater® DNA Isolation Kit (MO BIO Laboratories Inc., Carlsbad, USA) for PT samples, according to manufacturer instructions. The extracted DNA was quantified using the Qubit 3.0 Fluorometer (ThermoFisher Scientific, Waltham, USA). Real-time PCR was used to quantify 16S rRNA, 23S rRNA (specific gene for enterococci) [35], uidA, and gadAB (specific for Escherichia coli) [36,37], blaCTX – M, blaOXA-1 (resistance determinants against β-lactams) [38,39], sul1 and sul2, (resistance determinants against sulphonamides) [40], intI1 (the class 1 integrase gene and indicator of anthropogenic sources of resistance and gene mobilization potential) [41], and tet(A), and tet(O) (resistance determinants against tetracyclines) [42,43] genes. Data was expressed as absolute abundance (gene copy number/mL of sample) or as relative abundance or prevalence (gene copy number/ 16S rRNA gene copy number). The qPCR assays were performed in a Bio-Rad Real-Time PCR Analysis Software (Biorad, Richmond, CA, USA) in the US and in a StepOneTM Real-Time PCR System (Life Technologies, Carlsbad, CA, USA) in PT. The qPCR conditions used are listed in Table S2. For each sample, either for US or for PT samples, three DNA extracts were analysed using the Standard Curve method as described in Brankatschk and collaborators [44]. The variability of qPCR between the two laboratories, using in-house laboratory qPCR standards, reagents, and protocols (Table S2), was tested on the same DNA extracts, analysed in US and Portugal facilities. With this aim, the DNA extracts were shipped refrigerated on ice in a styrofoam box from the US to Portugal, where they were immediately stored at −20 °C. DNA extract concentrations were analysed again prior to qPCR assays, and the values were consistent with those determined in the US, suggesting that any potential DNA degradation was minimal. In both the US and Portugal facilities, identical criteria for analysis and interpretation of results were followed, although distinct qPCR protocols were an intentional factor in this study [45]. Possible qPCR inhibition was assessed using serial dilutions of the samples’ DNA extracts and samples spiked with a known amount of the target gene.

2.4. Statistical analyses

Culture-based and qPCR results were analysed based on one-way analysis of variance (ANOVA) and Tukey’s post-hoc tests in order to assess statistically significant differences (p < 0.01) using GraphPad Prism 7.00 software. Normality and homoscedasticity of data were verified using the Shapiro–Wilk and Levene’s tests, respectively. When normality of data was not verified, the Kruskal–Wallis test was carried out alternatively to one-way ANOVA. In such cases, the Mann–Whitney test was used to detect differences. Significance level across the study was set at p < 0.01. In addition, the relationship between the culturable bacteria (log CFUs/mL) and the gene absolute abundance values (log gene copy number/mL of sample) was assessed via the linear regression method using GraphPad Prism 7.00 software. This analysis was based on 13 samples (US: wastewater influent (n = 3), secondary wastewater treatment effluent (n = 3), and tertiary wastewater treatment final effluent (n = 3) and PT: wastewater influent (n = 2) and secondary wastewater treatment effluent (n = 2). Linear regressions were performed between the genes 16S rRNA, gadAB, uidA, blaOXA-1, blaCTX-M, sul1, sul2, tet(O), and intI1 and the culture media mFC and mFC supplemented with cefotaxime.

3. Results

3.1. Culture-Based and qPCR Determinations

Presumptive total coliforms ranged from 1.7 to 6.3 log CFU/mL, with the highest values in the influent wastewater and the lowest in the river water (Figure 1). Presumptive fecal coliforms, represented approximately 4 to 89% of the presumptive total coliforms and were detected mostly in the influent wastewater and in the secondary treatment effluent, at around 5.5 and 1.9 log CFU/mL, respectively in US and 5.6 and 5.0 log-units in PT samples. Presumptive enterococci presented similar distribution and abundance as presumptive fecal coliforms. Presumptive total and fecal coliforms and presumptive enterococci were not detected in tap water or in distributed reclaimed water. Antibiotic resistant populations across all samples analysed were <44% for sulfamethoxazole, <17% for tetracycline, and <4.8% for cefotaxime of the presumptive total coliforms; <84% for sulfamethoxazole, <49% for tetracycline, and <1.5% for cefotaxime of the presumptive fecal coliforms; and <126% for sulfamethoxazole, <241% for tetracycline, and <133% for cefotaxime of the presumptive enterococci (Figure S1). These high percentages (>100%) are likely an artifact, due to the loss of culture medium selectivity for enterococci, with the overgrowth of other bacterial groups on mEnterococci agar.
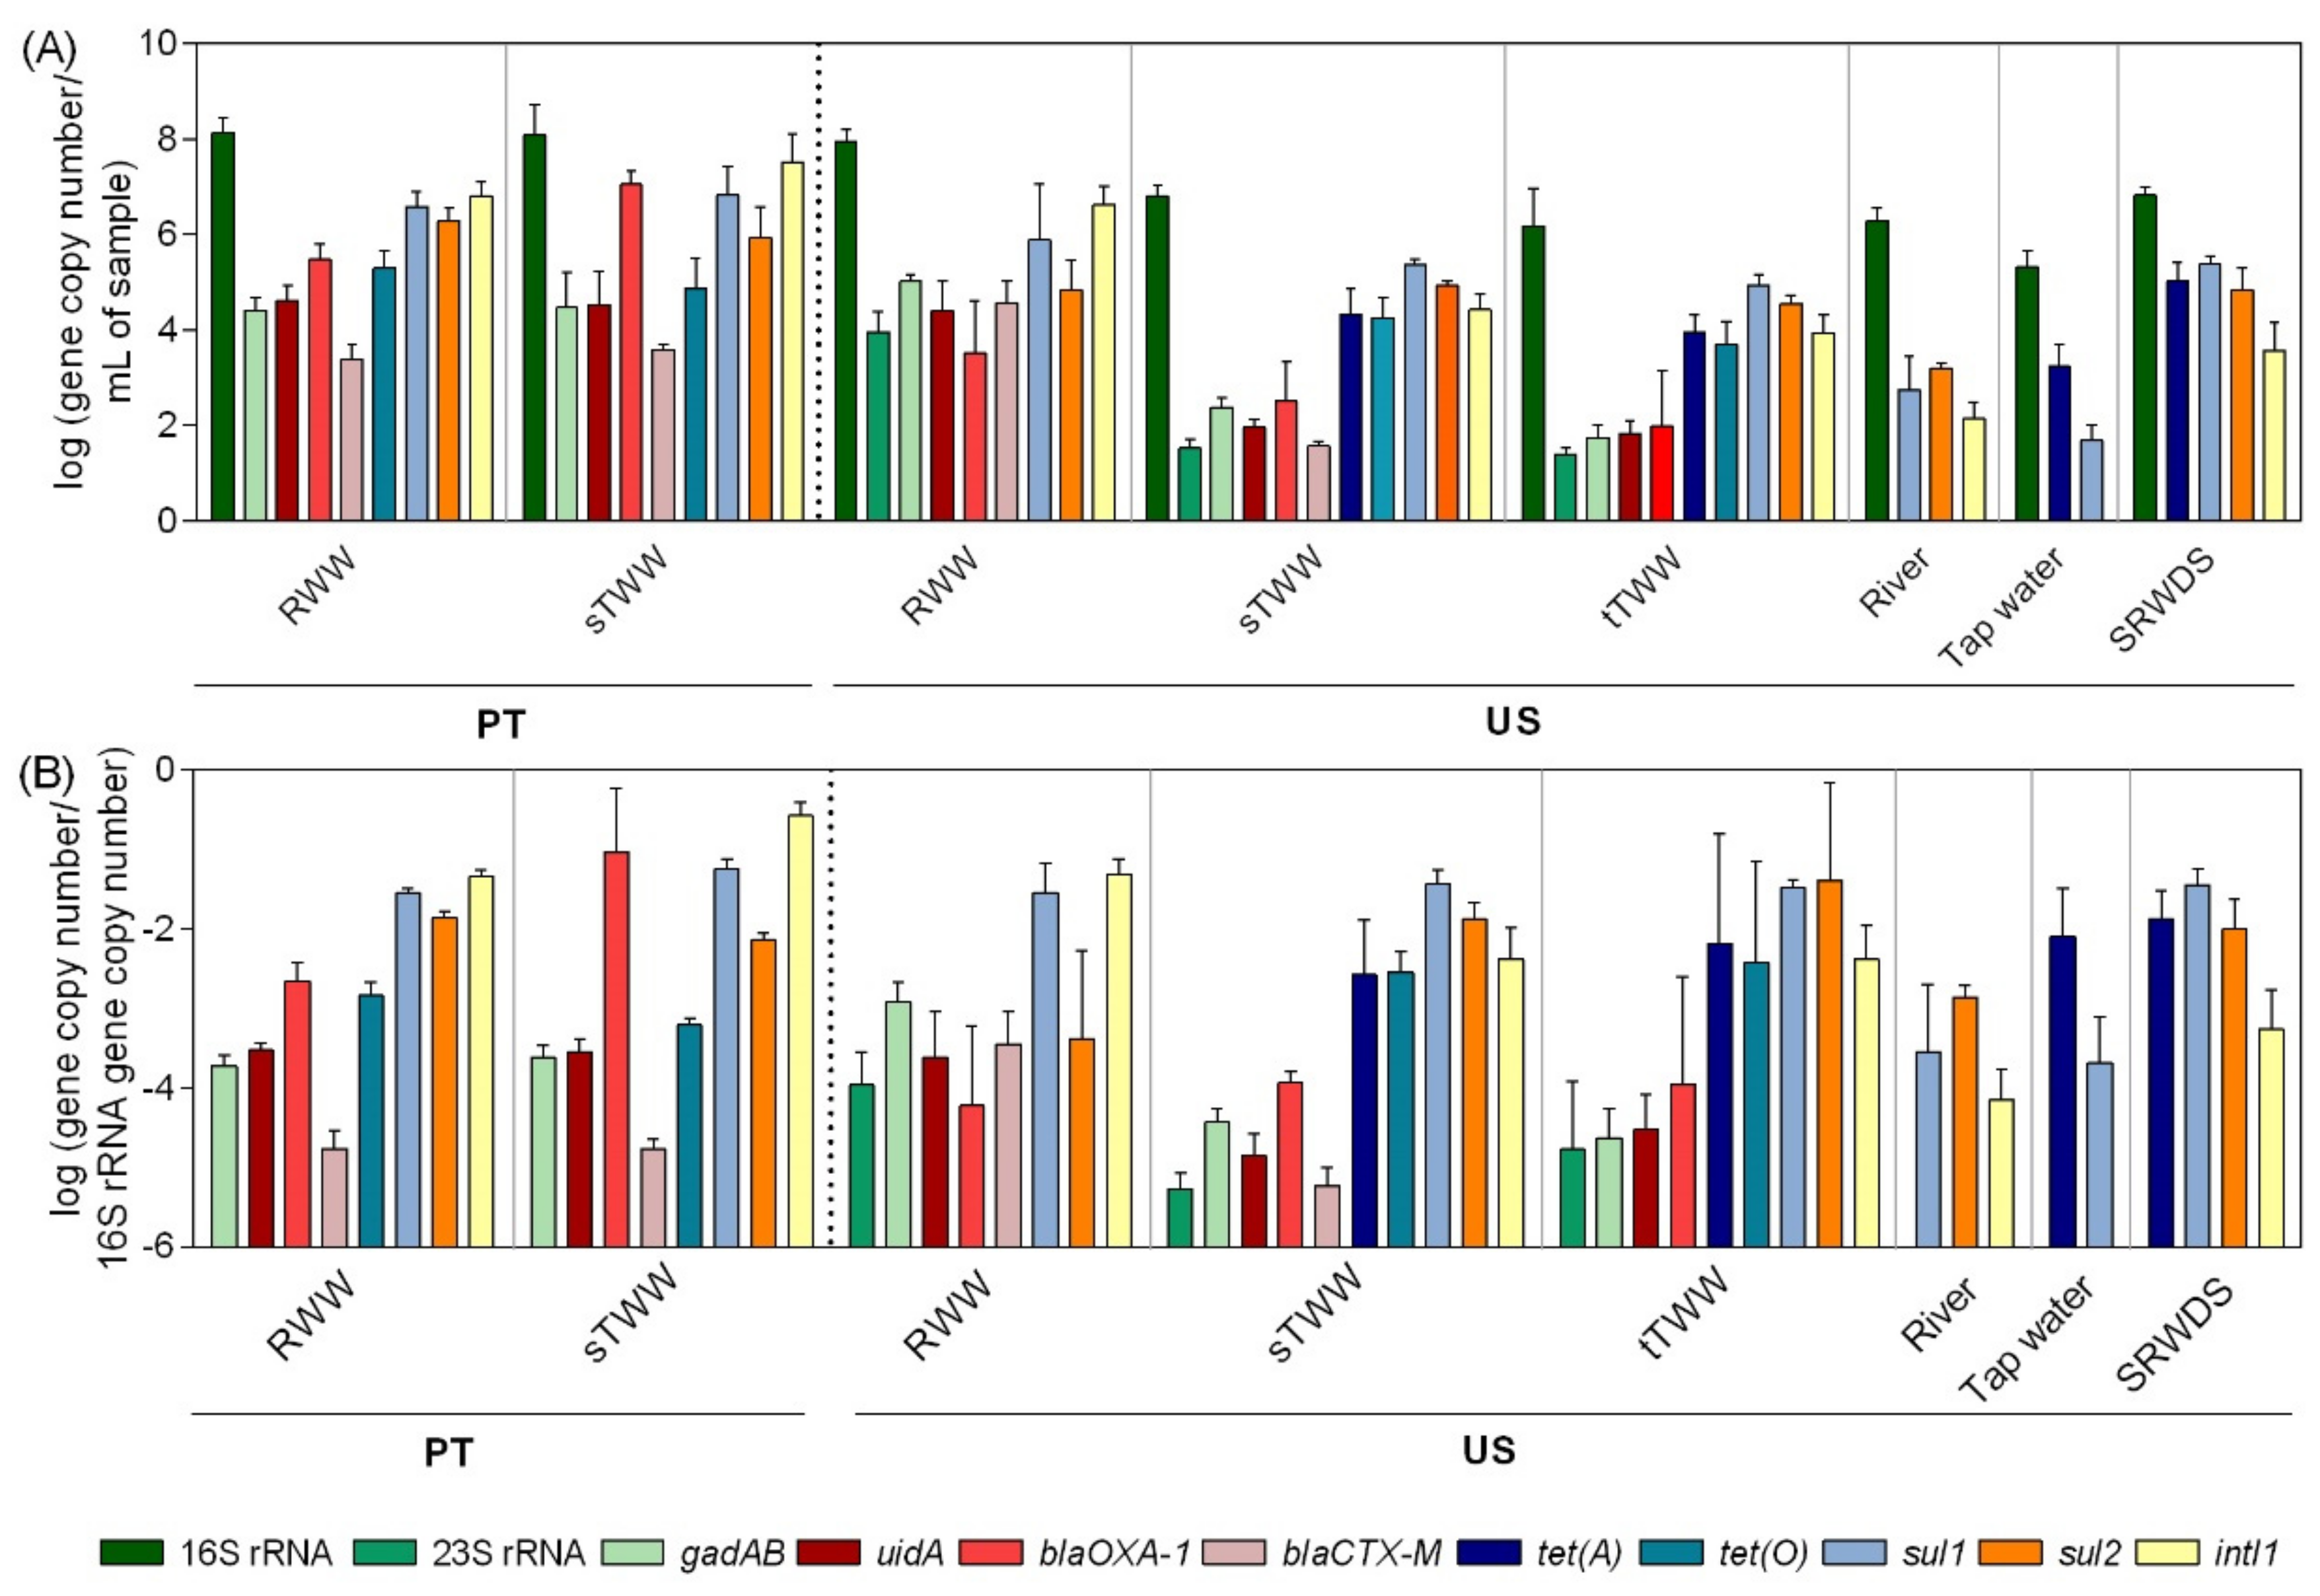
The 16S rRNA gene served as a proxy measurement of total bacteria, ranging from 8.2–5.3 log gene copies per mL of sample. The 16S rRNA gene absolute abundance values were observed to be the highest in PT influent wastewater samples and the lowest in tap water (Figure 2). Biomarker genes for Escherichia coli (E. coli), gadAB, and uidA, and for enterococci, 23S rRNA, were only detected in the influent wastewater, secondary effluent, and tertiary treatment effluent in the US samples. In PT wastewater samples, the genes gadAB and uidA were detected in the influent and secondary treatment effluent. Most of the time, the secondary treatment led to significant decreases in the abundance of these genes in US (p < 0.01), but not in PT wastewater samples (Figure S2). Presumptive total coliforms were detected in river water, while the genes gadAB and uidA could not be quantified in the same samples (Figure 1 and Figure 2). In general, as expected, the influent wastewater presented the highest absolute abundance of targeted ARGs (Figure 2). The genes encoding resistance to sulfonamides (sul1 and sul2) and the class I integron integrase (intI1) were the most abundant and prevalent in all samples, followed by genes encoding resistance to tetracyclines (tet(A) and tet(O)) and β-lactams (blaOXA-1 and blaCTX-M) (Figure 2 and Figure S2). Since the genes encoding resistance to tetracycline (tet(A) and tet(O)) were detected in the secondary treatment effluent and in the tertiary treatment effluent, but not in the influent wastewater, PCR inhibition was assessed. To test this, influent wastewater DNA extracts where it was not possible to quantify those genes were diluted or spiked with exogenous DNA template to confirm functionality of the assay. These assays did not lead to amplicon detection or permit the quantification of the spiked exogenous DNA, discarding the hypothesis of qPCR inhibition in those extracts. In general, the pattern of gene abundance per volume of water was similar of that of gene relative abundance (per 16S rRNA gene) (Figure 2). The simulated reclaimed water distribution system samples deviated most strongly from this trend, where a high 16S rRNA gene load likely contributed to low relative abundance determination in spite of the high load of ~5 log-units of gene copy per mL, of tet(A), sul1, and sul2 genes.

3.2. Molecular Biomarkers and Culture-Based Methods

A linear regression model was used to infer possible correlations between presumptive total and fecal coliforms and 16S rRNA, gadAB, uidA, blaOXA-1, blaCTX-M, tet(O), sul1, sul2, and intI1 genes. The strongest correlations, with R2 > 0.725 and p < 0.0001, were observed between the E. coli-specific genes, uidA and gadAB, the β-lactams encoding gene blaCTX-M and the class I integron integrase intI1 and the presumptive total coliforms, presumptive fecal coliforms, and cefotaxime-resistant presumptive total coliforms (Table 1). Correlations between fecal antibiotic resistant populations and the analysed genes were not among the strongest. The correlations between presumptive total, fecal, and cefotaxime-resistant total coliforms and the genes 16S rRNA, blaOXA-1, tet(O), sul1, and sul2 were not statistically significant.

3.3. Quantitative PCR Inter-Laboratory Comparability

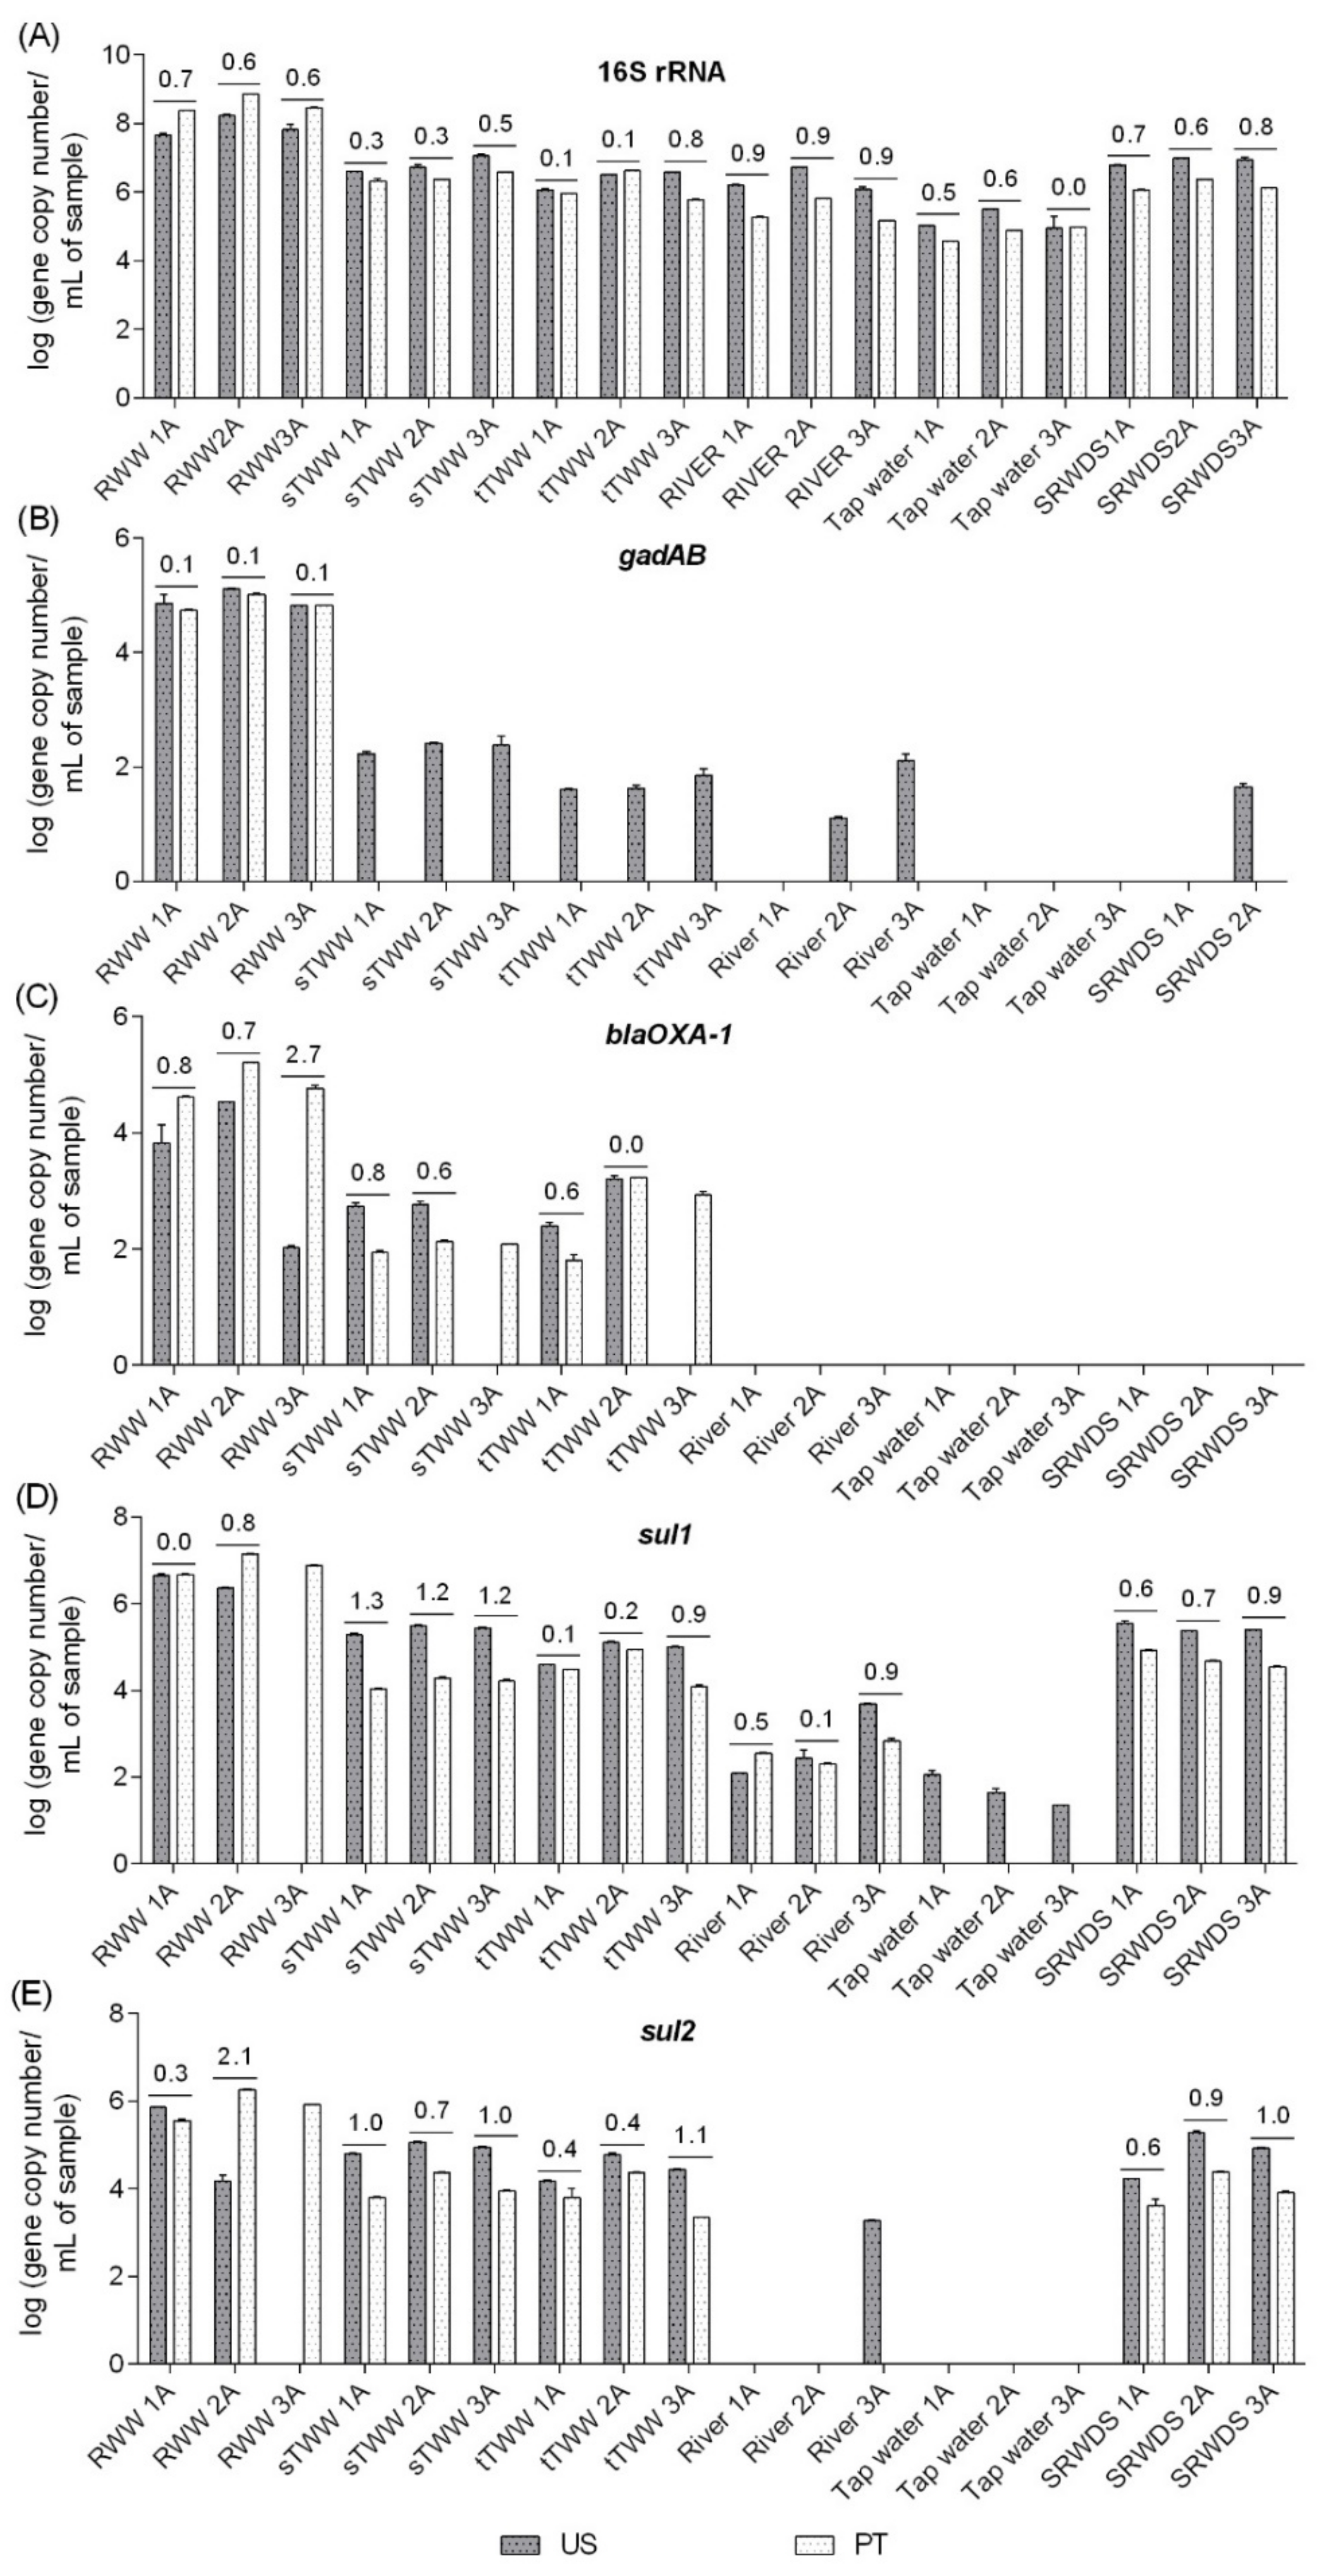
Quantitative PCR analyses were performed for the 16S rRNA, gadAB, blaOXA-1, sul1, and sul2 genes in two laboratories (US and PT) using the same DNA extracts, handled by the same operators. The following genes were selected for the inter-laboratory comparison, in part due to logistical reasons associated with the timeline of available protocols during the international exchange portion of the study: i) among the genes analysed in the US laboratory (16S rRNA, 23S rRNA, gadAB, sul1, sul2, tet(A), tet(O), and blaOXA-1), in the first stage, enterobacteria and related genes were observed to be better biomarkers for water quality than enterococci and related genes and ii) for some of these genes, it was possible to compare distinct protocols already tested in each laboratory, fulfilling the laboratories cross-comparison study aim. For these analyses, distinct equipment, protocols, references, and reagents were used (Table S2). Major discrepancies in the results corresponded to situations in which a specific gene was detected only by one of the laboratories. For example, gadAB in most of the samples in US or sul2 in wastewater influent 3A (RWW3A) in PT (Figure 3). Distinct limits of quantification might be a contributing factor (10 gene copies in the US and 43 gene copies in PT for gadAB gene) in some situations, while in other situations it may be related to shifts that could have occurred during DNA shipment (sul2 gene, quantification in river water 3A DNA extract). When quantification was possible in both laboratories, discrepancies between the two labs ranged from 0.0 log-units, for 16S rRNA gene in tap water 3A (TW3A) sample, to 2.7 log-units, for blaOXA-1 gene quantification in wastewater influent 3A (RWW3A) sample. In general, the PT lab yielded absolute abundance values that were equal or greater than those reported by the US lab for influent wastewater but tended to report lower values than the US lab for the other “cleaner” samples (Figure 3). With the exception of the discrepancy observed for the blaOXA-1 gene (variation between 0% and 57%), the gene quantification coefficient of variation was generally satisfactory between labs, ranging from 0% to 28% for the remaining analysed genes.

4. Discussion

In contrast with readily detected target biomarker genes in the US tertiary treatment effluent, culture-based methods consistently yielded CFUs/mL close to the LOQ: −1.7 log CFUs/mL for presumptive fecal coliforms and −1.7 log CFUs/mL for enterococci (Figure 1). However, presumptive total coliforms were detected in river water, while the gadAB and uidA genes could not be quantified in the same samples (Figure 1 and Figure 2). The absolute abundance of antibiotic resistance genes analysed was in agreement with the culture-based enumerations, where there were generally fewer cefotaxime-resistant CFUs than sulfamethoxazole- or tetracycline-resistant CFUs (Figure 1). The fact that the qPCR inhibition hypothesis was not confirmed in wastewater influent for the detection of tet(A) and tet(O) genes might suggest that these genes might be present in the influent wastewater samples at very low absolute abundance and were somehow enriched during secondary treatment.
In recent years, there has been growing interest in environmental surveillance of the levels of antibiotics, antibiotic resistant populations and ARGs, and of bacterial lineages found in wastewater treatment plants [10,17,44,45,46]. However, there is still a lack in knowledge regarding possible biomarkers that would be amenable for routine, accessible, and standardized monitoring targets and methodologies. To better understand how the occurrence of the various targets of this study relate to each other, a linear regression model was used to infer about possible correlations between presumptive total and fecal coliforms and 16S rRNA, gadAB, uidA, blaOXA-1, blaCTX-M, tet(O), sul1, sul2, and intI1 genes. These targets were selected based on the following key attributes: enterobacteria are common fecal indicators of water quality, the 16S rRNA gene corresponds to total bacteria, gadAB and uidA are genes specific to E. coli, the intI1 gene is an indicator of anthropogenic pollution and is associated with mobility of multi-antibiotic resistance, and the remaining genes as encoding antibiotic resistance commonly spread in wastewater environments, associated to pathogenic and commensal bacteria in humans [47,48,49,50]. The strongest correlations observed between the E. coli-specific genes (uidA and gadAB) and the presumptive total fecal and cefotaxime-resistant total coliforms confirm previous studies that demonstrate the usefulness of housekeeping genes gadAB or uidA to predict coliform abundance [36,51,52]. Also, the strong correlation between the intI1 gene and the presumptive total and fecal coliforms populations confirmed the role of intI1 as a proxy for human-driven pollution sources [29]. The strong correlation of the blaCTX-M gene with presumptive coliforms and total cefotaxime-resistant coliforms abundance suggests that coliforms could be major carriers of this resistance gene or that both coliforms and the antibiotic resistance gene are being discharged from a common source and with similar persistence rates in the water environments. However, such inferences would require confirmatory studies. The widespread occurrence of intI1 and blaCTX-M genes in Enterobacteriaceae (e.g. E. coli and K. pneumoniae) has been demonstrated [53,54,55], which might explain the strong correlations observed between these genes and presumptive total and fecal coliforms populations observed here. Interestingly, correlations between antibiotic resistant fecal populations and the analysed genes, were not among the strongest. This observation is in line with different possible explanations: i) that in contrast with other Enterobacteriaceae that comprise total coliforms, E. coli do not proliferate in water, ii) that antibiotic-resistant E. coli may have a lower fitness to grow in the culture medium used than other coliforms, or iii) that it grows on that medium but not all cells form the typical blue colonies in the presence of antibiotics, due to metabolic pathway regulation. The observed correlations are in any case relevant findings considering that coliforms are frequently carriers of antibiotic resistance genes and associated with human bacterial infections. Correlations among the targets of interest in this study suggest the possibility of simplified monitoring schemes in which a target can be selected to represent potential for all of the other targets to be present. Such simplified methods are needed particularly in world regions where monitoring is needed, but laboratories are not readily available or are poorly equipped.
Rocha and colleagues [45] evaluated the variability of qPCR procedures for quantification of ARGs using the same DNA extracts and qPCR protocols between five different laboratories. Although in our study the qPCR protocols were not the same in both laboratories, our results are in agreement with those of Rocha et al. [45] in which the coefficient of variation observed ranged from 3% to 28%. Although this range of variation was determined for quantifications performed in distinct laboratories, most of the times the difference of samples Ct values between the quantifications performed in both laboratories was <3.3 cycles (corresponding to 1 log of difference between samples) suggesting that the differences in gene copy number observed might be due to the number of copies established in each laboratory. The present study was more realistic in that distinct qPCR standards, protocols, and equipment were applied, as would be the case in published literature from different labs. These results are promising, suggesting that qPCR could provide standardized quantification of target ARGs and other relevant genes in labs for global monitoring.

5. Conclusions

These findings aid in identifying simplified monitoring schemes for environmental sources of antibiotic resistance that are suitable for a wide range of water types and feasible for low-tech labs across the globe. Comparison of gene quantification between the two laboratories indicated that qPCR can yield consistent and highly quantitative results, even when different reagents, protocols, and equipment are used. Regression analyses comparing the abundance values of cultivable bacteria and gadAB, uidA, blaCTX-M, and intI1 indicated that these genes may be suitable biomarkers for total coliforms, beta-lactam resistant subpopulations, and their possible role in the dissemination of antibiotic resistance in the environment.

Supplementary Materials

The following are available online at https://www.mdpi.com/1660-4601/16/21/4217/s1: Table S1: water systems sampled and sampling dates and Table S2: quantitative-PCR conditions used in this study. US refers to protocols used in the United States and PT to protocols used in Portugal. Figure S1: percentage of “resistant” bacteria (i.e., growing in presence of target antibiotic at select concentration) and Figure S2: absolute abundance values (gene copy number/mL of sample) of the target genes in the six water types. References [56,57] are cited in the supplementary materials.

Author Contributions

Conceptualization, J.R., T.F., A.P., and C.M.M.; methodology, J.R. and T.F.; validation, J.R. and T.F..; formal analysis, J.R. and T.F.; investigation, J.R. and T.F.; resources, M.V.R. and N.Z.; data curation, J.R. and T.F.; writing—original draft preparation, J.R. and T.F.; writing—review and editing, A.P. and C.M.M.; supervision, A.P. and C.M.M.; project administration, A.P. and C.M.M.; funding acquisition, A.P. and C.M.M.

Funding

The Portugal co-authors acknowledge the Fundação Luso Americana para o Desenvolvimento - FLAD/NSF - “Programa de Redes de Investigação Portugal/EUA 2015” - Ciência Ambiental - Proj 2015/298 and the European Regional Development Fund (FEDER), through the North Regional Operational Program (North PO), under the project DEPCAT.: Demonstration of new equipment involving integrated catalytic processes for the treatment of organic pollutants and disinfection of waters (NORTE-01-0247-FEDER-033330). JR was supported by the International PhD Programme in Biotechnology – BIOTECH. DOC (NORTE-08-5369-FSE-000007). Funding was also provided by the U.S. National Science Foundation Partnership in International Research and Education award OISE 1545756.

Acknowledgments

The authors thank Suraj Gupta and Mathew Chan of Virginia Tech, and the UWTP operators, who assisted with the US and PT sample collection.

Conflicts of Interest

The authors declare no conflict of interest.

References

  1. WHO (World Health Organization). Antimicrobial Resistance: Global Report on Surveillance; WHO: Geneva, Switzerland, 2014. [Google Scholar]
  2. Bush, K.; Courvalin, P.; Dantas, G.; Davies, J.; Eisenstein, B.; Huovinen, P.; Jacoby, G.A.; Kishony, R.; Kreiswirth, B.N.; Kutter, E.; et al. Tackling antibiotic resistance. Nat. Rev. Microbiol. 2011, 9, 894–896. [Google Scholar] [CrossRef] [PubMed]
  3. Dodds, D.R. Antibiotic resistance: A current epilogue. Biochem. Pharmacol. 2017, 134, 139–146. [Google Scholar] [CrossRef] [PubMed]
  4. Pruden, A.; Larsson, D.G.; Amézquita, A.; Collignon, P.; Brandt, K.K.; Graham, D.W.; Lazorchak, J.M.; Suzuki, S.; Silley, P.; Snape, J.R.; et al. Management options for reducing the release of antibiotics and antibiotic resistance genes to the environment. Environ. Health Perspect. 2013, 121, 878–885. [Google Scholar] [CrossRef] [PubMed]
  5. Pruden, A.; Pei, R.; Storteboom, H.; Carlson, K.H. Antibiotic resistance genes as emerging contaminants: Studies in northern Colorado. Environ. Sci. Technol. 2006, 40, 7445–7450. [Google Scholar] [CrossRef] [PubMed]
  6. Rysz, M.; Alvarez, P.J. Amplification and attenuation of tetracycline resistance in soil bacteria: Aquifer column experiments. Water Res. 2004, 38, 3705–3712. [Google Scholar] [CrossRef]
  7. Manaia, C.M.; Macedo, G.; Fatta-Kassinos, D.; Nunes, O.C. Antibiotic resistance in urban aquatic environments: Can it be controlled? Appl. Microbiol. Biotechnol. 2016, 100, 1543–1557. [Google Scholar] [CrossRef]
  8. Manaia, C.M.; Rocha, J.; Scaccia, N.; Marano, R.; Radu, E.; Biancullo, F.; Cerqueira, F.; Fortunato, G.; Iakovides, I.C.; Zammit, I.; et al. Antibiotic resistance in wastewater treatment plants: Tackling the black box. Environ. Int. 2018, 115, 312–324. [Google Scholar] [CrossRef]
  9. Vaz-Moreira, I.; Egas, C.; Nunes, O.C.; Manaia, C.M. Bacterial diversity from the source to the tap: A comparative study based on 16S rRNA gene-DGGE and culture-dependent methods. FEMS Microbiol. Ecol. 2013, 83, 361–374. [Google Scholar] [CrossRef]
  10. Pärnänen, K.M.M.; Narciso-da-Rocha, C.; Kneis, D.; Berendonk, T.U.; Cacace, D.; Do, T.T.; Elpers, C.; Fatta-Kassinos, D.; Henriques, I.; Jaeger, T.; et al. Antibiotic resistance in European wastewater treatment plants mirrors the pattern of clinical antibiotic resistance prevalence. Sci. Adv. 2019, 5, eaau9124. [Google Scholar] [CrossRef] [Green Version]
  11. Kim, J.; Lim, J.; Lee, C. Quantitative real-time PCR approaches for microbial community studies in wastewater treatment systems: Applications and considerations. Biotechnol. Adv. 2013, 31, 1358–1373. [Google Scholar] [CrossRef]
  12. Klein, D. Quantification using real-time PCR technology: Applications and limitations. Trends Mol. Med. 2002, 8, 257–260. [Google Scholar] [CrossRef]
  13. Valasek, M.A.; Repa, J.J. The power of real-time PCR. Adv. Physiol. Educ. 2005, 29, 151–159. [Google Scholar] [CrossRef] [PubMed]
  14. Bustin, S.A. Why the need for qPCR publication guidelines?-The case for MIQE. Methods 2010, 50, 217–226. [Google Scholar] [CrossRef] [PubMed]
  15. Bustin, S.A.; Benes, V.; Garson, J.A.; Hellemans, J.; Huggett, J.; Kubista, M.; Mueller, R.; Nolan, T.; Pfaffl, M.W.; Shipley, G.L.; et al. The MIQE guidelines: Minimum information for publication of quantitative real-time PCR experiments. Clin. Chem. 2009, 55, 611–622. [Google Scholar] [CrossRef] [PubMed]
  16. Böckelmann, U.; Dörries, H.H.; Ayuso-Gabella, M.N.; De Marçay, M.S.; Tandoi, V.; Levantesi, C.; Masciopinto, C.; Van Houtte, E.; Szewzyk, U.; Wintgens, T.; et al. Quantitative PCR monitoring of antibiotic resistance genes and bacterial pathogens in three european artificial groundwater recharge systems. Appl. Environ. Microbiol. 2009, 75, 154–163. [Google Scholar] [CrossRef]
  17. Narciso-da-Rocha, C.; Rocha, J.; Vaz-Moreira, I.; Lira, F.; Tamames, J.; Henriques, I.; Martinez, J.L.; Manaia, C.M. Bacterial lineages putatively associated with the dissemination of antibiotic resistance genes in a full-scale urban wastewater treatment plant. Environ. Int. 2018, 118, 179–188. [Google Scholar] [CrossRef] [PubMed]
  18. Lapara, T.M.; Burch, T.R.; McNamara, P.J.; Tan, D.T.; Yan, M.; Eichmiller, J.J. Tertiary-treated municipal wastewater is a significant point-source of antibiotic resistance genes into Duluth-Superior Harbor. Environ. Sci. Technol. 2011, 45, 9543–9549. [Google Scholar] [CrossRef] [PubMed]
  19. McKinney, C.W.; Dungan, R.S.; Moore, A.; Leytem, A.B. Occurrence and abundance of antibiotic resistance genes in agricultural soil receiving dairy manure. FEMS Microbiol. Ecol. 2018, 94, 1–10. [Google Scholar] [CrossRef]
  20. Espy, M.J.; Uhl, J.R.; Sloan, L.M.; Buckwalter, S.P.; Jones, M.F.; Vetter, E.A.; Yao, J.D.C.; Wengenack, N.L.; Rosenblatt, J.E.; Cockerill, F.R.; et al. Real-Time PCR in clinical microbiology: Applications for routine laboratory testing. Clin. Microbiol. Rev. 2006, 19, 165–256. [Google Scholar] [CrossRef]
  21. Bessetti, B.J. An introduction to PCR inhibitors. J. Microbiol. Methods 2007, 28, 9–10. [Google Scholar]
  22. Christou, A.; Agüera, A.; Bayona, J.M.; Cytryn, E.; Fotopoulos, V.; Lambropoulou, D.; Manaia, C.M.; Michael, C.; Revitt, M.; Schröder, P.; et al. The potential implications of reclaimed wastewater reuse for irrigation on the agricultural environment: The knowns and unknowns of the fate of antibiotics and antibiotic resistant bacteria and resistance genes—A review. Water Res. 2017, 123, 448–467. [Google Scholar] [CrossRef] [PubMed]
  23. Fortunato, G.; Vaz-Moreira, I.; Becerra-Castro, C.; Nunes, O.C.; Manaia, C.M. A rationale for the high limits of quantification of antibiotic resistance genes in soil. Environ. Pollut. 2018, 243, 1696–1703. [Google Scholar] [CrossRef] [PubMed]
  24. Villarreal, J.V.; Jungfer, C.; Obst, U.; Schwartz, T. DNase I and Proteinase K eliminate DNA from injured or dead bacteria but not from living bacteria in microbial reference systems and natural drinking water biofilms for subsequent molecular biology analyses. J. Microbiol. Methods 2013, 94, 161–169. [Google Scholar] [CrossRef] [PubMed]
  25. Griffin, D.W.; Lipp, E.K.; McLaughlin, M.R.; Rose, J.B. Marine recreation and public health microbiology: Quest for the ideal indicator. Bioscience 2006, 51, 817. [Google Scholar] [CrossRef]
  26. Anderson, K.L.; Whitlock, J.E.; Harwood, V.J. Persistence and differential survival of fecal indicator bacteria in subtropical waters and sediments. Appl. Environ. Microbiol. 2005, 71, 3041–3048. [Google Scholar] [CrossRef]
  27. Rock, C.M.; Brassill, N.; Dery, J.L.; Carr, D.; McLain, J.E.; Bright, K.R.; Gerba, C.P. Review of water quality criteria for water reuse and risk-based implications for irrigated produce under the FDA Food Safety Modernization Act, produce safety rule. Environ. Res. 2019, 172, 616–629. [Google Scholar] [CrossRef]
  28. Hutinel, M.; Huijbers, P.M.C.; Fick, J.; Åhrén, C.; Larsson, D.J.C.; Flach, C.-F. Population-level surveillance of antibiotic resistance in Escherichia coli through sewage analysis. Euro Surveill. 2019, 24, 1–11. [Google Scholar] [CrossRef]
  29. Gillings, M.R.; Gaze, W.H.; Pruden, A.; Smalla, K.; Tiedje, J.M.; Zhu, Y.G. Using the class 1 integron-integrase gene as a proxy for anthropogenic pollution. ISME J. 2015, 9, 1269–1279. [Google Scholar] [CrossRef]
  30. Vaz-Moreira, I.; Nunes, O.C.; Manaia, C.M. Diversity and antibiotic resistance patterns of Sphingomonadaceae isolates from drinking water. Appl. Environ. Microbiol. 2011, 77, 5697–5706. [Google Scholar] [CrossRef]
  31. WHO (World Health Organization). Water quality - Guidelines, Standards and Health: Assessment of risk and risk management for water-related infectious disease; WHO: Geneva, Switzerland, 2001. [Google Scholar]
  32. Varela, A.R.; Macedo, G.N.; Nunes, O.C.; Manaia, C.M. Genetic characterization of fluoroquinolone resistant Escherichia coli from urban streams and municipal and hospital effluents. FEMS Microbiol. Ecol. 2015, 91, 1–12. [Google Scholar] [CrossRef]
  33. Novo, A.; André, S.; Viana, P.; Nunes, O.C.; Manaia, C.M. Antibiotic resistance, Antimicrobial residues and bacterial community composition in urban wastewater. Water Res. 2013, 47, 1875–1887. [Google Scholar] [CrossRef] [PubMed]
  34. Clinical and Laboratory Standards Institute (CLSI). Performance Standards for Antimicrobial Susceptibility Testing, 26th ed.; CLSI Supplement M100S; Clinical and Laboratory Standards Institute: Wayne, PA, USA, 2016. [Google Scholar]
  35. Ludwig, W.; Schleifer, K.H. How quantitative is quantitative PCR with respect to cell counts? Syst. Appl. Microbiol. 2000, 23, 556–562. [Google Scholar] [CrossRef]
  36. Chen, Y.C.; Higgins, M.J.; Maas, N.A.; Murthy, S.N. DNA extraction and Escherichia coli quantification of anaerobically digested biosolids using the competitive touchdown PCR method. Water Res. 2006, 40, 3037–3044. [Google Scholar] [CrossRef] [PubMed]
  37. Chern, E.C.; Brenner, K.P.; Wymer, L.; Haugland, R.A. Comparison of fecal indicator bacteria densities in marine recreational waters by qPCR. Water Qual. Expo. Heal. 2009, 1, 203–214. [Google Scholar] [CrossRef]
  38. Yang, Y.; Zhang, T.; Zhang, X.X.; Liang, D.W.; Zhang, M.; Gao, D.W.; Zhu, H.G.; Huang, Q.G.; Fang, H.H.P. Quantification and characterization of β-lactam resistance genes in 15 sewage treatment plants from East Asia and North America. Appl. Microbiol. Biotechnol. 2012, 95, 1351–1358. [Google Scholar] [CrossRef]
  39. Marti, E.; Variatza, E.; Balcázar, J.L. Bacteriophages as a reservoir of extended-spectrum β-lactamase and fluoroquinolone resistance genes in the environment. Clin. Microbiol. Infect. 2014, 20, O456–O459. [Google Scholar] [CrossRef]
  40. Pei, R.; Kim, S.C.; Carlson, K.H.; Pruden, A. Effect of River Landscape on the sediment concentrations of antibiotics and corresponding antibiotic resistance genes (ARG). Water Res. 2006, 40, 2427–2435. [Google Scholar] [CrossRef]
  41. Barraud, O.; Baclet, M.C.; Denis, F.; Ploy, M.C. Quantitative multiplex real-time PCR for detecting class 1, 2 and 3 integrons. J. Antimicrob. Chemother. 2010, 65, 1642–1645. [Google Scholar] [CrossRef] [Green Version]
  42. Aminov, R.; Garrigues-Jeanjean, N.; Mackie, R. Molecular ecology of tetracycline resistance: Development and validation of primers for detection of tetracycline resistance genes encoding ribosomal protection proteins. Appl. Environ. Microbiol. 2001, 67, 22–32. [Google Scholar] [CrossRef]
  43. McKinney, C.W.; Pruden, A. Ultraviolet disinfection of antibiotic resistant bacteria and their antibiotic resistance genes in water and wastewater. Environ. Sci. Technol. 2012, 46, 13393–13400. [Google Scholar] [CrossRef]
  44. Brankatschk, R.; Bodenhausen, N.; Zeyer, J.; Bürgmann, H. Simple absolute quantification method correcting for quantitative PCR efficiency variations for microbial community samples. Appl. Environ. Microbiol. 2012, 78, 4481–4489. [Google Scholar] [CrossRef] [PubMed]
  45. Rocha, J.; Cacace, D.; Kampouris, I.; Guilloteau, H.; Jäger, T.; Marano, R.B.M.; Karaolia, P.; Manaia, C.M.; Merlin, C.; Fatta-Kassinos, D.; et al. Inter-laboratory calibration of quantitative analyses of antibiotic resistance genes. J. Environ. Chem. Eng. 2018, in press. [Google Scholar] [CrossRef]
  46. Rodriguez-Mozaz, S.; Chamorro, S.; Marti, E.; Huerta, B.; Gros, M.; Sànchez-Melsió, A.; Borrego, C.M.; Barceló, D.; Balcázar, J.L. Occurrence of antibiotics and antibiotic resistance genes in hospital and urban wastewaters and their impact on the receiving river. Water Res. 2015, 69, 234–242. [Google Scholar] [CrossRef] [PubMed]
  47. Ashbolt, N.J.; Grabow, W.O.K.; Snozzi, M. Indicators of Microbial Water Quality; IWA: London, UK, 2001; pp. 289–316. [Google Scholar]
  48. Du, J.; Ren, H.; Geng, J.; Zhang, Y.; Xu, K.; Ding, L. Occurrence and abundance of tetracycline, sulfonamide resistance genes, and class 1 integron in five wastewater treatment plants. Environ. Sci. Pollut. Res. 2014, 21, 7276–7284. [Google Scholar] [CrossRef] [PubMed]
  49. Zhang, X.X.; Zhang, T.; Fang, H.H.P. Antibiotic resistance genes in water environment. Appl. Microbiol. Biotechnol. 2009, 82, 397–414. [Google Scholar] [CrossRef]
  50. Szczepanowski, R.; Linke, B.; Krahn, I.; Gartemann, K.H.; Gützkow, T.; Eichler, W.; Pühler, A.; Schlüter, A. Detection of 140 clinically relevant antibiotic-resistance genes in the plasmid metagenome of wastewater treatment plant bacteria showing reduced susceptibility to selected antibiotics. Microbiology 2009, 155, 2306–2319. [Google Scholar] [CrossRef] [Green Version]
  51. Grant, M.A.; Weagant, S.D.; Feng, P. Glutamate decarboxylase genes as a prescreening marker for detection of pathogenic Escherichia coli groups. Appl. Environ. Microbiol. 2001, 67, 3110–3114. [Google Scholar] [CrossRef]
  52. Noble, R.T.; Blackwood, A.D.; Griffith, J.F.; McGee, C.D.; Weisberg, S.B. Comparison of rapid quantitative PCR-Based and conventional culture-based methods for enumeration of Enterococcus spp. and Escherichia coli in recreational waters. Appl. Environ. Microbiol. 2010, 76, 7437–7443. [Google Scholar] [CrossRef]
  53. Zhao, W.H.; Hu, Z.Q. Epidemiology and genetics of CTX-M extended-spectrum β-lactamases in Gram-negative bacteria. Crit. Rev. Microbiol. 2013, 39, 79–101. [Google Scholar] [CrossRef]
  54. Silva, I.; Tacão, M.; Tavares, R.D.S.; Miranda, R.; Araújo, S.; Manaia, C.M.; Henriques, I. Fate of cefotaxime-resistant Enterobacteriaceae and ESBL-producers over a full-scale wastewater treatment process with UV disinfection. Sci. Total Environ. 2018, 639, 1028–1037. [Google Scholar] [CrossRef]
  55. Rossolini, G.M.; D’Andrea, M.M.; Mugnaioli, C. The spread of CTX-M-type extended-spectrum β-lactamases. Clin. Microbiol. Infect. 2008, 14, 33–41. [Google Scholar] [CrossRef] [PubMed]
  56. Suzuki, M.T.; Taylor, L.T.; DeLong, E.F. Quantitative analysis of small-subunit rRNA genes in mixed microbial populations via 5’-nuclease assays. Appl. Environ. Microbiol. 2000, 66, 4605–4614. [Google Scholar] [CrossRef] [PubMed]
  57. Denman, S.E.; McSweeney, C.S. Development of a real-time PCR assay for monitoring anaerobic fungal and cellulolytic bacterial populations within the rumen. FEMS Microbiol. Ecol. 2006, 58, 572–582. [Google Scholar] [CrossRef] [PubMed]
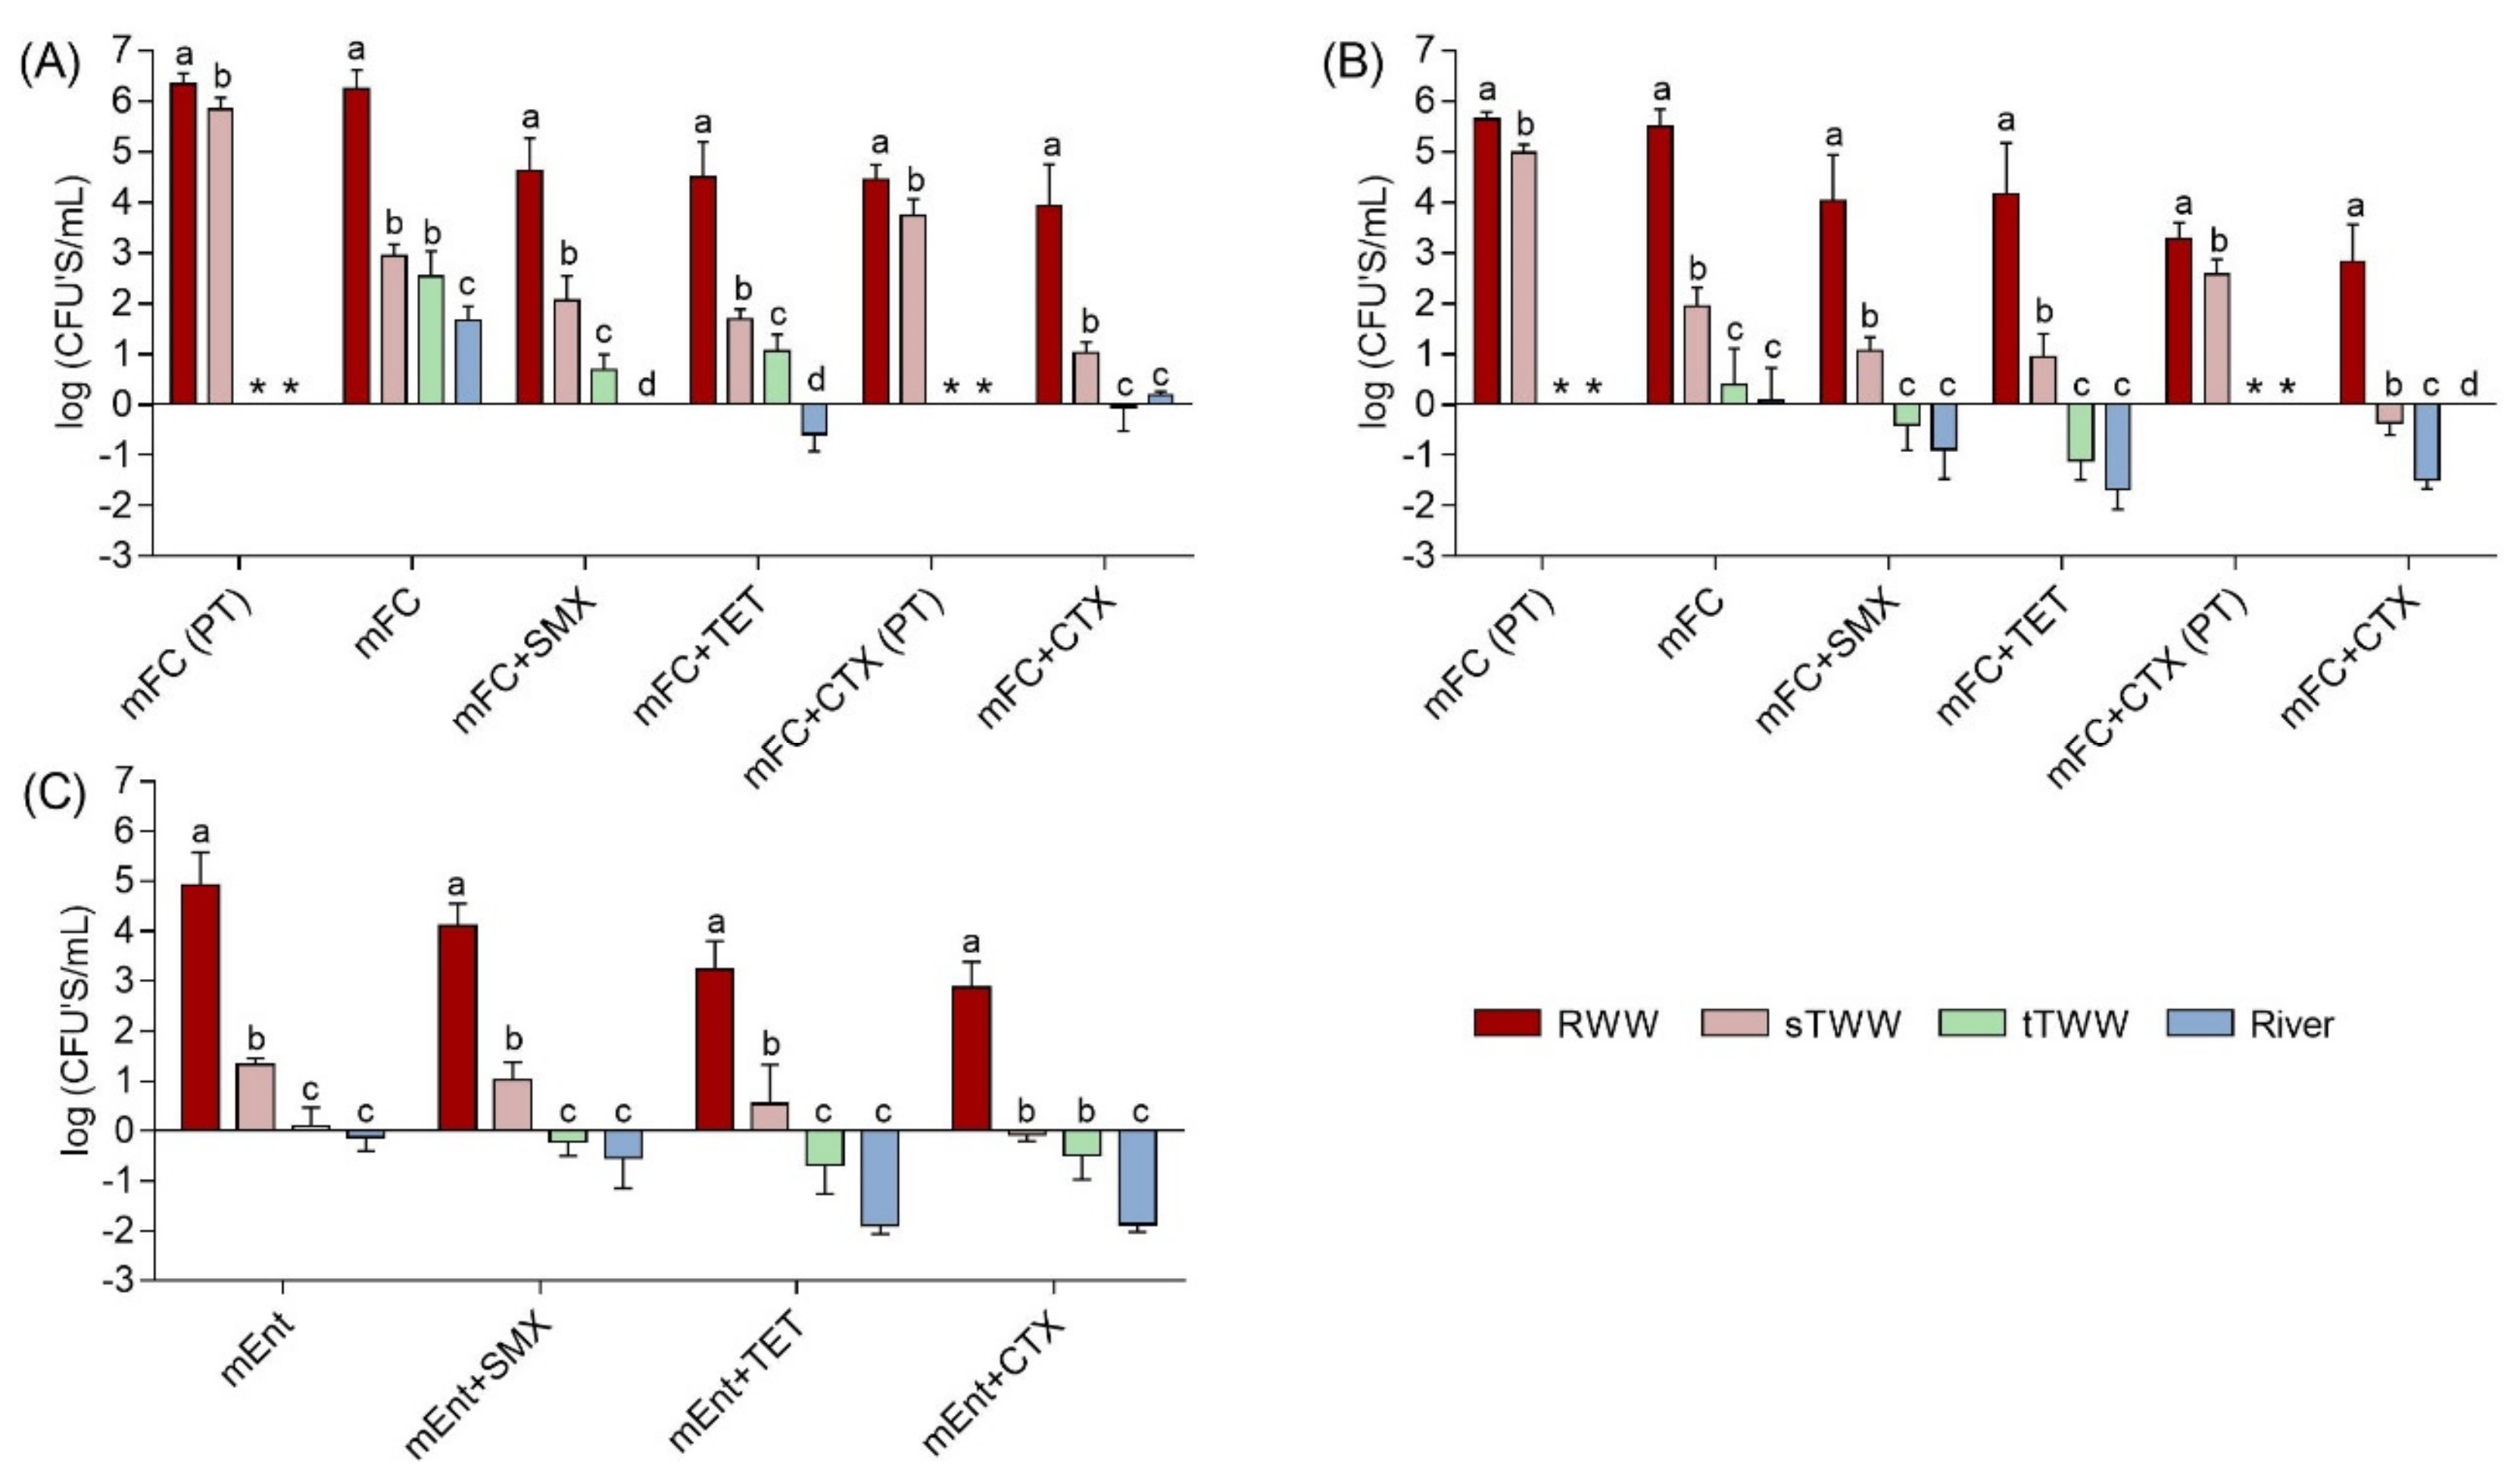
Figure 1. Colony forming units (CFUs) of (A) presumptive total coliforms, (B) presumptive fecal coliforms, and (C) presumptive enterococci expressed as log CFU /mL of sample. Bacteria were cultured on membrane fecal coliform (mFC) and m-Enterococcus (mEnt) media, with and without antibiotics: cefotaxime (CTX, 4 mg/L), tetracycline (TET, 16 mg/L), or sulfamethoxazole (SMX, 350 mg/L). Results were compared for four water types RWW: wastewater treatment plant influent, sTWW: wastewater collected after secondary wastewater treatment, tTWW: wastewater collected after UV disinfection wastewater treatment, and river water. CFUs were below the limit of quantification (1 CFU/100 mL, corresponding to −2 log units) for tap water and simulated reclaimed water distribution system water samples. a, b, c, and d indicate significantly different groups comparing the different types of water (p < 0.01). PT refers to data obtained of samples collected in Portugal, the other data presented refer to data obtained of samples collected in United States. * -refers to data not determined.
Ijerph 16 04217 g001
Figure 2. Genes absolute and relative abundance values across the water samples analysed.(A) Absolute abundance (gene copy number/mL of sample) and (B) relative abundance values (gene copy number/16S rRNA gene copy number) of the analysed genes in six water systems. RWW: wastewater treatment plant influent, sTWW: wastewater collected after secondary wastewater treatment, tTWW: wastewater collected after UV disinfection wastewater treatment, river water, tap water, and SRWDS: simulated reclaimed water distribution system. PT refers to data obtained from samples collected in Portugal, the other data presented refer to data obtained of samples collected in the US. Error bars represent the standard deviation (n = 3 and n = 2 independent samples, for US and PT, respectively). In PT samples, the genes 23S rRNA and tet(A) were not analysed. In US samples, the absence of the genes blaOXA-1, tet(A), tet(O), sul2, and intI1 is due to their quantification below the limit of detection while the absence of the genes 23S rRNA, gadAB, uidA, and blaCTX-M was due to genes quantification below the limit of quantification.
Ijerph 16 04217 g002
Figure 3. Inter-laboratory comparison of absolute abundance (gene copy number/mL of sample) measurements of the target genes in the six water types. RWW: wastewater treatment plant influent, sTWW: wastewater collected after secondary wastewater treatment, tTWW: wastewater collected after UV disinfection wastewater treatment;, river water, tap water, and SRWDS: simulated reclaimed water distribution system. PT refers to genes quantification performed in Portugal, the other data presented refer to genes quantification performed in the US. The lack of gene quantification (LOQ) performed in Portugal for some samples was due to quantification below the limit of detection and the lack of gene quantification performed in US for some samples was due to quantification below the limit of detection (blaOXA-1 and sul2) or due to quantification below the limit of quantification (gadAB). The absolute difference values in the mean quantification of technical triplicates are indicated above the bars, whenever the target was quantifiable in both labs. The gene copy numbers considered as LOQ were 100 vs. 402 for 16S rRNA gene, 10 vs. 43 for gadAB, 10 vs. 38 for blaOXA-1, 10 vs. 96 for sul1, and 100 vs. 47 for sul2, respectively, in the US and in PT. The quantitative polymerase chain reaction (qPCR) conditions used in both laboratories for each gene quantification are presented in the Table S2.
Ijerph 16 04217 g003
Table 1. Linear regression coefficients comparing target genes and colony forming units on mFC medium with and without cefotaxime (CTX, 4 mg/L). n = 13 for these analyses, including wastewater treatment plant influent (n = 3), wastewater collected after secondary wastewater treatment (n = 3), and wastewater collected after UV disinfection wastewater treatment (n = 3) samples collected in US and wastewater treatment plant influent (n = 2) and wastewater collected after secondary wastewater treatment (n = 2) samples collected in PT. TC—presumptive total coliforms and, FC—presumptive fecal coliforms.
mFC (TC)mFC (FC)mFC+CTX (TC)mFC+CTX (FC)
16S rRNA0.3990.3750.3310.000
gadAB0.868*0.861*0.764*0.016
uidA0.805*0.795*0.922*0.567
blaOXA-10.3270.2980.2790.055
blaCTX-M0.750*0.761*0.738*0.048
tet(O)0.4940.4890.5210.333
sul10.2470.2200.1570.037
sul20.1570.1490.1510.003
intI10.762*0.750*0.725*0.000
* statistically significant (p < 0.0001).