Article

Ambient Particulate Matter Exposure and Under-Five and Maternal Deaths in Asia

by
Wei-Hung Lien
1,†,
Patrick Opiyo Owili
2,†,
Miriam Adoyo Muga
3 and
Tang-Huang Lin
4,*,†
1
Graduate Institute of Space Science and Engineering, National Central University, Taoyuan City 32001, Taiwan
2
Department of Public Health, School of Health Sciences, University of Eastern Africa, Baraton, Eldoret 30100, Kenya
3
Department of Human Nutrition and Dietetics, School of Medicine and Health Sciences, Kabarak University, P.O. Box Private Bag 20157 Kabarak, Kenya
4
Center for Space and Remote Sensing Research, National Central University, Taoyuan City 32001, Taiwan
*
Author to whom correspondence should be addressed.
These authors contributed equally to this work.
Int. J. Environ. Res. Public Health 2019, 16(20), 3855; https://doi.org/10.3390/ijerph16203855
Submission received: 7 September 2019 / Revised: 3 October 2019 / Accepted: 10 October 2019 / Published: 12 October 2019
(This article belongs to the Section Environmental Health)

Abstract

:
The Asian region is one of the major emission sources of air pollution. Although ambient PM2.5 has been linked to several health risks in high-, low-, and middle-income countries, the further analysis of type impact is still rare but significant. The PM2.5 distribution retrieved from MODIS (Moderate Resolution Imaging Spectroradiometer) aerosol optical depth products within 16 years thus explored the associations between under-five and maternal mortality for 45 countries in Asia. Both the nonparametric (Generalized Additive Mixed-Effect) and parametric (Generalized Linear Mixed-Effect) models were employed to analyze the collected datasets. The results show that the levels of PM2.5 in Asian sub-regions were higher than the Global Air Quality Standards. Biomass PM2.5 concentrations was associated with increased the rate of under-five (Incidence Rate Ratio, IRR = 1.29, 95% CI, 1.13–1.47) and maternal (IRR = 1.09, 95% CI: 1.08–1.10) deaths in Asia. Anthropogenic PM2.5 was associated with increased rate of under-five deaths in Asia by 12%. The nonparametric method revealed that dust PM2.5 was positively associated with the under-five (β = 0.04, p < 0.001) and maternal (β = 0.07, p < 0.001) deaths in Asia. The rate of maternal deaths was increased by biomass/dust (IRR = 1.64, 95% CI: 1.63–1.65) and anthropogenic/dust (IRR = 1.22, 95% CI: 1.19–1.26) mixture types. In summary, long-term exposure to different types of ambient PM2.5 in high concentration increased the rate of under-five and maternal deaths, suggesting that policies focusing on preventive and control measures is imperative for developing an improved maternal, newborn, and child health in Asia.

Graphical Abstract

1. Introduction

Ambient air pollution due to particulate matter (PM2.5) in Asia is increasing as a result of rapid growth in population, urbanization, and economies. The World Health Organization (WHO) Global Burden of Disease (GBD) already identified air pollution as a health concern with an estimated 7 million deaths in 2012 resulting from both the ambient and indoor air pollution, of which, South East Asian and Western Pacific regions leading with an estimated deaths of 2.3 and 2.8 million, respectively [1]. PM2.5 has also been linked to several health risks as well as increased mortality and morbidity [2,3,4,5,6,7,8]. Hence, concerns about air pollution were reflected in the Sustainable Development Goals (SDGs), with the SDG 11 and the SDG 7 citing air pollution levels in cities and access to clean energy as some of the indicators of the sustainable development energy, respectively, while SDG 3 citing mortality resulting from air pollution as one of the indicators of the health goals [9,10].
In 2016, a global assessment of exposure and burden of disease revealed that South-East Asia and Eastern Mediterranean had the highest increase in annual mean PM2.5 concentrations from 2008 to 2013 which exceeded the WHO Air Quality Guidelines for annual (10 μg/m3) and daily (25 μg/m3) mean exposure [9]. However, the effect of this increase in PM2.5 on health in the Asia regions has not been adequately explored. Moreover, extant literature also indicates that low-income countries (LMICs) are the most affected regions with several health problems being experienced such as the under-five mortality, which is 11 times higher than that of the high-income countries, and 99% of the global maternal deaths experienced in LMICs [11,12].
A previous study in Africa found that PM2.5 from a different source, that is, dust, anthropogenic, and biomass, as well as a combined effect of mixed PM2.5, were associated with under-five and maternal deaths [7]. Though plausible, it, however, did not establish the effect of different mixture types of PM2.5 concentrations (i.e., dust/anthropogenic mixture, dust/biomass mixture, and anthropogenic/biomass mixture). Our study, therefore, not only explored the relationship between ambient PM2.5 and under-five and maternal deaths but also explored the associations between different PM2.5 mixture types and the under-five and maternal mortality in Asia.

2. Methods

2.1. Spatial Domain

We included 45 countries in Asia and Mediterranean regions that were geographically categorized into five sub-regions as follows: East Asia (China, Democratic People’s Republic of Korea, Japan, Mongolia, and Republic of Korea), Central and North Asia (Kazakhstan, Kyrgyz Republic, Russian Federation, Tajikistan, Turkmenistan, Uzbekistan), West Asia (Bahrain, Cyprus, Islamic Republic of Iran, Iraq, Israel, Jordan, Kuwait, Lebanon, Oman, Qatar, Republic of Yemen, Saudi Arabia, Syrian Arab Republic, Turkey, and United Arab Emirates), South Asia (Afghanistan, Bangladesh, Bhutan, India, Maldives, Nepal, Pakistan, and Sri Lanka), and Southeast Asia (Brunei Darussalam, Cambodia, Indonesia, Lao People’s Democratic Republic, Malaysia, Myanmar, Philippines, Singapore, Thailand, Timor-Leste, and Vietnam). Figure 1 indicated the five spatial domains of our study with distinct colors for each region.

2.2. Under-Five and Maternal Mortality

We used the annual estimated number of under-five and maternal deaths from the year 2000 to 2015. The under-five mortality refers to deaths of children who have not reached the age of five, while maternal mortality refers to deaths of women while they were pregnant or within 42 d of pregnancy termination from any pregnancy-related cause. The number of deaths was limited to residents of specific countries used in this study. However, refugee populations were not included in the country of residence but of their origin. The annual number of all-cause mortality data, which are generally based on the data generated by national statistical systems, from the World Bank were used [13].

2.3. Ambient PM2.5 Concentration

The Moderate Resolution Imaging Spectroradiometer (MODIS) monthly aerosol optical depth products (MOD08/Terra and MYD08/Aqua) was employed to obtain the annual mean ambient PM2.5 concentrations for 16 years (i.e., 2000–2015) in the spatial domain [7,14,15]. These data were collected by the National Aeronautics and Space Administration (NASA). Ambient PM2.5 types were derived using spectral derivatives (first and second order, see also Figure S1) of aerosol optical depth (AOD) which differentiated between aerosol types including biomass burning (BB), anthropogenic pollutant (AP), mineral dust (DS), biomass/dust mixture (BD), anthropogenic/dust mixture (AD), and biomass/anthropogenic mixture (BA) as applied in other studies [7,16]. The emission sources of AP, BB and DS aerosols frequently occur in the regions of industrial parks and megalopolis in Asia, Southeast Asia during springtime and summertime, and Middle East Asia during the wet season (April–September), respectively. Both the temporal and spatial exposures were obtained.

2.4. Covariates

The indicators used in our study were ranging from environmental factors (i.e., annual mean temperature) to health (i.e., anemia prevalence among pregnant women, undernourished population, TB deaths, and AIDS deaths) and other demographic indicators (i.e., population employed, female population, population living in urban areas, country’s total population, year of study, and country). The temperature was expressed in degrees Celsius of the aggregated country and basin levels to get the annual mean. The relationship between temperature, PM2.5 and mortality have been established [17,18,19,20]. The health indicators such as pregnant women with anemia included women diagnosed with hemoglobin level less than 110 grams per liter (g/L) at sea level. The undernourished population was the number of people who continuously had insufficient food intake to maintain dietary energy levels. The TB death rate estimated among the HIV-negative populace was determined per 100,000 populations while AIDS deaths were deaths resulting from AIDS-related causes. All the health-related indicators were included in this study since they can also contribute to the death of both the mothers and their children. Other demographic indicators such as population employed were expressed as a proportion of the 15 years old and above who were employed to indicate the socioeconomic status of the population. The population of females included the number of all female residents based on the national statistics, while the urban population and total population were the number of people living in urban areas and all residents, respectively. The most recent data were considered in our study (i.e., from 2000 to 2015).

2.5. Statistical Analysis

The Expectation Maximization (EM) algorithm, which can handle up to 50% of missing data, was employed to impute missing data. The total observation was 720 (i.e., 45 countries by 16 years period) while some of the indicators had missing data and were as follows: temperature (138), pregnant women with anemia (180), population undernourished (272), TB deaths (47), AIDS deaths (230), population employed (45), female population (45), population in urban (45), total population (45). The range of the missing data was between 0.06% and 37.8% for the indicators used in our study. One of the benefits of using the EM algorithm to impute missing data is that it can handle up to 50% of missing data.
Descriptive statistics were presented in terms of the annual means. In the inferential statistics, however, we used both the Generalized Linear Mixed-Effect Model (GLMM) and the Generalized Additive Mixed-Effect Model (GAMM) to explore the associations between PM2.5 and the under-five and the maternal mortality. The penalized quasi-likelihood estimation approach was used in the GLMM while a smoothing function, Poisson link function, and a spatial covariance structure were employed in both the GLMM and the GAMM approaches. Since there were variations between different countries and across different years, the country and the year were used in the random-effect models. Two models were analyzed in this study. The first model was unadjusted while the second model was adjusted for all the covariates. Stratified analysis was also employed to determine the associations according to different geographical regions. Incidence rate ratios (IRRs), which is the number of events occurring at any given point-in-time, were obtained and reported. The dose-response relationship between PM2.5 and mortality was assessed using the GAMM penalized spline and generalized cross-validation approach to estimate the degree of freedom. We used R version 3.2.2 (R Foundation for Statistical Computing, Vienna, Austria) for our analyses.

3. Results

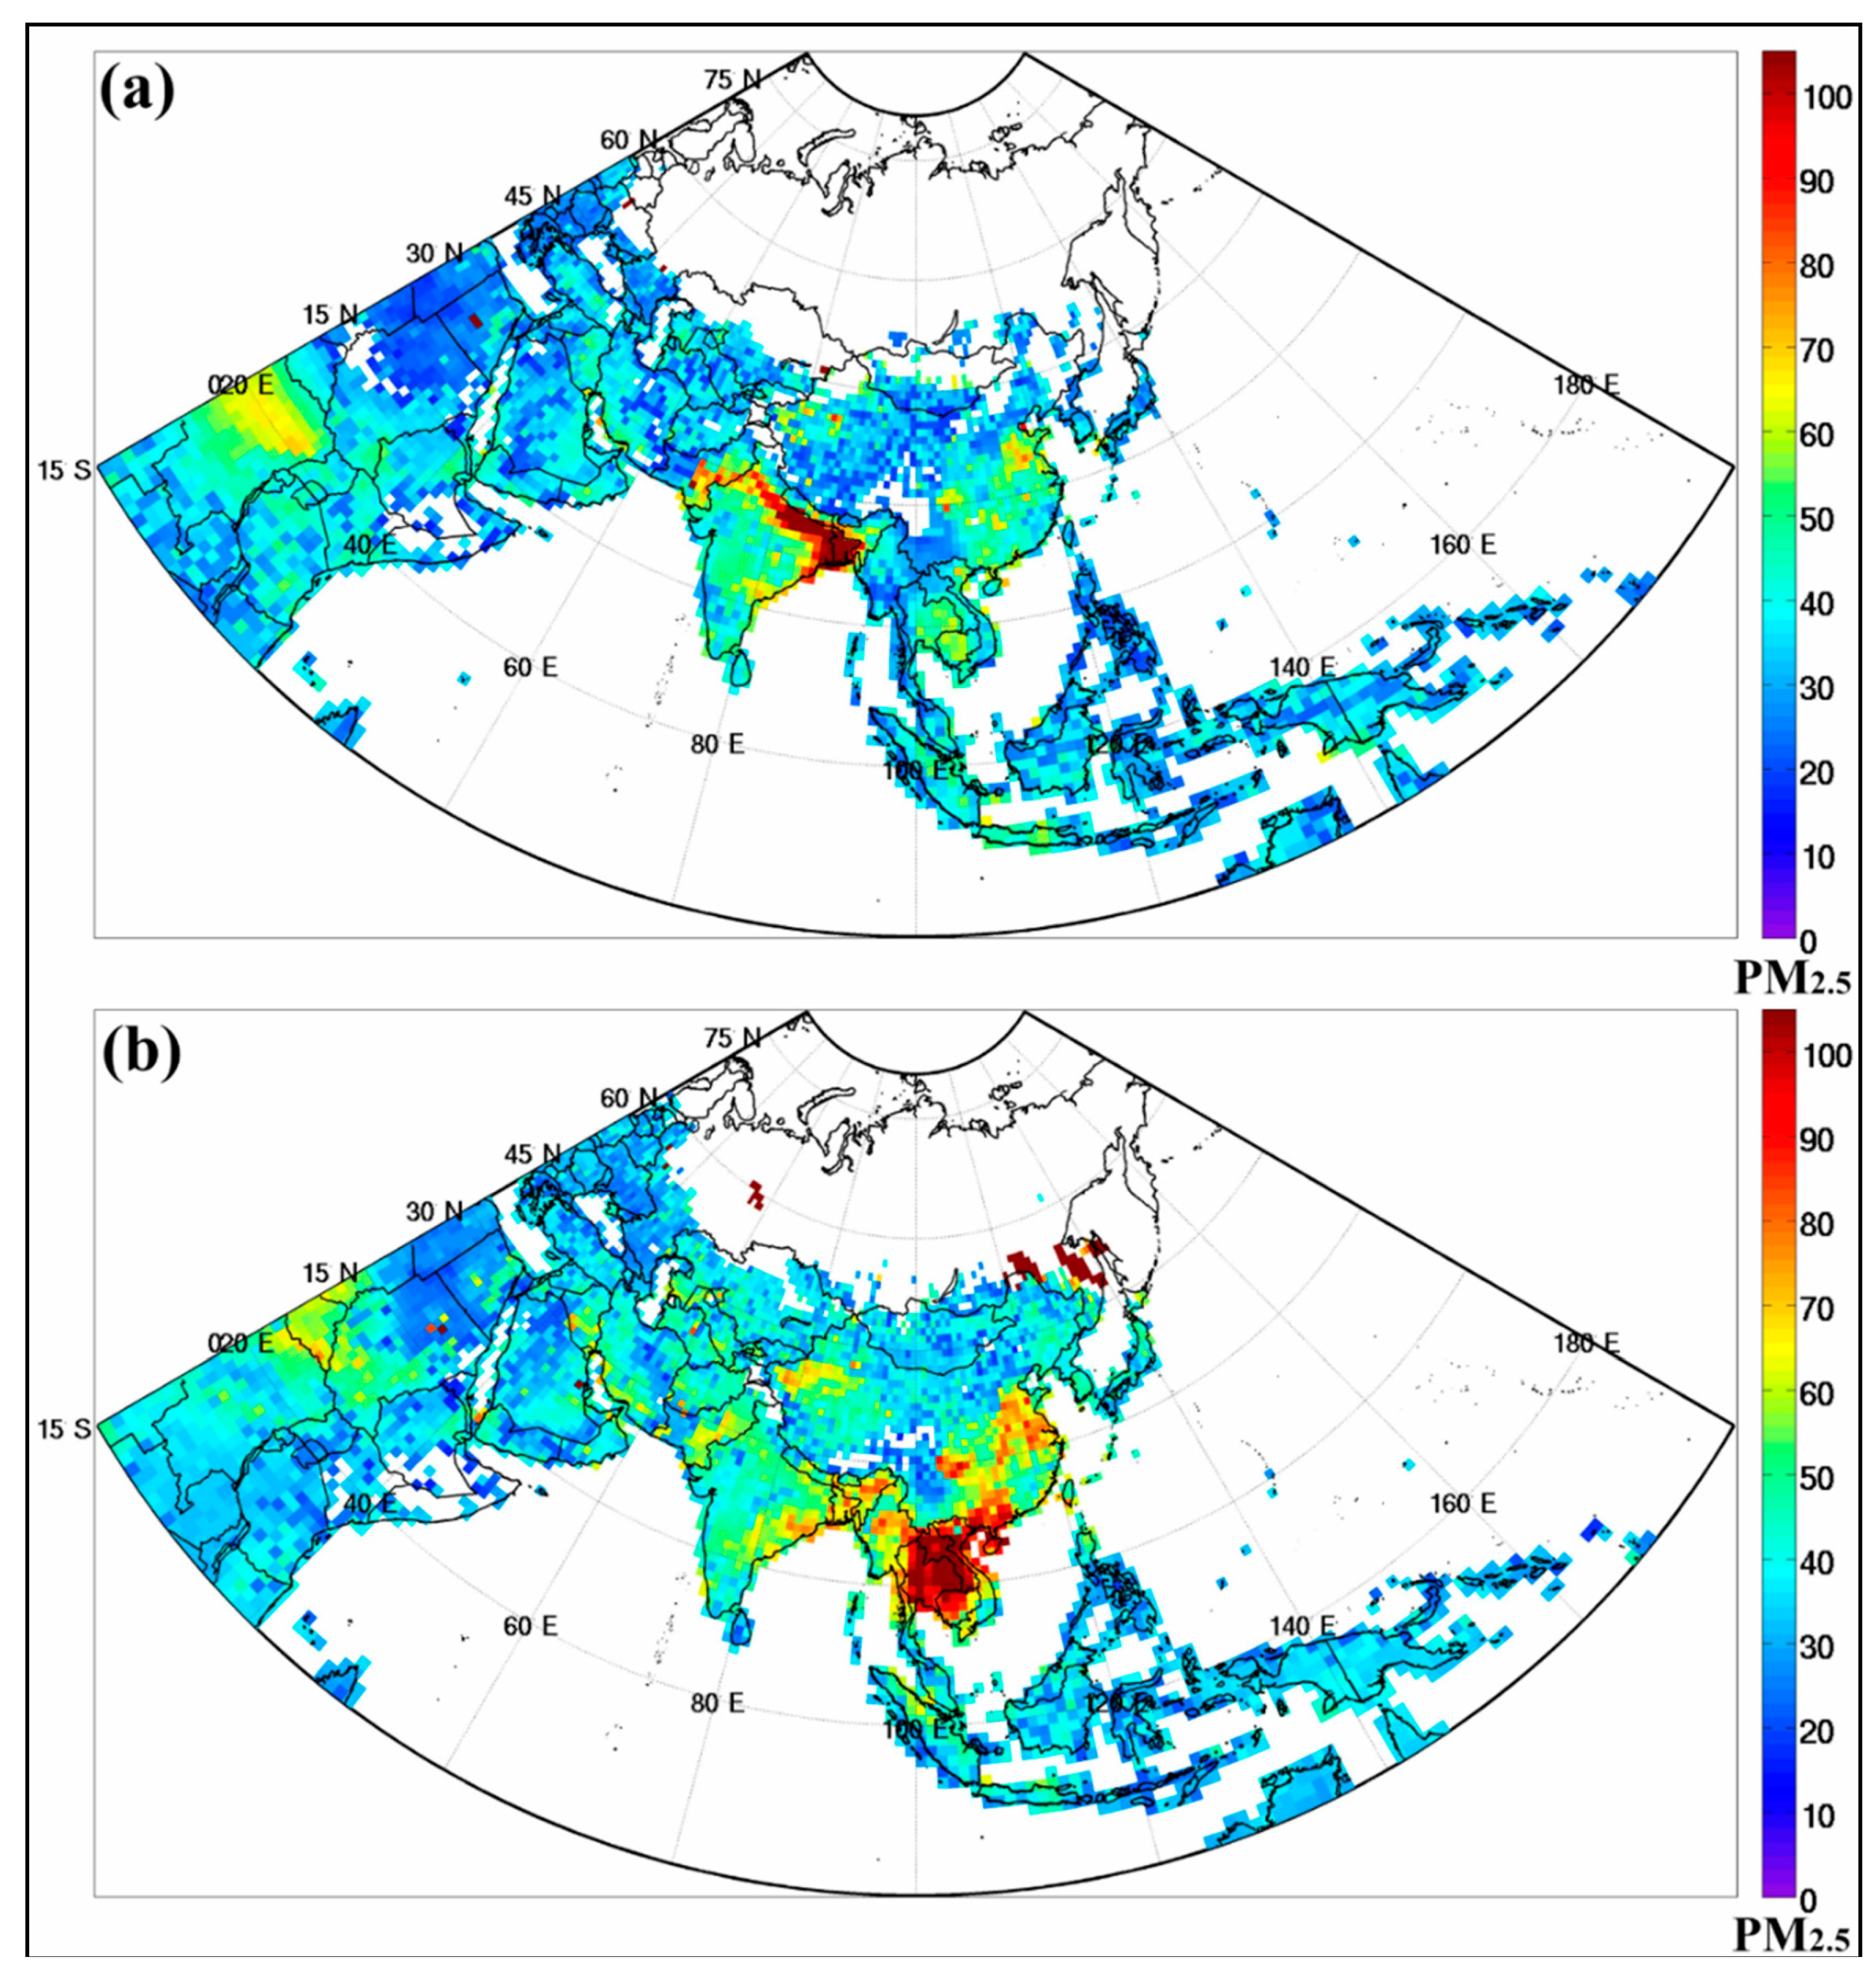
According to the observation of MODIS in monthly aerosol products, it was also found that the PM2.5 concentrations were high across different time periods in different sub-regions of Asia as shown in Figure 2. Figure 2a shows the PM2.5 distribution from anthropogenic pollution in South Asia to be high in January 2016, but after two months, the PM2.5 distribution from biomass burning was high in Southeast Asia in March 2016 as shown in Figure 2b.
Table 1 presents the descriptive results by different Asian sub-regions for the indicators used in our study. All the indicators in the sub-regions were statistically different at p < 0.05, except for the indicators female population (p = 0.473) AIDS death (p = 0.788). The means of the under-five and maternal deaths were high in South Asia at 330,969.9 (SD = 605,291.9) and 12,617.7 (SD = 23,035.4), respectively. The PM2.5 concentrations from biomass burning and dust were high in Southeast Asia at 42.71 μg/m3 and 37.88 μg/m3, respectively, while the anthropogenic was highest in South Asia (33.52 μg/m3). All the mixture type PM2.5 was above 40 μg/m3 in all the sub-regions.
Table 2 is the unadjusted model of the association between PM2.5 and under-five and maternal mortality. The PM2.5 types were associated with under-five and maternal deaths, with the under-five children in Asia being at highest incidence of death as a result of biomass and dust mixture PM2.5 (IRR = 8.43, 95% CI: 7.98–8.91) while dust PM2.5 had the highest incidence rate of maternal deaths (IRR = 3.55, 95% CI: 3.54–3.56). The unadjusted analyses revealed that the incidence of under-five and maternal deaths in all the sub-regions were not statistically different from East Asia sub-region.
In overall, the adjusted GLMM analyses in Table 3 revealed that the annual biomass PM2.5 concentrations were associated with the incidence of maternal mortality (IRR = 1.09, 95% CI: 1.08–1.10) and under-five mortality (IRR = 1.29, 95% CI: 1.13–1.47) in Asia, while the annual PM2.5 concentrations of biomass/dust mixture (IRR = 1.64, 95% CI: 1.63–1.65) and anthropogenic/dust mixture (IRR = 1.22, 95% CI: 1.19–1.26) types were associated with the incidence of maternal deaths at p ≤ 0.05. The nonparametric method (GAMM) however revealed an association in all the PM2.5 types with anthropogenic, dust, biomass/dust mixture type and biomass/anthropogenic mixture type being positively associated with the incidence of under-five deaths, while dust and biomass/dust mixture type being positively associated with the incidence of maternal deaths.
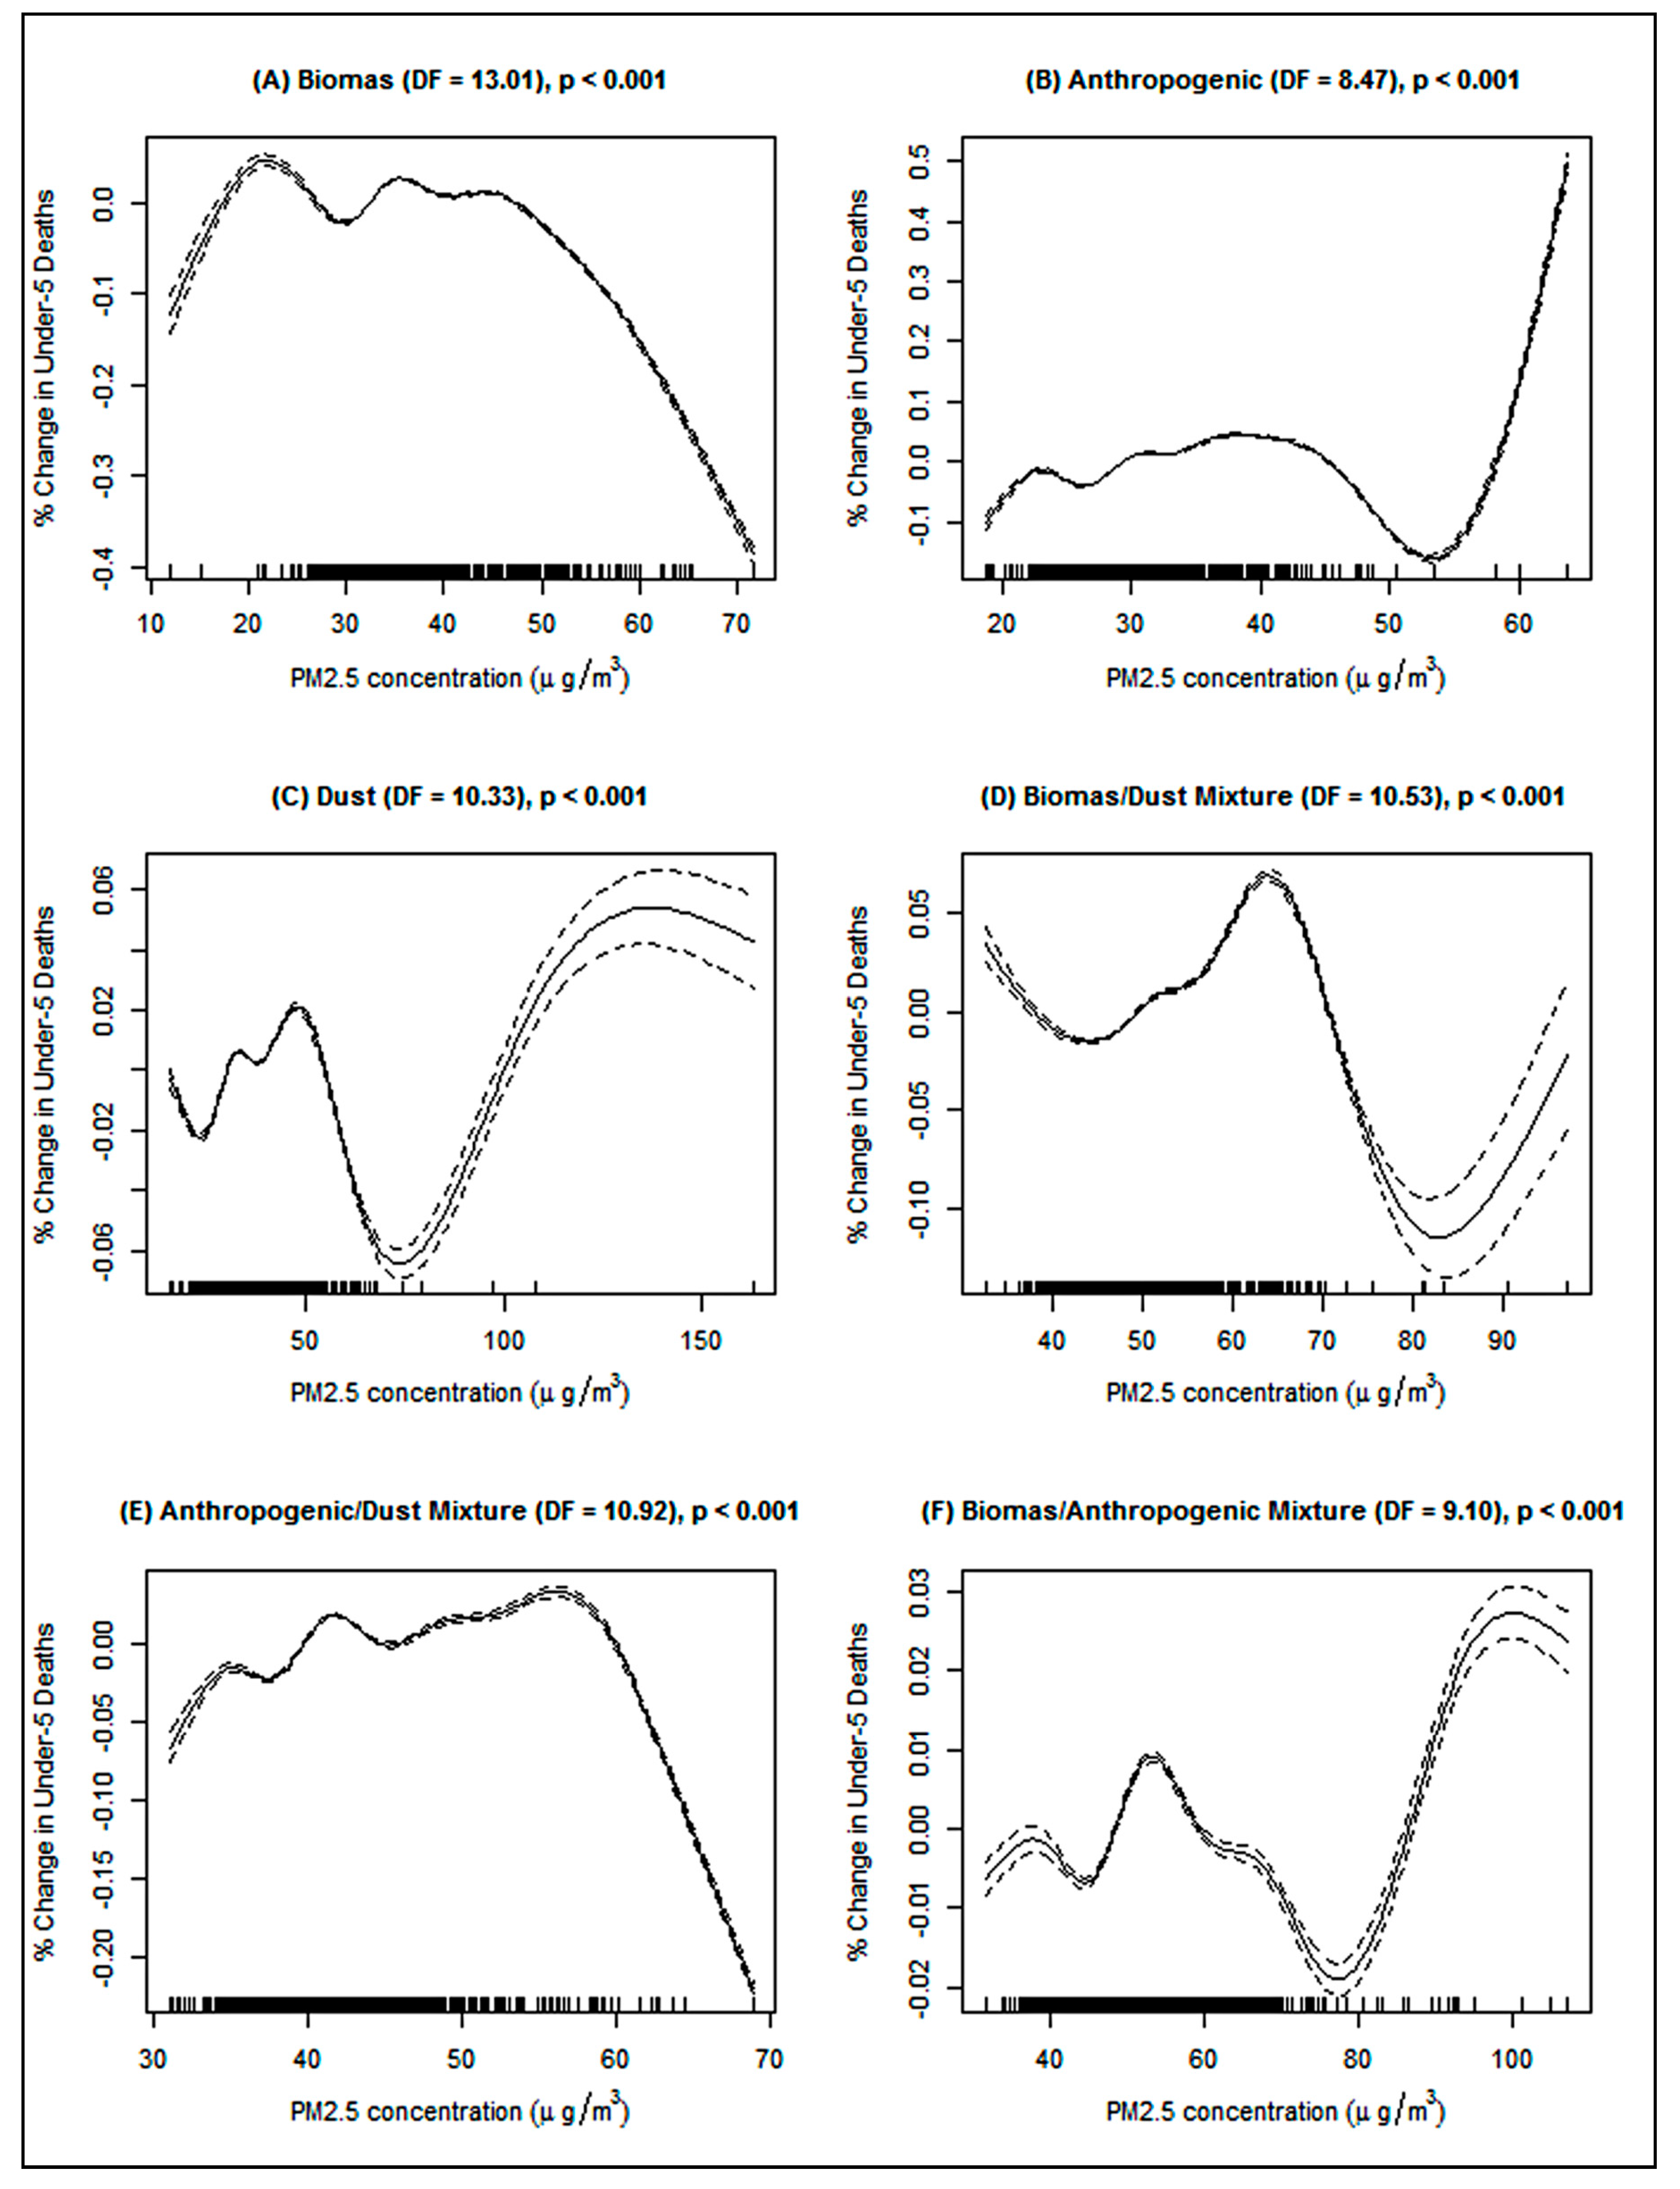
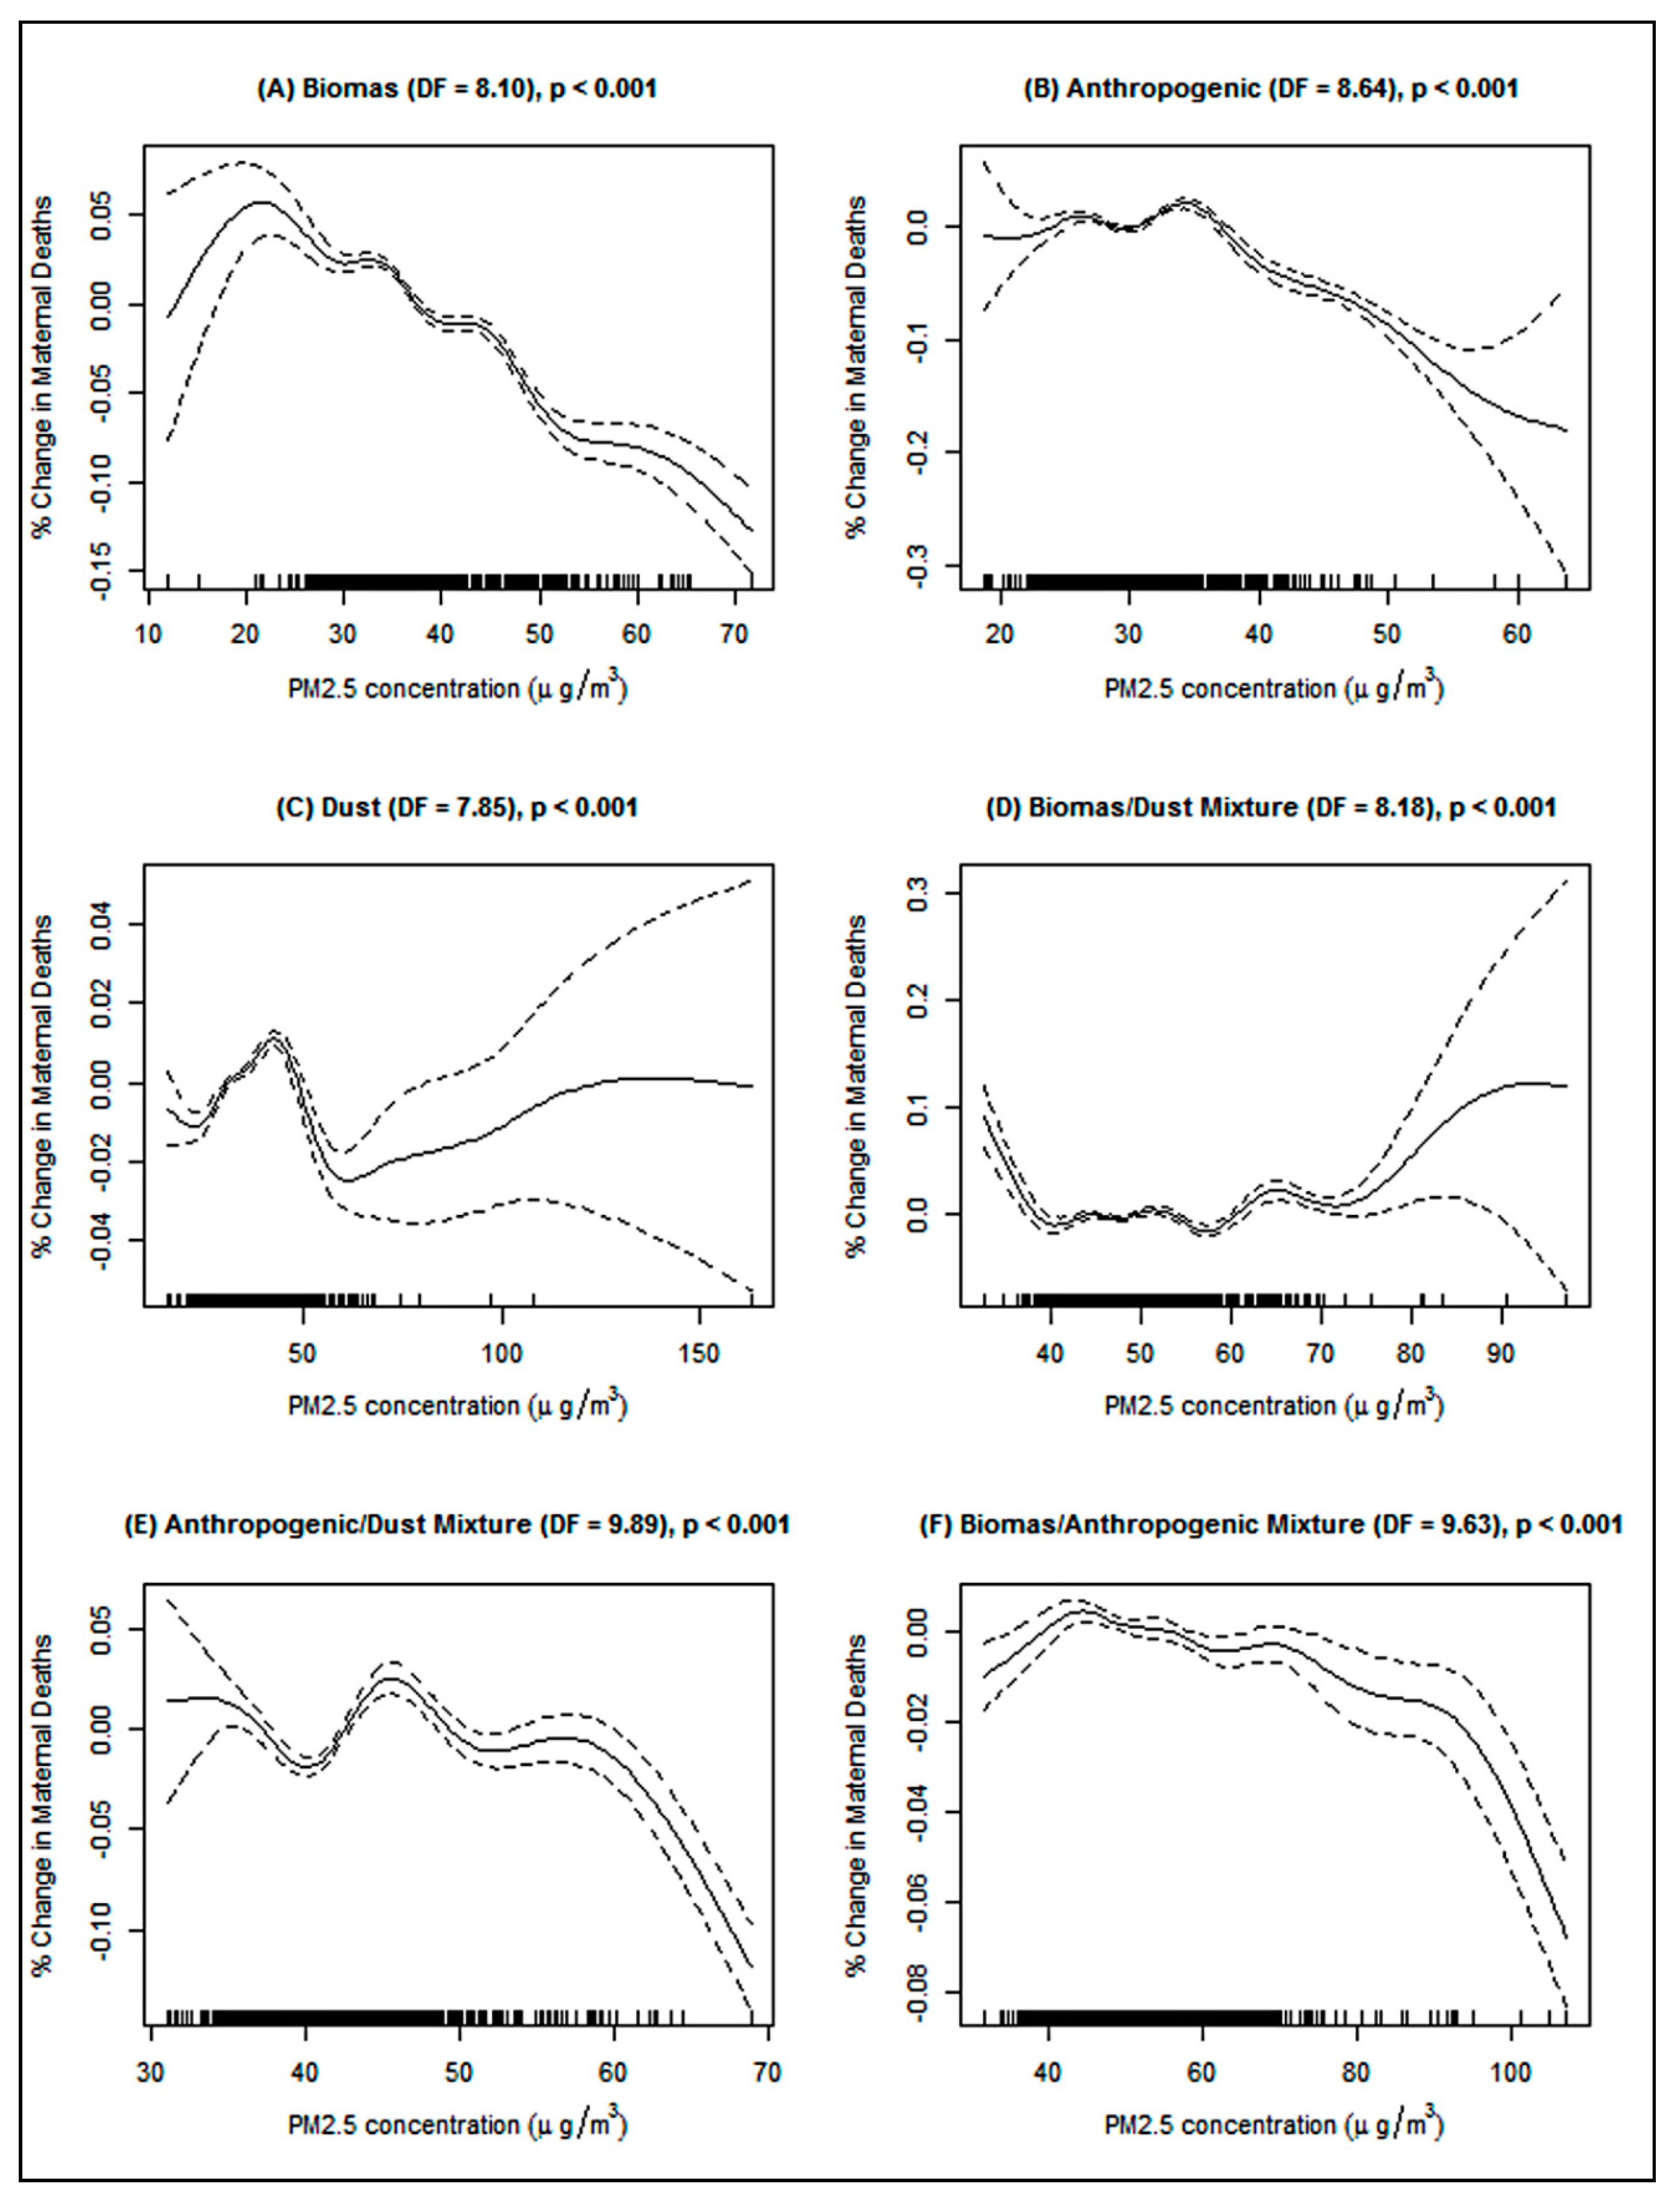
The stratified analyses of the sub-regions revealed that the under-five children in East Asia region only were at 2% increased incidence of death as a result of biomass PM2.5 while mothers in Central/North Asia region only were at 7% higher rate of death from biomass PM2.5 in both the GLMM and GAMM models (Table 3). For anthropogenic PM2.5, and increase death rate of under-five deaths was realized in East Asia (GAMM, β = 0.03, p ≤ 0.001), West Asia (GLMM, IRR = 1.02, 95% CI: 1.01–1.03) and Southeast Asia (GAMM, β = 0.09, p ≤ 0.001). Anthropogenic PM2.5 was however not associated with an increased death rate among mothers. Using the GAMM model, dust PM2.5 was associated with an increased under-five death (β = 0.11, p ≤ 0.001) and maternal death (β = 0.07, p ≤ 0.05) in Central/North Asia, and an increased rate of under-five deaths in Southeast Asia (β = 0.03, p ≤ 0.001). The PM2.5 concentrations of biomass/dust mixture type was associated with an increased rate of under-five deaths in Central/North Asia (GAMM, β = 0.03, p ≤ 0.001), South Asia (GAMM, β = 0.04, p ≤ 0.001) and Southeast Asia (GAMM, β = 0.11, p ≤ 0.001). The PM2.5 concentrations of anthropogenic/dust mixture type were associated with an increased under-five death rate in West Asia (GAMM, β = 0.03, p ≤ 0.01) and Southeast Asia (GAMM, β = 0.16, p ≤ 0.001), and 8% increase incidence of maternal deaths in Central/North Asia only. There was a clear increased incidence of under-five deaths in Southeast Asia as a result of biomass/anthropogenic mixture PM2.5 (GAMM, β = 0.07, p ≤ 0.001) and a marginal increase in under-five deaths (GLMM, IRR = 1.01, 95% CI: 1.01–1.02) in East Asia and West Asia. However, the penalized-spline showed somewhat dose-response relationships between PM2.5 types and the under-five mortality (Figure 3) and maternal mortality (Figure 4) which appeared to have different shapes like n, w, and v shaped. Yet, all the splines exhibited some form of non-linear associations. For example, after a biomass PM2.5 concentrations of about 19 µg/m3 there was an increase in the percentage change in the under-five deaths (Figure 3A) and later a slight increase in deaths after about 32 µg/m3.

4. Discussion

Ambient and indoor PM2.5 is increasingly becoming one of the major focuses of health-related determinants in Asia and globally [21,22], and our study is one of such that focuses on its health effect in a region that is well known for higher levels of short-term and long-term ambient PM2.5 exposure [9]. This study explored the relationship between types of ambient PM2.5 and under-five and maternal deaths and found positive associations with under-five and maternal mortality which was consistent with previous studies [5,7,23,24]. The levels of exposure to ambient PM2.5 in the Asian sub-regions also exceeded the recommended Air Quality Guidelines of daily (25 μg/m3) and annual (10 μg/m3) exposure [9,25].
Several sources of air pollution contribute to the high levels of exposure to hazardous chemicals in the air in Asia as well as globally. Dust storms which are hazardous weather events occur frequently in Asia and North Africa, particularly during boreal spring and summer. In addition, Asia and Africa remain two major emission regions of soot aggregate (black carbon dominated), generally associated with automobile, industrial and open combustion (i.e., forest fires, land-clearing by fire, agricultural waste-burning events, and from traditional stoves and kilns). Several studies have also concluded that 50 to 90% of the South Asian aerosol originates from fossil fuel combustion [26,27,28]. We found that the PM2.5 concentrations from different sources were high and varied across different time periods in different sub-regions of Asia. For example, we found that PM2.5 distributions from anthropogenic pollutants were the highest in South Asia in January. However, after two months, the PM2.5 distributions of biomass burning were high in Southeast Asia in March mainly because of agricultural cleanup activities in the springtime, and hence an increase in PM2.5 pollution from biomass burning [29,30,31,32]. In general, the change in PM2.5 distributions was mainly influenced by seasonal changes in human activity.
In this study, we found that biomass PM2.5 in Asia increased under-five deaths (IRR = 1.29) and maternal deaths (IRR = 1.09) significantly. However, stratified analyses revealed that biomass PM2.5 mostly affected East Asia (i.e., in under-five deaths) and Central/North Asia (i.e., in maternal deaths). Our findings are not different from a previous study which found that PM2.5 concentrations from biomass burning are associated with maternal and under-five deaths in Africa [7]. The point estimates of our stratified analyses may vary from the overall analyses, that is—lower than the overall Asian region, because of a reduced sample size after stratification which may also lead to underestimation of the true effect. Nevertheless, we still found a significant association between chronic exposure to PM2.5 and all-cause mortality as evidenced in previous studies [7,33].
Several previous studies that were conducted in different populations found different health effects of PM2.5 [4,5,6], but few had focused on the under-five children and their mothers. This may be because of an increased focus on other important mortality-contributing factors which are, generally, clinical in nature such as abortion complications, hemorrhage, infection/sepsis, and hypertensive disorders. Focusing on clinically related deaths is plausible, but this may also lead to neglect of other important factors that may contribute to the under-five and maternal deaths such as the environmental factors and other social determinants. Nonetheless, in this study we found that the under-five children were at 12% increased rate of death from chronic exposure to anthropogenic PM2.5 in Asia, and this positive association was only found in West Asia (IRR = 1.02) and Southeast Asia (β = 0.09) in the parametric and the nonparametric models, respectively. The anthropogenic pollutants from combustion processes have been however linked to several other health issues such cardiac disease and diseases of the respiratory system and reproductive health in both animals and humans [34,35].
On the other hand, the nonparametric model revealed also a positive association between dust PM2.5 and under-five and maternal mortality in Asia by 4% and 7% increased death rate, respectively. The effect of dust particulate matter was higher in Central/North Asia which had 11% and 7% increased death rate among under-five children and mothers, respectively. The PM2.5 concentrations from dust were also positively associated with the under-five deaths in Southeast Asia.
In the PM2.5 mixture types, biomass/dust mixture was positively associated with the under-five deaths in Asia, but mainly in the sub-regions of Central/North Asia, South Asia and Southeast Asia in the stratified analyses. For maternal deaths, the point estimate of biomass/dust mixture in the entire Asian region was high at 64% incidence of maternal death, and yet, the stratified analyses did not reveal the most affected sub-region. On the other hand, the incidence rate of maternal deaths from anthropogenic/dust mixture PM2.5 was 22% in Asia with a positive association found in the sub-region of Central/North Asia only. There was also a positive association between anthropogenic/dust mixture PM2.5 and under-five deaths in West Asia and Southeast Asia sub-regions. With regards to biomass/anthropogenic mixture PM2.5, there was a positive association with the under-five mortality in the entire Asian region with a clear positive relationship found in the Southeast Asia sub-region. The positive association between all mixture type PM2.5 concentrations and the under-five mortality was found in the Southeast Asia sub-region. This finding is important because mothers and children in Asia may have been exposed to multiple pollutants rather than one type of pollutant from specific source. We also found that there was a higher rate of maternal deaths in Asia with exposure to biomass/dust and anthropogenic/dust mixture types. Some of the extant literature suggests that the biological mechanisms between PM2.5 and mortality include reduced lung function, increased blood pressure, and others such as reproductive health [36,37,38,39]. Nevertheless, our remains the first to explore the combined effect of several mixture types of PM2.5 on mortality.

Limitations and Strengths

One major limitation of our study included the use of all-cause mortality because of the inability to determine the cause-specific deaths. These deaths might have been a result of several other related factors that are clinical in nature and may not have been related to environmental factors. Secondly, we could not control for another important confounding environmental and individual factors, such as precipitation, humidity, and demographics of individuals, because of data inadequacy and the ecological nature of our study. Future studies should focus on adequate exposure assessment and individual follow-up to be able to extend the findings of this study. Third, the point estimate may have not reflected the true causality because of the small sample size (i.e., 45 countries with a follow-up period of 16 years), and hence there was lack of statistical power. This may lead to underestimation of the true effect. Therefore, our results should be cautiously interpreted because it only reflects a temporal causality. However, this study is important since it is the first of its kind in Asia to explore the association between different types of PM2.5 and the under-five and maternal deaths. Secondly, one of the major challenges for researchers is the estimation of disease-response to ambient PM2.5 exposure due to nonlinearity [8]. Our study used both the linear and nonlinear approaches to explore the associations. Finally, our spatial domain was wide enough to understand the Asian region, in light of PM2.5 and its general health effect.

5. Conclusions

In conclusion, we examined the relationship between PM2.5 and under-five and maternal deaths in Asia and found a positive relationship. The level of PM2.5 exposures was also high in Asian sub-regions than global standards. Our point estimates may have been underestimated due to spatial variability in PM2.5 and the few cases in our data. Data from some Asian regions are not easily available. Hence, our study adds more knowledge to the current body of literature by highlighting the need for more research to enhance adequate policies development focusing on preventive and control measures of PM2.5 exposures.

Supplementary Materials

The following are available online at https://www.mdpi.com/1660-4601/16/20/3855/s1, Figure S1: The 2nd-order derivative of spectral aerosol optical depth (AOD) (𝛻2τ with 0.47, 0.55 and 0.66 μm related to refractive index) against 1st-order derivative normalized by AOD(0.47 μm) (NGAI) simulated with 0.01 step from 0.00 to 1.00 in mixing weights of volume density from 6S model (Second Simulation of a Satellite Signal in the Solar Spectrum, Vermote et al., 2008) [2] for triple-component mixtures (i.e., dust (DS), anthropogenic pollutant (AP) and biomass burning (BB) aerosols). The inputs of optical properties of aerosol models are recommended by the World Meteorological Organization (WMO) [3,4].

Author Contributions

Conception and study design: P.O.O., W.-H.L., T.-H.L.; Data extraction: P.O.O., W.-H.L.; Data analysis and interpretation: P.O.O., M.A.M.; Wrote the first draft: P.O.O., M.A.M.; Reviewed and approved the final draft: P.O.O., W.-H.L., M.A.M., T.-H.L.

Funding

This work was financially supported by the Taiwan Ministry of Science and Technology Grant MOST 106-2111-M-008-006 and MOST 107-2111-M-008-024. The funders had no role in study design, data collection and analysis, decision to publish, or preparation of the manuscript.

Conflicts of Interest

The authors declare no conflict of interest.

References

  1. World Health Organization Burden of Disease from the Joint Effects of Household and Ambient Air Pollution for 2012. Available online: http://www.who.int/phe/health_topics/outdoorair/databases/AP_jointeffect_BoD_results_March2014.pdf?ua=1 (accessed on 17 August 2017).
  2. Lin, Y.K.; Chen, C.F.; Yeh, H.C.; Wang, Y.C. Emergency room visits associated with particulate concentration and Asian dust storms in metropolitan Taipei. J. Expo. Sci. Environ. Epidemiol. 2016, 26, 189–196. [Google Scholar] [CrossRef] [PubMed]
  3. DeFranco, E.; Hall, E.; Hossain, M.; Chen, A.; Haynes, E.N.; Jones, D.; Ren, S.; Lu, L.; Muglia, L. Air pollution and stillbirth risk: Exposure to airborne particulate matter during pregnancy is associated with fetal death. PLoS ONE 2015, 10, e0120594. [Google Scholar] [CrossRef] [PubMed]
  4. Yorifuji, T.; Kashima, S.; Doi, H. Associations of acute exposure to fine and coarse particulate matter and mortality among older people in Tokyo, Japan. Sci. Total Environ. 2016, 542, 354–359. [Google Scholar] [CrossRef] [PubMed]
  5. Atkinson, R.W.; Kang, S.; Anderson, H.R.; Mills, I.C.; Walton, H.A. Epidemiological time series studies of PM2.5 and daily mortality and hospital admissions: A systematic review and meta-analysis. Thorax 2014, 69, 660–665. [Google Scholar] [CrossRef] [PubMed]
  6. Zheng, X.Y.; Ding, H.; Jiang, L.N.; Chen, S.W.; Zheng, J.P.; Qiu, M.; Zhou, Y.X.; Chen, Q.; Guan, W.J. Association between Air Pollutants and Asthma Emergency Room Visits and Hospital Admissions in Time Series Studies: A Systematic Review and Meta-Analysis. PLoS ONE 2015, 10, e0138146. [Google Scholar] [CrossRef] [PubMed]
  7. Owili, P.; Lien, W.-H.; Muga, M.; Lin, T.-H. The Associations between Types of Ambient PM2.5 and Under-Five and Maternal Mortality in Africa. Int. J. Environ. Res. Public Health 2017, 14, 359. [Google Scholar] [CrossRef] [PubMed]
  8. Burnett, R.T.; Pope, C.A., 3rd; Ezzati, M.; Olives, C.; Lim, S.S.; Mehta, S.; Shin, H.H.; Singh, G.; Hubbell, B.; Brauer, M.; et al. An integrated risk function for estimating the global burden of disease attributable to ambient fine particulate matter exposure. Environ. Health Perspect. 2014, 122, 397–403. [Google Scholar] [CrossRef]
  9. World Health Organization Ambient Air Pollution: A Global Assessment of Exposure and Burden of Disease. Available online: http://apps.who.int/iris/bitstream/10665/250141/1/9789241511353−eng.pdf (accessed on 13 March 2017).
  10. United Nations Sustainable Development Goals. Available online: http://www.un.org/sustainabledevelopment/ (accessed on 31 May 2016).
  11. World Health Organization Global Health Observatory Data: Under-Five Mortality. Available online: http://www.who.int/gho/child_health/mortality/mortality_under_five_text/en/ (accessed on 2 September 2017).
  12. World Health Organization [Media Centre] Maternal Mortality. Available online: http://www.who.int/mediacentre/factsheets/fs348/en/ (accessed on 28 September 2016).
  13. World Bank World Development Indicators. Available online: http://databank.worldbank.org/data/home.aspx (accessed on 17 October 2016).
  14. Hubanks, P.A.; King, M.D.; Platnick, S.; Pincus, R. MODIS Atmosphere L3 Gridded Product Algorithm Theoretical Basis Document. Available online: https://modis−images.gsfc.nasa.gov/_docs/L3_ATBD_2008_12_04.pdf (accessed on 17 August 2017).
  15. Levy, R.; Hsu, C. MODIS Atmosphere L2 Aerosol Product: NASA MODIS Adaptive Processing System. Available online: http://dx.doi.org/10.5067/MODIS/MOD04_L2.006 (accessed on 18 April 2017).
  16. Lin, T.-H.; Liu, G.-R.; Liu, C.-Y. A novel index for atmospheric aerosol type categorization with spectral optical depths from satellite retrieval. Int. Arch. Photogram. Remote Sens. Spat. Inf. Sci. 2016, XLI-B8, 277–279. [Google Scholar] [CrossRef]
  17. Anderson, B.G.; Bell, M.L. Weather-related mortality: How heat, cold, and heat waves affect mortality in the United States. Epidemiology 2009, 20, 205–213. [Google Scholar] [CrossRef]
  18. Baccini, M.; Biggeri, A.; Accetta, G.; Kosatsky, T.; Katsouyanni, K.; Analitis, A.; Anderson, H.R.; Bisanti, L.; D’Ippoliti, D.; Danova, J.; et al. Heat effects on mortality in 15 European cities. Epidemiology 2008, 19, 711–719. [Google Scholar] [CrossRef]
  19. Chen, R.; Yin, P.; Wang, L.; Liu, C.; Niu, Y.; Wang, W.; Jiang, Y.; Liu, Y.; Liu, J.; Qi, J.; et al. Association between ambient temperature and mortality risk and burden: Time series study in 272 main Chinese cities. BMJ 2018, 363, k4306. [Google Scholar] [CrossRef] [PubMed]
  20. Wang, J.; Ogawa, S. Effects of Meteorological Conditions on PM2.5 Concentrations in Nagasaki, Japan. Int. J. Environ. Res. Public Health 2015, 12, 9089–9101. [Google Scholar] [CrossRef] [PubMed]
  21. Balasubramanian, R.; Gao, X.; Hatakeyama, S.; Hwang, J.; Tsai, C.-J. Overview of the Special Issue “PM2.5 in Asia” for 2015 Asian Aerosol Conference. Aerosol Air Qual. Res. 2017, 17, 351–355. [Google Scholar] [CrossRef]
  22. Apte, J.S.; Marshall, J.D.; Cohen, A.J.; Brauer, M. Addressing Global Mortality from Ambient PM2.5. Environ. Sci. Technol. 2015, 49, 8057–8066. [Google Scholar] [CrossRef] [PubMed]
  23. Kloog, I.; Ridgway, B.; Koutrakis, P.; Coull, B.A.; Schwartz, J.D. Long- and short-term exposure to PM2.5 and mortality: Using novel exposure models. Epidemiology 2013, 24, 555–561. [Google Scholar] [CrossRef] [PubMed]
  24. Shi, L.; Zanobetti, A.; Kloog, I.; Coull, B.A.; Koutrakis, P.; Melly, S.J.; Schwartz, J.D. Low-Concentration PM2.5 and Mortality: Estimating Acute and Chronic Effects in a Population-Based Study. Environ. Health Perspect. 2016, 124, 46–52. [Google Scholar] [CrossRef] [PubMed]
  25. World Health Organization; Occupational and Environmental Health Team. Who Air Quality Guidelines for Particulate Matter, Ozone, Nitrogen Dioxide and Sulfur Dioxide: Global Update 2005: Summary of Risk Assessment; World Health Organization: Geneva, Switzerland, 2006; p. 20. [Google Scholar]
  26. Mayol−Bracero, O.L.; Gabriel, R.; Andreae, M.O.; Kirchstetter, T.W.; Novakov, T.; Ogren, J.; Sheridan, P.; Streets, D.G. Carbonaceous aerosols over the Indian Ocean during the Indian Ocean Experiment (INDOEX): Chemical characterization, optical properties, and probable sources. J. Geophys. Res. 2002, 107, 8030. [Google Scholar] [CrossRef]
  27. Novakov, T.; Andreae, M.O.; Gabriel, R.; Kirchstetter, T.W.; Mayol−Bracero, O.L.; Ramanathan, V. Origin of carbonaceous aerosols over the tropical Indian Ocean: Biomass burning or fossil fuels? Geophys. Res. Lett. 2000, 27, 4061–4064. [Google Scholar] [CrossRef]
  28. Adhikary, B.; Carmichael, G.R.; Tang, Y.; Leung, L.R.; Qian, Y.; Schauer, J.J.; Stone, E.A.; Ramanathan, V.; Ramana, M.V. Characterization of the seasonal cycle of south Asian aerosols: A regional-scale modeling analysis. J. Geophys. Res. Atmos. 2007, 112. [Google Scholar] [CrossRef] [Green Version]
  29. Jacobson, M.Z. Strong radiative heating due to the mixing state of black carbon in atmospheric aerosols. Nature 2001, 409, 695. [Google Scholar] [CrossRef]
  30. Hsu, N.C.; Herman, J.R.; Tsay, S.-C. Radiative impacts from biomass burning in the presence of clouds during boreal spring in southeast Asia. Geophys. Res. Lett. 2003, 30. [Google Scholar] [CrossRef] [Green Version]
  31. Kondo, Y.; Morino, Y.; Takegawa, N.; Koike, M.; Kita, K.; Miyazaki, Y.; Sachse, G.W.; Vay, S.A.; Avery, M.A.; Flocke, F.; et al. Impacts of biomass burning in Southeast Asia on ozone and reactive nitrogen over the western Pacific in spring. J. Geophys. Res. Atmos. 2004, 109. [Google Scholar] [CrossRef] [Green Version]
  32. Tsay, S.-C.; Hsu, N.C.; Lau, W.K.M.; Li, C.; Gabriel, P.M.; Ji, Q.; Holben, B.N.; Judd Welton, E.; Nguyen, A.X.; Janjai, S.; et al. From BASE-ASIA toward 7-SEAS: A satellite-surface perspective of boreal spring biomass-burning aerosols and clouds in Southeast Asia. Atmos. Environ. 2013, 78, 20–34. [Google Scholar] [CrossRef] [Green Version]
  33. Wong, C.M.; Lai, H.K.; Tsang, H.; Thach, T.Q.; Thomas, G.N.; Lam, K.B.; Chan, K.P.; Yang, L.; Lau, A.K.; Ayres, J.G.; et al. Satellite-Based Estimates of Long-Term Exposure to Fine Particles and Association with Mortality in Elderly Hong Kong Residents. Environ. Health Perspect. 2015, 123, 1167–1172. [Google Scholar] [CrossRef] [PubMed] [Green Version]
  34. Rhind, S.M. Anthropogenic pollutants: A threat to ecosystem sustainability? Philos Trans. R Soc. Lond B Biol. Sci. 2009, 364, 3391–3401. [Google Scholar] [CrossRef] [PubMed]
  35. World Health Organization Media Centre Ambient (Outdoor) Air Quality and Health. Available online: http://www.who.int/mediacentre/factsheets/fs313/en/ (accessed on 23 December 2016).
  36. Lee, H.C.; Lin, T.H. Air Pollution Particular Matter and Atherosclerosis. Acta Cardiol. Sin. 2017, 33, 646–647. [Google Scholar] [PubMed]
  37. Suwa, T.; Hogg, J.C.; Quinlan, K.B.; Ohgami, A.; Vincent, R.; van Eeden, S.F. Particulate air pollution induces progression of atherosclerosis. J. Am. Coll. Cardiol. 2002, 39, 935–942. [Google Scholar] [CrossRef] [Green Version]
  38. Yue, W.; Schneider, A.; Stolzel, M.; Ruckerl, R.; Cyrys, J.; Pan, X.; Zareba, W.; Koenig, W.; Wichmann, H.E.; Peters, A. Ambient source-specific particles are associated with prolonged repolarization and increased levels of inflammation in male coronary artery disease patients. Mutat. Res. 2007, 621, 50–60. [Google Scholar] [CrossRef]
  39. Brook, R.D.; Urch, B.; Dvonch, J.T.; Bard, R.L.; Speck, M.; Keeler, G.; Morishita, M.; Marsik, F.J.; Kamal, A.S.; Kaciroti, N.; et al. Insights into the mechanisms and mediators of the effects of air pollution exposure on blood pressure and vascular function in healthy humans. Hypertension 2009, 54, 659–667. [Google Scholar] [CrossRef]
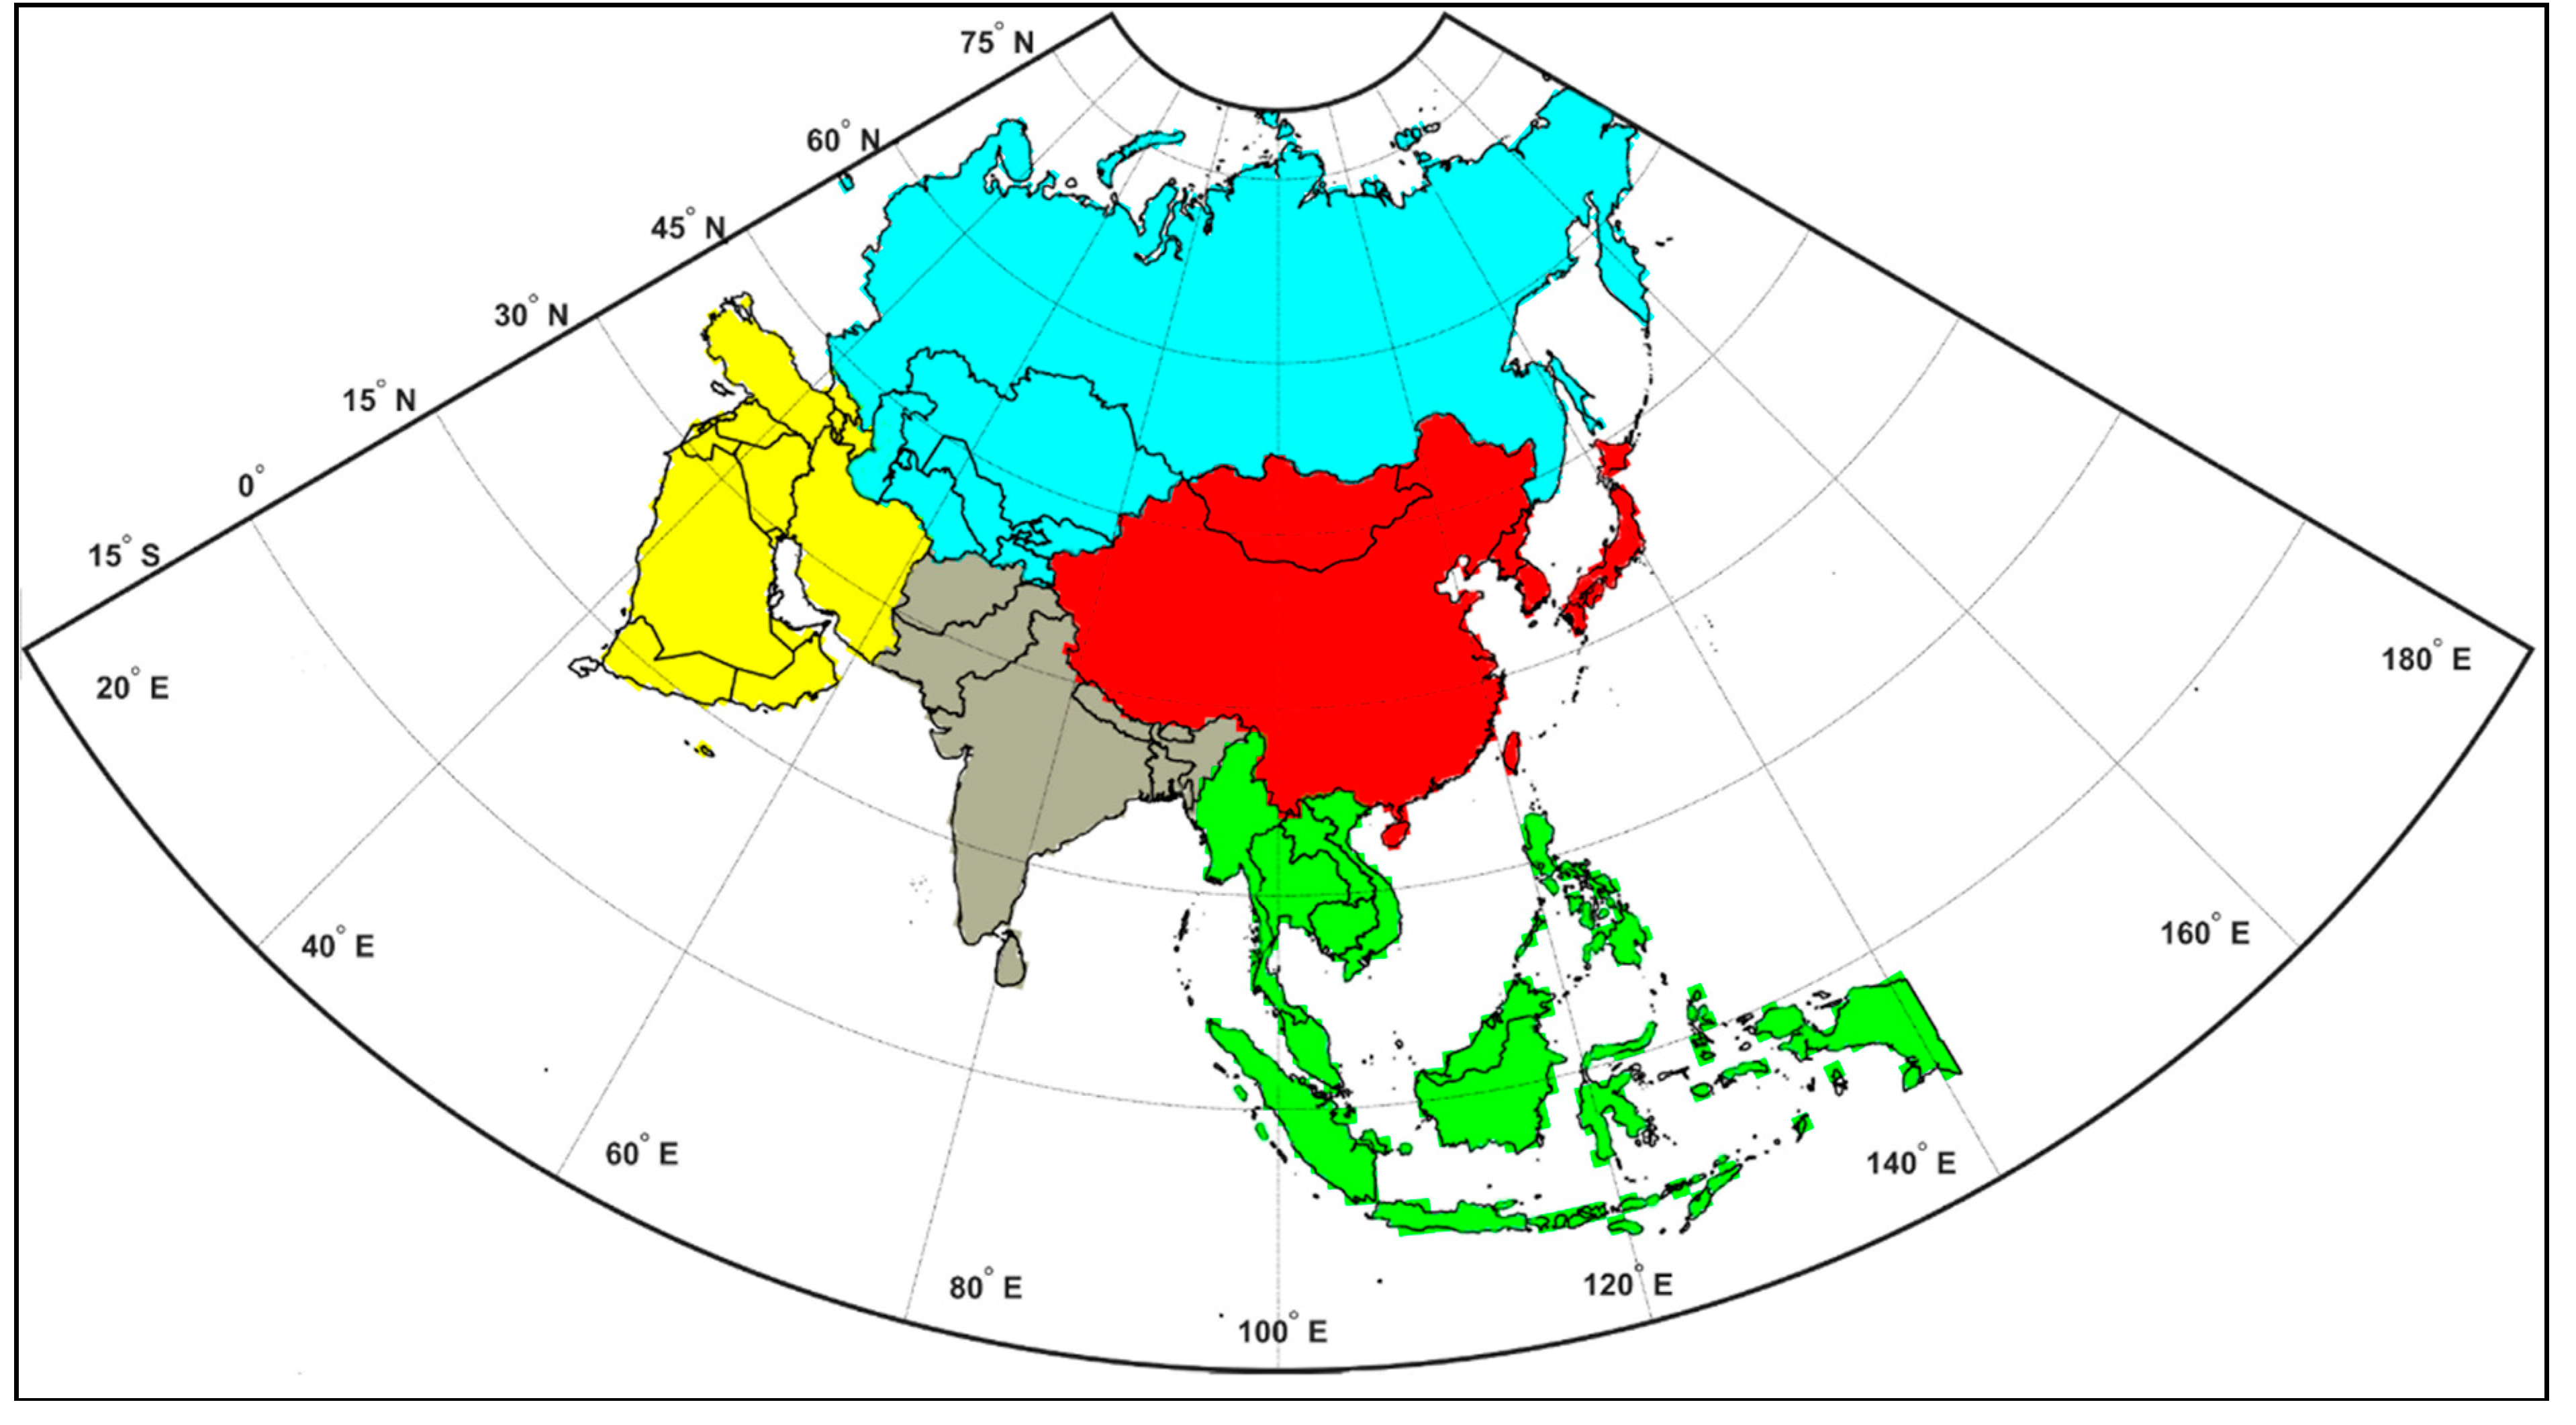
Figure 1. The Mediterranean-Asia which included 45 countries was categorized into five sub-regions in this study as the followings: East Asia (red), Central and North Asia (light blue), West Asia (yellow), South Asia (gray), and Southeast Asia (green).
Ijerph 16 03855 g001
Figure 2. The transition of heavy PM2.5 (μg/m3) loading from (a) South Asia in January 2016 to (b) Southeast Asia in March 2016, highly potential due to human activities in different seasons.
Ijerph 16 03855 g002
Figure 3. The penalized spline of the association between ambient PM2.5 concentration and under-five deaths in Asia. (A) Biomass PM2.5, (B) Anthropogenic PM2.5, (C) Dust PM2.5, (D) Biomass/dust mixture PM2.5, (E) Anthropogenic/dust mixture PM2.5, and (F) Biomass/anthropogenic mixture PM2.5. Adjusted for temperature, undernourished population, TB deaths, AIDS deaths, employed population, female population, urban population, total population, year, and country. The dose-response relationship is represented by the solid line while the broken line represents the 95% confidence interval.
Ijerph 16 03855 g003
Figure 4. Penalized spline of the association between ambient PM2.5 concentration and maternal deaths in Asia. (A) Biomass PM2.5, (B) Anthropogenic PM2.5, (C) Dust PM2.5, (D) Biomass/dust mixture PM2.5, (E) Anthropogenic/dust mixture PM2.5, and (F) Biomass/anthropogenic mixture PM2.5. Adjusted for temperature, undernourished population, TB deaths, AIDS deaths, employed population, female population, urban population, total population, year, and country. The dose-response relationship is represented by the solid line while the broken line represents the 95% confidence interval.
Ijerph 16 03855 g004
Table 1. Descriptive statistics of long-term under-five and maternal deaths, aerosol optical depth (AOD), types of PM2.5 and population characteristics, by sub-regions of Asia.
East AsiaCentral/North AsiaWest AsiaSouth AsiaSoutheast Asiap-Value a
Annual Mean (SD)Annual Mean (SD)Annual Mean (SD)Annual Mean (SD)Annual Mean (SD)
Under-5 deaths, n73,791.6 (149,993.4)14,375.2 (9,801.0)11,758.1 (16,626.0)330,969.9 (605,291.9)38,592.6 (52,828.0)<0.001
Maternal deaths, n1445.5 (2708.6)193.7 (185.1)357.7 (812.1)12,617.7 (23,035.4)1,622.32 (2672.2)<0.001
Biomass
AOD, τ0.29 (0.07)0.25 (0.06)0.30 (0.11)0.30 (0.08)0.35 (0.10)<0.001
PM2.5; Jan-Dec, μg/m3 37.84 (6.12)32.76 (3.54)35.51 (7.99)38.54 (6.32)42.71 (8.08)<0.001
Anthropogenic
AOD, τ0.37 (0.10)0.30 (0.06)0.32 (0.12)0.40 (0.11)0.35 (0.07)0.024
PM2.5; Jan-Dec, μg/m3 32.19 (5.40)28.24 (2.99)29.53 (6.20)33.52 (5.92)31.10 (3.91)0.009
Dust
AOD, τ0.48 (0.35)0.45 (0.26)0.40 (0.11)0.48 (0.15)0.51 (0.17)0.008
PM2.5; Jan-Dec, μg/m3 36.94 (17.54)35.50 (12.53)32.26 (5.72)36.50 (7.68)37.88 (8.81)0.024
Biomass/Dust Mixture
AOD, τ0.28 (0.06)0.33 (0.08)0.37 (0.14)0.38 (0.12)0.32 (0.08)0.040
PM2.5; Jan-Dec, μg/m3 45.15 (4.26)47.14 (4.50)49.97 (9.15)51.64 (7.39)48.71 (5.58)<0.001
Anthropogenic/Dust Mixture
AOD, τ0.39 (0.09)0.35 (0.07)0.36 (0.10)0.48 (0.14)0.37 (0.09)0.006
PM2.5; Jan-Dec, μg/m3 42.67 (5.02)40.52 (3.56)40.92 (5.03)47.76 (7.39)41.74 (4.60)0.004
Biomass/Anthropogenic Mixture
AOD, τ0.41 (0.15)0.28 (0.08)0.36 (0.16)0.42 (0.14)0.48 (0.21)<0.001
PM2.5; Jan-Dec, μg/m3 53.74 (9.64)45.34 (5.26)49.56 (9.25)53.37 (8.10)57.76 (13.24)<0.001
Total population, million291.0 (498.0)37.6 (50.4)22.6 (28.4)188.0 (368.0)54.7 (64.3)<0.001
Urban population, million146.0 (224.0)22.9 (37.0)13.9 (16.6)57.2 (111.0)23.4 (30.5)<0.001
Female population, %50.15 (1.07)51.01 (1.38)44.96 (7.15)49.05 (1.33)49.94 (0.98)0.473
Employed population, %63.59 (7.54)58.42 (4.14)52.36 (14.01)59.31 (11.52)65.92 (10.47)<0.001
AIDS death, thousand12.3 (10.2)3.2 (3.9)4.1 (2.8)3.3 (4.8)9.3 (10.8)0.788
Tuberculosis death rate, per 100,00016.27 (26.86)15.91 (6.76)2.91 (5.07)32.23 (23.03)40.42 (36.64)<0.001
Undernourished population, million42.0 (73.20)4.9 (5.0)6.0 (3.3) 35.0 (64.3)10.4 (10.0)0.049
Anemia in pregnancy, %27.43 (3.96)31.66 (4.36)31.41 (5.14)43.89 (8.42)34.74 (7.98)<0.001
Annual mean temperature, °C9.46 (5.45)8.06 (7.25)22.09 (4.82)20.30 (5.77)24.21 (3.27)<0.001
a, Generalized Linear Mixed-Effect was used to test for trend with the year being the random effect, SD, Standard deviation.
Table 2. Unadjusted generalized linear mixed-effect models of under-5 and maternal mortality in Asia.
VariableUnadjusted GLMM, IRR (95% CI) b
Under-5 Deaths Maternal Deaths
Type of PM2.5 a
Biomass1.45 (1.44, 1.45) ***1.24 (1.23, 1.24) ***
Anthropogenic0.84 (0.77, 0.93) ***2.65 (2.65, 2.65) ***
Dust2.58 (2.57, 2.59) ***3.55 (3.54, 3.56) ***
Biomass/Dust8.43 (7.98, 8.91) ***3.16 (3.15, 3.16) ***
Anthropogenic/Dust0.92 (0.83, 1.01)1.07 (1.02, 1.12) **
Biomass/Anthropogenic2.29 (2.27, 2.30) ***2.04 (2.03, 2.05) ***
Sub-regions (ref: East Asia)
Central/North Asia1.12 (0.11, 11.62)0.58 (0.05, 6.27)
West Asia3.03 (0.04, 2.29)0.29 (0.04, 2.27)
South Asia3.58 (0.39, 32.84)6.68 (0.71, 62.55)
Southeast Asia1.15 (0.14, 9.37)1.86 (0.22, 15.48)
Year0.44 (0.43, 0.44) ***0.39 (0.39, 0.39) ***
Total population0.001 (0.001, 0.001) ***0.21 (0.01, 0.78)
Urban population1.20 (1.12, 1.29) ***1.27 (1.19, 1.36) ***
Female population2.20 (2.08, 2.34) ***2.06 (2.02, 2.10) ***
Employed population0.86 (0.85, 0.86) ***0.59 (0.59, 0.59) ***
AIDS death0.08 (0.07, 0.08) ***0.07 (0.07, 0.07) ***
Tuberculosis death7.59 (7.54, 7.65) ***11.82 (11.79, 11.85) ***
Undernourished population1.17 (1.11, 1.22) ***1.20 (1.16, 1.24) ***
Anemia in pregnancy13.92 (6.11, 31.72) ***30.76 (12.24, 77.29) ***
Annual mean temperature2.55 (2.53, 2.57) ***4.56 (4.54, 4.59) ***
a, In one unit increment of PM2.5 concentration. b, Natural cubit spline smoothing was used. GLMM, Generalized linear mixed-effect model. IRR, Incidence rate ratio. CI, Confidence interval. * p ≤ 0.05, ** p ≤ 0.01, *** p ≤ 0.001.
Table 3. Adjusted generalized linear mixed-effect models and generalized additive mixed-effect models of under-5 and maternal mortality by sub-regions of Asia.
Under-5 Deaths, Adjusted ModelMaternal Deaths, Adjusted Model
Annual Mean PM2.5 aGLMM + NS
IRR (95% CI) b,c
GAMM + NS
Coef. (Se) b
GLMM + NS
IRR (95% CI) b,c
GAMM + NS
Coef. (Se) b
Asia Overall
Biomass1.29 (1.13, 1.47) ****−0.20 (0.003) ****1.09 (1.08, 1.10) ****−0.25 (0.01) ****
Anthropogenic1.12 (1.01, 1.24) **0.03 (0.004) ****1.02 (0.97, 1.08)−0.18 (0.001) ****
Dust0.89 (0.77, 1.04)0.04 (0.003) ****1.00 (0.99, 1.00)0.07 (0.01) ****
Biomass/Dust0.95 (0.85, 1.05)0.07 (0.003) ****1.64 (1.63, 1.65) ****0.03 (0.01) ****
Anthropogenic/Dust1.08 (0.95, 1.23)−0.04 (0.003) ****1.22 (1.19, 1.26) ****−0.08 (0.01) ****
Biomass/Anthropogenic1.05 (0.99, 1.11) *0.004 (0.002) **1.00 (0.99, 1.01)−0.04 (0.01) ****
SUB−REGIONS
East Asia
Biomass1.02 (1.01, 1.03) **0.02 (0.004) ****1.01 (0.99, 1.03)0.01 (0.01)
Anthropogenic1.01 (0.99, 1.04)0.03 (0.005) ****0.99 (0.96, 1.02)−0.002 (0.02)
Dust0.98 (0.95, 1.01)−0.03 (0.006) ****1.01 (0.97, 1.04)0.01 (0.02)
Biomass/Dust1.00 (0.96, 1.03)−0.001 (0.001)0.96 (0.93, 1.01)−0.05 (0.02) **
Anthropogenic/Dust0.96 (0.94, 0.98) ***−0.02 (0.007) ***1.01 (0.97, 1.05)−0.003 (0.02)
Biomass/Anthropogenic1.01 (1.00, 1.02) *−0.02 (0.004) ****0.99 (0.97, 1.02)−0.001 (0.01)
Central/North Asia
Biomass0.99 (0.99, 1.00)0.004 (0.005)1.07 (1.02, 1.13) **0.07 (0.03) **
Anthropogenic1.00 (0.99, 1.01)−0.01 (0.005) **1.01 (0.94, 1.08)−0.02 (0.04)
Dust1.01 (1.00, 1.01) **0.11 (0.008) ****1.03 (0.97, 1.10)0.07 (0.03) **
Biomass/Dust1.00 (0.99, 1.01)0.03 (0.007) ****1.05 (0.96, 1.16)0.05 (0.05)
Anthropogenic/Dust1.00 (0.99, 1.01)0.003 (0.006)1.08 (1.00, 1.18) *0.08 (0.04) *
Biomass/Anthropogenic0.99 (0.99, 0.99) ***−0.04 (0.005) ****0.96 (0.91, 1.02)−0.04 (0.03)
West Asia
Biomass1.01 (0.99, 1.01)−0.06 (0.004) ****0.99 (0.96, 1.03)−0.01 (0.02)
Anthropogenic1.02 (1.01, 1.03) **0.002 (0.008)0.89 (0.85, 0.94) ***−0.14 (0.03) ****
Dust0.99 (0.98, 1.00)−0.10 (0.005) ****1.03 (0.98, 1.08)−0.02 (0.02)
Biomass/Dust0.96 (0.94, 0.98) ***0.01 (0.01)0.82 (0.74, 0.92) ****−0.13 (0.05) **
Anthropogenic/Dust0.99 (0.98, 1.00)0.03 (0.005) ***0.94 (0.90, 0.98) ***−0.01 (0.02)
Biomass/Anthropogenic1.01 (1.00, 1.01) **−0.006 (0.002) **0.99 (0.96, 1.01)−0.03 (0.01) **
South Asia
Biomass0.90 (0.82, 0.99) *−0.22 (0.003) ****0.92 (0.85, 0.99) *−0.09 (0.02) ****
Anthropogenic0.98 (0.89, 1.07)−0.05 (0.003) ****1.00 (0.99, 1.00)−0.005 (0.02)
Dust0.97 (0.93, 1.03)−0.05 (0.002) ****0.99 (0.95, 1.04)−0.01 (0.01)
Biomass/Dust1.00 (0.95, 1.05)0.04 (0.002) ****1.00 (0.99, 1.01)−0.02 (0.009) **
Anthropogenic/Dust0.99 (0.88, 1.12)−0.10 (0.004) ****1.00 (0.99, 1.00)−0.20 (0.02) ****
Biomass/Anthropogenic0.95 (0.90, 0.99) *−0.09 (0.002) ****0.99 (0.99, 0.99) **−0.03 (0.009) ****
Southeast Asia
Biomass1.07 (0.89, 1.29)0.02 (0.008) ***0.96 (0.89, 1.04)−0.14 (0.03) ****
Anthropogenic1.08 (0.94, 1.25)0.09 (0.006) ****1.00 (0.99, 1.01)−0.06 (0.02) **
Dust1.05 (0.94, 1.18)0.03 (0.005) ****0.98 (0.93, 1.02)−0.06 (0.02) ***
Biomass/Dust1.10 (0.94, 1.28)0.11 (0.007) ****1.00 (0.99, 1.01)−0.02 (0.03)
Anthropogenic/Dust1.16 (0.97, 1.38)0.16 (0.007) ****1.00 (0.99, 1.01)0.02 (0.03)
Biomass/Anthropogenic1.07 (0.98, 1.16)0.07 (0.004) ****0.99 (0.99, 0.99) **−0.05 (0.01) ****
a, In one unit increment of PM2.5 concentration. b, Adjusted for country, year, total population, urban population, female population, employed population, HIV/AIDS death, tuberculosis death, undernourished population, and temperature. c, Natural cubit spline smoothing. GLMM + NS, Generalized linear mixed-effect model with natural cubit spline. IRR, Incidence rate ratio. CI, Confidence interval. GAMM, Generalized Additive Mixed Model with natural cubit spline. Coef., Coefficient. Se, Standard error. * p ≤ 0.10, ** p ≤ 0.05, *** p ≤ 0.01, **** p ≤ 0.001.