Article

Seasonal Release Potential of Sediments in Reservoirs and its Impact on Water Quality Assessment

1
Institution of Water and Environment Research, Dalian University of Technology, Dalian 116024, China
2
China Water Resources Pearl River Planning Surveying & Designing Co, Ltd, Guangzhou 510610, China
3
Jiangsu Smart Factory Engineering Research Center, Huaiyin Institute of Technology, Huaian 223200, China
*
Author to whom correspondence should be addressed.
Int. J. Environ. Res. Public Health 2019, 16(18), 3303; https://doi.org/10.3390/ijerph16183303
Submission received: 12 July 2019 / Revised: 29 August 2019 / Accepted: 5 September 2019 / Published: 8 September 2019

Abstract

:
Reservoir sediments act as important receivers and sources for nutrients in the overlaying water. To determine the sediments adsorption and release characteristics and their impacts on water quality, surface sediments samples collected from Biliuhe reservoir in August 2015 were studied through simulation experiments in a laboratory. The results demonstrated that the equilibrium concentrations (EC0) of ammonia nitrogen (NH4+–N) and total phosphorus (TP) were 8.29 mg/L and 0.025 mg/L, respectively, which were both higher than the average concentrations in the overlying water. Therefore, the sediments of Biliuhe reservoir mainly acted as the pollution sources for NH4+–N and TP, and the release to water showed a seasonal variation. When potential release amounts were considered, the average concentrations of NH4+–N and TP in the overlaying water could reach 6.4 mg/L and 0.21 mg/L, respectively, which significantly exceeded the current contents. Further, water quality exhibited a decreased tendency after taking the release potential of nutrients into account of water quality assessment. Among the samples, 42% and 33% of them in summer and autumn exceeded the third level of the National Surface Water Quality Standards of China (GB3838-2002). The results indicated that sediments release potential had an unignored influence on water quality during various seasons.

1. Introduction

As an important component of the reservoir water environment, sediments have the contradictory characteristics of “source–sink” for pollutants. During the long operation period of a reservoir, sediments have been receivers of various pollutants including point and nonpoint sources [1,2]. With the perennial accumulation of pollutants and mineralization of sedimentary organic matter, concentrations of a variety of constituents in sediments are many times greater than those in water. When the external environment condition is changed, constituents will be released from sediments into the water column through desorption, dissolution, mineralization, and microbe release, leading to algae over-blooming and water quality degradation [3,4,5,6]. Thus, sediments act as pollution sources to water.
Previous studies have indicated that phosphorus and nitrogen released from sediments are the main determinants of eutrophication following reductions of external loadings. For example, in West Lake of Hangzhou, the calculated release capacity of phosphorus from sediments accounted for 36.4% of the average external phosphorus loading [7]. A study in Lake Erken, Sweden, showed 99% of the nutrients were from sediments in summer [8]. It is also pointed out that for some eutrophic lakes and reservoirs, the release of nutrients such as nitrogen and phosphorus from sediments will still cause eutrophication, and this effect may last for decades [9]. An increasing amount of studies have shown that reservoir sediments can also be sources of pollution after decades of operation [10,11,12,13]. Therefore, the release of sediments is gradually considered in water quality assessment [14]. It is proven that pollutants released from sediments can affect the water quality evaluation results and sediments release is a non-negligible factor in water quality simulation and evaluation [15,16].
The adsorption and release characteristics of sediments change with the contents of the overlying water, physicochemical properties of sediments [17,18], water temperature (TW) [19], dissolved oxygen (DO) [20], pondus hydrogenii (pH) conditions [21], and other environmental factors [22,23]. For reservoirs in the monsoon climate zone, environmental and water quality indicators vary with seasonal changes, which cause the adsorption and release characteristics of the sediments to change seasonally. For instance, high temperature and high heat in summer can easily lead to the formation of the thermocline in water, which will give rise to the release of pollutants in the sediments. In the summer of 2008, Tanghe reservoir in Liaoning province suffered an unexpected water supply incident as a result of the release of hydrogen sulfide from sediments under the influence of the summer thermocline [24]; Xinlicheng reservoir in Jilin province encountered eutrophication because of the excess nitrogen and phosphorus released from the sediments in the flood season of 2007 and 2008 [25]. Therefore, reasonable and accurate evaluation of the sediments release potential and its impact on water quality is an important basis for the development and utilization of water resources, especially taking into account the specific seasonal variation of external environmental factors.
Biliuhe reservoir was built in 1975 and is now the largest water source of Dalian, making up 80% of the water supply for Dalian. The nutrients in the water column, such as the total nitrogen (TN), total phosphorus (TP), and ammonia nitrogen (NH4+–N), may exceed third level of the National Surface Water Quality Standards of China (GB3838-2002) at times, resulting in the risk of water eutrophication [26]. The TN and TP contents in sediments have reached 2725 mg/kg and 571mg/kg after nearly 30 years of operation [27,28]. Compared with other similar reservoirs in China, the sediments have a higher release risk for nitrogen and phosphorus. Besides, Biliuhe reservoir belongs to the monsoon climate zone, and the environmental factors such as TW, DO, and pH have obvious seasonal variation laws in accordance with the monsoon climate. As a consequence, to evaluate the sediments release potential in combination with different seasonal conditions and the effects on water quality can provide support for the safety of water supply, which is of significance. Therefore, this paper carried out a series of physical simulation experiments to identify the adsorption and release characteristics of the sediments in Biliuhe reservoir, and explored the effects of different environmental factors on the release characteristics. Then, the sediments potential release amounts of NH4+–N and TP in different seasons were calculated in combination with the environmental factors in actual operating conditions. Finally, the seasonal variation of water quality considering the sediments release potential was assessed.

2. Materials and Methods

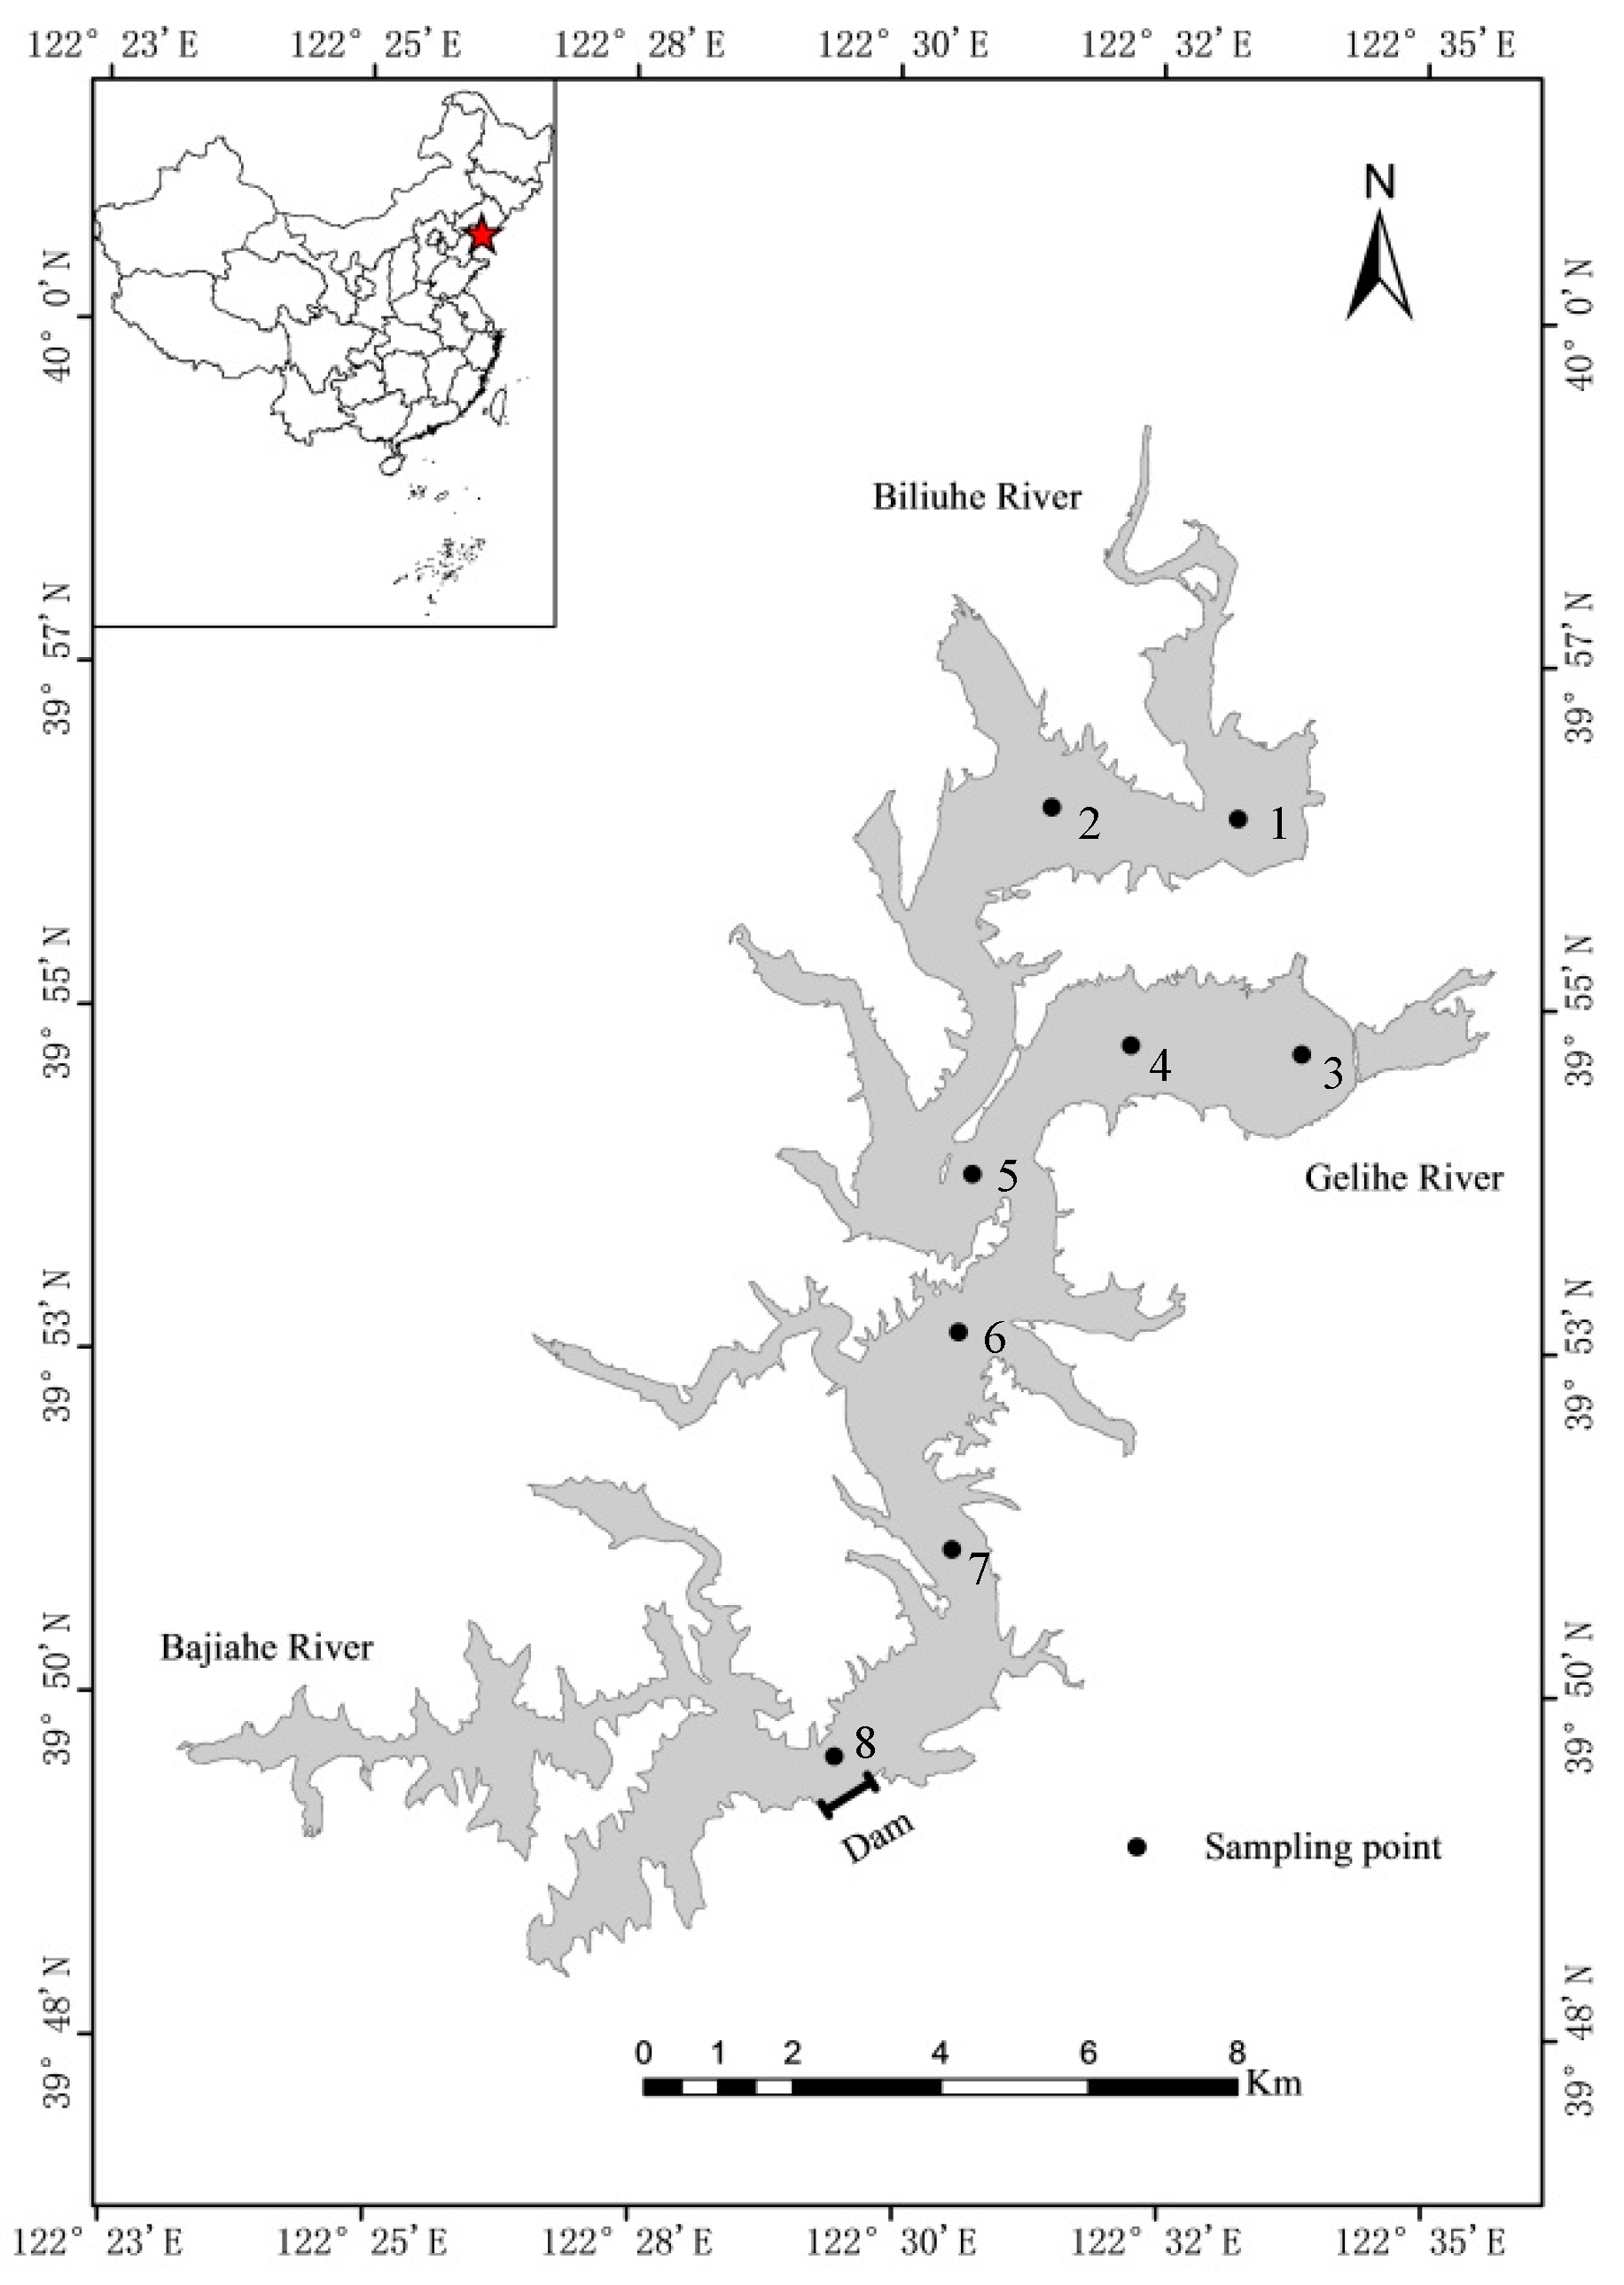
2.1. Study Area and Sampling

This paper takes Biliuhe reservoir in Dalian, Northern China as an example. As shown in Figure 1, Biliuhe reservoir has a mainstream, Biliuhe River, and two main tributaries, Gelihe River and Bajiahe River. According to the “Regulation for Water Environmental Monitoring of China (SL 219-2013)”, eight sampling points were set along the longitudinal section of the reservoir from the main inflow entrance (Sampling points 1 and 2), the Gelihe River inflow entrance (Sampling points 3 and 4), to the center of the reservoir (Sampling points 5, 6, and 7), and to the front of the dam (Sampling point 8). The average water depth is 12.8 m, so the stratified water samples were collected at 5 m intervals using Niskin bottles from January 2013 to December 2016 at the beginning of each month. The surface sediments samples were collected at the sampling points by use of a Van Veen Grab Sampler in August 2015. At the same time, TW, DO, and pH were detected on-site by WTW Multi 340i. The samples were carried to the laboratory soon after the sampling. There, water samples were detected soon by reference methods in the “Water and Wastewater Monitoring and Analysis Method (Fourth Edition), Beijing: China Environmental Science Press, 2002”. Besides, the sediments were dried in natural wind, smashed and screened through a mesh size of 100, and finally stored in a freezer at a temperature of −20 °C until analysis [29]. Statistical analysis was performed using SPSS 23. 0 (IBM, Armonk, NY, USA).

2.2. Experimental Methods

Nitrogen and phosphorus are the main determinants of water eutrophication. Previous experiments and studies have shown that NH4+–N is the main exchange fraction of nitrogen at the sediment–water interface [30,31]. Thus, NH4+–N and TP were chosen as the two indices for the sediments experimental simulation. Besides, in the laboratory, all sampled sediments were pooled together and thoroughly homogenized.

2.2.1. Sediments Adsorption Experiments

NH4+–N solutions with gradient concentrations of 0, 1, 5, 10, 15, 25, 30, 40, 50, 60, 70, 90, and 100 mg/L were prepared by ammonium chloride, and the pH of all of them was adjusted to 7.0 by 0.01 mol/L HCL and 0.01 mol/L NaOH [4]. In a series of 100 mL centrifuge tubes, 1 g of sediments was placed and treated with 100 mL NH4+–N solution at various concentrations. Thereafter, the tubes were shaken for 24 h at the temperature of 25 °C in a stable temperature water shaking bath at 200 rpm. After 24 h of equilibration [32], the samples were centrifuged at 5000 rpm for 10 min and then filtered through a 0.45 um filter membrane. The filtrate was taken for NH4+–N analyses via Nessler’s reagent spectrophotometry [33]. Triplicate experiments were carried out at the same time, and the relative error was lower than 5%.
A series of initial TP concentrations of 0, 0.5, 1, 2, 5, 8, 10, 15, 25, 30, and 50 mg/L were prepared by potassium dihydrogen phosphate. The pH of the solutions was also maintained at 7.0 by adjusting with 0.01 mol/L HCL and 0.01 mol/L NaOH [34]. Similarly, 1 g sediments samples and 100 mL TP solution of different concentrations were put into 100 mL centrifuge tubes. The other experimental conditions were the same as those of the NH4+–N adsorption experiments. TP remaining in the filter was analyzed by the phosphor molybdenum blue spectrophotometry [33]. Triplicate experiments were carried out at the same time, and the relative error was lower than 5%.
In the end, the adsorption capacity was calculated to describe the sediments adsorption effect of NH4+–N (TP). The equation is as follows [35].
q = ( C 0 C e ) × V W ,
where q is adsorption capacity of NH4+–N (TP), mg/kg; C0 is the initial concentration of NH4+–N (TP) in the solution, mg/L; Ce is the equilibrium concentration of NH4+–N (TP) in the solution, mg/L; V is the volume of the solution, mL; and W is the mass of the sediments, g.

2.2.2. Sediments Release Experiments

NH4+–N stock solution was prepared by ammonium chloride, and TP stock solution was prepared by potassium dihydrogen phosphate. Firstly, a series of 1 g sediments samples was added into 100 mL centrifuge tubes. Then, a sequence of low concentrations of NH4+–N solutions (0, 0.5, 1, 2, 4, 6, 8, 10 mg/L) prepared by NH4+–N stock solution was separately put into the above centrifuge tubes [36]. Meanwhile, a sequence of low concentrations of TP solutions (0, 0.0025, 0.005, 0.0125, 0.020, 0.025, 0.030, 0.040 mg/L) prepared by TP stock solution was separately put into 100 mL centrifuge tubes with 1 g sediments samples [35]. Next, the experimental conditions were kept the same as in the former experiments and the release amounts of NH4+–N (TP) at different initial concentrations were calculated according to Equation (1). Triplicate experiments were carried out at the same time, and the relative error was lower than 5%.

2.2.3. Sediments Release Experiments under Different TW, DO, and pH

To study sediments release characteristics under different TW, 1 g sediments samples and 100 mL distilled water were put into 100 mL centrifuge tubes. Afterwards, the tubes were separately shaken at the temperatures of 5, 15, and 25 °C in stable temperature water shaking baths at 200 rpm. After 24 h of equilibration, the samples were centrifuged and filtered, and then the supernatants were taken for analysis.
Similarly, an anaerobic environment (DO = 2 ± 0.5 mg/L), low oxygen environment (DO = 4 ± 0.5 mg/L), and natural environment condition (DO = 8.5 ± 0.5 mg/L) were simulated by the boiling method to study the release characteristics under different DO conditions. In addition, different pH gradients (2, 7, 11) were simulated by use of 0.01 mol/L NaOH and 0.01 mol/L HCl solutions to conduct the release experiments under different pH conditions. Triplicate experiments were carried out at the same time, and the relative error was lower than 5%.

2.3. Water Quality Assessment Methods Considering Sediments Release Potential

The variable fuzzy pattern recognition (VFPR) model was selected to assess the water quality because of its superiority in assessing the index with continuity and uncertainty characteristics [37].

2.3.1. Assessment Index System

Firstly, the water index system Xij (i is the number of indicators and j is the number of samples) was set up according to the principles of comprehensiveness, systematicness, and availability. In this paper, eight indicators including DO, pH, TP, total nitrogen (TN), NH4+–N, iron (Fe), manganese (Mn), and permanganate index (CODMn) were selected for water quality assessment. These indicators explained the water quality from the aspects of comprehensive, eutrophication, and heavy metals, so the established index system could effectively represent the water quality of the reservoir.
At the same time, the release potential Δ x i of NH4+–N and TP in sediments under different environmental conditions was calculated by Equation (2) according to the sediments release experiments:
Δ x i = Q × q i h i × 100 ,
where Δxi is the increment of the index i, mg/L; Q is the sediments content per unit area, g/cm2; qi is the release amount of index i, mg/kg; and hi is the water depth of index i, m.
Thus, the new assessment index system Xij is obtained:
X i j = X i j + Δ X i j .

2.3.2. Indicator Normalization

In order to eliminate the dimension of the index and unify the change direction of the indicator (TN, TP and other inverse index, DO, transparency, and other positive index), water quality samples Xij and water quality standards Yic were normalized using Equation (4) and (5), respectively.
r i j = { 0, x i j y ic(inverse index)orxijyic(positive index) x i j y i c y i 1 y i c , y i 1 < x i j < y i c ( inverse   index ) or   y i 1 > x i j > y i c ( positive   index ) 1, x i j yi1(inverse index)orxijyi1(positive index)   ,
s i h = { 0 , y i h = y i c ( positive   index   or   inverse   index ) y i h y i c y i 1 y i c , y i 1 < y i h < y i c ( positive   index ) or   y i 1 > y i h > y i c ( inverse   index ) 1 , y i h = y i 1 ( positive   index   or   inverse   index ) ,
where c is the highest level of the standard, c = 1,2,3,4,5; rij and sih are the normalized results of the samples Xij and water quality standards Yic; and h is the standard level of water quality (h = 1,2,... c).

2.3.3. Comprehensive Relative Membership Degree

Equation (6) is used to calculate the comprehensive relative membership degree uhj of water quality sample j belonging to the water quality standard h:
u h j = { 0 h < a j or h > b j 1 k = a j b j { i = 1 m [ w i j ( r i j s i h ) ] i = 1 m [ w i j ( r i j s i k ) ] p p } a p a j h b j 1 h = a j = b j ,
where aj and bj are the minimum and maximum value of water quality sample j, respectively; wij is the weight of index i of water quality sample j, i = 1 m w i = 1 ; a is the optimization criterion parameter, a = 1 represents the linear criterion and a = 2 represents the least-squares criterion; and p is the distance parameter, p = 1 represents Hamming distance and p = 2 represents Euclidean distance.

2.3.4. Comprehensive Assessment Level of Water Quality

When the comprehensive relative membership degree uhj is calculated, the comprehensive assessment level of water quality sample j can be obtained using Equation (7).
H = h = 1 c u hj h ,
where H is the characteristic value of water quality and h is the standard level of water quality (h = 1,2,... c).

3. Results and Discussion

3.1. Identification of Source–Sink Characteristics of Sediments

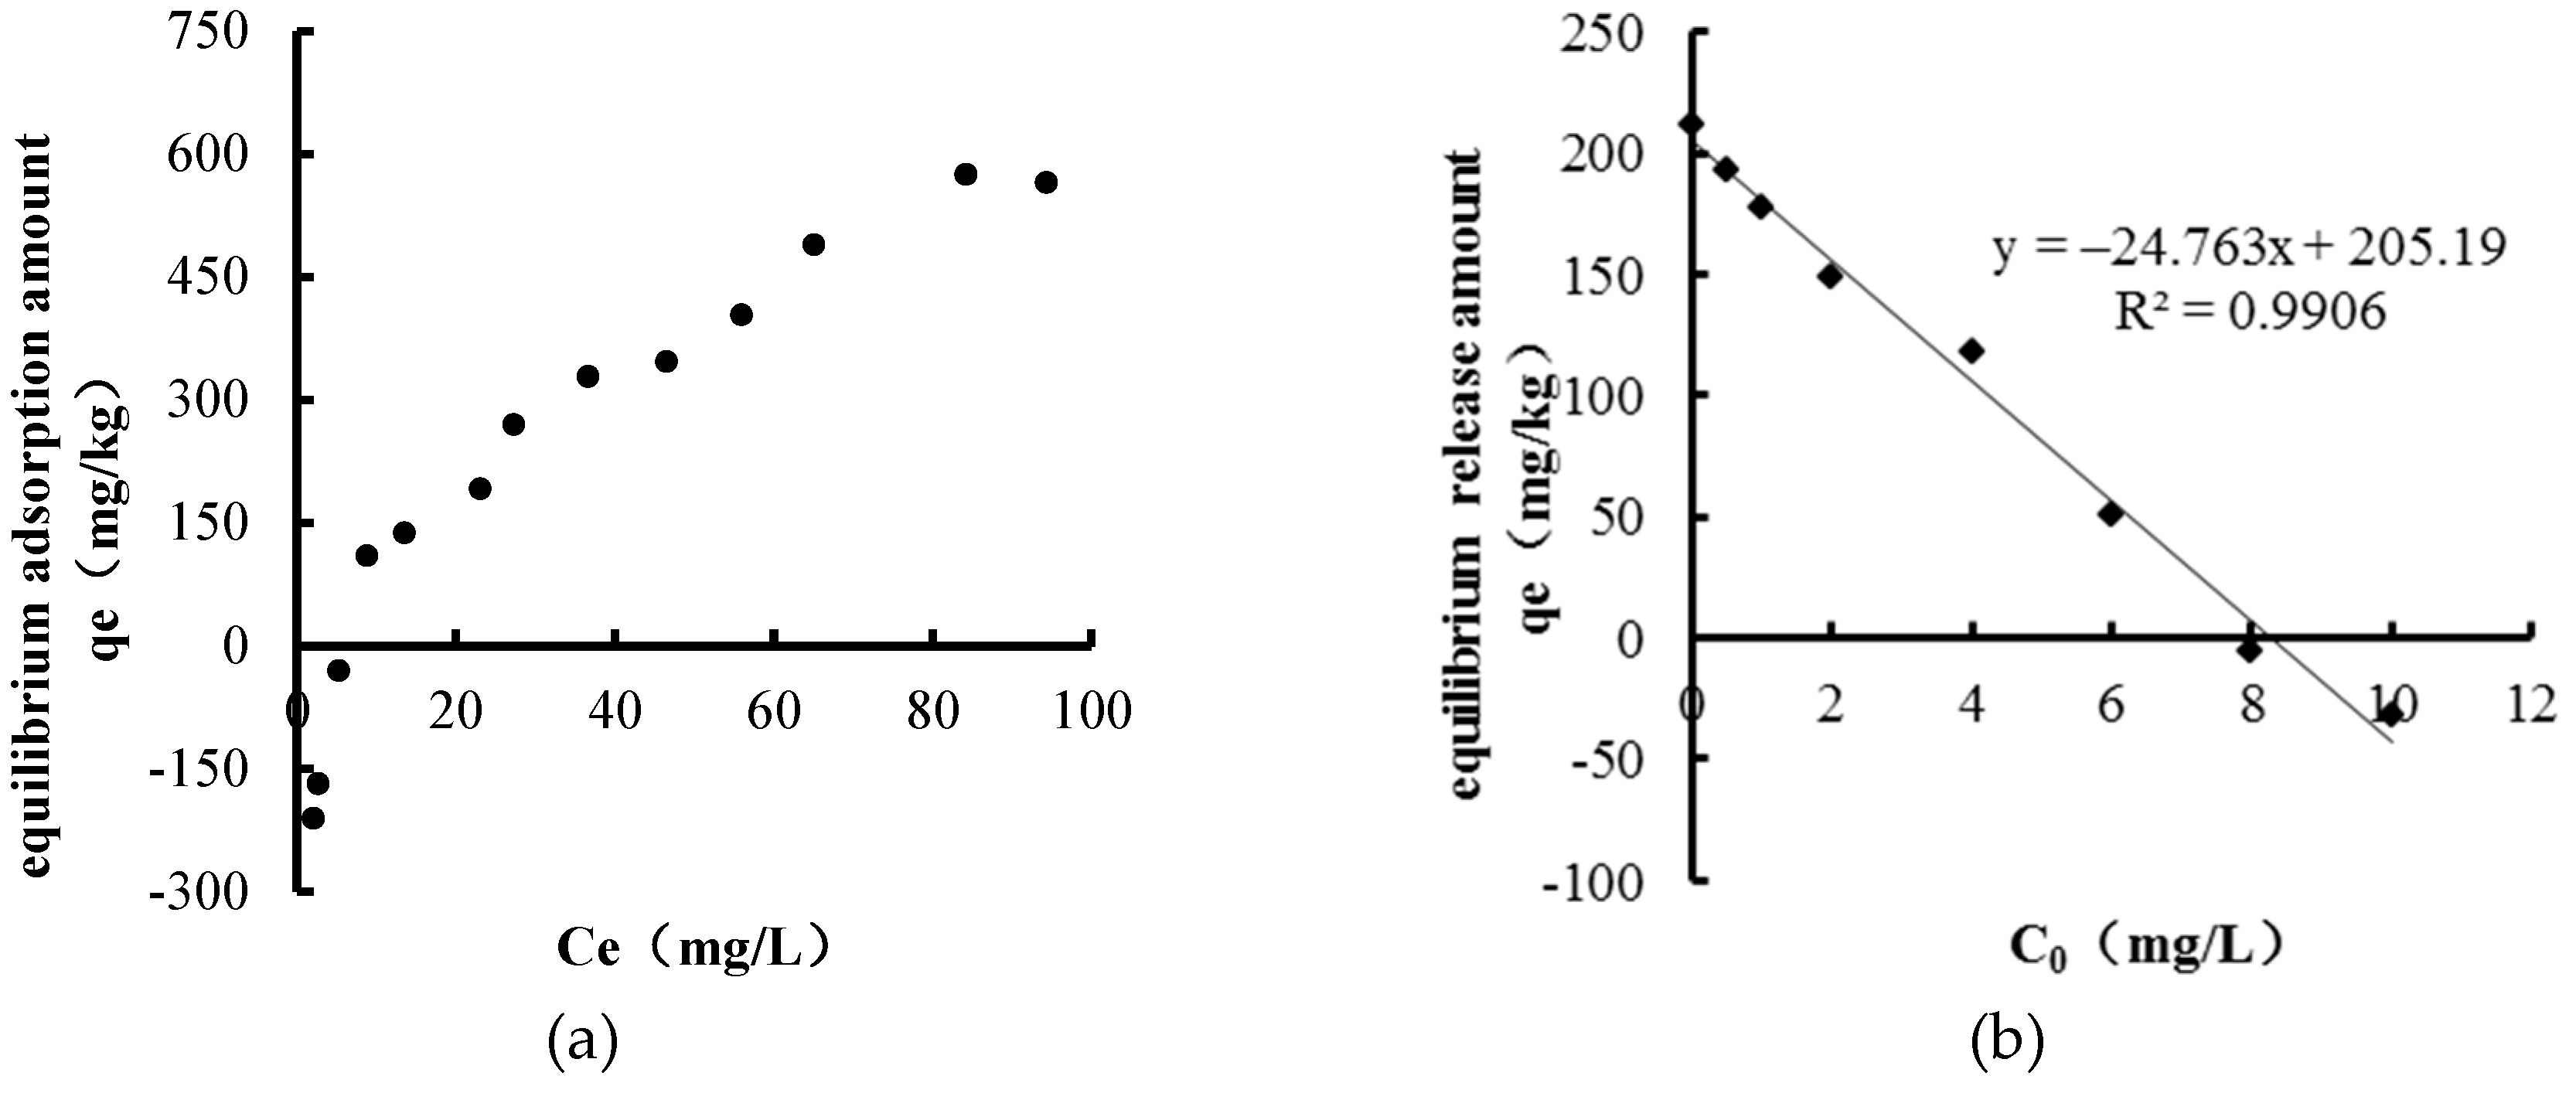
3.1.1. Sediments NH4+–N Source–Sink Identification

The characteristics of NH4+–N adsorption and release in sediments of Biliuhe reservoir are shown in Figure 2.
It can be seen from the adsorption characteristic (Figure 2a) that sediments began to adsorb NH4+–N from the overlying water when its concentration was between 5~10 mg/L, and the adsorption amount increased with the increase of the NH4+–N concentration in the overlying water. When the concentration of NH4+–N in the overlying water was 80~100 mg/L, the adsorption reached equilibrium.
The Langmuir and Freundlich equations were introduced to describe the NH4+–N adsorption characteristic, which have both been widely used to describe the adsorption behavior [38,39].
The Langmuir equation assumes that the adsorbed particles are completely independent, and the equation is as follows [40]:
q e = q L K L C e 1 + K L C e .
Also, this equation could be expressed by a linear model as follows:
1 q e = 1 q L K L 1 C e + 1 q L ,
where Ce is the equilibrium concentration of the overlying water, mg/L; qe is the equilibrium adsorption amount, mg/kg; qL is the theoretical saturation adsorption capacity, mg/g; and KL is the Langmuir constant related to the adsorption heat, L/mg.
The Freundlich equation is more widely used to describe the multilayer sorption on a heterogeneous surface, and the equation is as follows [41]:
q e = k C e 1 / n .
Also, this equation could be expressed by a linear model as follows:
lg q e = 1 n lg C e + lg k ,
where qe is the equilibrium adsorption amount, mg/kg; Ce is the equilibrium concentration of the overlying water, mg/L; and k and n are both the Freundlich constants related to the capacity of adsorption substrate.
The calculation results (Table 1) showed that the Langmuir and Freundlich equations well fitted the NH4+–N adsorption characteristic with R2 of 0.9735 and 0.9846, respectively. The theoretical saturation adsorption capacity of NH4+–N was 909.1 mg/kg.
As can be seen in Figure 2b, with the increase of initial NH4+–N concentration in the overlying water, the release amount decreased inversely, and sediments began to adsorb NH4+–N from the overlying water when the initial NH4+–N concentration was between 8 and 10 mg/L. The amounts of NH4+–N released from sediments had a linear relationship with the initial concentration (R2 = 0.9906) [42]. Therefore, the equilibrium concentration (EC0) [43] of NH4+–N was obtained as 8.29 mg/L. The results are shown in Table 1.
The annual average concentration of NH4+–N in Biliuhe reservoir was 0.28 mg/L from 2013 to 2016, and the seasonal average values during winter, spring, summer, and autumn were 0.27, 0.23, 0.32, and 0.31 mg/L, respectively. The NH4+–N concentration of Biliuhe reservoir was much lower than the EC0 of 8.29 mg/L, indicating that the sediments of Biliuhe reservoir had a high risk of release. Therefore, the sediments of Biliuhe reservoir will function as a pollution source for NH4+–N.

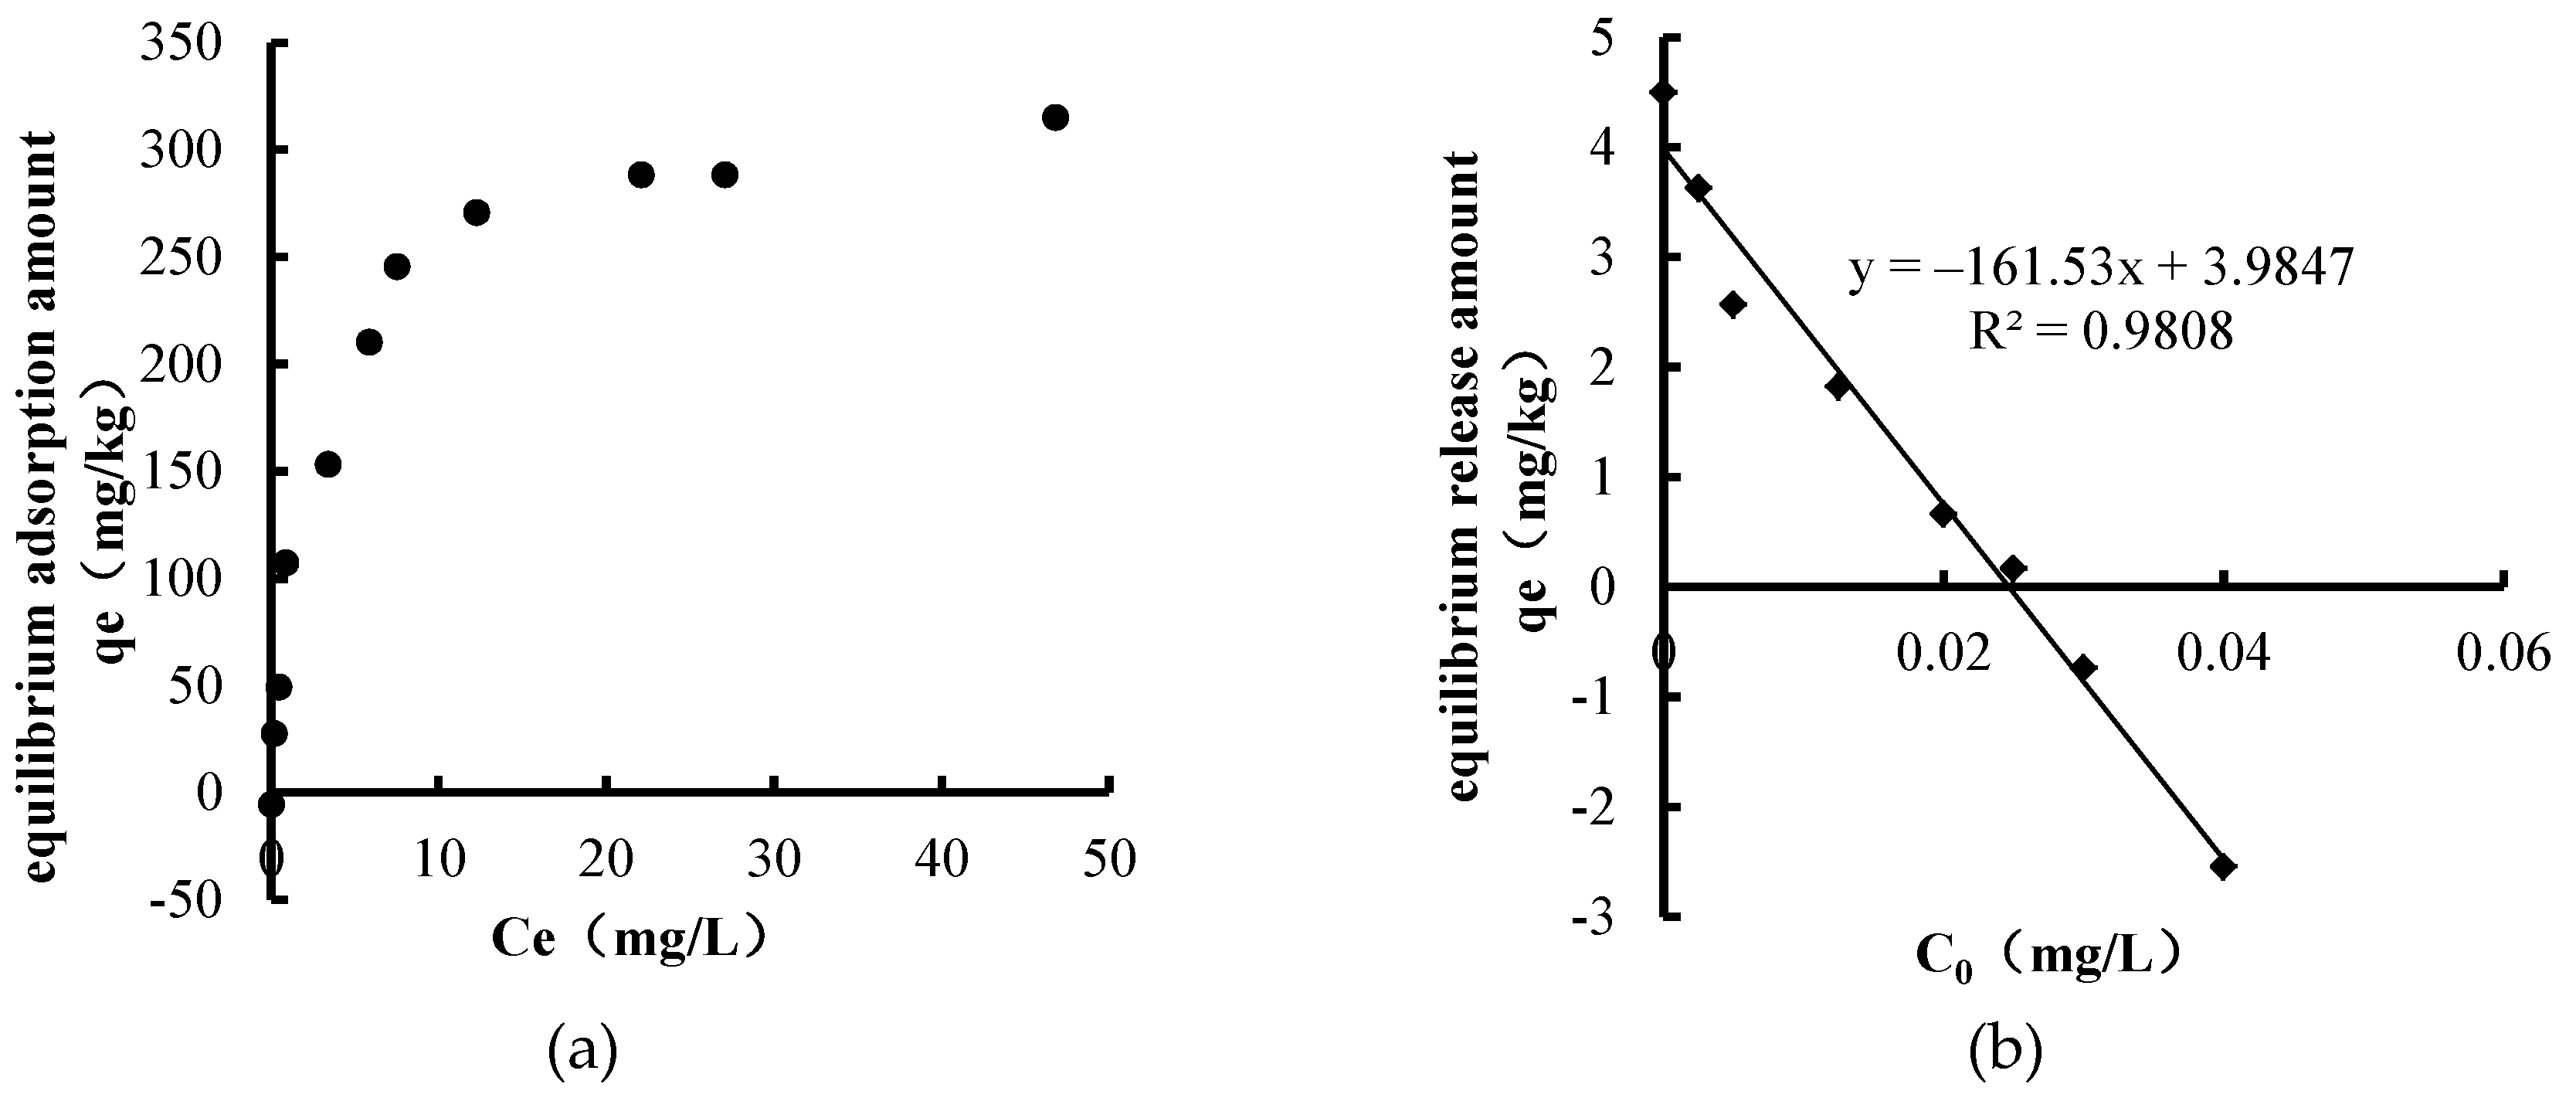
3.1.2. Sediments TP Source–Sink Identification

The characteristics of TP adsorption and release in sediments of Biliuhe reservoir are shown in Figure 3.
It can be seen from the adsorption characteristic (Figure 3a) that sediments began to adsorb TP from the overlying water when its concentration was between 0~0.05 mg/L, after which the adsorption amount increased with the increase of TP concentration in the overlying water. When the concentration of TP in the overlying water was 20 mg/L, the adsorption reached equilibrium. Similarly, both the Freundlich equation and the Langmuir equation provided a good fit to the TP adsorption characteristic with R2 of 0.9899 and 0.9117, respectively. The theoretical saturation adsorption capacity of TP was 312.5 mg/kg (Table 2).
The TP release characteristic (Figure 3b) showed that the amount of TP released from sediments and the initial concentration of TP in solution exhibited a linear relationship (R2 = 0.9808). The calculated EC0 of TP was 0.025 mg/L. The fitting results are shown in Table 2.
EC0 was higher than the annual average concentration of TP (0.024 mg/L) in overlying water from 2013 to 2016, indicating the risk that TP releases to overlying water is high. The seasonal average values of TP concentration in the overlaying water during winter, spring, summer, and autumn were 0.019, 0.020, 0.035, and 0.021 mg/L, respectively. Among these, the TP concentration in summer exceeded the EC0, which indicated that the reservoir sediments could adsorb TP from the overlying water in summer. In conclusion, the sediments of Biliuhe reservoir had the dual characteristic of source and sink for TP.

3.2. Sediments Release Characteristics under Different TW, DO, and pH

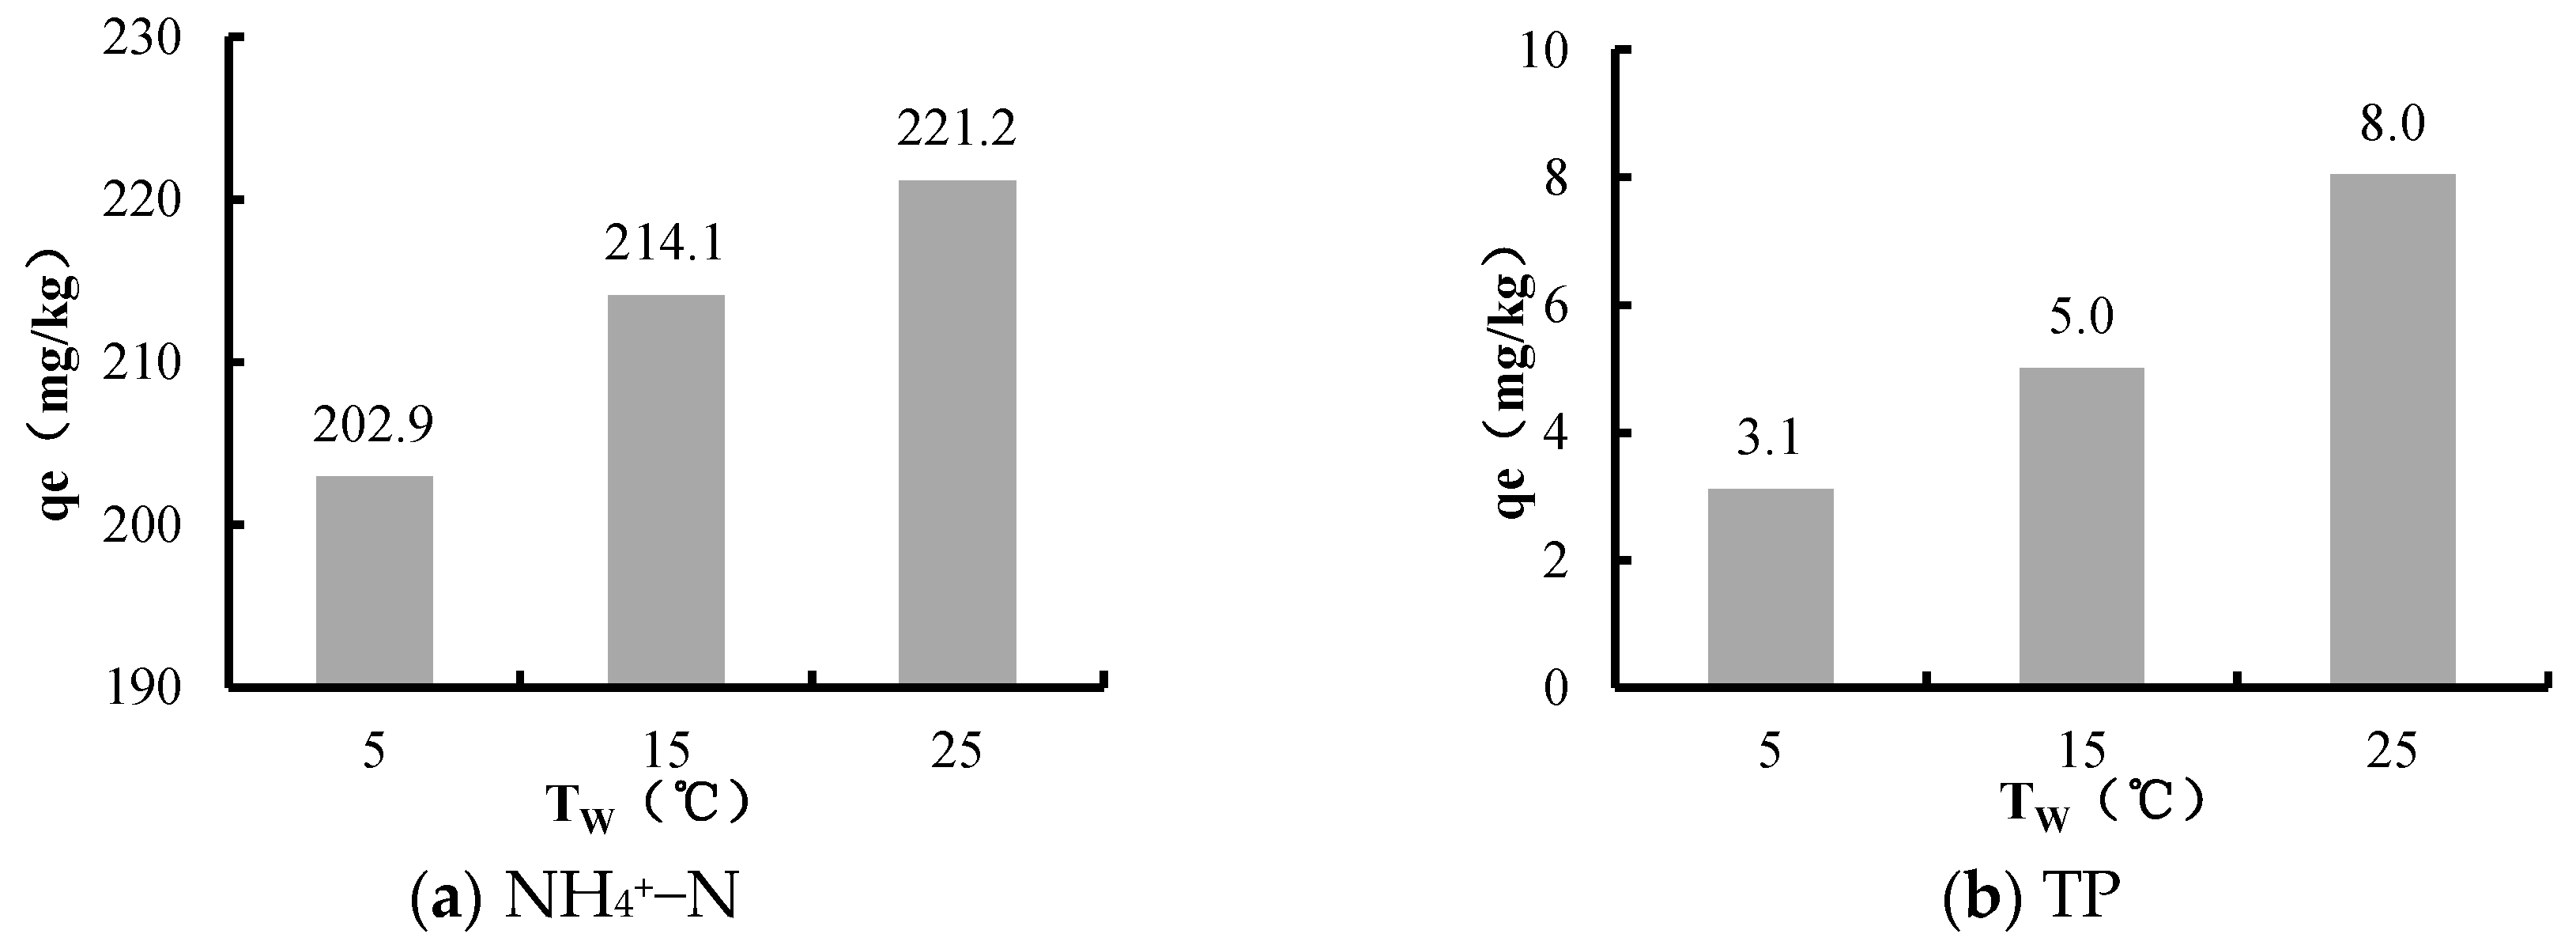
3.2.1. Water Temperature

Figure 4 shows the relation between water temperature (TW) and the release amounts of NH4+–N and TP.
The experiment results showed that the release amounts of NH4+–N and TP increased with TW. At 25 °C, the release amounts of NH4+–N and TP from sediments were 1.1 and 2.6 times greater than that at 5 °C.
TW is an important factor affecting soil mineralization. When TW increased, more organic nitrogen was transformed to ammonium nitrogen as the soil mineralization strengthened, which promoted NH4+–N to release from sediments. Meanwhile, the reduced oxygen caused by the strengthening soil mineralization impeded the nitrification reaction in the sediments. Under the integrated influences, the NH4+–N released from sediments increased with the temperature. The results from previous experiments in Chaohu Lake also suggested the same trend [44].
An increase of TW would promote the migration of phosphorus in sediments through pore water to overlaying water as the sediments adsorption capacity of TP was decreased [45,46]. At the same time, the activity of the microorganisms was also enhanced, and this effectively promoted the conversion of organic phosphorus to inorganic phosphate [47,48]. In addition, the consumption of oxygen by the microorganisms caused the dissolved oxygen to decrease. Further, the decreased oxygen caused the redox potential decline, and Fe2+ transformed from Fe3+ increase; therefore, a large amount of Fe–P was released from sediments.

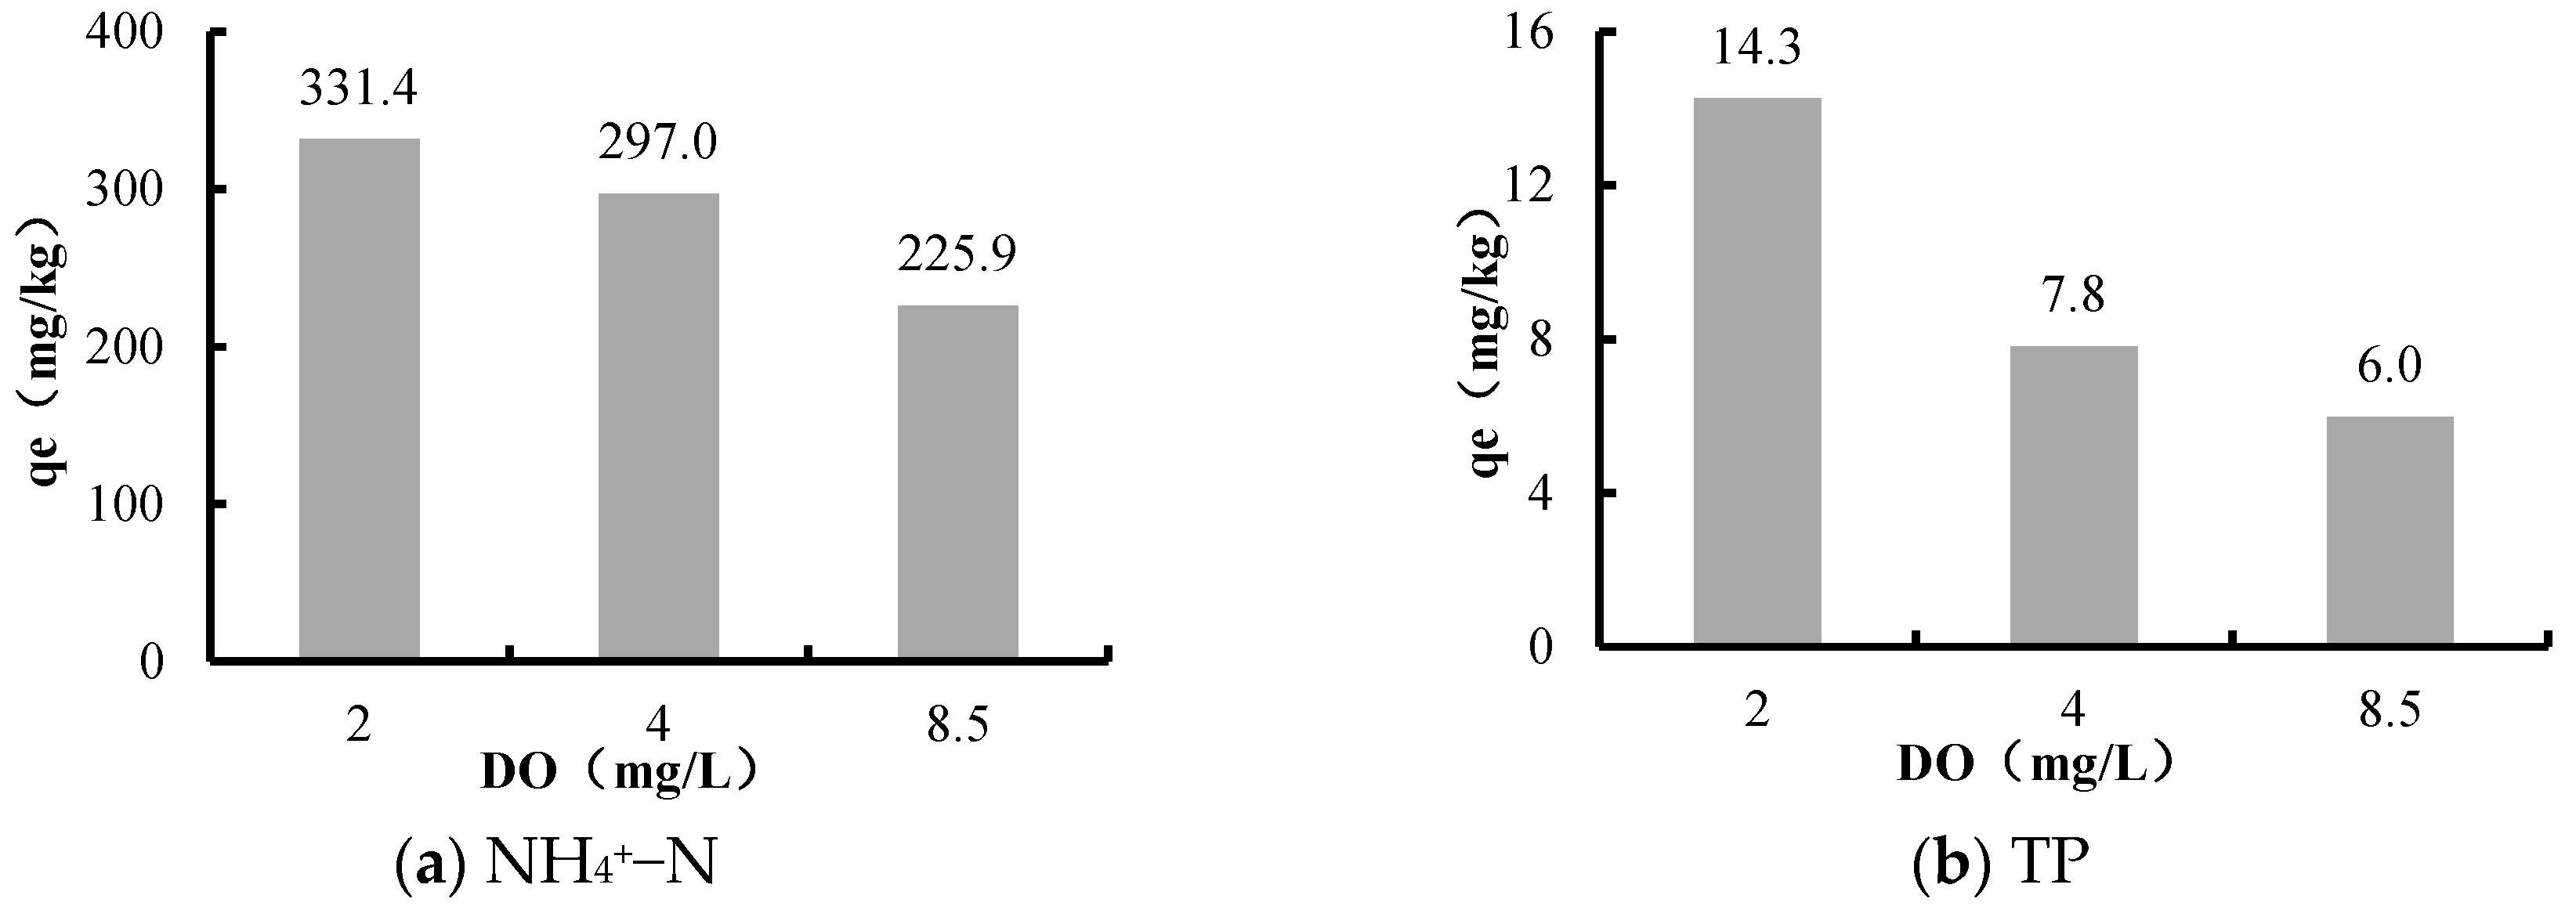
3.2.2. Dissolved Oxygen
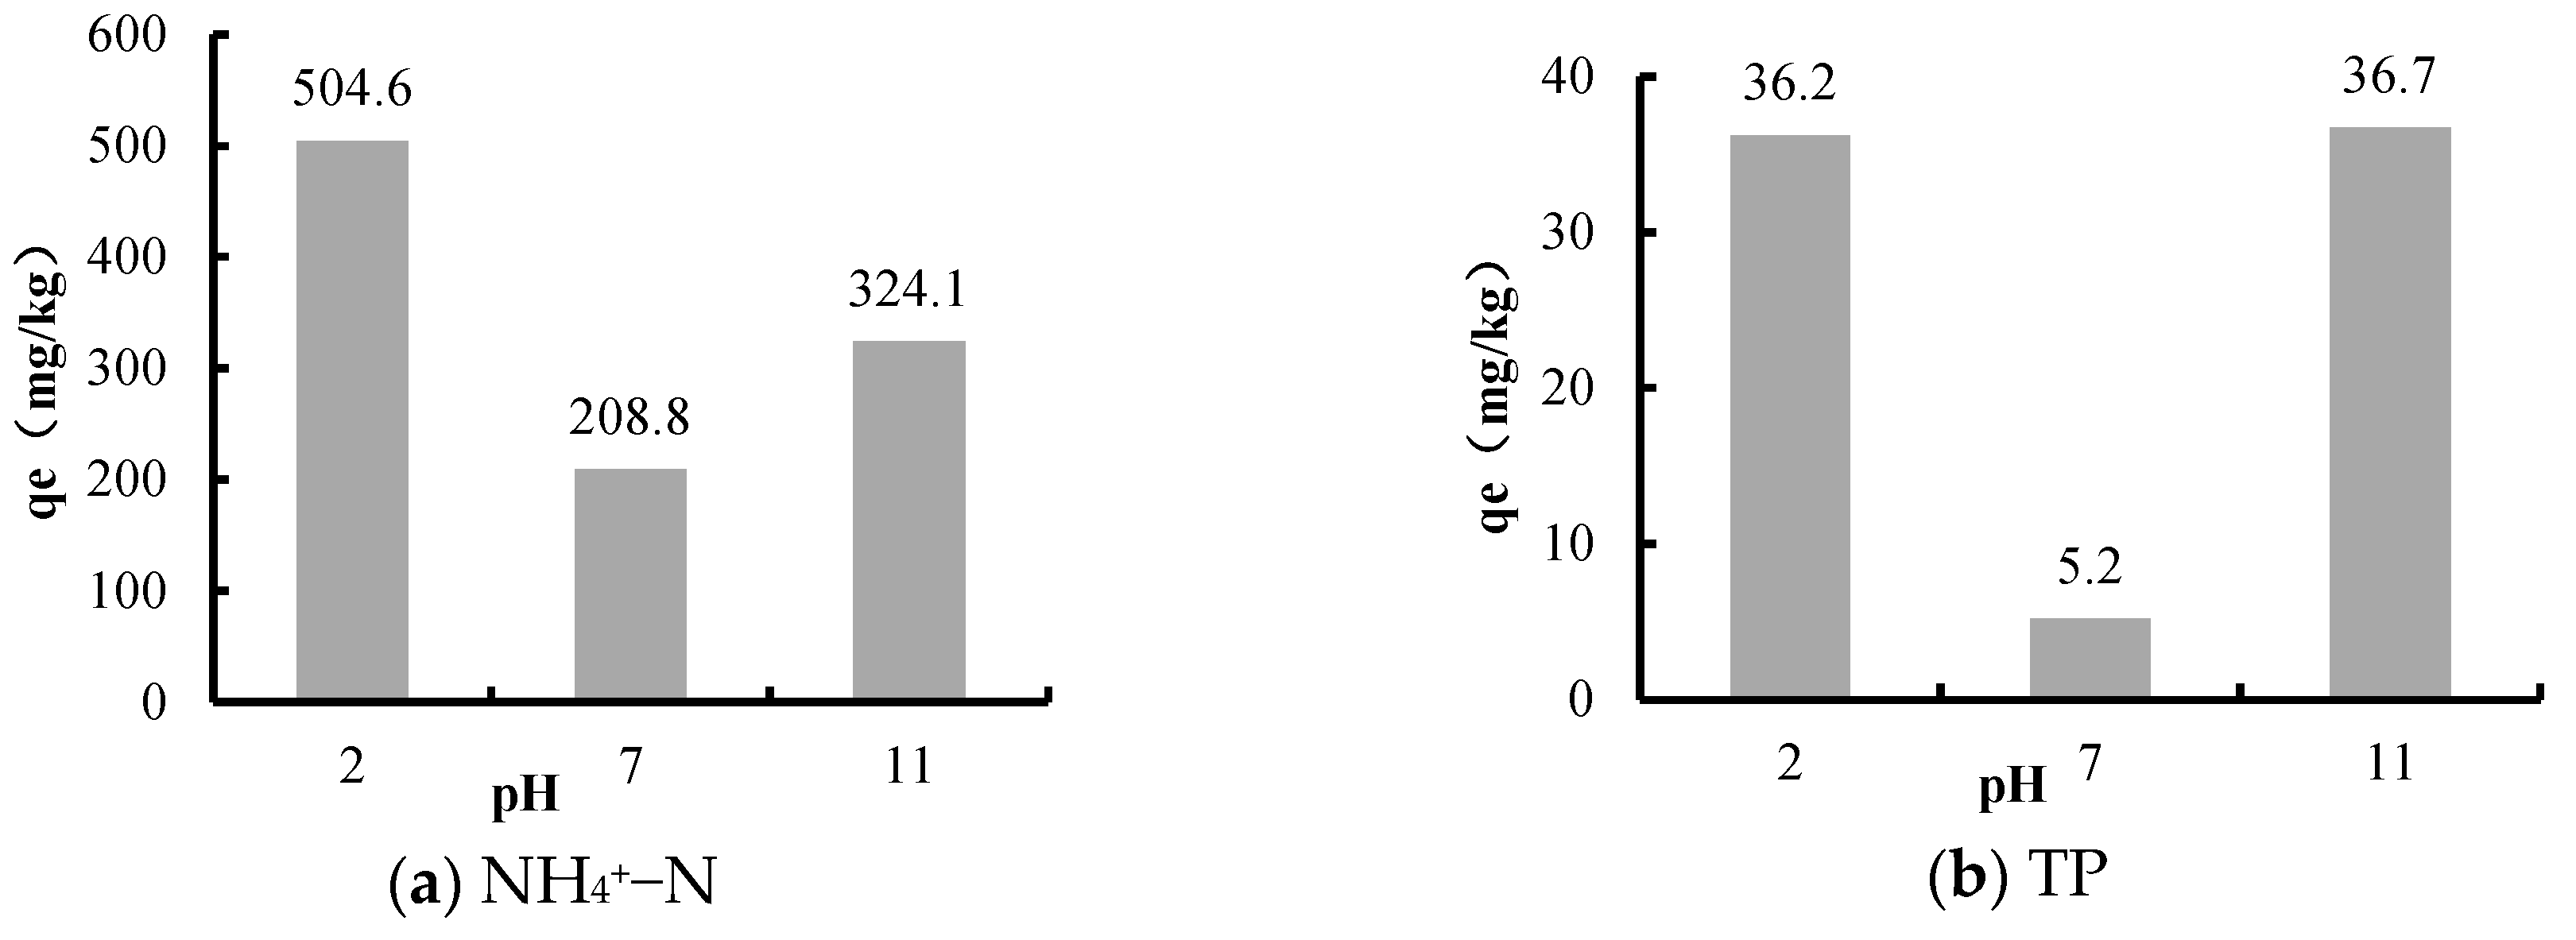
The release amounts of NH4+–N and TP under anaerobic environment (DO = 2 ± 0.5mg/L), low oxygen environment (DO = 4 ± 0.5mg/L), and natural environment conditions (DO = 8.5 ± 0.5mg/L) are shown in Figure 5.
The results showed that there was an inverse relation between the release amount and the DO. The release amounts of NH4+–N and TP during the anaerobic environment was 1.5 and 2.4 times greater than that in the natural state, indicating that low DO could dramatically promote the release of NH4+–N and TP in sediments.
Under low DO circumstances, the nitrification reaction in sediments was weakened, while the ammonization reaction was enhanced instead. This promoted the release of NH4+–N in sediments. Therefore, the release amount of NH4+–N in the low DO environment was higher than that in the aerobic environment.
In addition, the experiment system was in the oxidation environment because of sufficient DO. In the oxidation environment, metal ions, such as iron and manganese, were oxidized to their higher states (FeIII and MnIV). These metal minerals were combined with phosphorus to form compounds that were difficult to dissolve into water [20]. Thus, the release amount of TP from sediments was decreased. Conversely, the iron and manganese precipitates will dissolve and release PO43− under the hypoxic environment [49]. Therefore, the release intensity and speed of TP were higher under hypoxic environment than that in the aerobic environment.

3.2.3. pH

Through the sediments release experiments under different pH, the release amounts of NH4+–N and TP were obtained, and are shown in Figure 6.
pH plays a vital role in the release process of NH4+–N and TP. The experiment results showed that the release amounts of NH4+–N and TP were both in a “U” type relation with the pH of the overlying water. Specifically, both acidic and alkaline conditions could promote the release of NH4+–N and TP from sediments, while the release amount was the minimum under neutral condition.
Under acidic conditions, the increased H+ in the water interacted with the NH4+ adsorbed by the colloidal deposits, and more NH4+ were gradually released from sediments into the overlying water. In the alkaline environment, the increased OH- reacted chemically with NH4+ and produced NH3, thus more NH4+–N was rapidly released from sediments in the form of NH3. A previous study showed that 99% of all ammonium nitrogen was in the form of NH4+ when the pH of water body was 7.3, and more than 90% of the ammonium nitrogen existed in the form of NH3 when the water pH was 10.3 [50], so the release amount of NH4+–N was the minimum under neutral conditions. This was consistent with the NH4+–N release characteristics of the Wabu Lake sediments [51].
The effect of pH on the release of phosphorus from sediments was mainly the result of the fact that pH could affect the adsorption and ion exchange between phosphorus and sediments [52]. Under alkaline conditions, the P-binding capacity of Fe–P and Al–P was decreased, OH reacted with inorganic phosphorous such as Fe–P and Al–P to form HPO42-, which promoted the release of phosphorus from sediments [53,54]. Under acidic conditions, the clay minerals’ surface negative charge was reduced, and various compounds including Ca–P became more soluble [55]. This promoted the release of phosphorus from sediments, while phosphorus ions mainly existed in the form of phosphates under neutral conditions, and these phosphates were easily combined with metal cations to form precipitates. As a result, the TP release amount from sediments was the lowest under neutral conditions. This was similar to the TP release characteristics of sediments in Wabu Lake [51].

3.3. Seasonal Variations of Sediments Release Potential

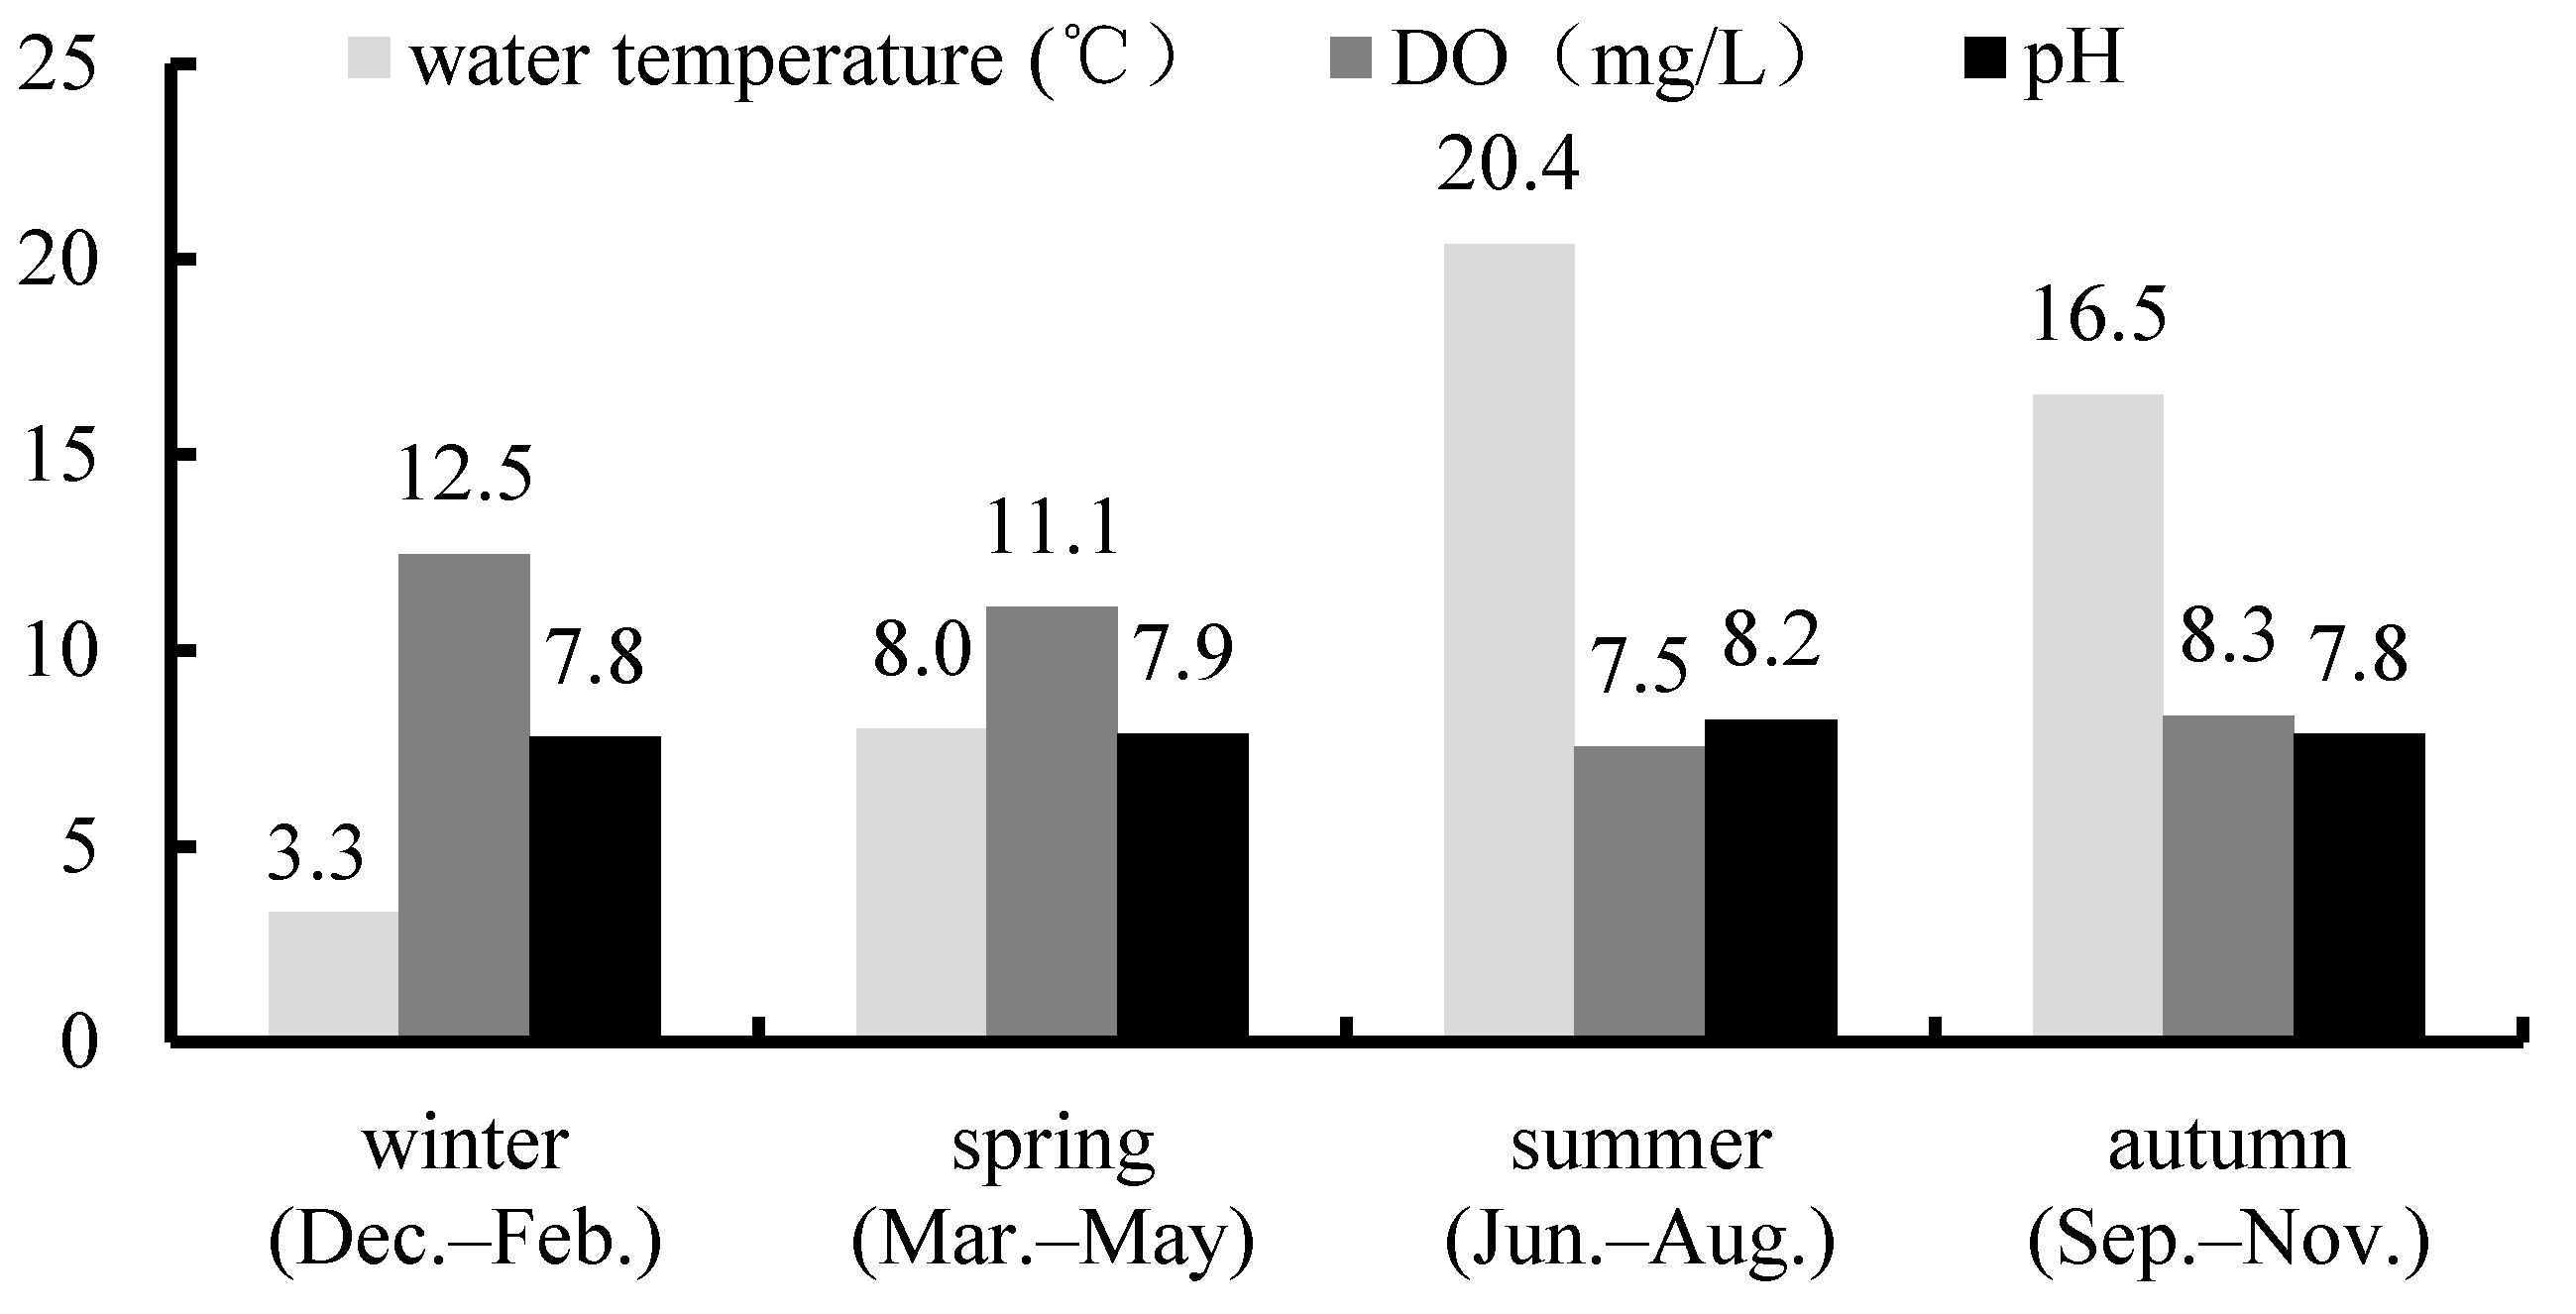
3.3.1. Seasonal Variations of Environmental Factors in Biliuhe Reservoir

The seasonal variation characteristics of TW, DO, and pH in Biliuhe reservoir are shown in Figure 7.
It can be seen from Figure 7 that TW, DO, and pH of the reservoir all had obvious seasonal variation characteristics.
TW is one of the important factors affecting the physical, chemical, and biological reactions in water and sediments. Biliuhe reservoir is located in the seasonal climate region of Northern China, so its TW has obvious seasonal variation with the seasonal change of air temperature. In winter (December–February), the TW of the reservoir is the lowest with the monthly average value of 3.3 °C. During this period, there will be a frozen period of two to three months per year. Afterwards, TW begins to rise in spring (March–May), and reaches the maximum of 20.4 ℃ throughout the year in summer (June–August). While in autumn (September–November), TW starts to decrease again.
Similar to TW, DO in Biliuhe reservoir also shows an obvious seasonal variation with the highest in winter and the lowest in summer. In winter, DO reaches the annual maximum value of 12.6 mg/L because of the low TW and the barrier of ice. As TW increases from spring, the consumption of DO also increases because of the accelerated physical and chemical reactions in water and sediments. So DO content of the reservoir gradually decreases after winter. Generally, DO drops to the lowest in summer and the value is about 7.5 mg/L, but DO could even fall to about 2 mg/L in the bottom layer owing to the existence of the thermocline. After summer, with the decrease of TW, the biological activity in water decreases. While the oxygen enrichment ability starts to increase, so the DO begins to increase slowly in the autumn.
pH is an important factor affecting various chemical reactions in water and sediments. The pH of the reservoir changes little throughout the year with the value between 7 and 9, but the pH is higher in summer. In summer, high TW promotes algae growth and photosynthesis. With more CO2 in the water being absorbed, pH consequently increases slightly. As it comes to winter, the low TW, the barrier of ice, and the coverage of snow together weaken the photosynthesis in the water, so the pH of the water in winter is lower than that in summer. Meanwhile, in spring and autumn, the photosynthesis in water is not significantly increased, so the pH of water is close to winter.
The environmental indicators change in circles and naturally form the specific seasonal variation characteristics of reservoirs in Northern China, that is, low TW, high DO, and low pH in winter; high TW, low DO, and high pH in summer; and transitional variation in spring and autumn [56,57].

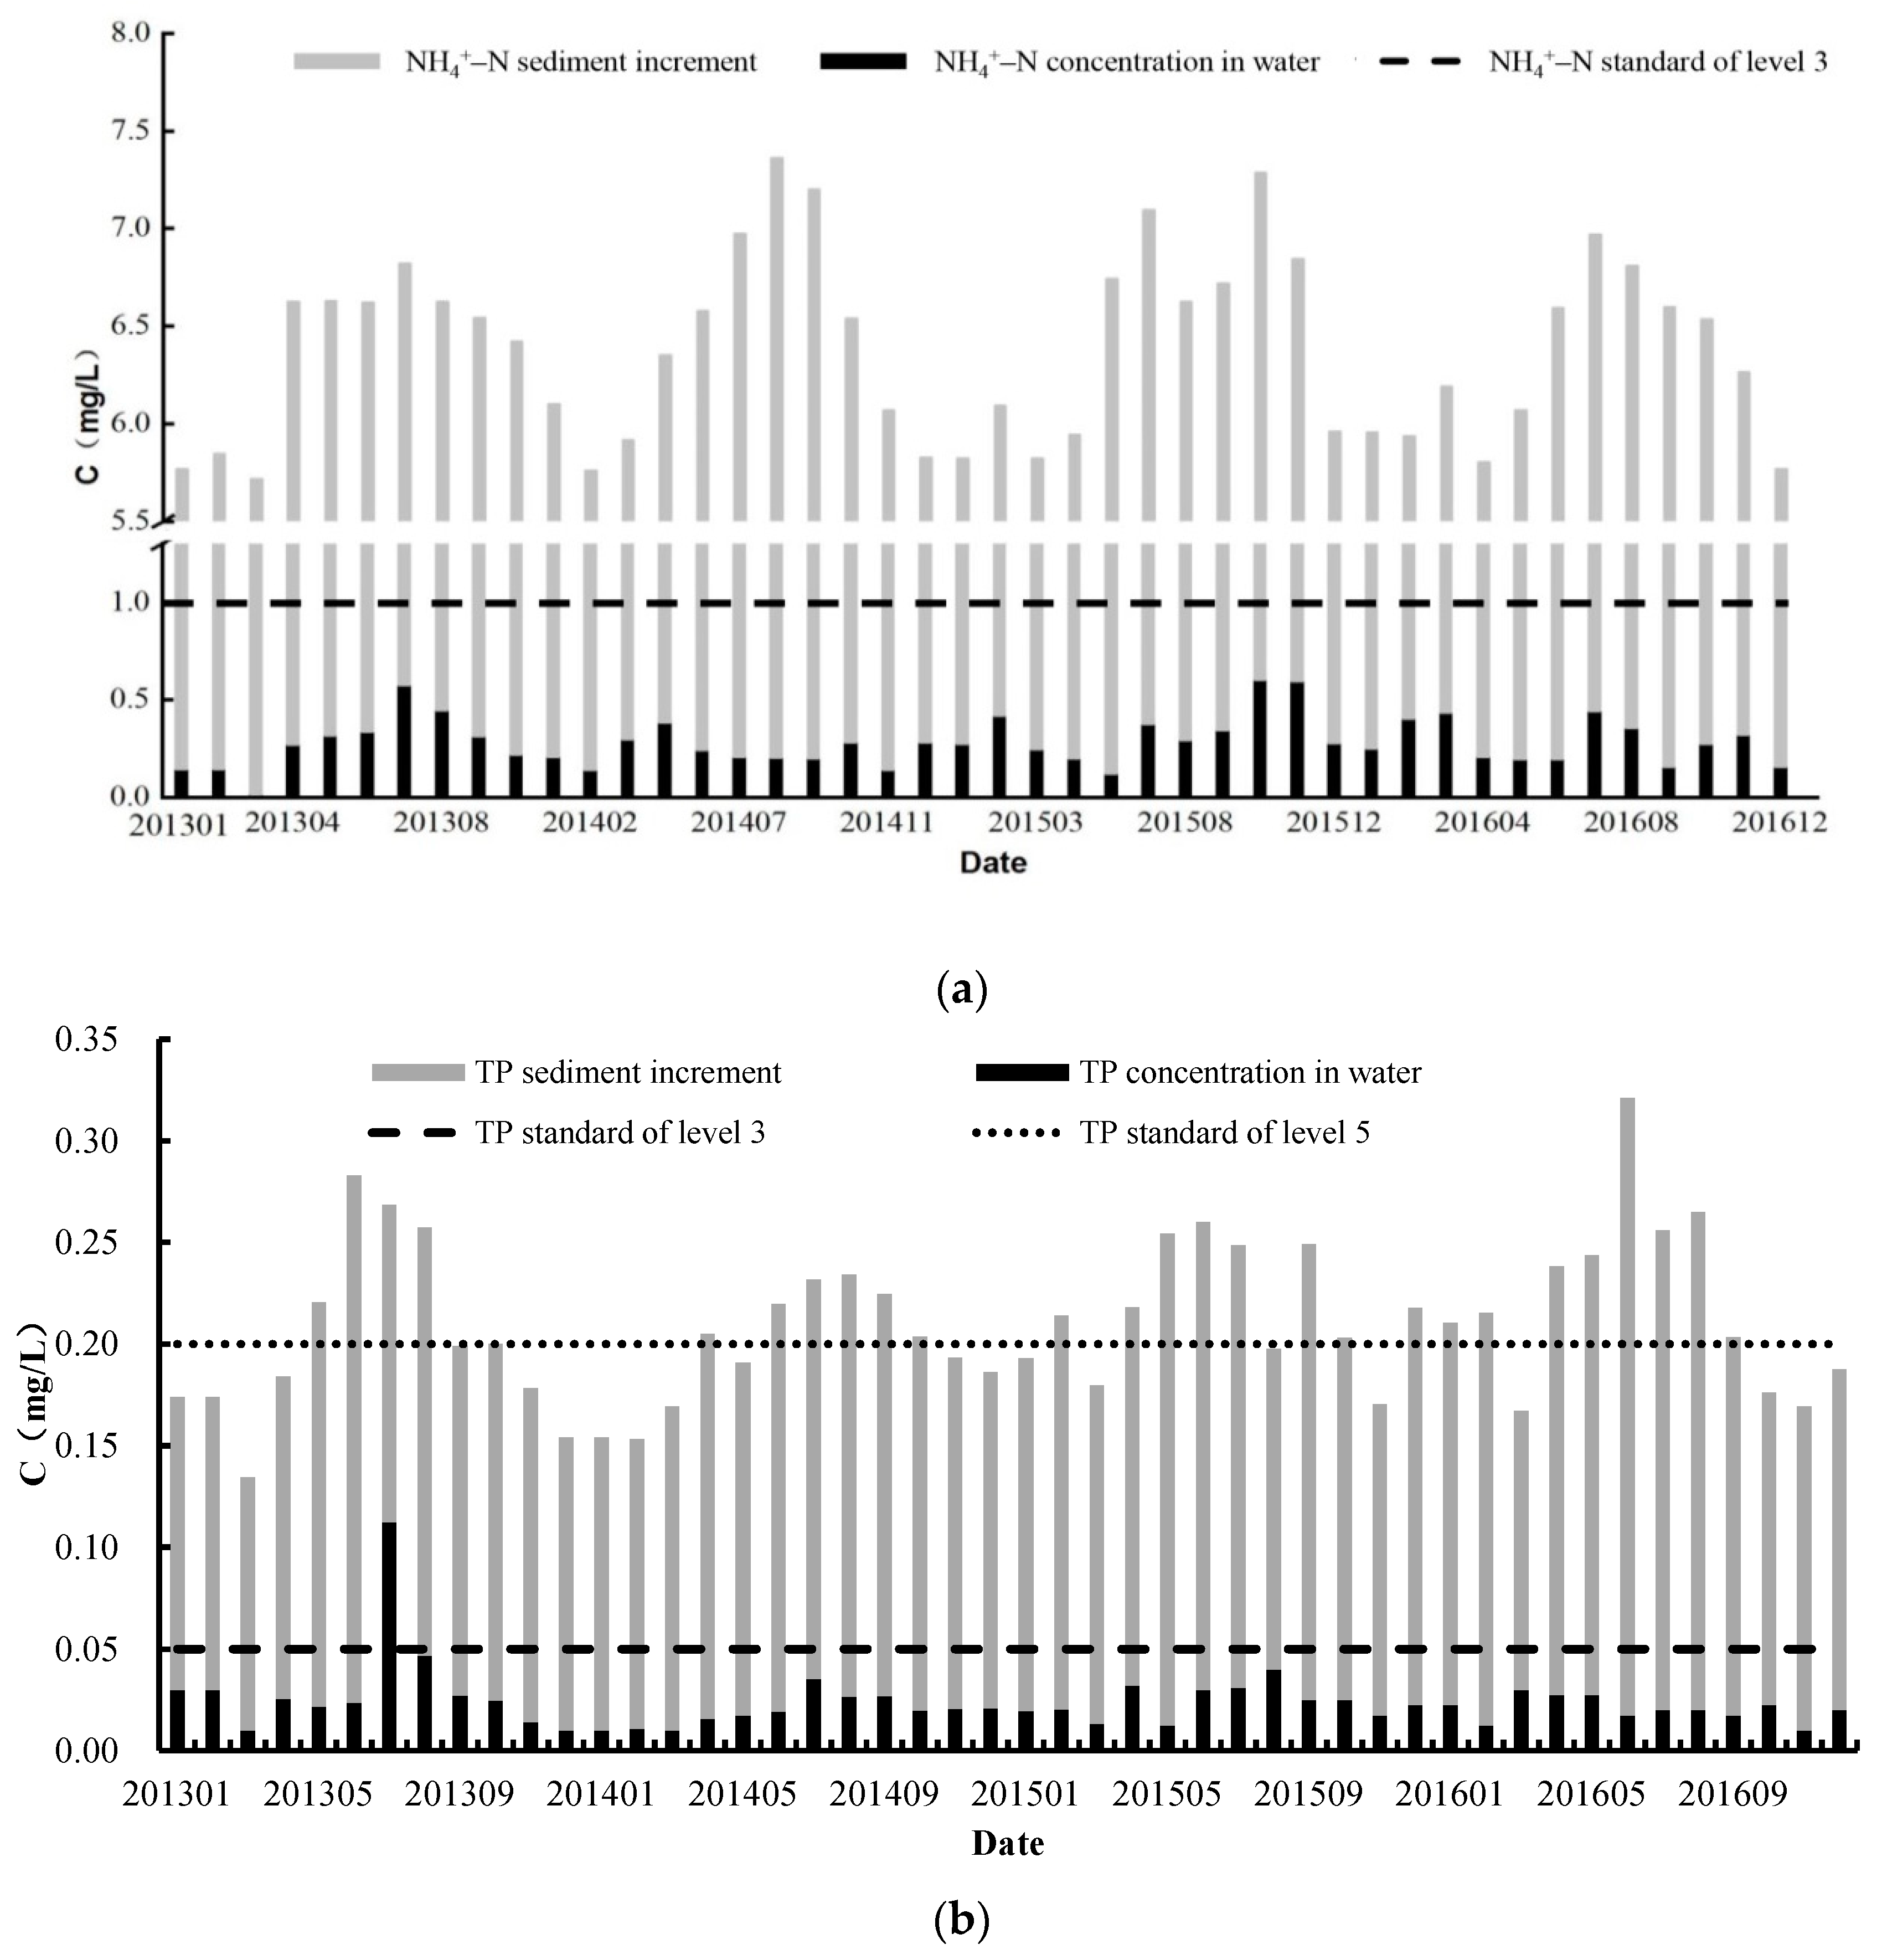
3.3.2. Sediments Release Potential in Different Seasons

According to the relation between the simulated release amount of sediments and environmental factors in Section 3.2, the release amounts of NH4+–N and TP in the sediments of Biliuhe reservoir under actual environmental conditions were calculated by the interpolation method. Specifically, for one sample, the maximum value of the respective release amounts under its TW, DO, and pH was taken for the sediments release potential.
The field investigation indicated that the average sedimentation depth of the Biliuhe reservoir was 40 cm, the average dry density of the sediments was 1.55 g/cm3, and the average moisture content was about 180%. Then, the sediments content per unit area was calculated as 34.4 g/cm2. According to the monitored water depth of the Biliuhe reservoir, the impact of sediments release potential on water, that is, the sediments increment, could be calculated by Equation (2).
The calculated sediments increment of NH4+–N and TP of Biliuhe reservoir from 2013 to 2016 was shown in Figure 8.
It can be seen from Figure 8 that the annual average NH4+–N and TP in the water of Biliuhe reservoir from 2013 to 2016 were 0.28 mg/L and 0.024 mg/L, respectively, of which the levels were both less than the third level of water quality standards (GB3838-2002).Unexpectedly, however, the TP was 0.113 mg/L in July 2013, which exceeded the fourth level (0.1 mg/L). When the release potential of sediments was considered, the average amount of NH4+–N in the reservoir reached 6.4 mg/L, which was 22 times the average concentration in the water and far exceeded the fifth level (2.0 mg/L) of the water quality standards. Meanwhile, the average value of TP changed from 0.024 mg/L to 0.21 mg/L, and increased by eight times the average in the water. By comparing with the water quality standards, the average TP of the reservoir also exceeded the fifth level (0.20 mg/L). This indicated that reservoir sediments had a strong potential to release NH4+–N and TP, which posed a great threat to the reservoir water quality.
At the same time, the concentrations of NH4+–N and TP were the highest in summer and the lowest in winter. Similarly, the sediments increment of NH4+–N and TP also showed seasonal variations, with the highest concentration during summer and the lowest during winter. This could be attributed to the seasonal variations of TW, DO, and pH of the reservoir. As described in Section 3.2, high TW, low DO, and an acid or alkaline condition all promoted the release of NH4+–N and TP from sediments. From winter to summer, TW and pH kept increasing, while DO kept decreasing all along. These factors together contributed to the highest release amount of NH4+–N and TP in summer. When it came to the end of summer, TW started to decline, while DO increased, which weakened the release capacity of NH4+–N and TP from sediments. Furthermore, the average pH of the reservoir in autumn, winter, and spring was 7.8, which was much closer to the neutral condition, so the effect of pH on the release of sediments was not obvious. Therefore, the sediments increment of NH4+–N and TP began to decrease gradually from autumn, and reached the lowest in winter.

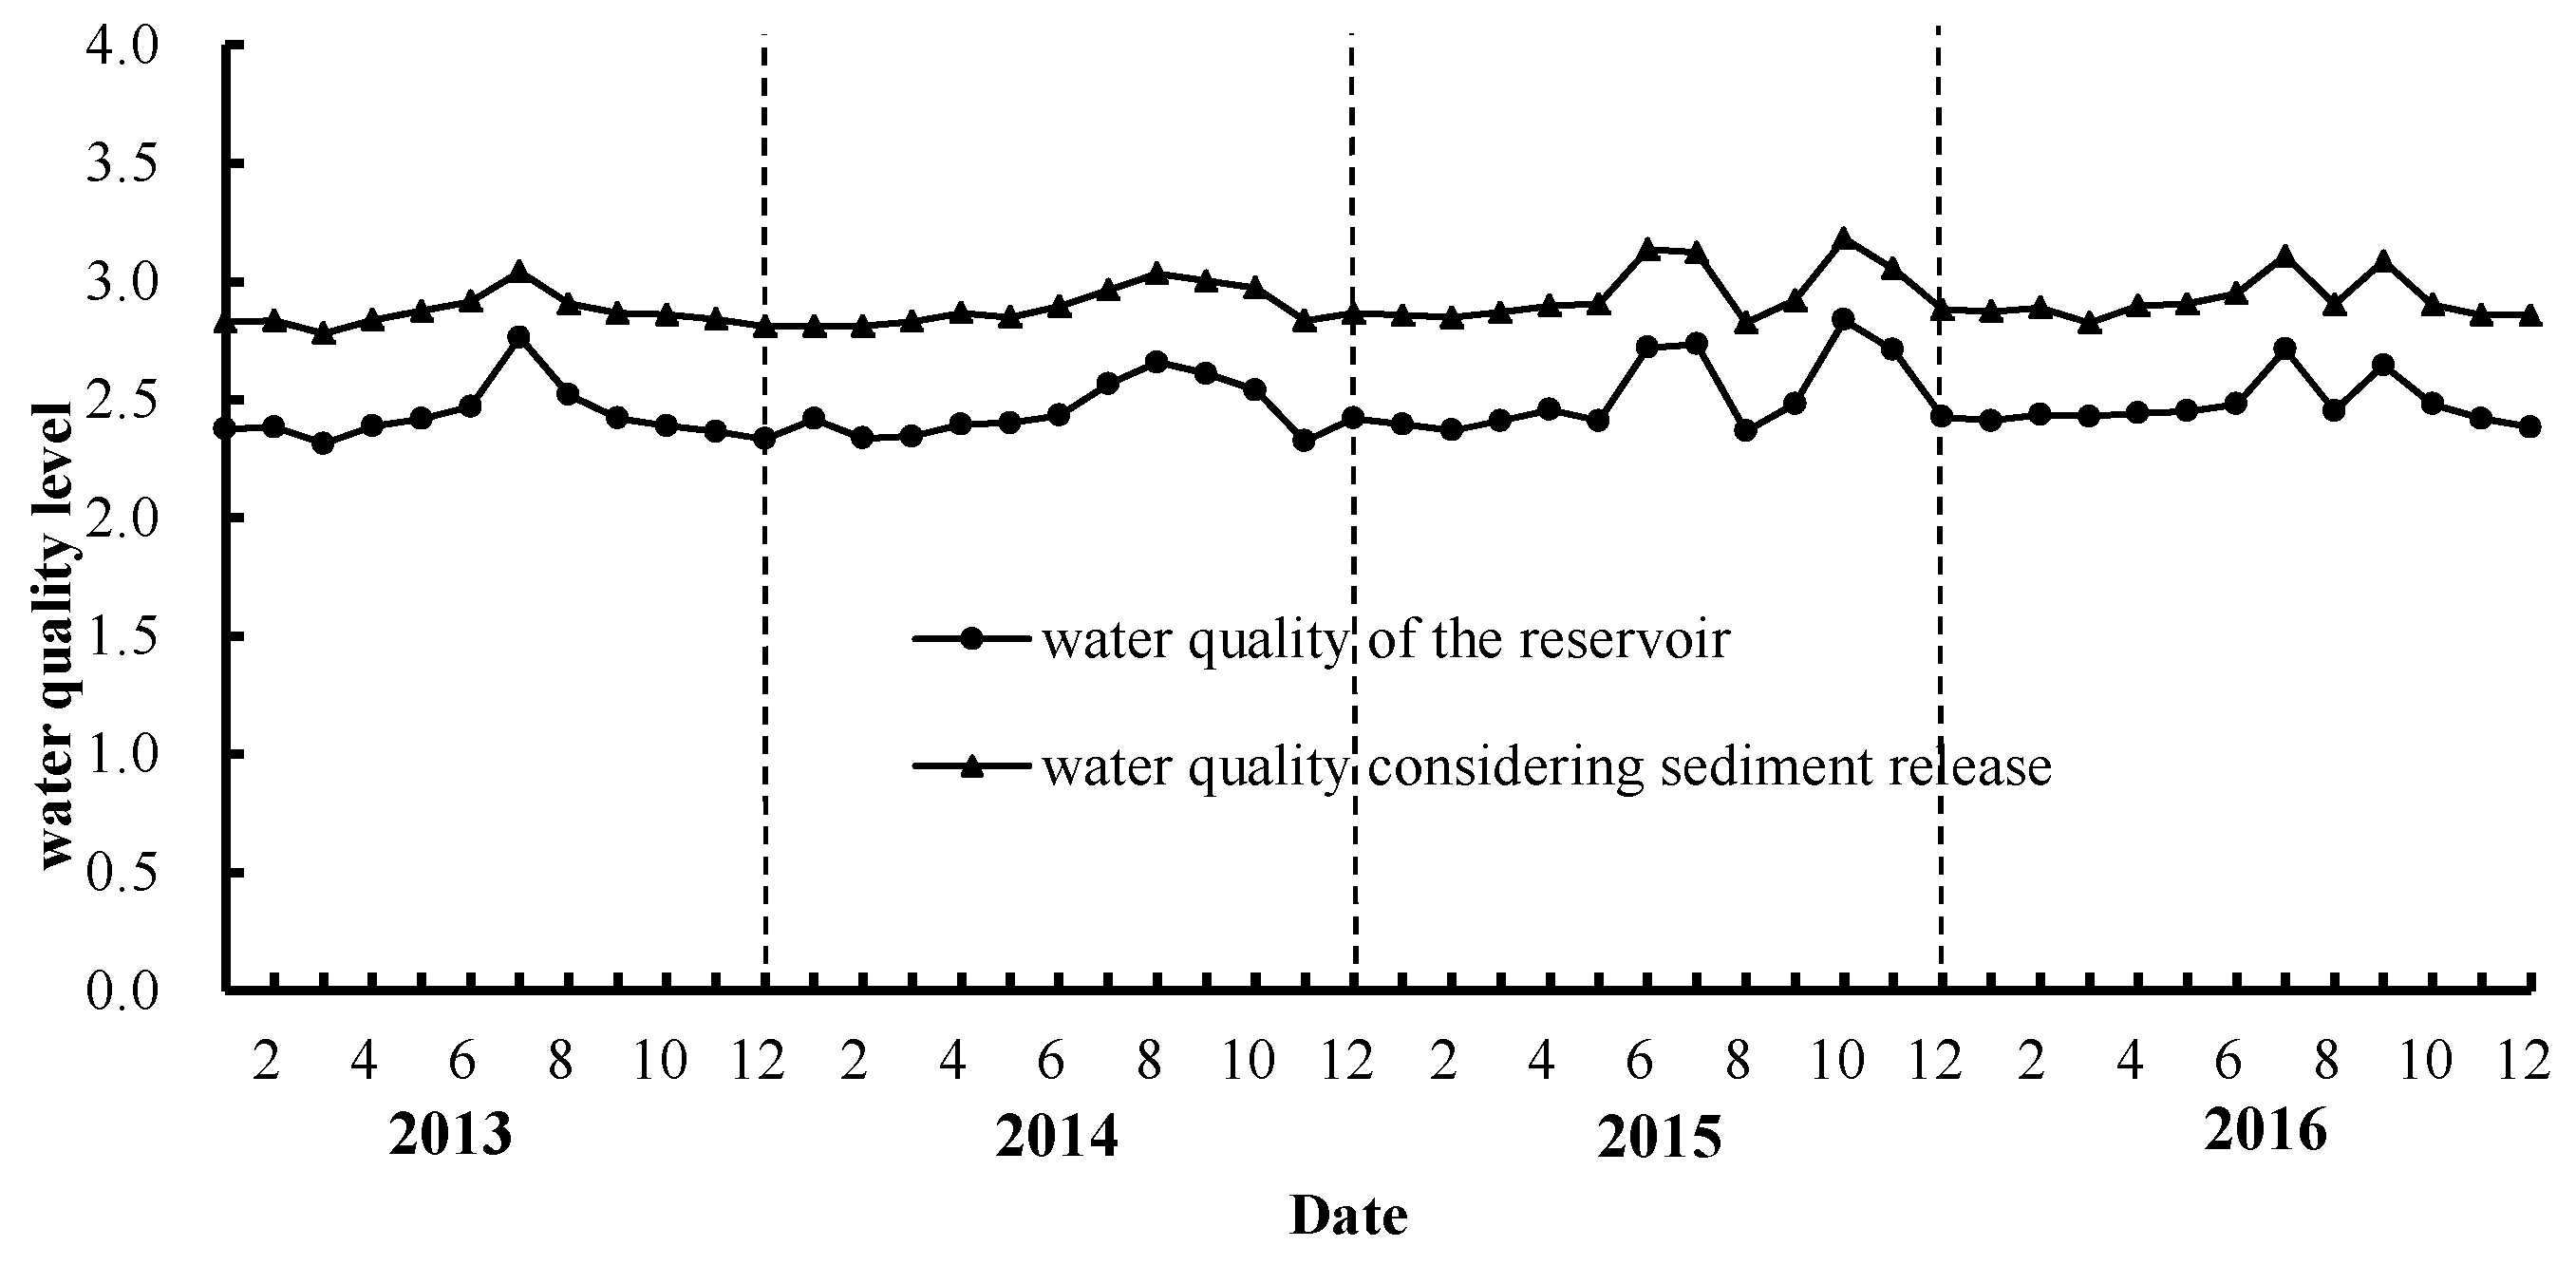
3.4. Seasonal Assessment of Water Quality Considering Sediments Release Potential

The assessment index system considering sediments release potential Xij was obtained using Equation (3), and the weight of each indicator was calculated by the PCA (Principal Component Analysis, PCA) method. Then, the VFPR model was used to assess the water quality of Biliuhe reservoir from 2013 to 2016. The assessment results are shown in Figure 9.
According to the assessment results, with no thought for sediments release potential, the water quality of Biliuhe reservoir was always between level 2 and level 3 of the National Surface Water Quality Standards of China (GB3838-2002) from 2013 to 2016. When sediments release potential was considered, the water quality showed a decreased tendency with the average value decreasing from 2.5 to 2.9. Among which all the samples in winter and spring were still within level 2 and level 3, but much closer to level 3. Meanwhile, about 42% of the samples in summer and 33% in autumn exceeded level 3.
As can be seen in Figure 9, the water quality of the reservoir was better in winter and spring, but degraded in summer and improved in autumn, which was consistent with previous research [26]. The rainfall of Biliuhe reservoir basin was mainly concentrated in summer and early autumn, so the external pollutants entering the reservoir with rainfall runoff in these two seasons also increased. The decline of water quality in summer and autumn regardless of sediments release potential also proved this hypothesis. The pollutants entering the reservoir were partially deposited at the bottom of the reservoir, increasing the content of pollutants in sediments. In addition, compared with the indicators in winter and spring, the TW in summer and autumn was higher, the DO was lower, and the pH was slightly increased to alkalinity. These factors all contributed to the release of NH4+–N and TP in the sediments. As a consequence, the water quality was a little worse in summer and early autumn. In winter, the small rainfall, coupled with the barrier of ice, made it difficult for external pollutants to enter the reservoir. Further, because of the purification effect of the reservoir itself, the water quality was the best throughout the year.

4. Conclusions

This paper took Biliuhe reservoir, a seasonal reservoir in Northern China, as an example to study the adsorption and release characteristics of the sediments under different environmental conditions, and explored the seasonal variation of water quality considering the release potential of sediments. The main conclusions are as follows.
(1) Sediments adsorption and release simulation experiments demonstrated that the average concentrations of NH4+–N and TP in Biliuhe reservoir were lower than the equilibrium concentrations (EC0). This indicated that the sediments of Biliuhe reservoir mainly played the “source” of NH4+–N and TP at present, and the sediments had a higher risk of sediments release with a change in environmental changes in the future.
(2) The release amount of NH4+–N and TP in the sediments showed a seasonal variation affected by the specific seasonal variation of environmental factors for reservoirs in Northern China. High temperature, low DO, and high pH in summer greatly promoted the release of sediments, which generated the higher release amount in summer than in other seasons. When the release potential of sediments was considered, the average concentration of NH4+–N increased from 0.28 mg/L to 6.4 mg/L, TP increased from 0.024 mg/L to 0.21 mg/L, and the contents both exceeded level 5 of water quality standards.
(3) The water quality assessment results were degraded when the release potential of sediments was considered, with the average value of 2.5 to 2.9. The degradation was the largest in winter, while it was the smallest in summer. In addition, about 42% and 33% of the samples in summer and autumn exceeded level 3 of water quality standards when considering the release of sediments, indicating that the water in summer and autumn would face greater water quality risks. Therefore, assessment of water quality considering the sediments adsorption and release characteristics is much closer to the reality, especially in summer and winter, which can provide practical guidance for the security of water supply for the reservoir.

Author Contributions

Conceptualization, S.H., T.W., and S.X.; Data curation, S.H. and L.M.; Formal analysis, S.H., L.M., and X.S.; Funding acquisition, T.W. and S.X.; Investigation, S.H., T.W., S.X., L.M., and X.S.; Writing—original draft, S.H.; Writing—review & editing, T.W. and S.X.

Funding

This study is supported by the National Natural Science Foundation of China (Grant NO. 51809032, NO. 51879031, NO. 51679026), the Natural Science Foundation of the Jiangsu Higher Education Institutions of China (Grant No. 18KJD560001) and the National Key Research and Development Program of China (Grant NO. 2016YFC0400903).

Acknowledgments

The authors thank the anonymous reviewers. Our grateful thanks are also extended to the Biliuhe reservoir management bureau, who helped us collect samples and provided the water quality dataset.

Conflicts of Interest

The authors declare no conflicts of interest.

References

  1. Ni, Z.; Wang, S. Historical accumulation and environmental risk of nitrogen and phosphorus in sediments of Erhai Lake, Southwest China. Ecol. Eng. 2015, 79, 42–53. [Google Scholar] [CrossRef]
  2. Yu, Q.; Wang, F.; Yan, W.; Zhang, F.; Lv, S.; Li, Y. Carbon and Nitrogen Burial and Response to Climate Change and Anthropogenic Disturbance in Chaohu Lake, China. Int. J. Environ. Res. Public Health 2018, 15, 2734. [Google Scholar] [CrossRef] [PubMed]
  3. Portielje, R.; Lijklema, L. Estimation of sediment–water exchange of solutes in Lake Veluwe, The Netherlands. Water Res. 1999, 33, 279–285. [Google Scholar] [CrossRef]
  4. He, J.; Deng, W.; Chen, C.; Xu, X.; Wang, S.; Liu, W.; Wu, X. Ammonia nitrogen adsorption and release characteristics of surface sediments in Dianchi Lake, China. Environ. Earth Sci. 2015, 74, 3917–3927. [Google Scholar] [CrossRef]
  5. Hoch, M. Organotin compounds in the environment: An overview. Appl. Geochem. 2001, 16, 719–743. [Google Scholar] [CrossRef]
  6. Ahlgren, J.; Reitzel, K.; De Brabandere, H.; Gogoll, A.; Rydin, E. Release of organic P forms from lake sediments. Water Res. 2011, 45, 565–572. [Google Scholar] [CrossRef] [PubMed]
  7. Han, W.M. Phosphorus release from the sediments of West Lake in Hangzhou and its effects on lake eutrophication. J. Lake Sci. 1993, 5, 71–77, (In Chinese with English abstract). [Google Scholar]
  8. Rydin, E.; Brunberg, A.K. Seasonal dynamics of phosphorous in Lake Erken surface sediments. Arch. Hydrobiol. L: Spec. Issues Adv. Limno. 1998, 51, 157–167. [Google Scholar]
  9. James, R.T.; Martin, J.; Wool, T.; Wang, P.F. A Sediment Resuspension and Water Quality Model of Lake Okeechobee 1. J. Am. Water Resour. Assoc. 1997, 33, 661–678. [Google Scholar] [CrossRef]
  10. Cheng, X.; Zeng, Y.; Guo, Z.; Zhu, L. Diffusion of nitrogen and phosphorus across the sediment-water interface and in seawater at aquaculture areas of Daya Bay, China. Int. J. Environ. Res. Public Health 2014, 11, 1557–1572. [Google Scholar] [CrossRef]
  11. Abrams, M.M.; Jarrell, W.M. Soil phosphorus as a potential nonpoint source for elevated stream phosphorus levels. J. Environ. Qual. 1995, 24, 132–138. [Google Scholar] [CrossRef]
  12. Pan, X.; Lin, L.; Huang, Z.; Liu, M.; Dong, L.; Chen, J.; Crittenden, J. Distribution characteristics and pollution risk evaluation of the nitrogen and phosphorus species in the sediments of Lake Erhai, Southwest China. Environ. Sci. Pollut. Res. 2019, 26, 22295–22304. [Google Scholar] [CrossRef] [PubMed]
  13. Gao, X.; Chen, C.T.A. Heavy metal pollution status in surface sediments of the coastal Bohai Bay. Water Res. 2012, 46, 1901–1911. [Google Scholar] [CrossRef] [PubMed]
  14. Hu, K.; Pang, Y.; Wang, H.; Wang, X.; Wu, X.; Bao, K.; Liu, Q. Simulation study on water quality based on sediment release flume experiment in Lake Taihu, China. Ecol. Eng. 2010, 37, 607–615. [Google Scholar] [CrossRef]
  15. Wang, F.E.; Yang, J.; Li, Y.N.; Yang, X.Q.; Zhong, X.H.; Bian, J.Y. Modification of WASP model based on release of sediment phosphorus. Acta Scientiae Circumstantiae 2013, 33, 3301–3308, (In Chinese with English abstract). [Google Scholar]
  16. Wang, T.; Xu, S.; Liu, J. Dynamic Assessment of Comprehensive Water Quality Considering the Release of Sediment Pollution. Water 2017, 9, 275. [Google Scholar] [CrossRef]
  17. Wang, S.; Jin, X.; Bu, Q.; Zhou, X.; Wu, F. Effects of particle size, organic matter and ionic strength on the phosphate sorption in different trophic lake sediments. J. Hazard. Mater. 2006, 128, 95–105. [Google Scholar] [CrossRef]
  18. Kim, L.H.; Choi, E.; Stenstrom, M.K. Sediment characteristics, phosphorus types and phosphorus release rates between river and lake sediments. Chemosphere 2003, 50, 53–61. [Google Scholar] [CrossRef]
  19. Dursun, A.Y.; Kalayci, C.S. Equilibrium, kinetic and thermodynamic studies on the adsorption of phenol onto chitin. J. Hazard. Mater. 2005, 123, 151–157. [Google Scholar] [CrossRef]
  20. Kang, M.; Peng, S.; Tian, Y.; Zhang, H. Effects of dissolved oxygen and nutrient loading on phosphorus fluxes at the sediment–water interface in the Hai River Estuary, China. Mar. Pollut. Bull. 2018, 130, 132–139. [Google Scholar] [CrossRef]
  21. Tao, Y.; Geng, J.; Wang, R.; Chen, Z.; Pan, C.; Yu, R.; Ren, H. Effect of environmental variations on release of three nitrogen in sediments from river. Environ. Sci. 2013, 36, 41–44, (In Chinese with English abstract). [Google Scholar]
  22. Jin, X.C.; Jia, X. Effects of light and oxygen on the uptake and distribution of phosphorus at the sediment-water interface. Environ. Sci. Technol. 2006, 357, 231–236. [Google Scholar] [CrossRef] [PubMed]
  23. Kong, M.; Chao, J.; Zhuang, W.; Wang, P.; Wang, C.; Hou, J.; Wu, Z.; Wang, L.; Gao, G.; Wang, Y. Spatial and temporal distribution of particulate phosphorus and their correlation with environmental factors in a shallow eutrophic Chinese lake (Lake Taihu). Int. J. Environ. Res. Public Health 2018, 15, 2355. [Google Scholar] [CrossRef] [PubMed]
  24. Jiang, B. Water quality protection strategy of Tanghe Reservoir in Liaoning Province. Heilongjiang Water Res. 2016, 2, 65–67, (In Chinese with English abstract). [Google Scholar]
  25. Yin, H.; Chang, J.; Zhang, G.; Sun, X. The reason and control measures of Xinlicheng reservoir eutrophication. J. Northeast Norm. Univ. (Nat. Sci. Ed.) 2010, 42, 152–156, (In Chinese with English abstract). [Google Scholar]
  26. Xu, S.; Wang, T.; Hu, S. Dynamic Assessment of Water Quality Based on a Variable Fuzzy Pattern Recognition Model. Int. J. Environ. Res. Public Health 2015, 12, 2230–2248. [Google Scholar] [CrossRef] [PubMed] [Green Version]
  27. Wang, T.; Xu, S.; Liu, J. Analysis of accumulation formation of sediment contamination in reservoirs after decades of running: A case study of nitrogen accumulation in Biliuhe Reservoir. Environ. Sci. Pollut. Res. 2018, 25, 9165–9175. [Google Scholar] [CrossRef]
  28. Wang, T.; Liu, J.; Xu, S.; Qin, G.; Sun, Y.; Wang, F. Spatial distribution, adsorption/release characteristics, and environment influence of phosphorus on sediment in reservoir. Water 2017, 9, 724. [Google Scholar] [CrossRef]
  29. Shidan, B. Soil Agrochemical Analysis, 3rd ed.; China Agricultural Press: Beijing, China, 2002; pp. 21–22, (In Chinese with English abstract). [Google Scholar]
  30. Zhu, Y.; Jin, X.; Tang, W.; Meng, X.; Shan, B. Comprehensive analysis of nitrogen distributions and ammonia nitrogen release fluxes in the sediments of Baiyangdian Lake, China. J. Environ. Sci. 2019, 76, 319–328. [Google Scholar] [CrossRef]
  31. Hu, W.F.; Lo, W.; Chua, H.; Sin, S.N.; Yu, P.H.F. Nutrient release and sediment oxygen demand in a eutrophic land-locked embayment in Hong Kong. Environ. Int. 2001, 26, 369–375. [Google Scholar] [CrossRef]
  32. Jalali, M.; Peikam, E.N. Phosphorus sorption–desorption behaviour of river bed sediments in the Abshineh river, Hamedan, Iran, related to their composition. Environ. Monit. Assess. 2013, 185, 537–552. [Google Scholar] [CrossRef] [PubMed]
  33. State Environmental Protection Administration (SEPA). Standard Methods for the Examination of Water and Wastewater, 4th ed.; China Environmental Science Publish Press: Beijing, China, 2002; pp. 243–284, (In Chinese with English abstract).
  34. Zhang, B.; Fang, F.; Guo, J.; Chen, Y.; Li, Z.; Guo, S. Phosphorus fractions and phosphate sorption-release characteristics relevant to the soil composition of water-level-fluctuating zone of Three Gorges Reservoir. Ecol. Eng. 2012, 40, 153–159. [Google Scholar] [CrossRef]
  35. Zhu, G.; Yang, Y. Variation laws and release characteristics of phosphorus on surface sediment of Dongting Lake. Environ. Sci. Pollut. Res. 2018, 25, 12342–12351. [Google Scholar] [CrossRef] [PubMed]
  36. Deng, W.; Xu, X.; Chen, C.; He, J.; Xu, D.; Wang, L. Sorption and desorption characteristics of ammonium in the surface sediments of Lake Dianchi. J. Lake Sci. 2016, 28, 75–85, (In Chinese with English abstract). [Google Scholar]
  37. Chen, S.; Guo, Y. Variable fuzzy sets and its application in comprehensive risk evaluation for flood control engineering system. Fuzzy Optim. Decis. Mak. 2006, 5, 153–162. [Google Scholar]
  38. Sun, C.; Sun, L.; Sun, X. Graphical Evaluation of the Favorability of Adsorption Processes by Using Conditional Langmuir Constant. Ind. Eng. Chem. Res. 2013, 52, 14251–14260. [Google Scholar] [CrossRef]
  39. Pan, G.; Krom, M.D.; Herut, B. Adsorption−Desorption of Phosphate on Airborne Dust and Riverborne Particulates in East. Mediterr. Seawater Environ. Sci. Technol. 2002, 36, 3519–3524. [Google Scholar] [CrossRef] [PubMed]
  40. Langmuir, I. The adsorption of gases on plane surfaces of glass, mica and platinum. J. Am. Chem. Soc. 1918, 40, 1361–1403. [Google Scholar] [CrossRef]
  41. Freundlich, H. Over the adsorption in solution. J. Phys. Chem. 1906, 57, 470. [Google Scholar]
  42. Wang, S.; Jin, X.; Zhao, H.; Zhou, X.; Wu, F. Effect of organic matter on the sorption of dissolved organic and inorganic phosphorus in lake sediments. Colloids Surf. A: Physicochem. Eng. Asp. 2007, 297, 154–162. [Google Scholar] [CrossRef]
  43. Pant, H.K.; Reddy, K.R. Phosphorus sorption characteristics of estuarine sediments under different redox conditions. J. Environ. Qual. 2001, 30, 1474–1480. [Google Scholar] [CrossRef] [PubMed]
  44. Liu, J.; Wang, J.; Xu, W. Effects of environmental factors on NH4+ release from Chaohu Lake sediments. Anhui Agric. Sci. 2008, 36, 12870–12872, (In Chinese with English abstract). [Google Scholar]
  45. Cao, X.; Liu, X.; Zhu, J.; Wang, L.; Liu, S.; Yang, G. Characterization of phosphorus sorption on the sediments of Yangtze River estuary and its adjacent areas. Mar. Pollut. Bull. 2017, 114, 277–284. [Google Scholar] [CrossRef] [PubMed]
  46. Wang, Y.; Li, K.; Liang, R.; Han, S.; Li, Y. Distribution and Release Characteristics of Phosphorus in a Reservoir in Southwest China. Int. J. Environ. Res. Public Health 2019, 16, 303. [Google Scholar] [CrossRef] [PubMed]
  47. Uhlmann, D.; Bauer, H.D. A remark on microorganisms in lake sediments with emphasis on polyphosphate-accumulating bacteria. Internationale Revue der gesamten Hydrobiologie und Hydrographie 1988, 73, 703–708. [Google Scholar] [CrossRef]
  48. Papaspyrou, S.; Kristensen, E.; Christensen, B. Arenicola marina (Polychaeta) and organic matter mineralisation in sandy marine sediments: In situ and microcosm comparison. Estuar. Coast. Shelf Sci. 2007, 72, 213–222. [Google Scholar] [CrossRef]
  49. Zoumis, T.; Schmidt, A.; Grigorova, L.; Calmano, W. Contaminants in sediments: Remobilisation and demobilisation. Sci. Total Environ. 2001, 266, 195–202. [Google Scholar] [CrossRef]
  50. Sun, Y. Study on Adsorption and Release of Nutrient Salts in Lake Sediment. Master’s Thesis, Hefei University of Technology, Hefei, China, 2000. (In Chinese with English abstract). [Google Scholar]
  51. Ye, L.; Pan, C.; Zhang, Z.; Zheng, Z.; Liu, J.; Wang, J. Characteristics of N forms in Wabu Lake sediments and effects of environmental factors on NH4+-N Release. J. Agric. Environ. Sci. 2006, 25, 1333–1336, (In Chinese with English abstract). [Google Scholar]
  52. Christophoridis, C.; Fytianos, K. Conditions affecting the release of phosphorus from surface lake sediments. J. Environ. Qual. 2006, 35, 1181–1192. [Google Scholar] [CrossRef]
  53. Andersen, J.M. Influence of pH on release of phosphorus from lake sediments. Arch. Hydrobiol. 1975, 76, 411–419. [Google Scholar]
  54. Boers, P.C.M. The influence of pH on phosphate release from lake sediments. Water Res. 1991, 25, 309–311. [Google Scholar] [CrossRef]
  55. Du, G.L.; Rinklebe, J.; Vandecasteele, B.; Meers, E.; Tack, F.M. Trace metal behaviour in estuarine and riverine floodplain soils and sediments:A review. Sci. Total Environ. 2009, 407, 3972–3985. [Google Scholar]
  56. Jiang, X.; Zhu, L.; Xu, S.; Xie, Z. Effects of seasonal stratification and suspended sediment behaviors on the mobilization of manganese and iron in a drinking water reservoir—A case of Biliuhe Reservoir, Liaoning Province. J. Lake Sci. 2019, 31, 375–385, (In Chinese with English abstract). [Google Scholar]
  57. Bi, W.; Weng, B.; Yuan, Z.; Ye, M.; Zhang, C.; Zhao, Y.; Yan, D.; Xu, T. Evolution Characteristics of Surface Water Quality Due to Climate Change and LUCC under Scenario Simulations: A Case Study in the Luanhe River Basin. Int. J. Environ. Res. Public Health 2018, 15, 1724. [Google Scholar] [CrossRef] [PubMed]
Figure 1. Location of the study area and sampling points.
Ijerph 16 03303 g001
Figure 2. Characteristics of NH4+–N adsorption and release in sediments of Biliuhe reservoir: (a) NH4+–N adsorption characteristic; (b) NH4+–N release characteristic.
Ijerph 16 03303 g002
Figure 3. Characteristics of total phosphorus (TP) adsorption and release in sediments of Biliuhe reservoir: (a) TP adsorption characteristic; (b) TP release characteristic.
Ijerph 16 03303 g003
Figure 4. The relation between TW and the release amounts of NH4+–N and TP in Biliuhe reservoir.
Ijerph 16 03303 g004
Figure 5. The relation between dissolved oxygen (DO) and the release amounts of NH4+–N and TP in Biliuhe reservoir.
Ijerph 16 03303 g005
Figure 6. The relation between pH and the release amounts of NH4+–N and TP in Biliuhe reservoir.
Ijerph 16 03303 g006
Figure 7. The seasonal variations of influenced factors in Biliuhe reservoir.
Ijerph 16 03303 g007
Figure 8. The sediments increment of NH4+–N and TP of Biliuhe reservoir from 2013 to 2016: (a) the sediments increment of NH4+–N; (b) the sediments increment of TP.
Ijerph 16 03303 g008
Figure 9. Water quality assessment results considering the release potential of sediments from 2013 to 2016 in Biliuhe reservoir.
Ijerph 16 03303 g009
Table 1. Parameters of the fitting equations about NH4+–N adsorption and release characteristics in sediments of Biliuhe reservoir. EC, equilibrium concentration.
IndicatorEC0
(mg/L)
LangmuirFreundlich
EquationR2Qmax
(mg/kg)
KL
(L/mg)
EquationR21/nK
(L/mg)
NH4+–N8.291/q = 0.0766/C+0.00110.9735909.10.014Ln(q) = 0.7408ln(C)+3.04030.98460.740820.9115
Table 2. Parameters of the fitting equations about total phosphorus (TP) adsorption and release characteristics in sediments of Biliuhe reservoir.
IndicatorEC0
(mg/L)
LangmuirFreundlich
EquationR2Qmax
(mg/kg)
KL
(L/mg)
EquationR21/nK
(L/mg)
TP0.0251/q = 0.0077/C+0.00320.9899312.50.415584Ln(q) = 0.4489ln(C)+4.34390.91170.448977.0073

