Residential Wood Combustion in Finland: PM2.5 Emissions and Health Impacts with and without Abatement Measures

 ,
, 
Abstract
:1. Introduction
2. Materials and Methods
2.1. PM2.5 Emissions
2.2. Studied Scenarios and Abatement Measures
2.3. Dispersion of Emissions
2.4. Assessment of Population Exposure
2.5. Assessment of Health Impacts
3. Results
3.1. Emissions in the Baseline and Reduction Scenarios
3.2. Resulting PM2.5 Concentrations in Ambient Air
3.3. Health Impacts
4. Discussion
5. Conclusions
Author Contributions
Funding
Acknowledgments
Conflicts of Interest
References
- WHO. Review of Evidence on Health Aspects of Air Pollution. REVIHAAP Project. Technical Report. 2013. Available online: http://www.euro.who.int/__data/assets/pdf_file/0004/193108/REVIHAAP-Final-technical-report-final-version.pdf?ua=1 (accessed on 20 June 2019).
- Landrigan, P.J.; Fuller, R.; Acosta, N.J.; Adeyi, O.; Arnold, R.; Baldé, A.B.; Bertollini, R.; Bose-O’Reilly, S.; Boufford, J.I.; Breysse, P.N.; et al. The Lancet Commission on pollution and health. Lancet 2018, 391, 462–512. [Google Scholar] [CrossRef] [Green Version]
- Lehtomäki, H.; Korhonen, A.; Asikainen, A.; Karvosenoja, N.; Kupiainen, K.; Paunu, V.; Savolahti, M.; Sofiev, M.; Palamarchuk, Y.; Karppinen, A.; et al. Health Impacts of Ambient Air Pollution in Finland. Int. J. Environ. Res. Public Health 2018, 15, 736. [Google Scholar] [CrossRef] [PubMed]
- Maas, R.; Grennfelt, P. (Eds.) Towards Cleaner Air. Specific Assessment Report 2016; EMEP Streering Body and Working Group on Effects of the Convention on Long-Range Transboundary Air Pollution: Oslo, Norway, 2016. [Google Scholar]
- Amann, M.; Cofala, J.; Klimot, Z.; Nagl, C.; Schieder, W. Measures to Address Air Pollution from Small Combustion Sources; Report Produced under Specific Agreement 11 under Framework Contract; International Institute for Applied Systems Analysis (IIASA): Laxenburg, Austria; Available online: https://ec.europa.eu/environment/air/pdf/clean_air_outlook_combustion_sources_report.pdf (accessed on 1 July 2019).
- Karagulian, F.; Belis, C.A.; Dora, C.F.C.; Prüss-Ustün, A.M.; Bonjour, S.; Adair-Rohani, H.; Amann, M. Contributions to cities’ ambient particulate matter (PM): A systematic review of local source contributions at global level. Atmos. Environ. 2015, 120, 475–483. [Google Scholar] [CrossRef]
- Saarnio, K.; Niemi, J.V.; Saarikoski, S.; Aurela, M.; Timonen, H.; Teinila, K.; Myllynen, M.; Freyi, A.; Lamberg, H.; Jokiniemi, J.; et al. Using monosaccharide anhydrides to estimate the impact of wood combustion on fine particles in the Helsinki Metropolitan Area. Boreal Environ. Res. 2012, 17, 163–183. [Google Scholar]
- Kukkonen, J.; Kangas, L.; Kauhaniemi, M.; Sofiev, M.; Aarnio, M.; Jaakkola, J.; Kousa, A.; Karppinen, A. Modeling of the urban concentrations of PM2.5 for a period of 35 years, for the assessment of lifetime exposure and health effects. Atmos. Chem. Phys. 2018, 18, 8041–8064. [Google Scholar] [CrossRef]
- Kukkonen, J.; López-Aparicio, S.; Segersson, D.; Geels, C.; Kangas, L.; Kauhaniemi, M.; Maragkidou, A.; Jensen, A.; Assmuth, T.; Karppinen, A.; et al. The influence of residential wood combustion on the concentrations of PM2.5 in four Nordic cities. Atmos. Chem. Phys. 2019. under review. [Google Scholar]
- Karvosenoja, N. Emission Scenario Model for Regional Air Pollution; Finnish Environment Institute: Helsinki, Finland, 2008. [Google Scholar]
- Savolahti, M.; Karvosenoja, N.; Tissari, J.; Kupiainen, K.; Sippula, O.; Jokiniemi, J. Black carbon and fine particle emissions in Finnish residential wood combustion: Emission projections, reduction measures and the impact of combustion practices. Atmos Environ. 2016, 140, 495–505. [Google Scholar] [CrossRef]
- Savolahti, M.; Karvosenoja, N.; Soimakallio, S.; Kupiainen, K.; Tissari, J.; Paunu, V.-V. Near-term climate impacts of Finnish residential wood combustion. Energy Policy 2019. accepted. [Google Scholar] [CrossRef]
- Statistics Finland. Energy 2017 Table Service. Available online: https://pxhopea2.stat.fi/sahkoiset_julkaisut/energia2017/ (accessed on 10 April 2018).
- Huttunen, R. Government Report on the National Energy and Climate Strategy for 2030; Publications of the Ministry of Economic Affairs and Employment: Suomi, Finland, 2017. [Google Scholar]
- Torvelainen, J. Metsätilastotiedote: Pientalojen Polttopuun Käyttö 2007/2008; Metsäntutkimuslaitos, Metsätilastollinen tietopalvelu: Vantaa, Finland, 2009. [Google Scholar]
- Paunu, V.-V.; Karvosenoja, N.; Savolahti, M.; Kupiainen, K. High quality spatial model for residential wood combustion emissions. In Proceedings of the 16th IUAPPA World Clean Air Congress, Cape Town, South Africa, 29 September–4 October 2013; Volume 4, p. 11. [Google Scholar]
- Karppinen, A.; Joffre, S.M.; Kukkonen, J. The refinement of a meteorological preprocessor for the urban environment. Int. J. Environ. Pollut. 2000, 14, 565–572. [Google Scholar] [CrossRef]
- Karvosenoja, N.; Kangas, L.; Kupiainen, K.; Kukkonen, J.; Karppinen, A.; Sofiev, M.; Tainio, M.; Paunu, V.-V.; Ahtoniemi, P.; Tuomisto, J.T.; et al. Integrated modeling assessments of the population exposure in Finland to primary PM2.5 from traffic and domestic wood combustion on the resolutions of 1 and 10 km. Air Qual. Atmos. Health 2011, 4, 179–188. [Google Scholar] [CrossRef]
- Statistics Finland. Population Grid Data 1 km × 1 km. 2017. Available online: http://www.stat.fi/org/avoindata/paikkatietoaineistot/vaestoruutuaineisto_1km_en.html (accessed on 5 April 2018).
- Prüss-Üstün, A.; Mathers, C.; Corvalán, C.; Woodwards, A. Introduction and Methods: Assessing the Environmental Burden of Disease at National and Local Levels; World Health Organization: Geneva, Switzerland, 2003. [Google Scholar]
- WHO. WHO Methods and Data Sources for Global Burden of Disease Estimates 2000–2015. Global Health Estimates Technical Paper WHO/HIS/IER/GHE/2017.1. Available online: http://www.who.int/healthinfo/global_burden_disease/GlobalDALYmethods_2000_2015.pdf?ua=1 (accessed on 30 July 2019).
- Héroux, M.E.; Anderson, H.R.; Atkinson, R.; Brunekreef, B.; Cohen, A.; Forastiere, F.; Hurley, F.; Katsouyanni, K.; Krewski, D.; Krzyzanowski, M.; et al. Quantifying the health impacts of ambient air pollutants: Recommendations of a WHO/Europe project. Int. J. Environ. Res. Public Health 2015, 60, 619–627. [Google Scholar] [CrossRef] [PubMed]
- Kodros, J.; Wiedinmyer, C.; Ford, B.; Cucinotta, R.; Gan, R.; Magzamen, S.; Pierce, J.R. Global burden of mortalities due to chronic exposure to ambient PM2.5 from open combustion of domestic waste. Environ. Res. Lett. 2016, 11, 1–9. [Google Scholar] [CrossRef]
- Statistics Finland. Statistics Finland’s PxWeb Databases: Population Projection 2015 According to Vital Statistics and Sex by Area in 2015 to 2040. 2018. Available online: http://pxnet2.stat.fi/PXWeb/pxweb/en/StatFin/StatFin__vrm__vaenn/statfin_vaenn_pxt_004.px/ (accessed on 25 June 2019).
- Aunan, K.; Ma, Q.; Lund, M.T.; Wang, S. Population-weighted exposure to PM2.5 pollution in China: An integrated approach. Environ. Int. 2018, 120, 111–120. [Google Scholar] [CrossRef] [PubMed]
- Vodonos, A.; Awad, Y.A.; Schwartz, J. The concentration-response between long-term PM2.5 exposure and mortality; A meta-regression approach. Environ. Res. 2018, 166, 677–689. [Google Scholar] [CrossRef] [PubMed]
- Hanigan, I.C.; Rolfe, M.I.; Knibbs, L.D.; Salimi, F.; Cowie, C.T.; Heyworth, J.; Marks, G.B.; Guo, Y.; Cope, M.; Bauman, A.; et al. All-cause mortality and long-term exposure to low level air pollution in the ‘45 and up study’cohort, Sydney, Australia, 2006–2015. Environ. Int. 2019, 126, 762–770. [Google Scholar] [CrossRef] [PubMed]
- Burnett, R.; Chen, H.; Szyszkowicz, M.; Fann, N.; Hubbel, B.; Pope, C.A., III; Apte, J.S.; Brauer, M.; Cohen, A.; Spadaro, J.V. Global estimates of mortality associated with long-term exposure to outdoor fine particulate matter. Proc. Natl. Acad. Sci. USA 2018, 115, 9592–9597. [Google Scholar] [CrossRef] [PubMed] [Green Version]
- Tissari, J.; Leskinen, J.; Lamberg, H.; Nieminen, V.; Väätäinen, S.; Koponen, H.; Myllynen, M.; Savolahti, M.; Karvosenoja, N. Kiukaiden päästöt ja niiden vähentäminen (KIUAS). Loppuraportti. Itä-Suomen ylipisto. Ympäristö- ja biotieteiden laitos. Pienhiukkas- ja aerosolitekniikan laboratorio. 2019. Available online: https://www.uef.fi/documents/592626/595218/KIUAS+loppuraportti/0f6a2ff2-c36b-4999-ad7a-7788ea5ea19b (accessed on 20 June 2019).
- Ministry of the Environment. National Air Pollution Control Programme 2030; Publications of the Ministry of Environment: Suomi, Finland, 2019.


| Scenarios | Description and Scope | |
|---|---|---|
| Baseline | Projected RWC emissions in 2030 with existing measures. Includes the Ecodesign Directive (Directive 2009/125/EC). | |
| 1 | Information campaign | Training stove users in good practices of a stove. We assumed the maximum estimated effect from Savolahti et al. (2016) for the campaign. This halves the amount of smouldering combustion initially assumed for stoves. |
| a | Cities only | Implemented in municipalities with a population centre of 20,000+ inhabitants. |
| b | Whole country | Implemented throughout the country. |
| 2 | 1b + national sauna legislation | On top of 1b, national regulation similar to Ecodesign, but covering only sauna stoves (which are excluded in Ecodesign): Only modern sauna stoves allowed to be sold after 2022. We assume modern sauna stoves to produce 50% fewer emissions than conventional ones. Average lifetime of a sauna stove was assumed to be 12.5 a, which was used to estimate the penetration rate of new appliances to the stock. |
| 3 | 2 + ESP installations | On top of 2, requirement to install end-of-stack electrostatic precipitators (ESP) to residential-size wood boilers. Implemented to all boilers in the country. ESPs were assumed to have PM2.5 emission reduction efficiency of 80%. |
| 4 | 3 + urban combustion ban | On top of 3, prohibiting of all residential wood combustion in urban areas of municipalities with a population centre of 20,000+ inhabitants. Urban areas were classified as grid cells with at least 200 residents and the distance between buildings less than 200 m. |
| Health Outcome | Age Group | RR per 10 µg/m3 (95% CI) |
|---|---|---|
| Natural mortality | >30 year | 1.062 (1.040–1.083) |
| ardiovascular diseases (hospital admissions) | All | 1.0091 (1.0017–1.0166) |
| Respiratory (hospital admissions) | All | 1.0190 (0.9982–1.0402) |
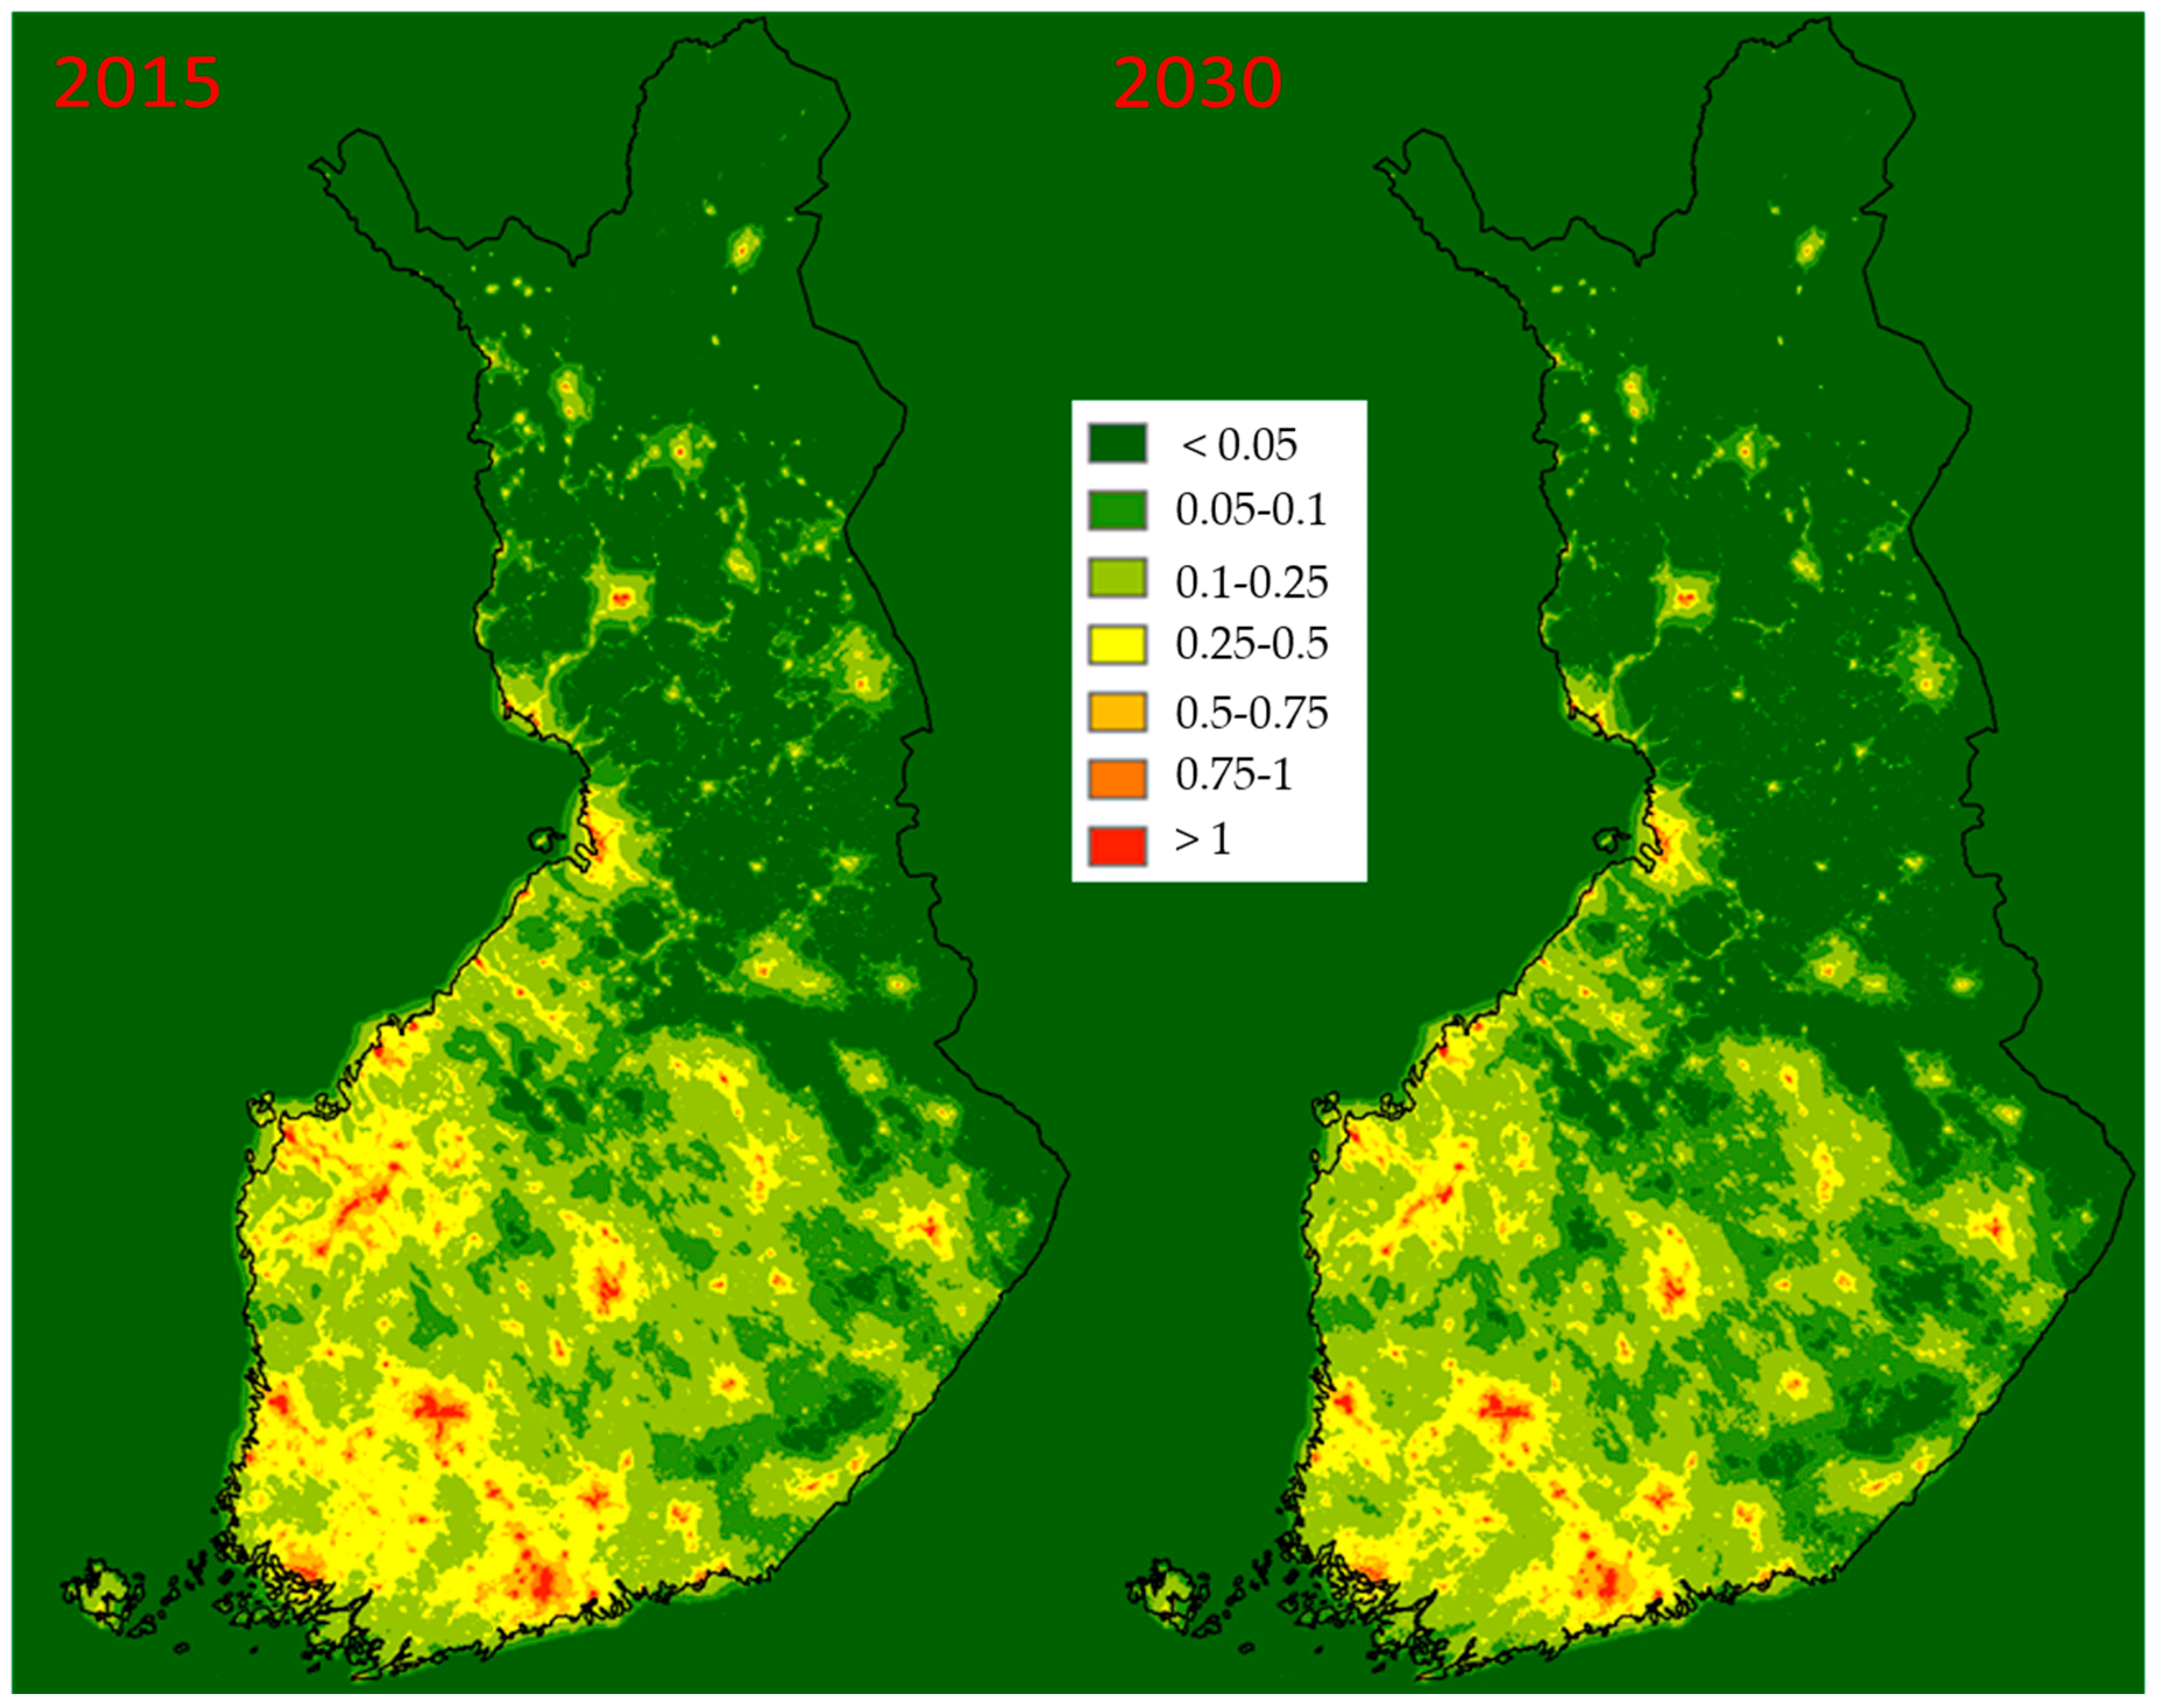
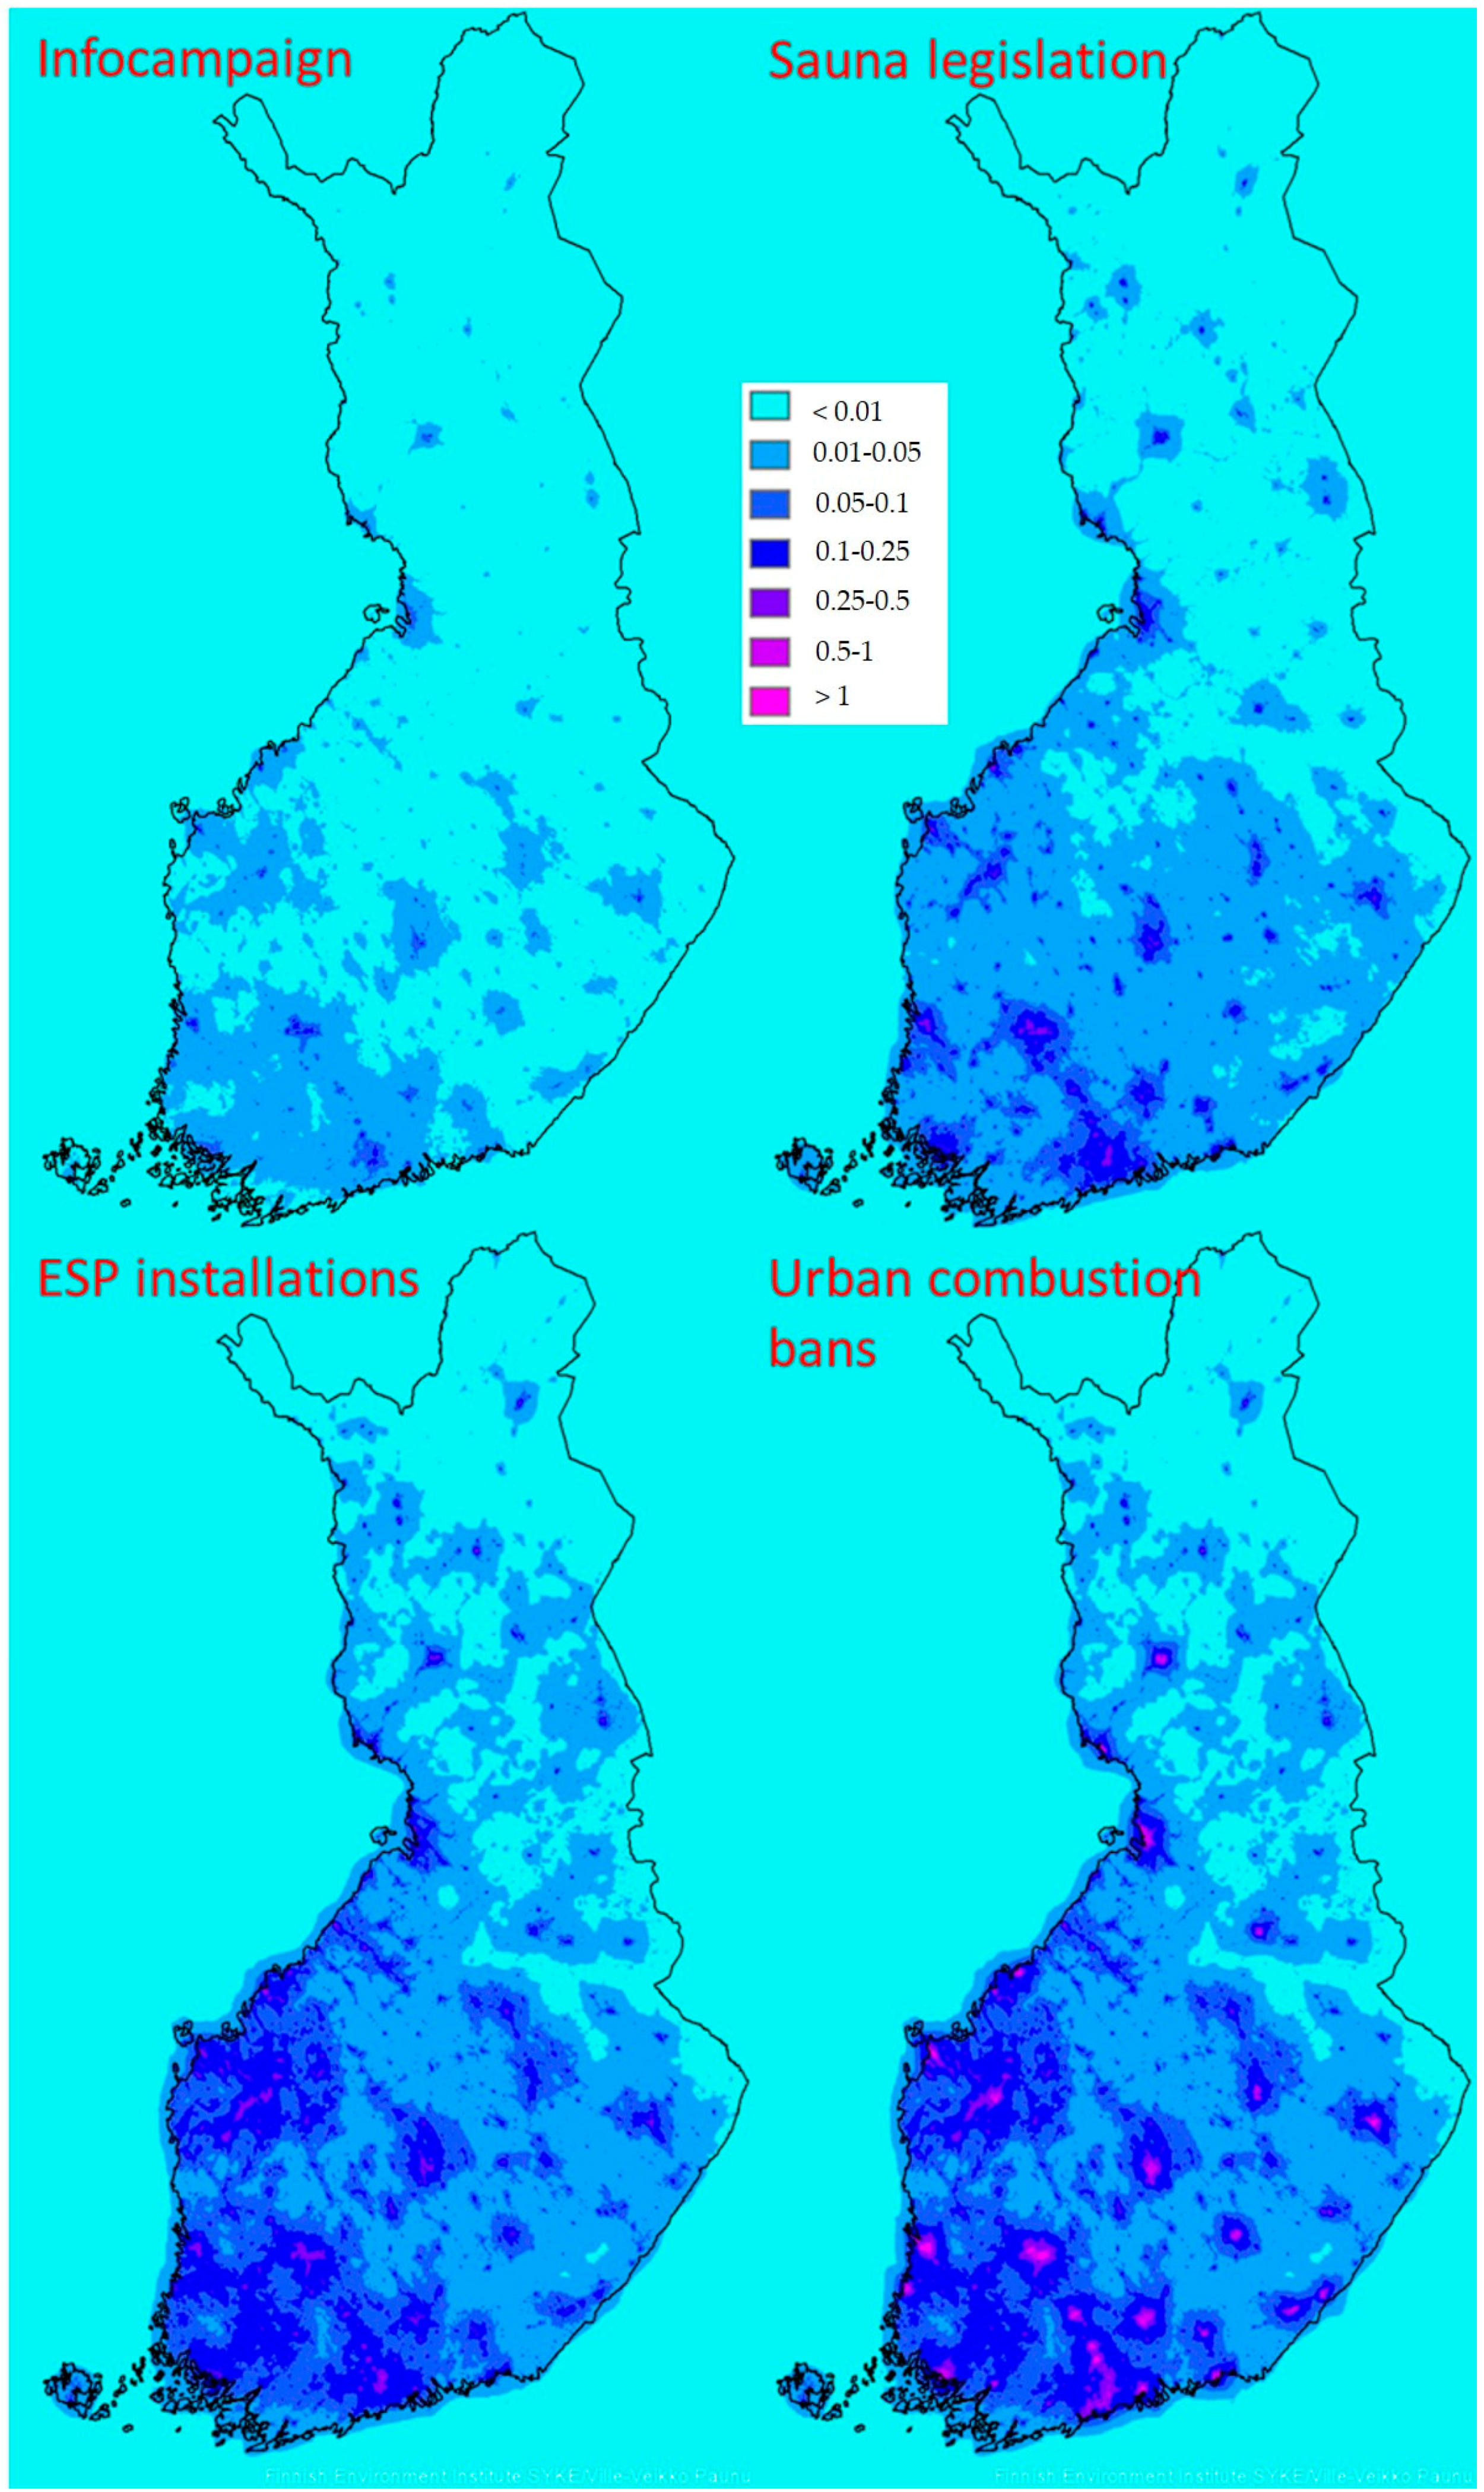
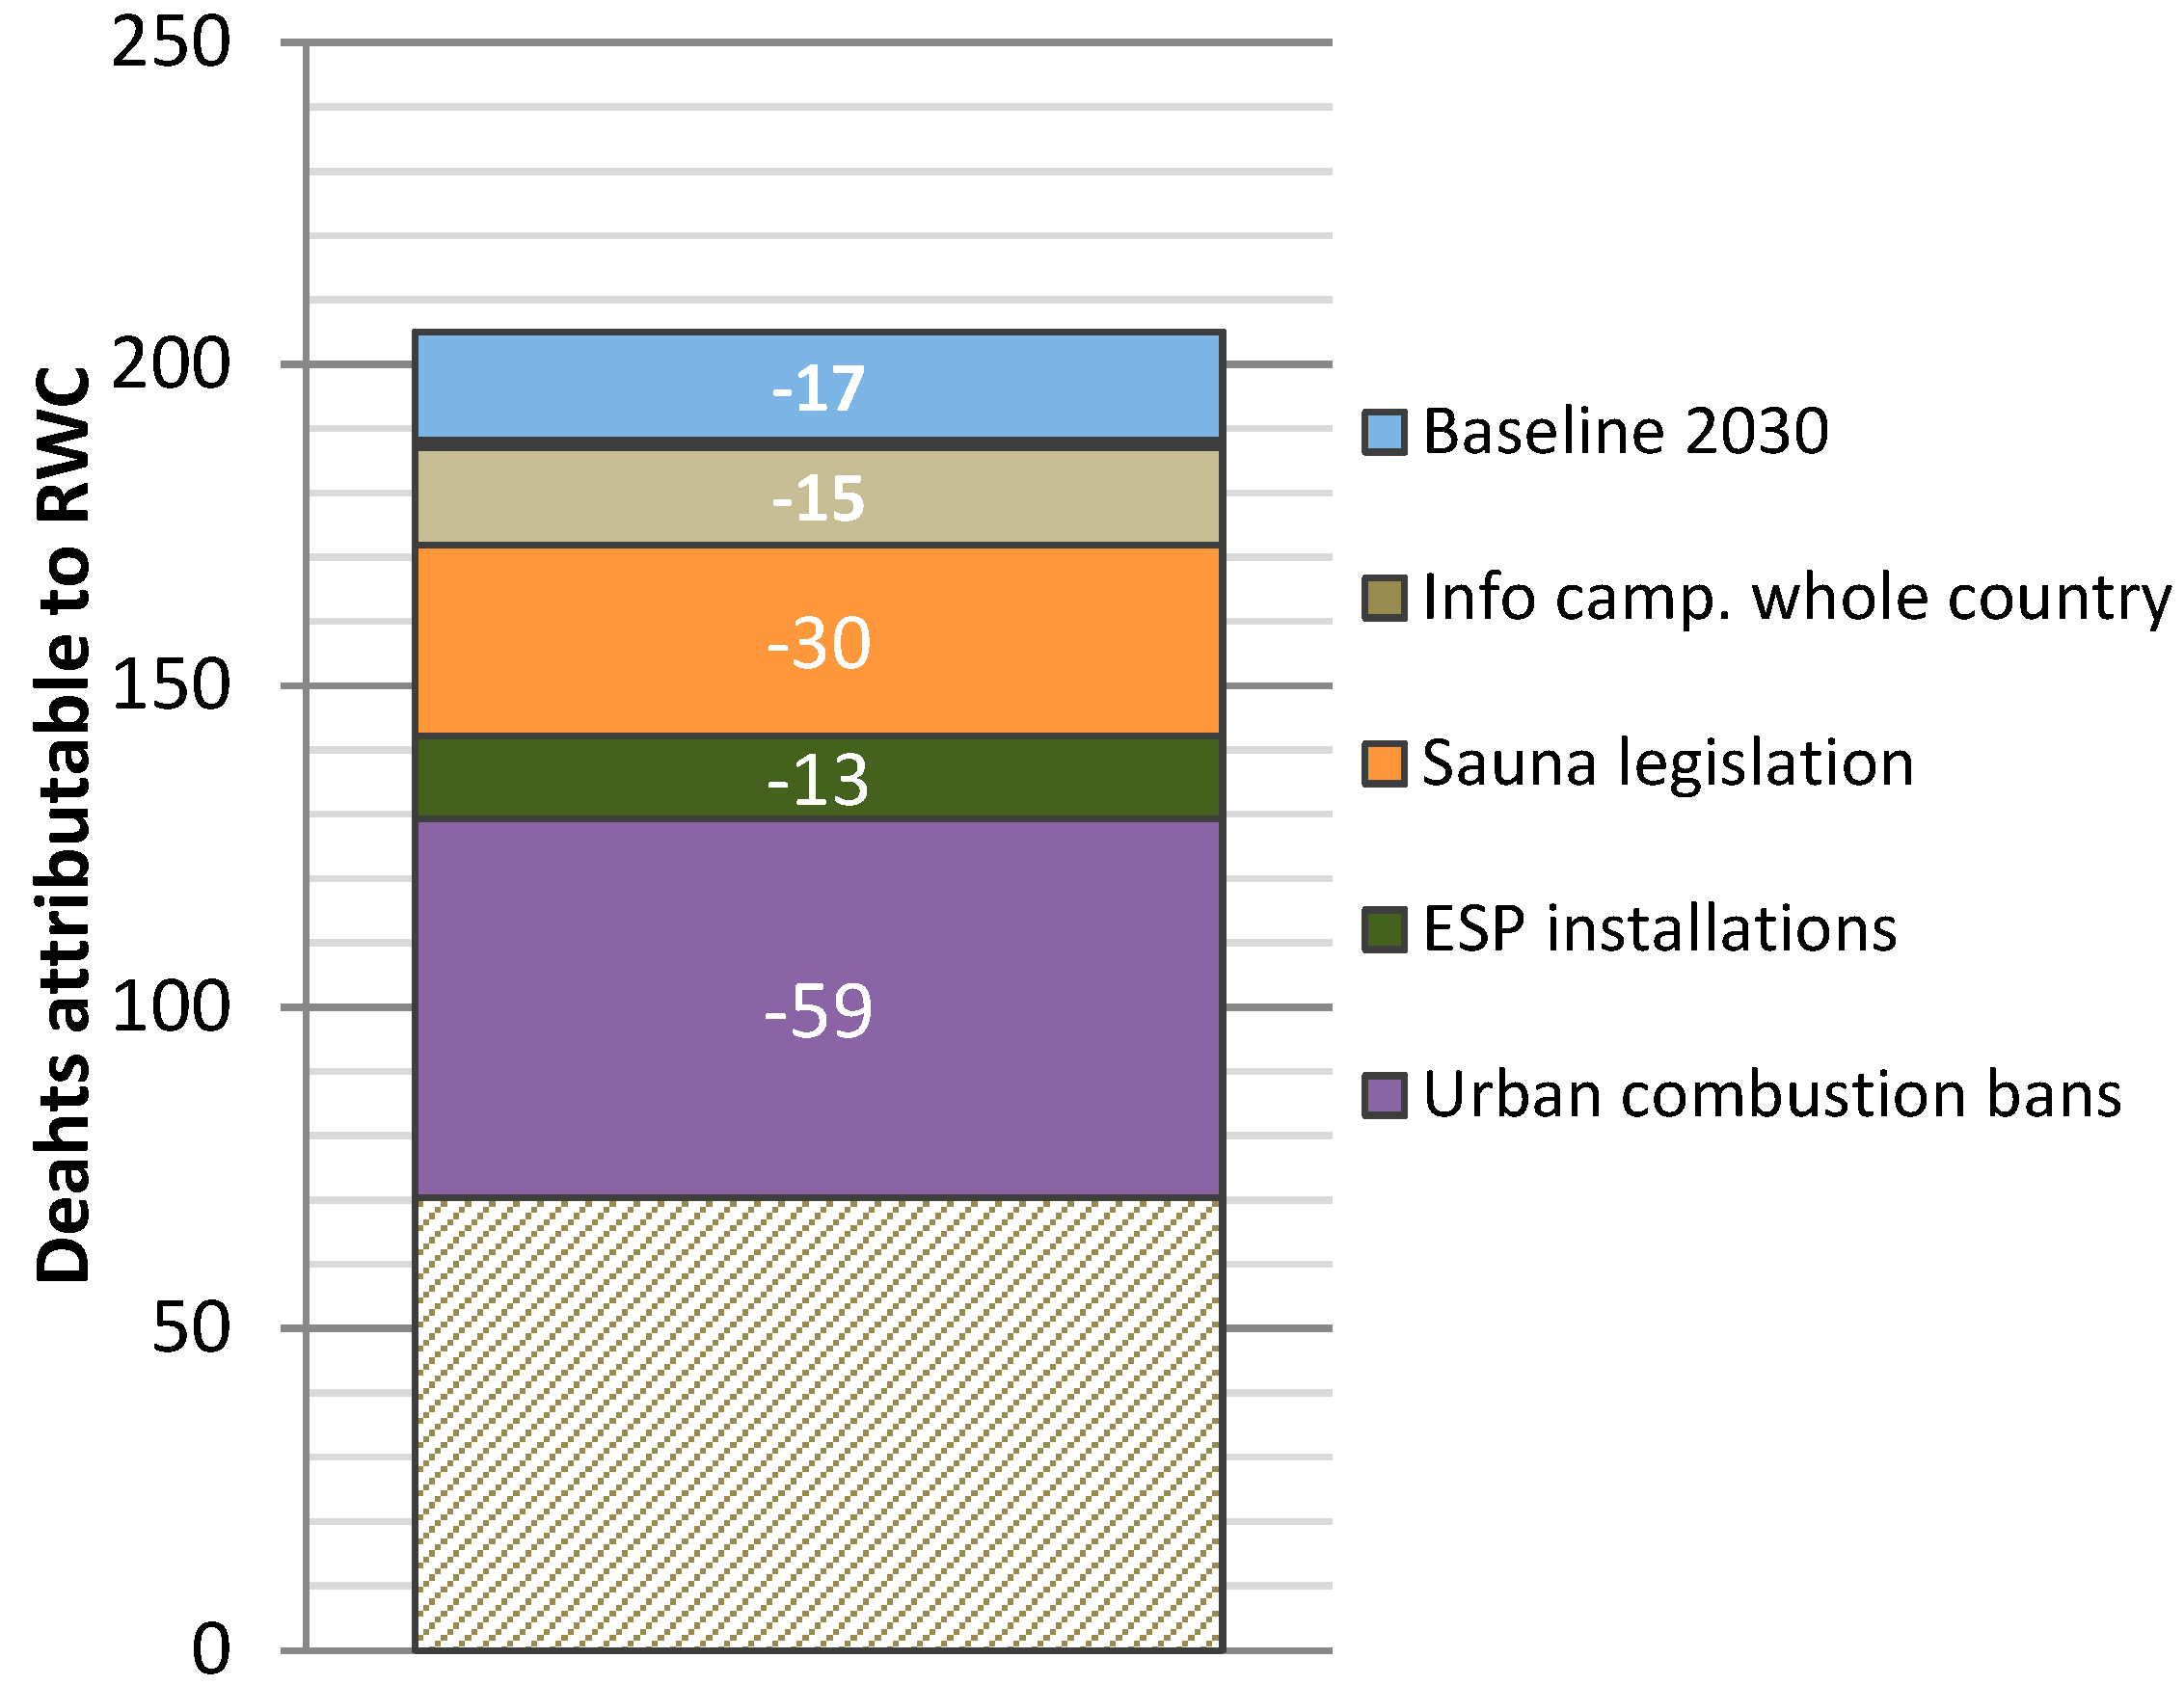
| Scenario | PM2.5 Gg/a | PWC µg/m3 | DALY | YLL | YLD | Deaths | ΔDALY/ΔGg PM2.5 |
|---|---|---|---|---|---|---|---|
| 2015 | 10.5 | 0.70 | 3410 | 3410 | 55 | 204 | - |
| 2030 Baseline | 9.1 | 0.64 | 3120 | 3070 | 51 | 187 | - |
| 1. Infocampaign | |||||||
| a Cities | 9.0 | 0.62 | 2990 | 2940 | 48 | 179 | 1140 |
| b All areas | 8.5 | 0.59 | 2860 | 2810 | 46 | 172 | 400 |
| 2. Sauna legislation | 7.0 | 0.49 | 2360 | 2320 | 38 | 141 | 351 |
| 3. ESP installations | 5.5 | 0.44 | 2140 | 2100 | 35 | 128 | 140 |
| 4. Urban combustion bans | 4.8 | 0.24 | 1140 | 1120 | 18 | 68 | 1480 |
| Population | Inhabitants | Deaths | Deaths/100,000 Inhabitants |
|---|---|---|---|
| >200,000 | 1,335,224 | 31 | 2.3 |
| 100,000–200,000 | 737,646 | 30 | 4.1 |
| 50,000–100,000 | 742,217 | 36 | 4.9 |
| 20,000–50,000 | 1,057,312 | 45 | 4.3 |
| 10,000–20,000 | 686,257 | 28 | 4.1 |
| 5000–10,000 | 570,376 | 19 | 3.3 |
| 2500–5000 | 248,826 | 6.0 | 2.4 |
| <2500 | 112,387 | 2.6 | 2.8 |
© 2019 by the authors. Licensee MDPI, Basel, Switzerland. This article is an open access article distributed under the terms and conditions of the Creative Commons Attribution (CC BY) license (http://creativecommons.org/licenses/by/4.0/).
Share and Cite
Savolahti, M.; Lehtomäki, H.; Karvosenoja, N.; Paunu, V.-V.; Korhonen, A.; Kukkonen, J.; Kupiainen, K.; Kangas, L.; Karppinen, A.; Hänninen, O. Residential Wood Combustion in Finland: PM2.5 Emissions and Health Impacts with and without Abatement Measures. Int. J. Environ. Res. Public Health 2019, 16, 2920. https://doi.org/10.3390/ijerph16162920
Savolahti M, Lehtomäki H, Karvosenoja N, Paunu V-V, Korhonen A, Kukkonen J, Kupiainen K, Kangas L, Karppinen A, Hänninen O. Residential Wood Combustion in Finland: PM2.5 Emissions and Health Impacts with and without Abatement Measures. International Journal of Environmental Research and Public Health. 2019; 16(16):2920. https://doi.org/10.3390/ijerph16162920
Chicago/Turabian StyleSavolahti, Mikko, Heli Lehtomäki, Niko Karvosenoja, Ville-Veikko Paunu, Antti Korhonen, Jaakko Kukkonen, Kaarle Kupiainen, Leena Kangas, Ari Karppinen, and Otto Hänninen. 2019. "Residential Wood Combustion in Finland: PM2.5 Emissions and Health Impacts with and without Abatement Measures" International Journal of Environmental Research and Public Health 16, no. 16: 2920. https://doi.org/10.3390/ijerph16162920