A Dynamical and Zero-Inflated Negative Binomial Regression Modelling of Malaria Incidence in Limpopo Province, South Africa
Abstract
1. Introduction
2. Materials and Methods
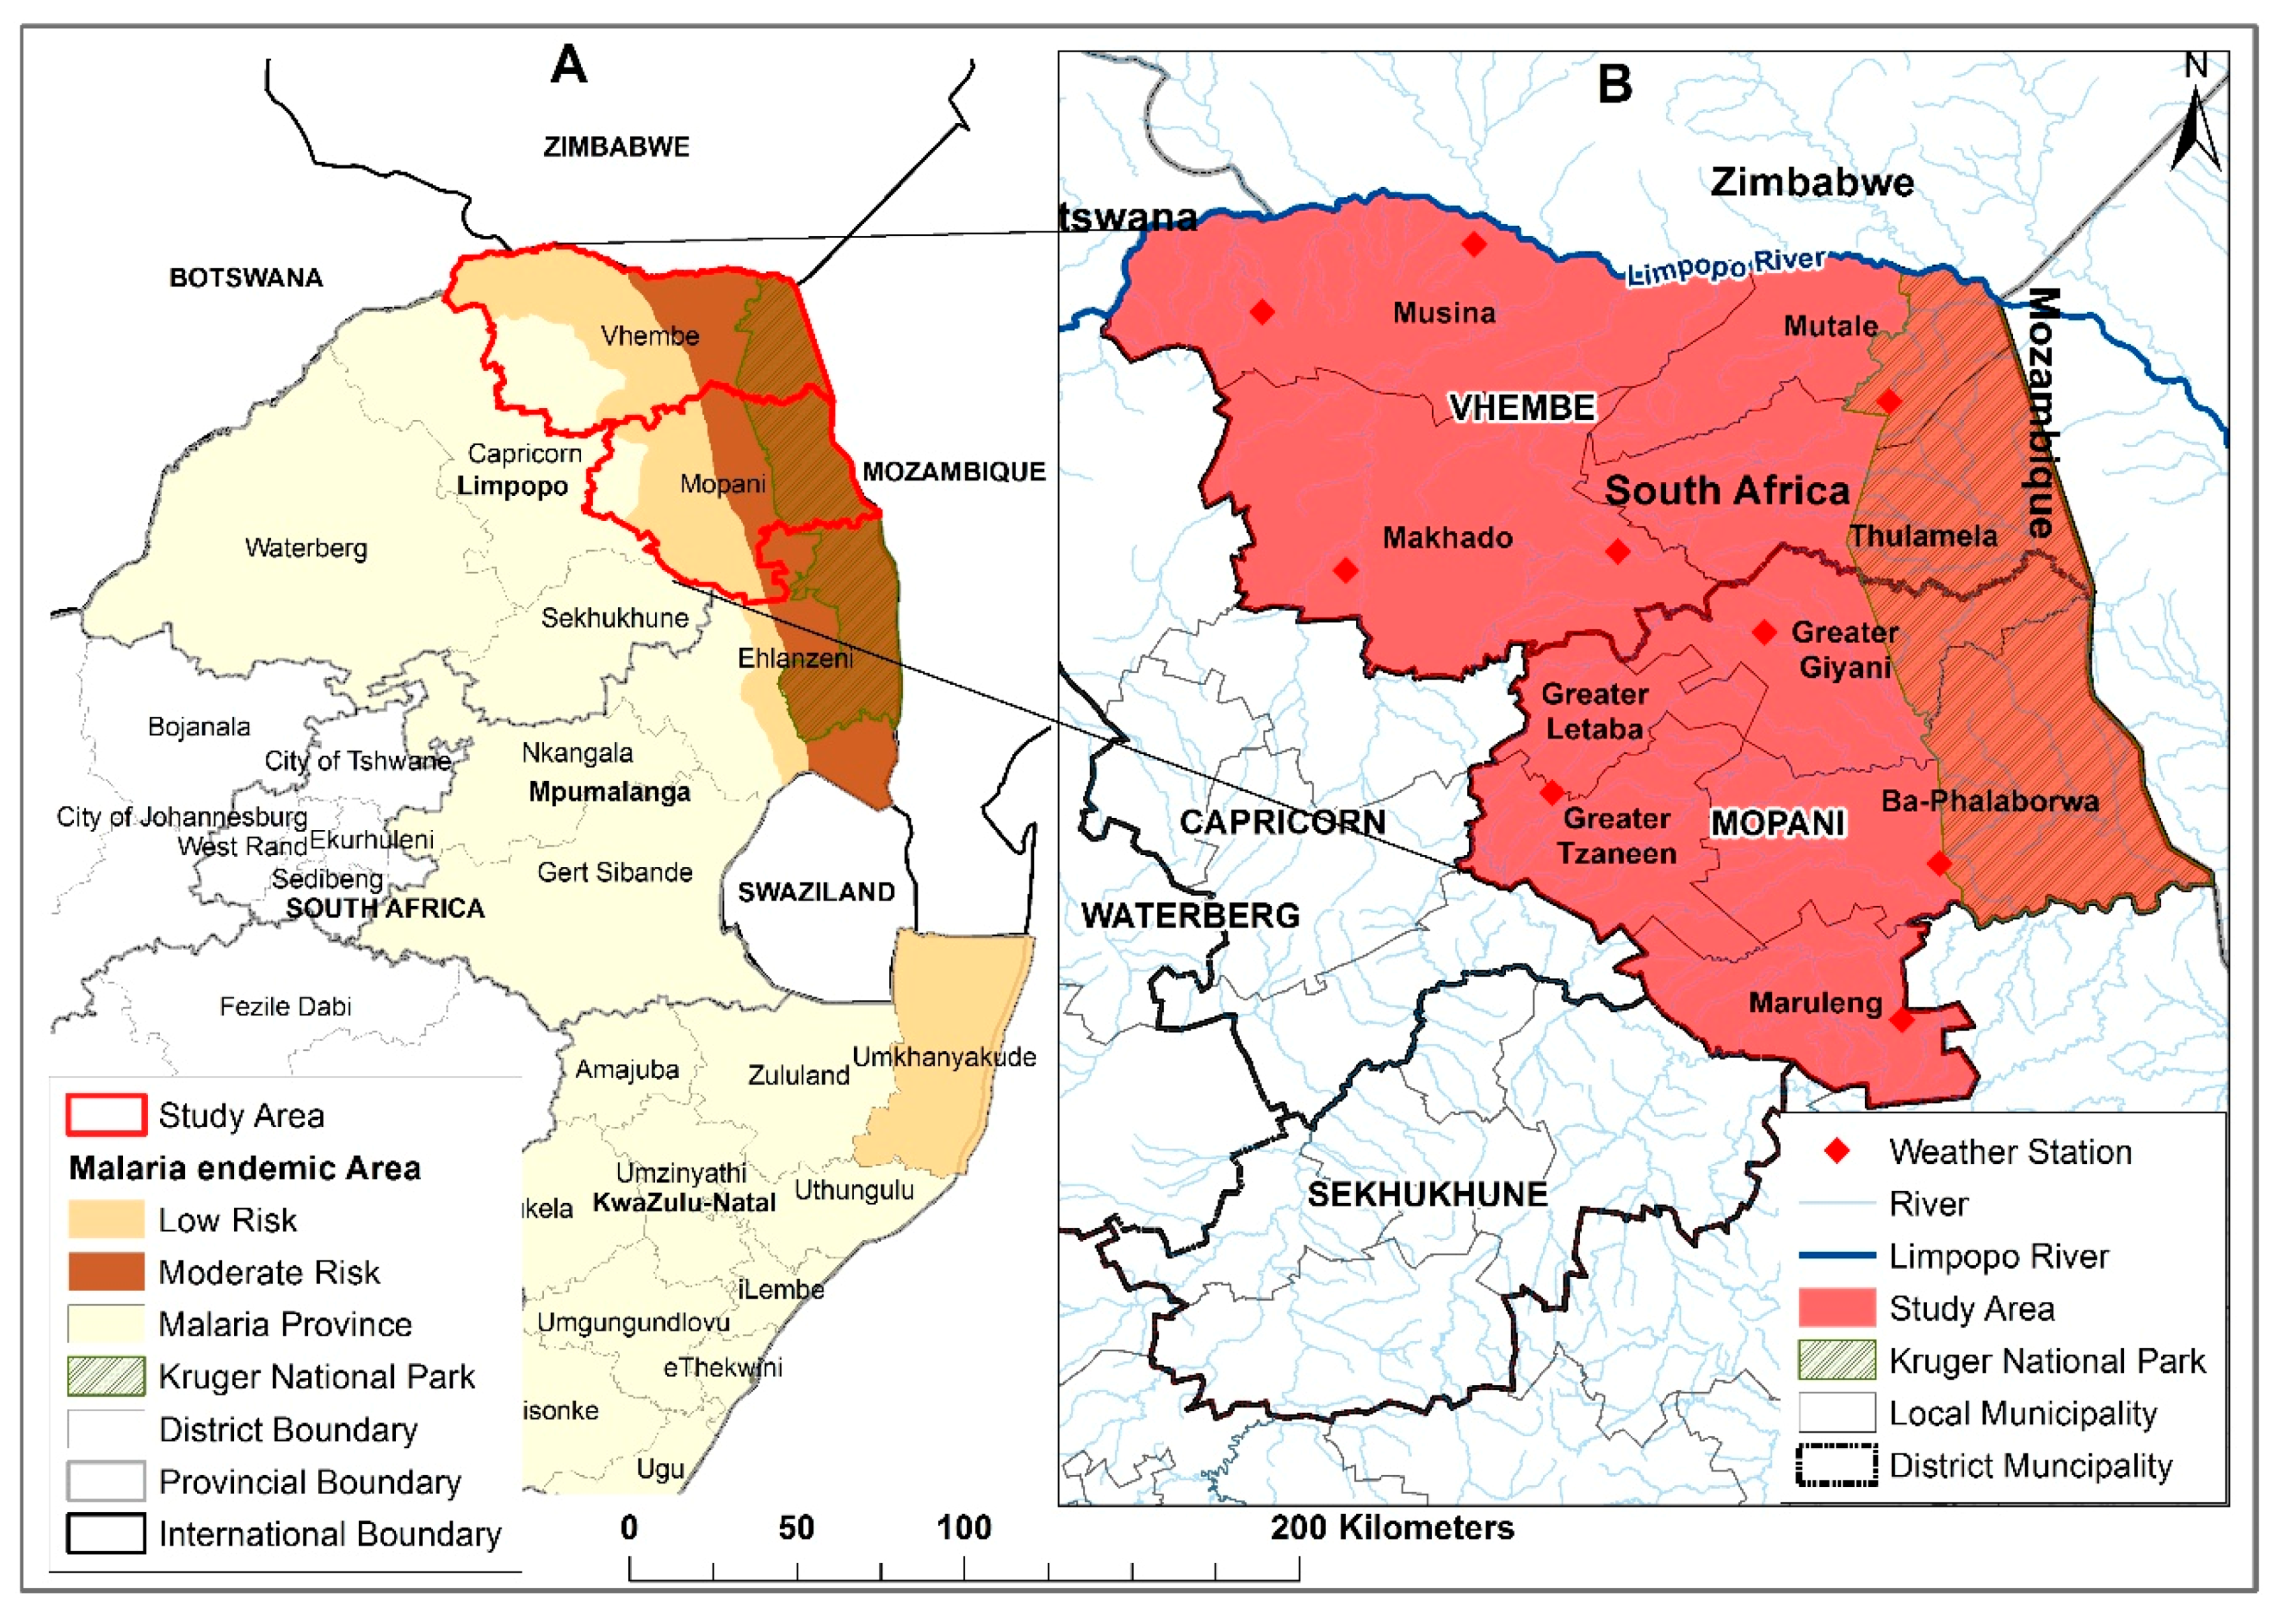
2.1. Study Area
2.2. Data
2.3. Dealing with Missing Values
2.4. The Zero-Inflated Negative Binomial Regression Model
2.5. The Dynamical Mosquito Model
3. Results and Discussion
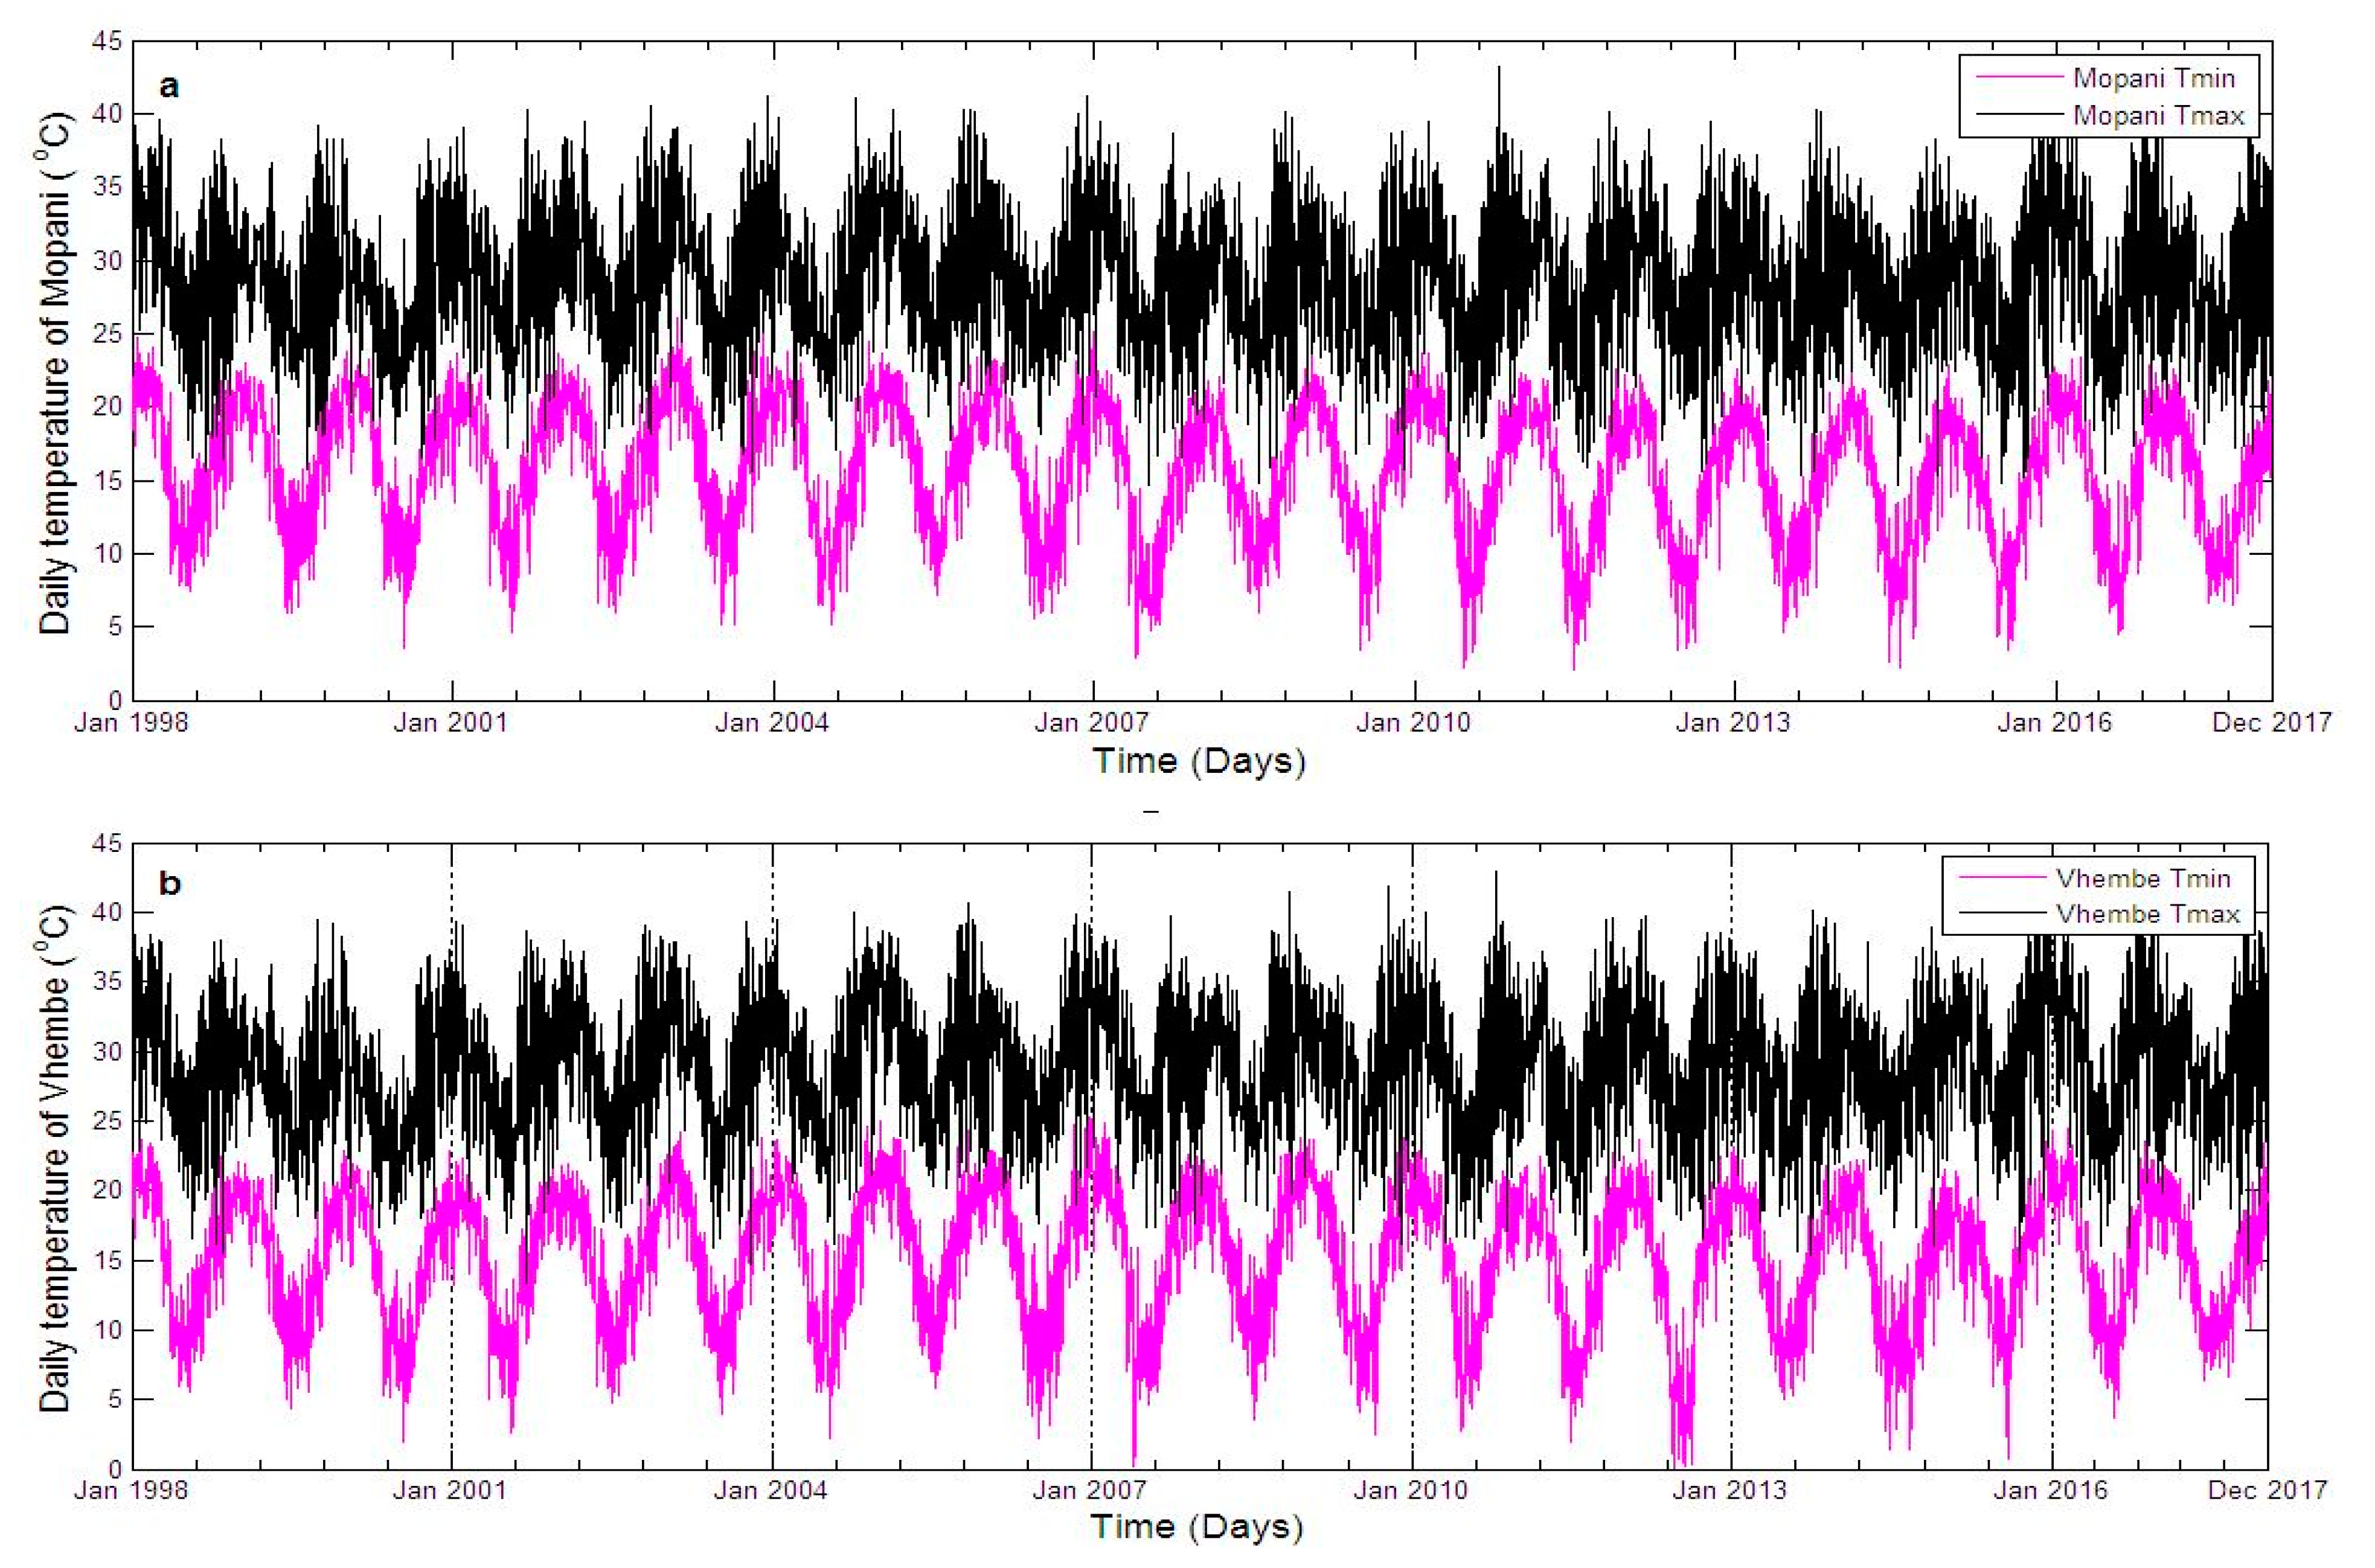
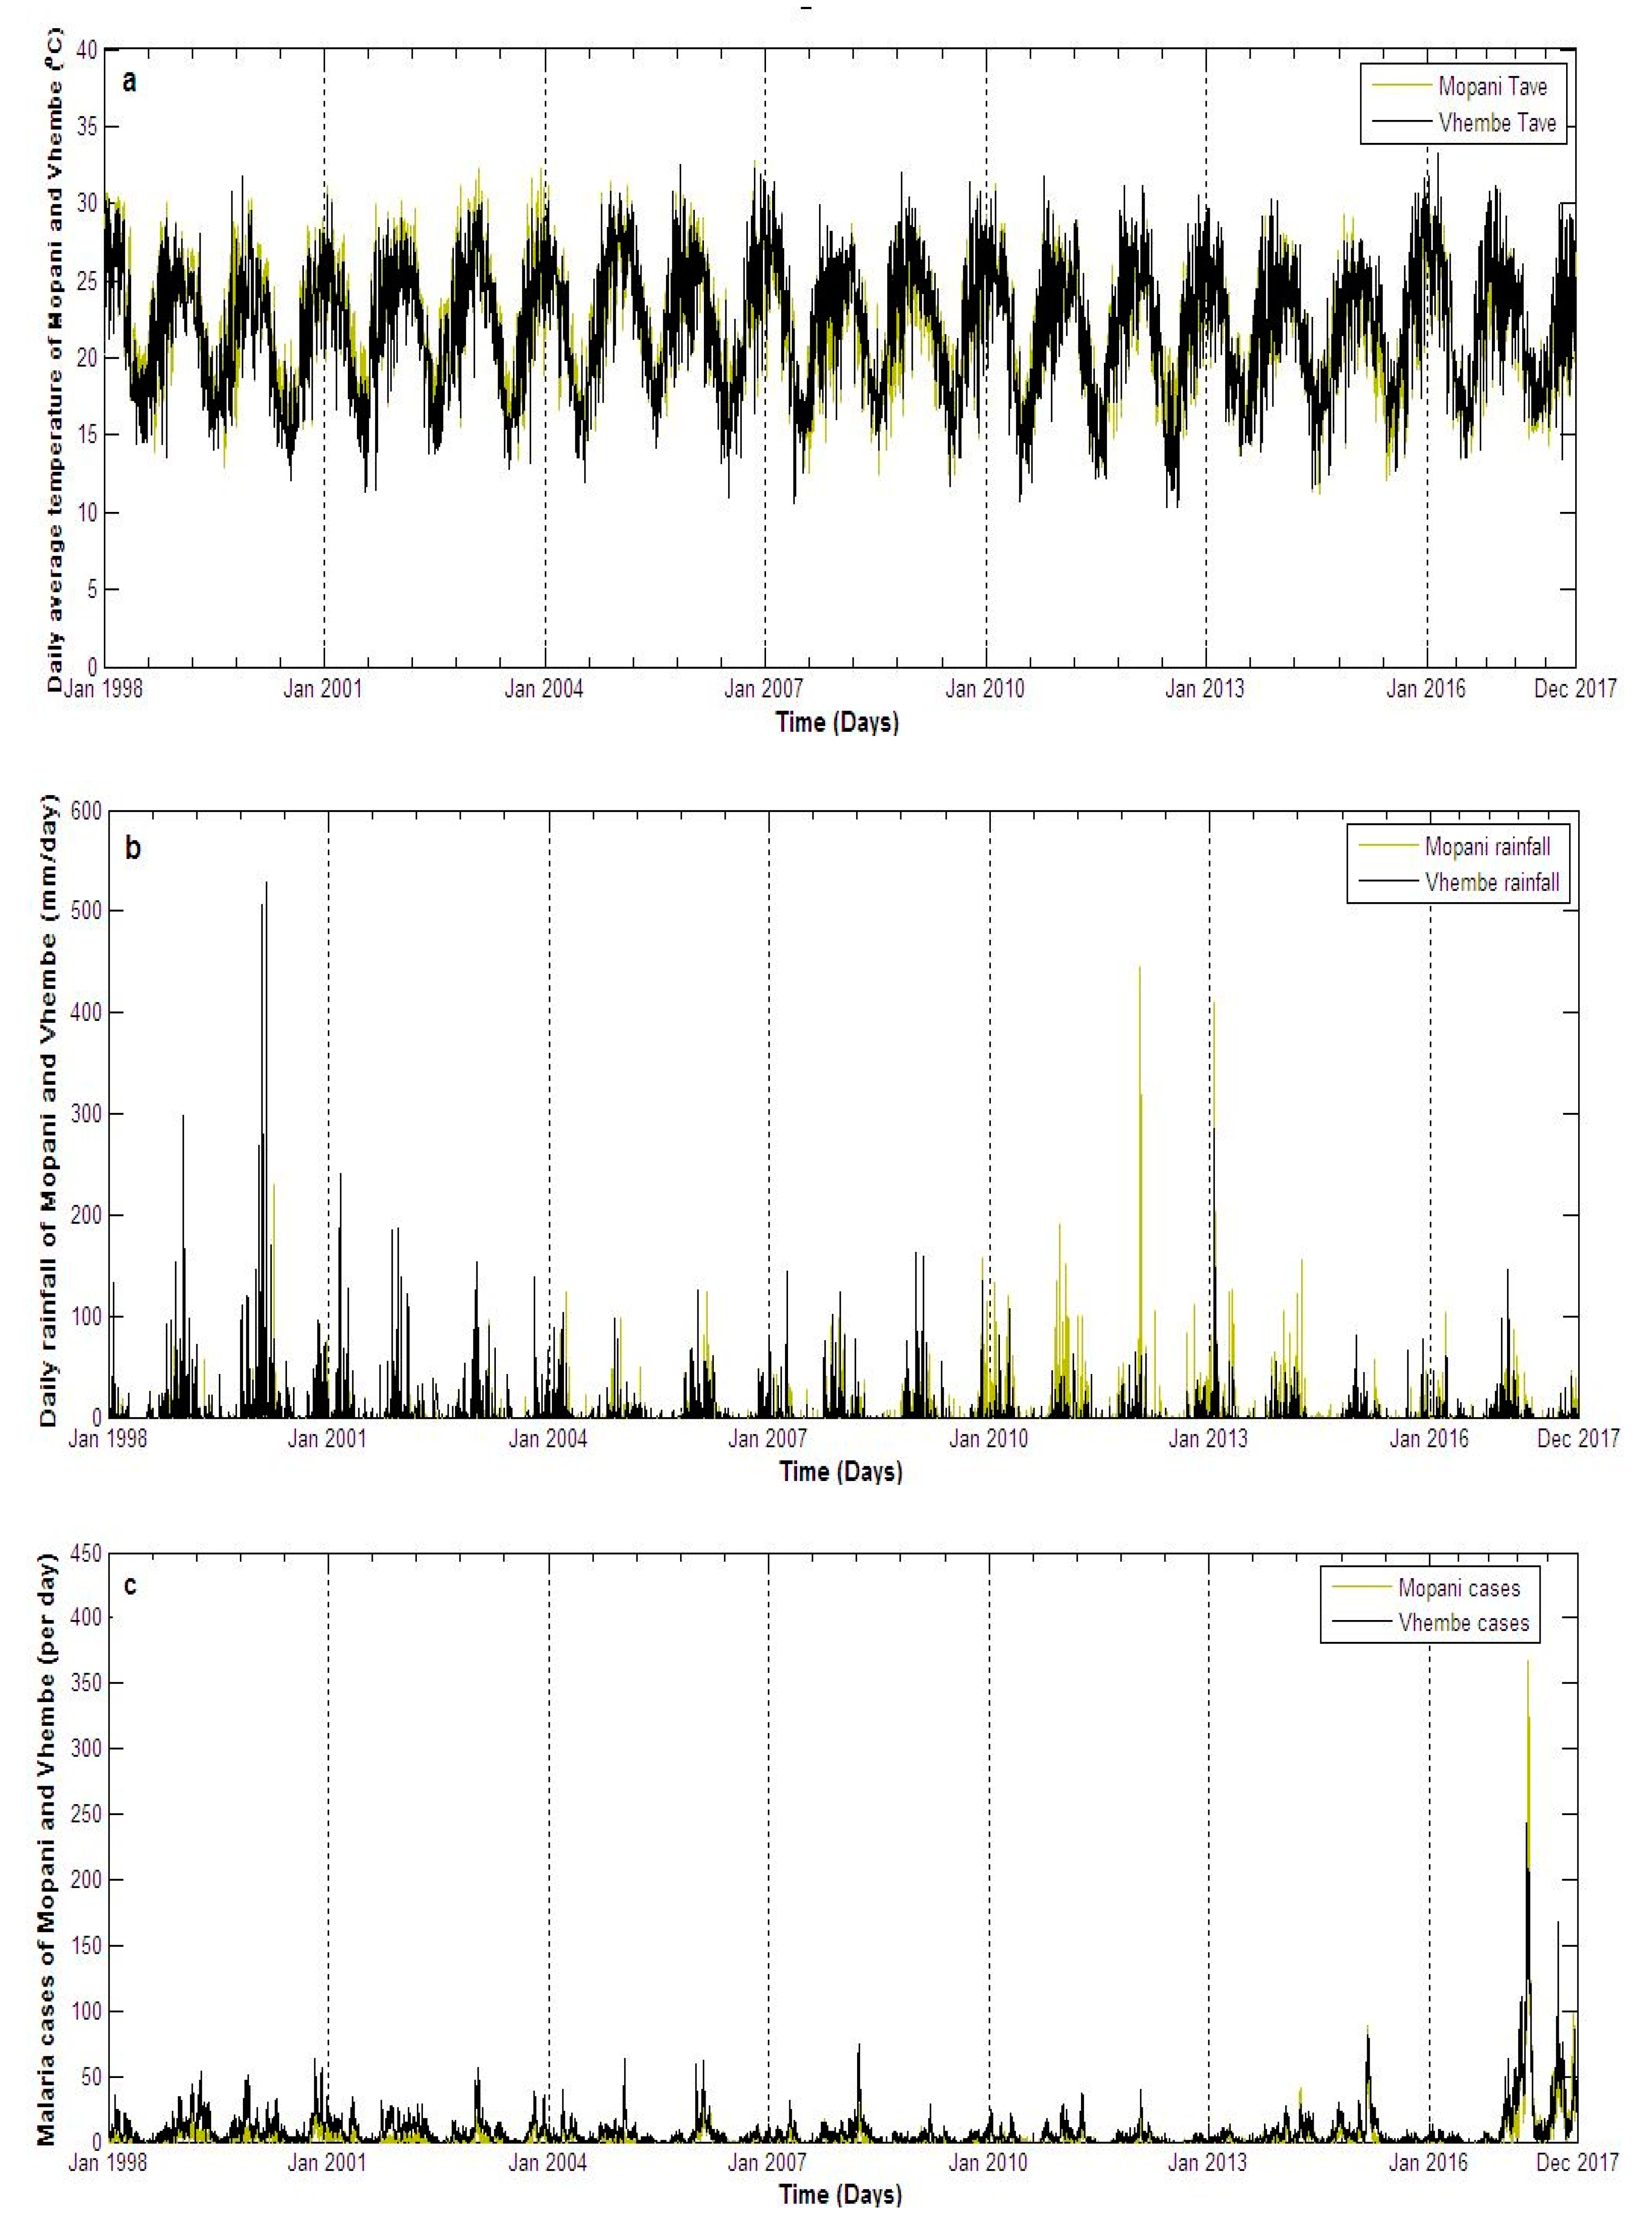
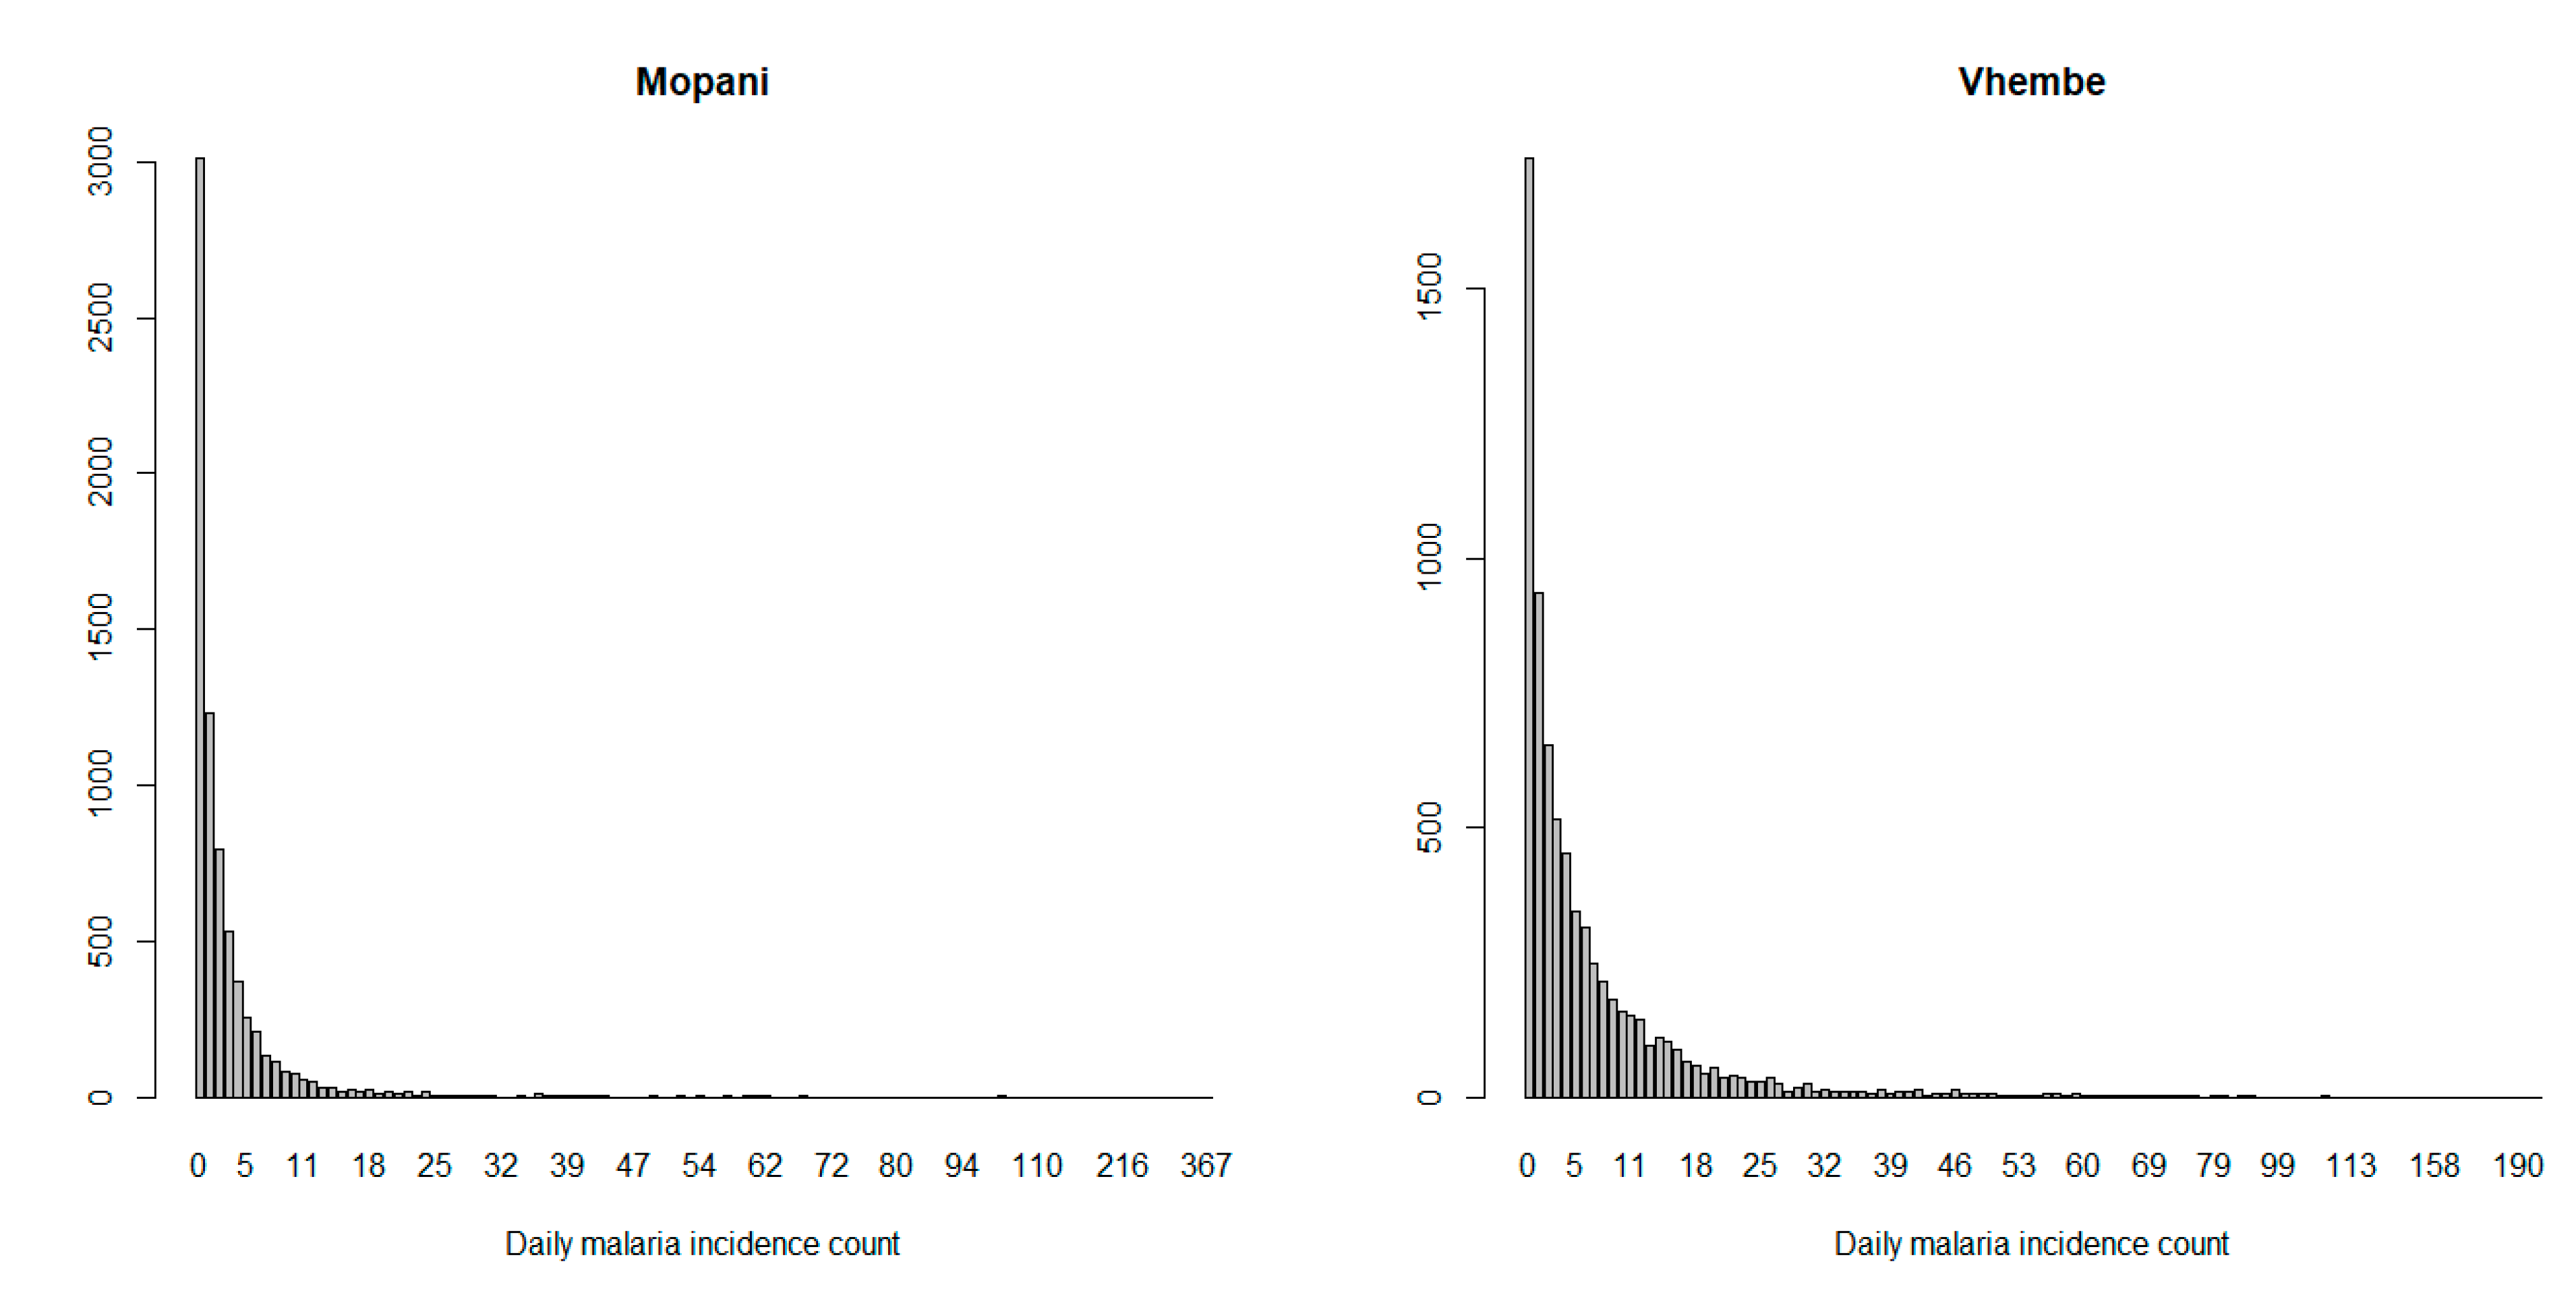
3.1. Climate and Malaria Cases of Mopani and Vhembe
3.2. Analysis over Mopani District Municipality
3.3. Analysis over Vhembe District Municipality
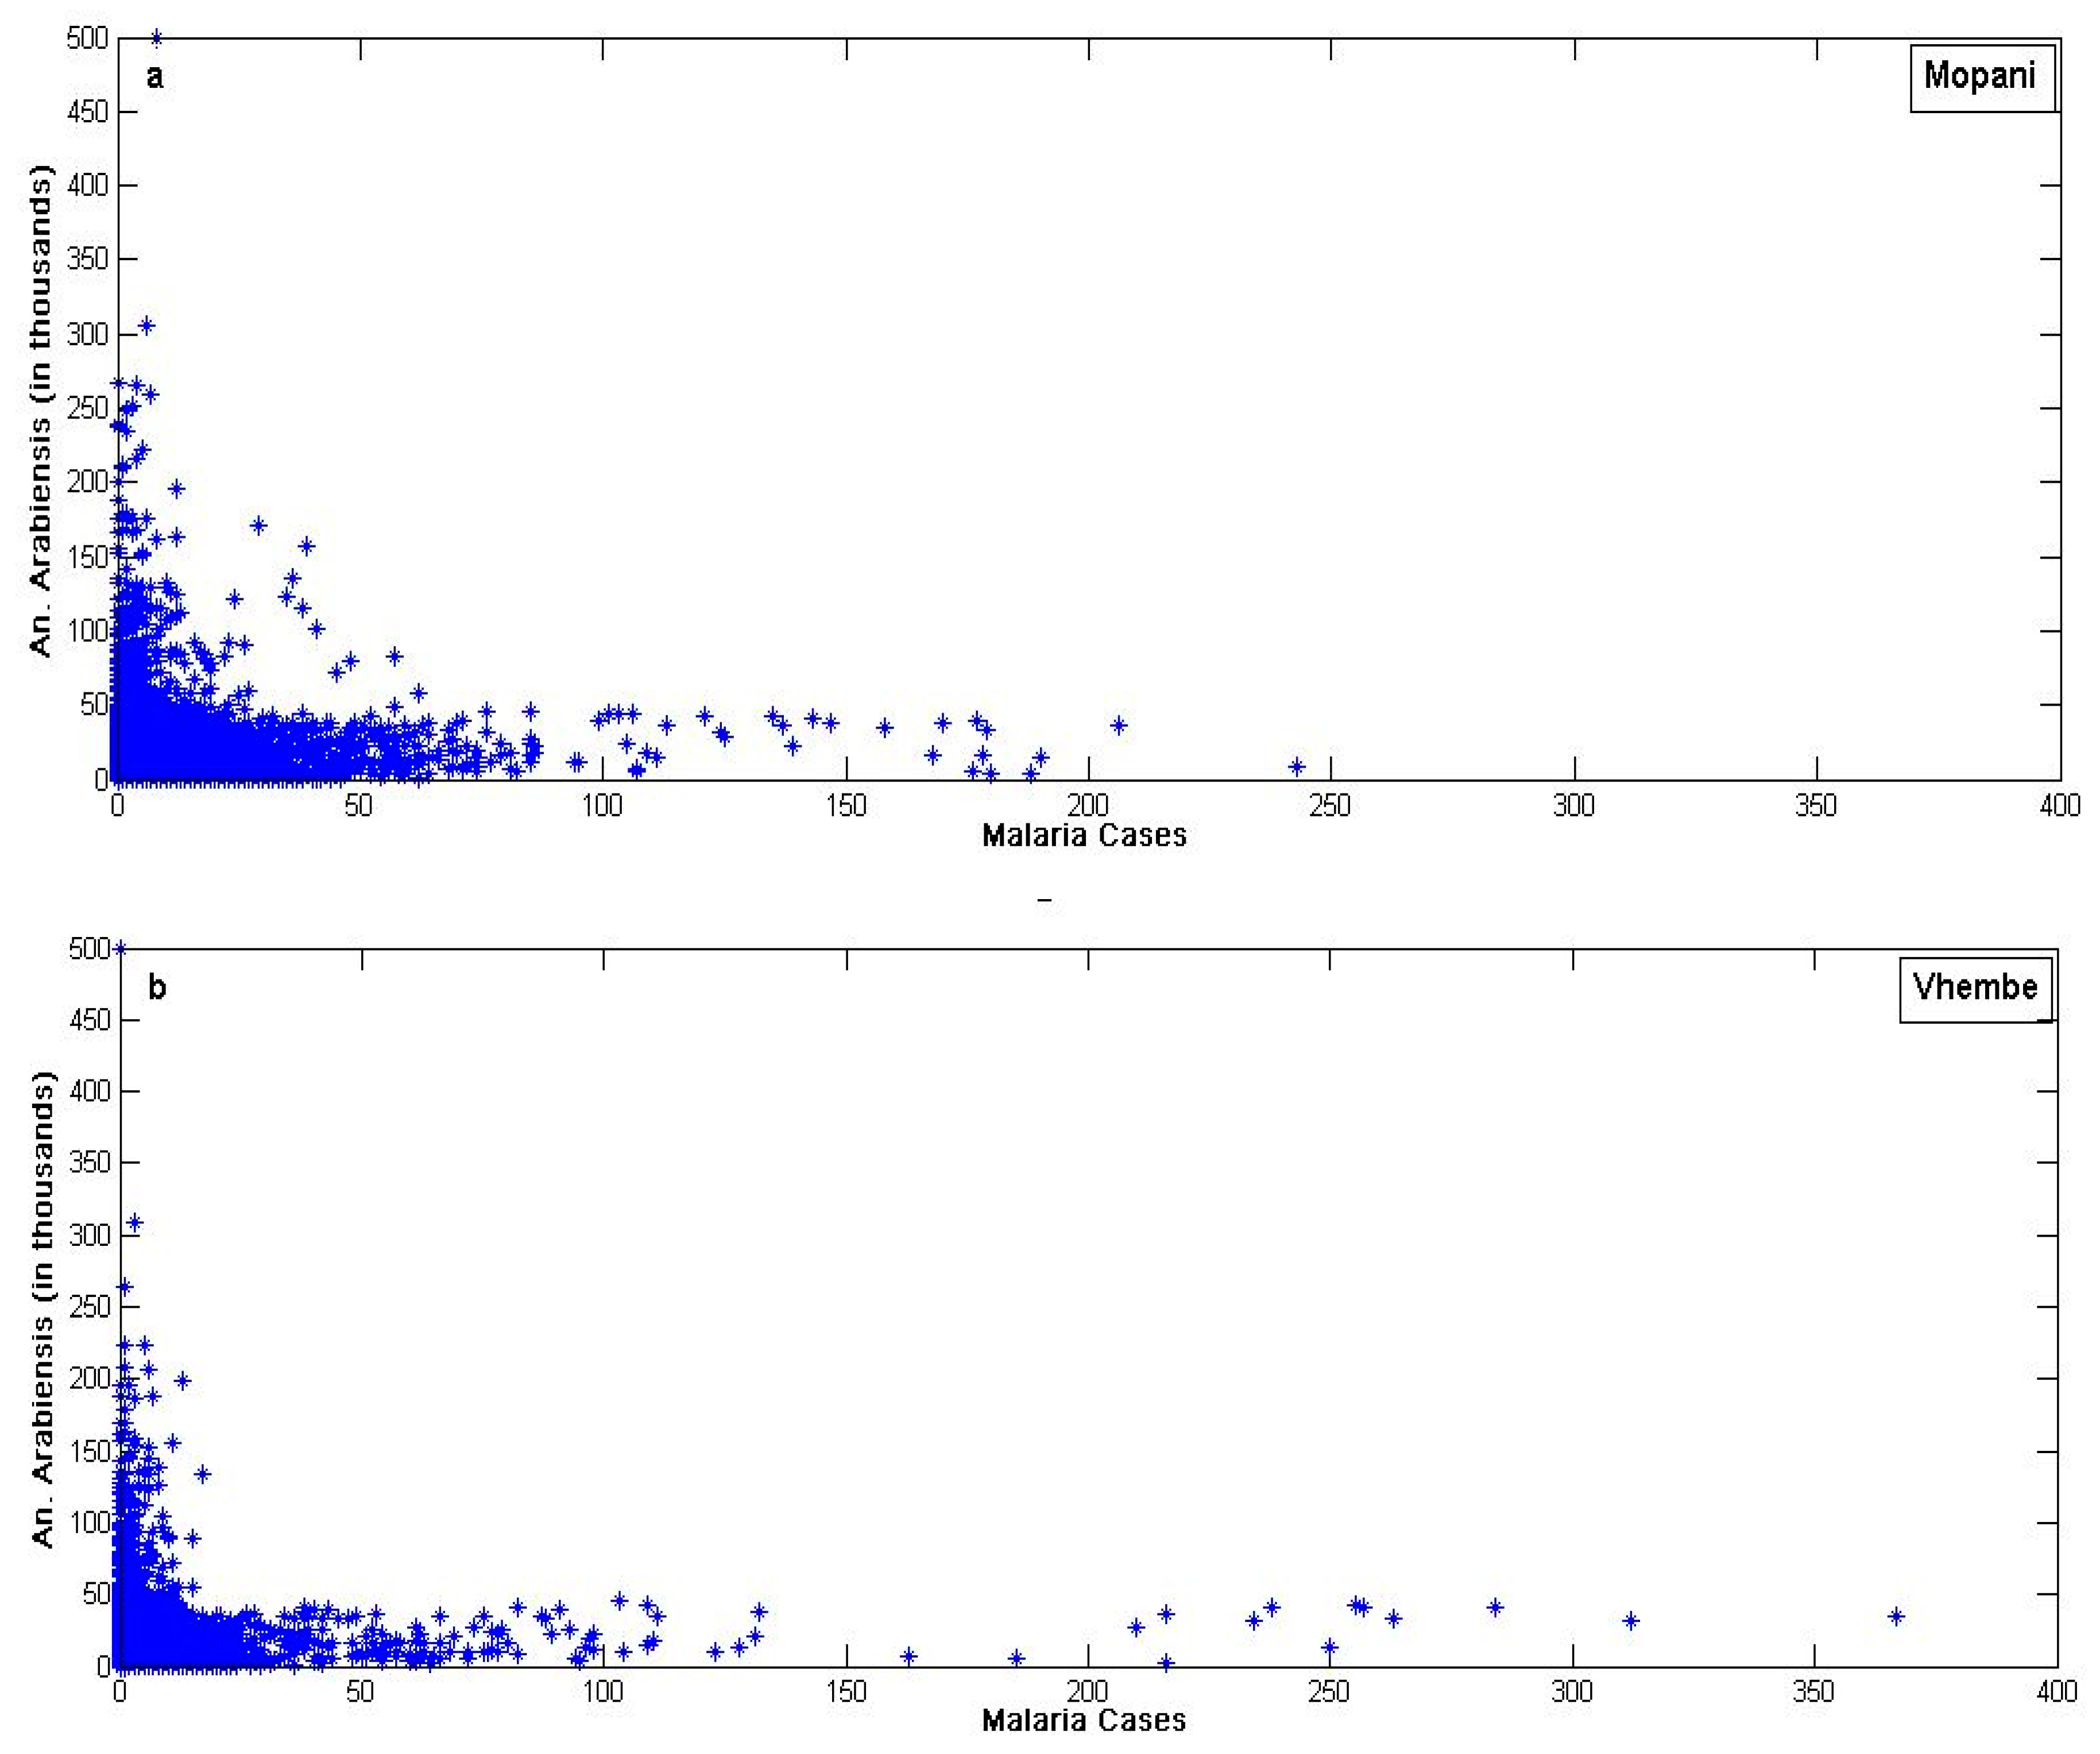
3.4. Mosquito Abundance and Malaria Cases of Mopani and Vhembe
4. Conclusions
Author Contributions
Funding
Acknowledgments
Conflicts of Interest
Availability of data and materials
References
- World Health Organization. WHO Update, World Malaria Report. 2018. Available online: http://www.who.int/mediacentre/factsheets/fs094/en/ (accessed on 4 June 2019).
- National Institute for Communicable Diseases (NICD). Update. 2017. Available online: http://www.nicd.ac.za/wp-content/uploads/2017/05/Malaria-update.pdf (accessed on 4 June 2019).
- Abiodun, G.J.; Maharaj, R.; Witbooi, P.; Okosun, K.O. Modelling the Influence of Temperature and Rainfall on the Population Dynamics of Anopheles Arabiensis. Malar. J. 2016, 15, 364. [Google Scholar] [CrossRef] [PubMed]
- Adeola, A.M.; Botai, J.O.; Rautenbach, H.; Adisa, O.M.; Ncongwane, K.P.; Botai, C.M.; Adebayo-Ojo, T.C. Climatic Variables and Malaria Morbidity in Mutale Local Municipality, South Africa: A 19-Year Data Analysis. Int. J. Environ. Res. Public Health 2017, 14, 1360. [Google Scholar] [CrossRef] [PubMed]
- Munhenga, G.; Brooke, B.D.; Spillings, B.; Essop, L.; Hunt, R.H.; Midzi, S.; Govender, D.; Braack, L.; Koekemoer, L.L. Field study site selection, species abundance and monthly distribution of Anopheline mosquitoes in the northern Kruger National Park, South Africa. Malar. J. 2014, 13, 27. [Google Scholar] [CrossRef] [PubMed]
- Ermert, V.; Fink, A.H.; Morse, A.P.; Paeth, H. The Impact of Regional Climate Change on Malaria Risk Due to Greenhouse Forcing and Land-Use Changes in Tropical Africa. Environ. Health Perspect. 2012, 120, 77. [Google Scholar] [CrossRef] [PubMed]
- Tompkins, A.M.; Ermert, V. A regional-scale, high resolution dynamical malaria model that accounts for population density, climate and surface hydrology. Malar. J. 2013, 12, 65. [Google Scholar] [CrossRef] [PubMed]
- Abiodun, G.J.; Witbooi, P.; Okosun, K.O. Mathematical modelling and analysis of mosquito-human malaria model. Int. J. Ecol. Econom. Stat. 2017, 38, 1–22. [Google Scholar]
- Abiodun, G.J. A Mathematical Model for Studying the Impact of Climate Variability on Malaria Epidemics in South Africa. Ph.D. Thesis, University of the Western Cape, Cape Town, South Africa, 2017. [Google Scholar]
- Abiodun, G.J.; Witbooi, P.; Okosun, K.O. Modelling and analysing the impact of temperature and rainfall on mosquito population dynamics over KwaZulu-Natal Province, South Africa. Int. J. Biomath. 2017, 10, 1750055. [Google Scholar] [CrossRef]
- Abiodun, G.J.; Witbooi, P.; Okosun, K.O. Modelling the Impact of Climatic Variables on Malaria Transmission. Hacettepe J. Math. Stat. 2018, 47, 219–235. [Google Scholar] [CrossRef]
- Abiodun, G.J.; Njabo, K.Y.; Witbooi, P.J.; Adeola, A.M.; Fuller, T.L.; Okosun, K.O.; Makinde, O.S.; Botai, J.O. Exploring the Influence of Daily Climate Variables on Malaria Transmission and Abundance of Anopheles Arabiensis over Nkomazi Local Municipality, Mpumalanga Province, South Africa. J. Environ. Public Health 2018, 2018, 1–10. [Google Scholar] [CrossRef]
- Craig, M.H.; Snow, R.W.; Le Sueur, D. A Climate-Based Distribution Model of Malaria Transmission in Sub-Saharan Africa. Parasitol. Today 1999, 15, 105–111. [Google Scholar] [CrossRef]
- Hoshen, M.B.; Morse, A.P. A Weather-Driven Model of Malaria Transmission. Malar. J. 2004, 3, 32. [Google Scholar] [CrossRef] [PubMed]
- Briët, O.J.T.; Vounatsou, P.; Gunawardena, D.M.; Galappaththy, G.N.L.; Amerasinghe, P.H. Models for Short Term Malaria Prediction in Sri Lanka. Malar. J. 2008, 7, 76. [Google Scholar] [CrossRef] [PubMed]
- Wangdi, K.; Singhasivanon, P.; Silawan, T.; Lawpoolsri, S.; White, N.J.; Kaewkungwal, J. Development of Temporal Modelling for Forecasting and Prediction of Malaria Infections Using Time-Series and ARIMAX Analyses: A Case Study in Endemic Districts of Bhutan. Malar. J. 2010, 9, 251. [Google Scholar] [CrossRef] [PubMed]
- Anwar, M.Y.; Lewnard, J.A.; Parikh, S.; Pitzer, V.E. Time Series Analysis of Malaria in Afghanistan: Using ARIMA Models to Predict Future Trends in Incidence. Malar. J. 2016, 15, 566. [Google Scholar] [CrossRef] [PubMed]
- Arab, A.; Jackson, M.C.; Kongoli, C. Modelling the Effects of Weather and Climate on Malaria Distributions in West Africa. Malar. J. 2014, 13, 126. [Google Scholar] [CrossRef] [PubMed]
- Endo, N.; Eltahir, E.A.B. Environmental Determinants of Malaria Transmission in African Villages. Malar. J. 2016, 15, 578. [Google Scholar] [CrossRef] [PubMed]
- Box, G.; Jenkins, G. Time Series Analysis: Forecasting and Control, 4th ed.; John Wiley & Sons: New York, NY, USA, 2008. [Google Scholar]
- Briët, O.J.T.; Amerasinghe, P.H.; Vounatsou, P. Generalized Seasonal Autoregressive Integrated Moving Average Models for Count Data with Application to Malaria Time Series with Low Case Numbers. PLoS ONE 2013, 8, e65761. [Google Scholar]
- Statistics South Africa: Census Report; South African Statistics: Pretoria, South Africa, 2011; Volume 1.
- Van Buuren, S.; Groothuis-Oudshoorn, K. Multivariate Imputation by Chained Equations in R. J. Stat. Softw. 2011, 45, 1–67. [Google Scholar]
- Buuren, S.; Groothuis-Oudshoorn, K.; Robitzsch, A.; Doove, L.; Jolani, S. Multivariate Imputation by Chained Equations Date; TNO Prevention and Health: Leiden, The Netherlands, 2014. [Google Scholar]
- Agresti, A. An Introduction to Categorical Data Analysis; John Wiley & Sons, Inc.: Hoboken, NJ, USA, 2007. [Google Scholar]
- Afrane, Y.A.; Little, T.J.; Lawson, B.W.; Githeko, A.K.; Yan, G. Deforestation and Vectorial Capacity of Anopheles Gambiae Giles Mosquitoes in Malaria Transmission, Kenya. Emerg. Infect. Dis. 2008, 14, 1533–1538. [Google Scholar] [CrossRef]
- Beck-Johnson, L.M.; Nelson, W.A.; Paaijmans, K.P.; Read, A.F.; Thomas, M.B.; Bjørnstad, O.N. The Effect of Temperature on Anopheles Mosquito Population Dynamics and the Potential for Malaria Transmission. PLoS ONE 2013, 8, e79276. [Google Scholar] [CrossRef]
- Weiss, D.J.; Bhatt, S.; Mappin, B.; Van Boeckel, T.P.; Smith, D.L.; Hay, S.I.; Gething, P.W. Air Temperature Suitability for Plasmodium Falciparum Malaria Transmission in Africa 2000–2012: A High-Resolution Spatiotemporal Prediction. Malar. J. 2014, 13, 171. [Google Scholar] [CrossRef] [PubMed]
- Ljung, G.M.; Box, G.E.P. On a Measure of Lack of Fit in Time Series Models. Biometrika 1978, 65, 297. [Google Scholar] [CrossRef]
- Pankratz, A. Forecasting with Dynamic Regression Models; John Wiley and Sons: New York, NY, USA, 1991. [Google Scholar]
- Zhou, G.; Minakawa, N.; Githeko, A.K.; Yan, G. Association between Climate Variability and Malaria Epidemics in the East African Highlands. Proc. Natl. Acad. Sci. USA 2004, 101, 2375–2380. [Google Scholar] [CrossRef] [PubMed]
- Burke, A.; Dandalo, L.; Munhenga, G.; Dahan-Moss, Y.; Mbokazi, F.; Ngxongo, S.; Coetzee, M.; Koekemoer, L.; Brooke, B. A New Malaria Vector Mosquito in South Africa. Sci. Rep. 2017, 7, 43779. [Google Scholar] [CrossRef] [PubMed]
- Mayoral/Portfolio Committee; Vhembe District Municipality: Thohoyandou, South Africa, 2016.
- Community Survey 2016: Provincial Profile: Limpopo; Statistics South Africa: Pretoria, South Africa, 2018.
- Vuong, Q.H. Likelihood Ratio Tests for Model Selection and Non-Nested Hypotheses. Econometrica 1989, 57, 307–333. [Google Scholar] [CrossRef]
- Laneri, K.; Paul, R.E.; Tall, A.; Faye, J.; Diene-Sarr, F.; Sokhna, C.; Trape, J.-F.; Rodó, X. Dynamical Malaria Models Reveal How Immunity Buffers Effect of Climate Variability. Proc. Natl. Acad. Sci. USA 2015, 112, 8786–8791. [Google Scholar] [CrossRef] [PubMed]
- Hay, S.I.; Rogers, D.J.; Shanks, G.D.; Myers, M.F.; Snow, R.W. Malaria Early Warning in Kenya. Trends Parasitol. 2001, 17, 95–99. [Google Scholar] [CrossRef]
- Zinszer, K.; Kigozi, R.; Charland, K.; Dorsey, G.; Brewer, T.F.; Brownstein, J.S.; Kamya, M.R.; Buckeridge, D.L. Forecasting Malaria in a Highly Endemic Country Using Environmental and Clinical Predictors. Malar. J. 2015, 14, 245. [Google Scholar] [CrossRef]
- Pascual, M.; Cazelles, B.; Bouma, M.J.; Chaves, L.F.; Koelle, K. Shifting Patterns: Malaria Dynamics and Rainfall Variability in an African Highland. Proc. Biol. Sci. 2008, 275, 123–132. [Google Scholar] [CrossRef]
- Kabanda, T.; Jury, M. Inter-Annual Variability of Short Rains over Northern Tanzania. Clim. Res. 1999, 13, 231–241. [Google Scholar] [CrossRef]
- Clark, C.O.; Webster, P.J.; Cole, J.E. Interdecadal Variability of the Relationship between the Indian Ocean Zonal Mode and East African Coastal Rainfall Anomalies. J. Clim. 2003, 16, 548–554. [Google Scholar] [CrossRef]
- Amekudzi, L.; Yamba, E.; Preko, K.; Asare, E.; Aryee, J.; Baidu, M.; Codjoe, S.; Amekudzi, L.K.; Yamba, E.I.; Preko, K.; et al. Variabilities in Rainfall Onset, Cessation and Length of Rainy Season for the Various Agro-Ecological Zones of Ghana. Climate 2015, 3, 416–434. [Google Scholar] [CrossRef]
| Count Model Coefficients (Negbin with Log Link): | |||||
|---|---|---|---|---|---|
| Estimate | Std. Error | z Value | Pr (>|z|) | Confidence Interval | |
| Intercept | 3.169 | 0.1849 | 17.136 | <2 × 10⁻¹⁶ *** | (2.8066, 3.5314) |
| Daily average temperature at lag 18 | −0.0261 | 0.0085 | −3.074 | 0.0021 ** | (−0.0428, −0.0094) |
| Log(theta) | −0.8459 | 0.0254 | −33.296 | <2 × 10⁻¹⁶ *** | (−0.8957, −0.7961) |
| Zero-Inflation Model Coefficients (Binomial with Logit Link): | |||||
| Estimate | Std. Error | z value | Pr (>|z|) | Confidence Interval | |
| Intercept | 11.2884 | 0.7138 | 15.814 | <2 × 10⁻¹⁶ *** | (9.8894, 12.6874) |
| Daily rain amount at lag 9 | −0.0614 | 0.0297 | −2.072 | 0.0383 * | (−0.1196, −0.0032) |
| Daily rain amount at lag 16 | −0.0688 | 0.0325 | −2.118 | 0.0342 * | (−0.1325, −0.0051) |
| Daily average temperature at lag 9 | −0.1648 | 0.0428 | −3.852 | 0.000117 *** | (−0.2487, −0.0809) |
| Daily average temperature at lag 10 | −0.1197 | 0.0464 | −2.578 | 0.0099 ** | (−0.2106, −0.0288) |
| Daily average temperature at lag 12 | −0.1430 | 0.0328 | −4.356 | 1.32 × 10⁻⁵ *** | (−0.2073, −0.0787) |
| Daily average temperature at lag 15 | −0.0788 | 0.0301 | −2.623 | 0.0087 ** | (−0.1378, −0.0198) |
| Daily average temperature at lag 18 | −0.1359 | 0.033 | −4.124 | 3.73 × 10⁻⁵ *** | (−0.2006, −0.0712) |
| Simulated daily mosquito population at lag 9 | −0.056 | 0.0091 | −6.188 | 6.10 × 10⁻¹⁰ *** | (−0.0738, −0.0382) |
| Simulated daily mosquito population at lag 10 | 0.0359 | 0.0067 | 5.385 | 7.26 × 10⁻⁸ *** | (0.0228, 0.0490) |
| Simulated daily mosquito population at lag 20 | 0.0193 | 0.0048 | 4.032 | 5.53 × 10⁻⁵ *** | (0.0099, 0.0287) |
| Count Model Coefficients (Negbin with Log Link): | |||||
|---|---|---|---|---|---|
| Estimate | Std. Error | z Value | Pr (>|z|) | Confidence Interval | |
| Intercept | 0.8355 | 0.1406 | 5.941 | 2.84 ×10⁻⁹ *** | (0.5599, 1.1112) |
| Daily average temperature at lag 9 | 0.0244 | 0.0083 | 2.924 | 0.00346 ** | (0.0080, 0.0407) |
| Daily average temperature at lag 12 | 0.0187 | 0.0072 | 2.598 | 0.00939 ** | (0.0046, 0.0328) |
| Daily average temperature at lag 14 | 0.0150 | 0.0067 | 2.248 | 0.02460 * | (0.0019, 0.0281) |
| Simulated daily mosquito population at lag 20 | −0.0021 | 0.0009 | −2.361 | 0.01820 * | (−0.0039, −0.0004) |
| Log(theta) | −0.4689 | 0.0217 | −21.616 | <2 × 10⁻¹⁶ *** | (−0.5115, −0.4264) |
| Zero-Inflation Model Coefficients (Binomial with Logit Link): | |||||
| Estimate | Std. Error | z value | Pr (>|z|) | Confidence Interval | |
| Intercept | 9.6683 | 0.7061 | 13.692 | <2 × 10⁻¹⁶ *** | (8.2843, 11.0523) |
| Daily average temperature at lag 10 | −0.2275 | 0.05441 | −4.186 | 2.85 × 10⁻⁵ *** | (−0.3340, −0.1210) |
| Daily average temperature at lag 12 | −0.1224 | 0.04241 | −2.886 | 0.003896 ** | (−0.2055, −0.0393) |
| Daily average temperature at lag 14 | −0.1787 | 0.0417 | −4.282 | 1.85 × 10⁻⁵ *** | (−0.2606, −0.0969) |
| Simulated daily mosquito population at lag 9 | −0.0470 | 0.0124 | −3.784 | 0.000154 *** | (−0.0713, −0.0226) |
| Simulated daily mosquito population at lag 15 | 0.0292 | 0.0059 | 4.986 | 6.16 × 10⁻⁷ *** | (0.0177, 0.0407) |
© 2019 by the authors. Licensee MDPI, Basel, Switzerland. This article is an open access article distributed under the terms and conditions of the Creative Commons Attribution (CC BY) license (http://creativecommons.org/licenses/by/4.0/).
Share and Cite
Abiodun, G.J.; Makinde, O.S.; Adeola, A.M.; Njabo, K.Y.; Witbooi, P.J.; Djidjou-Demasse, R.; Botai, J.O. A Dynamical and Zero-Inflated Negative Binomial Regression Modelling of Malaria Incidence in Limpopo Province, South Africa. Int. J. Environ. Res. Public Health 2019, 16, 2000. https://doi.org/10.3390/ijerph16112000
Abiodun GJ, Makinde OS, Adeola AM, Njabo KY, Witbooi PJ, Djidjou-Demasse R, Botai JO. A Dynamical and Zero-Inflated Negative Binomial Regression Modelling of Malaria Incidence in Limpopo Province, South Africa. International Journal of Environmental Research and Public Health. 2019; 16(11):2000. https://doi.org/10.3390/ijerph16112000
Chicago/Turabian StyleAbiodun, Gbenga J., Olusola S. Makinde, Abiodun M. Adeola, Kevin Y. Njabo, Peter J. Witbooi, Ramses Djidjou-Demasse, and Joel O. Botai. 2019. "A Dynamical and Zero-Inflated Negative Binomial Regression Modelling of Malaria Incidence in Limpopo Province, South Africa" International Journal of Environmental Research and Public Health 16, no. 11: 2000. https://doi.org/10.3390/ijerph16112000
APA StyleAbiodun, G. J., Makinde, O. S., Adeola, A. M., Njabo, K. Y., Witbooi, P. J., Djidjou-Demasse, R., & Botai, J. O. (2019). A Dynamical and Zero-Inflated Negative Binomial Regression Modelling of Malaria Incidence in Limpopo Province, South Africa. International Journal of Environmental Research and Public Health, 16(11), 2000. https://doi.org/10.3390/ijerph16112000


