Effects of Dehydration and Rehydration on Cognitive Performance and Mood among Male College Students in Cangzhou, China: A Self-Controlled Trial


Abstract
1. Introduction
2. Materials and Methods
2.1. Participant Recruitment
2.2. Ethics
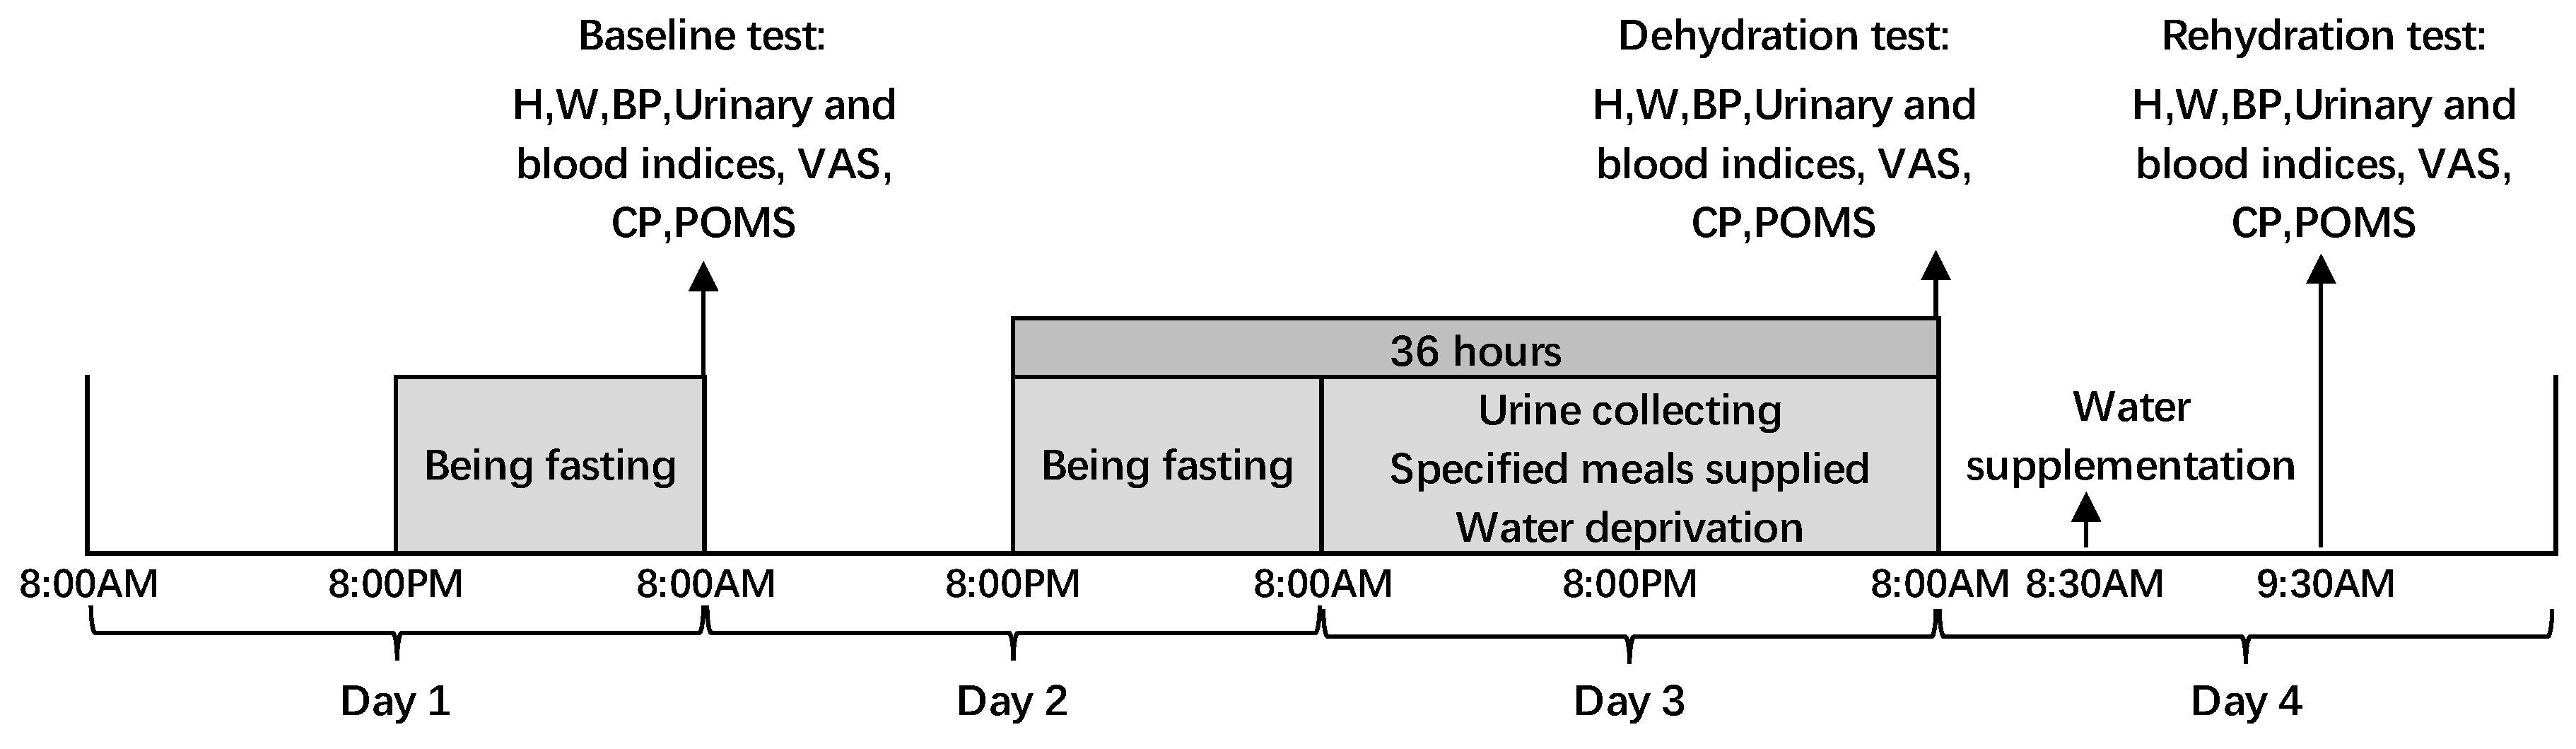
2.3. Study Design
2.4. Study Procedure
2.5. Definition
2.6. Assessment of Water Intake from Foods
2.7. Temperature and Humidity
2.8. Anthropometric Measurements
2.9. Assessment of Urine Biomarkers
2.10. Assessment of Blood Biomarkers
2.11. VAS for Subjective Thirst Sensation
2.12. POMS
2.13. Cognitive Performance
2.14. Statistical Analysis
3. Results
3.1. Characteristics of the Participants
3.2. Temperature and Humidity
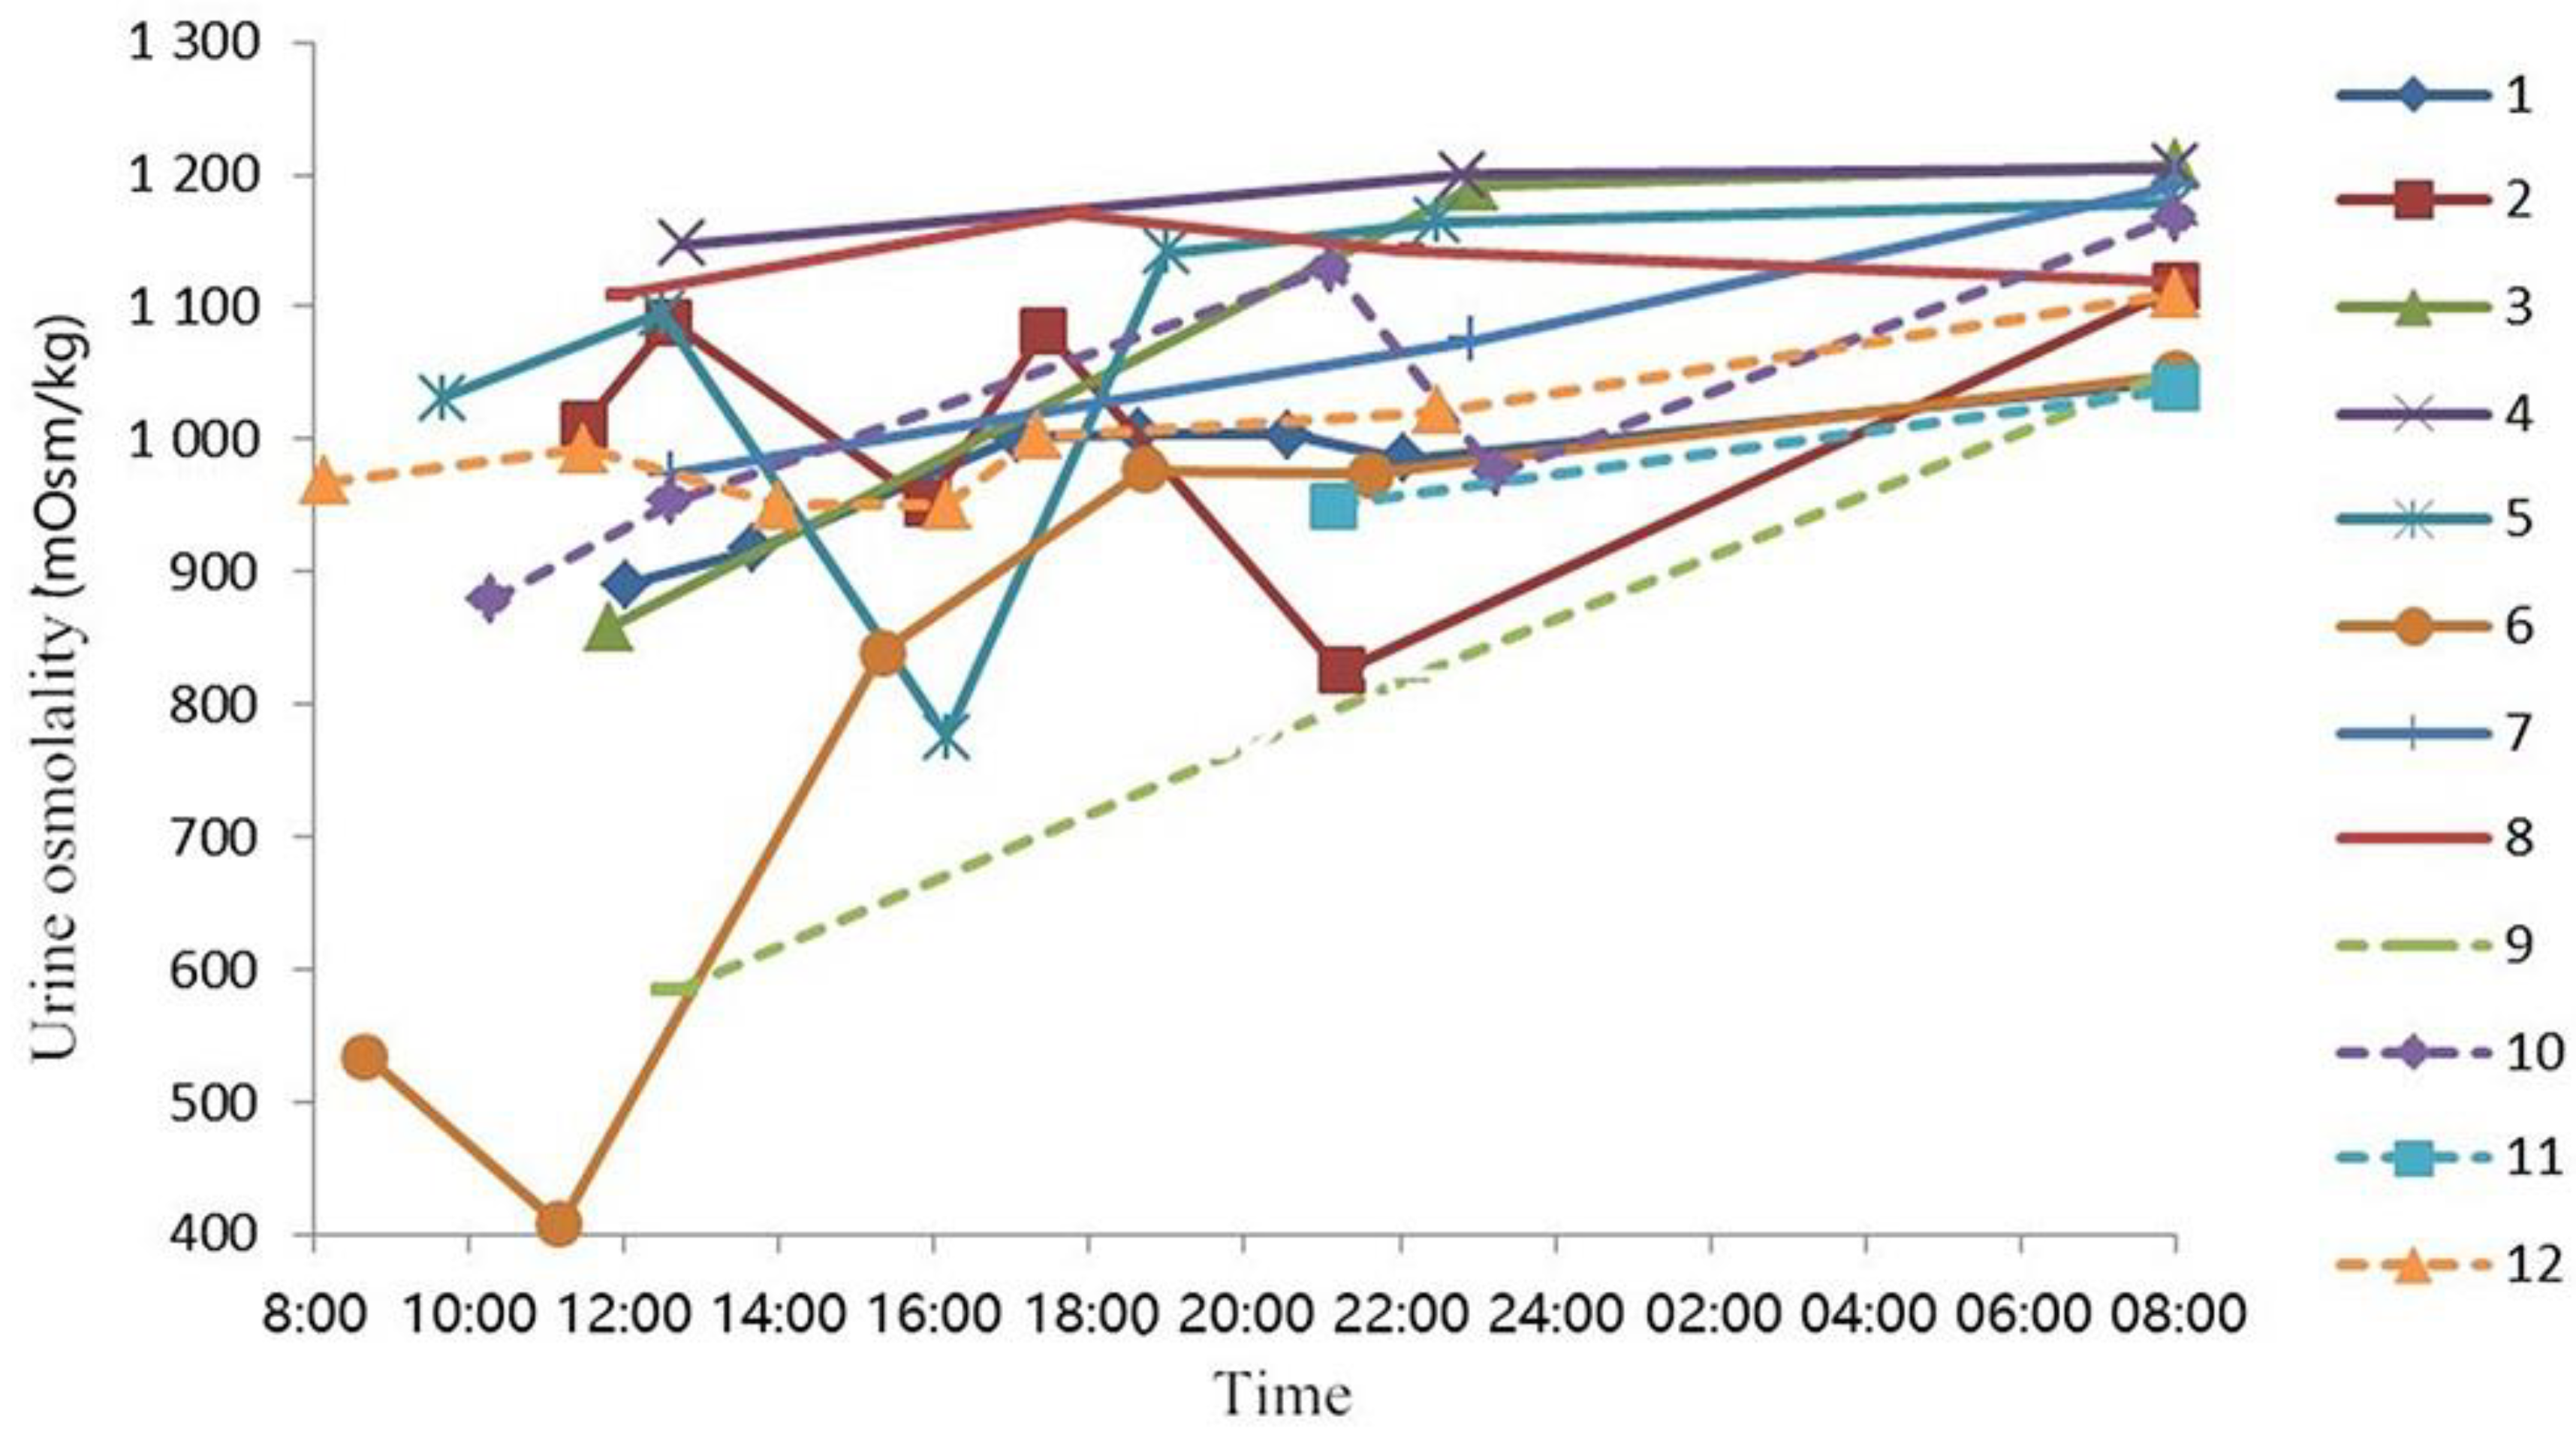
3.3. Fluid from Food, 24 h Urine Volume, Void Number, and Urine Osmolality on Day 3
3.4. Hydration State, Thirst Perception, Related Urine, and Blood Biomarkers
3.5. Effects of Dehydration and Rehydration on POMS
3.6. Effects of Dehydration and Rehydration on Cognitive Performance
4. Discussion
5. Conclusions
Supplementary Materials
Author Contributions
Funding
Acknowledgments
Conflicts of Interest
References
- Popkin, B.M.; D’Anci, K.E.; Rosenberg, I.H. Water, Hydration and Health. Nutr. Rev. 2010, 68, 439–458. [Google Scholar] [CrossRef] [PubMed]
- Benelam, B.; Wyness, L. Hydration and health: A review. Nutr. Bull. 2010, 35, 3–25. [Google Scholar] [CrossRef]
- Péronnet, F. Healthy Hydration for Physical Activity. Nutr. Today 2010, 45, S41–S44. [Google Scholar] [CrossRef]
- Bradley, C.S.; Erickson, B.A.; Messersmith, E.E.; Cameron, A.P.; Lai, H.H.; Kreder, K.J.; Yang, C.C.; Merion, R.M.; Bavendam, T.G.; Kirkali, Z. Evidence for the Impact of Diet, Fluid Intake, Caffeine, Alcohol and Tobacco on Lower Urinary Tract Symptoms: A Systematic Review. J. Urol. 2017, 198, 1010–1020. [Google Scholar] [CrossRef] [PubMed]
- Sontrop, J.M.; Dixon, S.N.; Garg, A.X.; Inmaculada, B.J.; Oriane, D.; Huang, S.H.S.; Clark, W.F. Association between water intake, chronic kidney disease, and cardiovascular disease: A cross-sectional analysis of NHANES data. Am. J. Nephrol. 2013, 37, 434–442. [Google Scholar] [CrossRef] [PubMed]
- Chinese Nutrition Society. Chinese Dietary Reference Intakes 2013; Science press: Beijing, China, 2014; pp. 48–51. [Google Scholar]
- Fadda, R.; Rapinett, G.; Grathwohl, D.; Parisi, M.; Fanari, R.; Calò, C.M.; Schmitt, J. Effects of drinking supplementary water at school on cognitive performance in children. Appetite 2012, 59, 730. [Google Scholar] [CrossRef]
- Armstrong, L.E.; Ganio, M.S.; Casa, D.J.; Lee, E.C.; Mcdermott, B.P.; Klau, J.F.; Jimenez, L.; Le, B.L.; Chevillotte, E.; Lieberman, H.R. Mild dehydration affects mood in healthy young women. J. Nutr. 2012, 142, 382–388. [Google Scholar] [CrossRef] [PubMed]
- Ganio, M.S.; Armstrong, L.E.; Casa, D.J.; McDermott, B.P.; Lee, E.C.; Yamamoto, L.M.; Marzano, S.; Lopez, R.M.; Jimenez, L.; Le Bellego, L.; et al. Mild dehydration impairs cognitive performance and mood of men. Br. J. Nutr. 2011, 106, 1535–1543. [Google Scholar] [CrossRef]
- Cian, C.; Koulmann, N.; Barraud, P.A.; Raphel, C.; Jimenez, C.; Melin, B. Influences of variations in body hydration on cognitive function: Effect of hyperhydration, heat stress, and exercise-induced dehydration. J. Psychophysiol. 2000, 14, 29–36. [Google Scholar] [CrossRef]
- Cian, C.; Barraud, P.A.; Melin, B.; Raphel, C. Effects of fluid ingestion on cognitive function after heat stress or exercise-induced dehydration. Int. J. Psychophysiol. 2001, 42, 243–251. [Google Scholar] [CrossRef]
- Lieberman, H.R.; Bathalon, G.P.; Falco, C.M.; Kramer, F.M.; Rd, M.C.; Niro, P. Severe decrements in cognition function and mood induced by sleep loss, heat, dehydration, and undernutrition during simulated combat. Biol. Psychiatry 2005, 57, 422–429. [Google Scholar] [CrossRef] [PubMed]
- D’Anci, K.E.; Vibhakar, A.; Kanter, J.H.; Mahoney, C.R.; Taylor, H.A. Voluntary dehydration and cognitive performance in trained college athletes. Percept. Mot. Ski. 2009, 109, 251–269. [Google Scholar] [CrossRef]
- Wittbrodt, M.T.; Millardstafford, M.; Sherman, R.A.; Cheatham, C.C. Fluid Replacement Attenuates Physiological Strain Resulting From Mild Hypohydration Without Impacting Cognitive Performance. Int. J. Sport Nutr. Exerc. Metab. 2015, 25, 439–447. [Google Scholar] [CrossRef]
- Trinies, V.; Chard, A.N.; Mateo, T.; Freeman, M.C. Effects of Water Provision and Hydration on Cognitive Function among Primary-School Pupils in Zambia: A Randomized Trial. PLoS ONE 2016, 11, e0150071. [Google Scholar] [CrossRef]
- Sharma, V.M.; Sridharan, K.; Pichan, G.; Panwar, M.R. Influence of heat-stress induced dehydration on mental functions. Ergonomics 1986, 29, 791–799. [Google Scholar] [CrossRef] [PubMed]
- Bandelow, S.; Maughan, R.; Shirreffs, S.; Ozgünen, K.; Kurdak, S.; Ersöz, G.; Binnet, M.; Dvorak, J. The effects of exercise, heat, cooling and rehydration strategies on cognitive function in football players. Scand. J. Med. Sci. Sports 2010, 20, 148–160. [Google Scholar] [CrossRef]
- Ely, B.R.; Sollanek, K.J.; Cheuvront, S.N.; Lieberman, H.R.; Kenefick, R.W. Hypohydration and acute thermal stress affect mood state but not cognition or dynamic postural balance. Eur. J. Appl. Physiol. 2013, 113, 1027–1034. [Google Scholar] [CrossRef]
- Adam, G.; Merullo, D.; Castellani, J.; Lieberman, H.; Sawka, M. Hydration effects on cognitive performance during military tasks in temperate and cold environments. Physiol. Behav. 2008, 93, 748. [Google Scholar] [CrossRef]
- Hwang, J.; Brothers, R.M.; Castelli, D.M.; Glowacki, E.M.; Chen, Y.T.; Salinas, M.M.; Kim, J.; Jung, Y.; Calvert, H.G. Acute high-intensity exercise-induced cognitive enhancement and brain-derived neurotrophic factor in young, healthy adults. Neurosci. Lett. 2016, 630, 247–253. [Google Scholar] [CrossRef]
- Ide, K.; Secher, N.H. Cerebral blood flow and metabolism during exercise. J. Appl. Physiol. 2008, 104, 306. [Google Scholar] [CrossRef]
- Tashiro, M.; Itoh, M.; Fujimoto, T.; Fujiwara, T.; Ota, H.; Kubota, K.; Higuchi, M.; Okamura, N.; Ishii, K.; Bereczki, D. 18F-FDG PET mapping of regional brain activity in runners. J. Sports Med. Phys. Fit. 2001, 41, 11. [Google Scholar]
- Mazlomi, A.; Golbabaei, F.; Dehghan, S.F.; Abbasinia, M.; Khani, S.M.; Ansari, M.; Hosseini, M. The influence of occupational heat exposure on cognitive performance and blood level of stress hormones: A field study report. Int. J. Occup. Saf. Ergon. Jose 2016, 23, 431–439. [Google Scholar] [CrossRef]
- Ma, G.; Zhang, Q.; Liu, A.; Zuo, J.; Zhang, W.; Zou, S.; Li, X.; Lu, L.; Pan, H.; Hu, X. Fluid intake of adults in four Chinese cities. Nutr. Rev. 2012, 70, S105. [Google Scholar] [CrossRef]
- Zhang, N.; Du, S.; Tang, Z.; Zheng, M.; Yan, R.; Zhu, Y.; Ma, G. Hydration, Fluid Intake, and Related Urine Biomarkers among Male College Students in Cangzhou, China: A Cross-Sectional Study-Applications for Assessing Fluid Intake and Adequate Water Intake. Int. J. Environ. Res. Public Health 2017, 14, 513. [Google Scholar] [CrossRef] [PubMed]
- Zhang, N.; Du, S.; Tang, Z.; Zheng, M.; Ma, G. Effect of Water Supplementation on Cognitive Performances and Mood among Male College Students in Cangzhou, China: Study Protocol of a Randomized Controlled Trial. Int. J. Environ. Res. Public Health 2017, 14, 966. [Google Scholar] [CrossRef]
- Baron, S.; Courbebaisse, M.; Lepicard, E.M.; Friedlander, G. Assessment of hydration status in a large population. Br. J. Nutr. 2015, 113, 147–158. [Google Scholar] [CrossRef] [PubMed]
- Stookey, J.D.; Brass, B.; Holliday, A.; Arieff, A. What is the cell hydration status of healthy children in the USA? Preliminary data on urine osmolality and water intake. Public Health Nutr. 2012, 15, 2148–2156. [Google Scholar] [CrossRef]
- Perrier, E.T.; Buendiajimenez, I.; Vecchio, M.; Armstrong, L.E.; Tack, I.; Klein, A. Twenty-Four-Hour Urine Osmolality as a Physiological Index of Adequate Water Intake. Dis. Markers 2015, 2015, 231063. [Google Scholar] [CrossRef]
- Rolls, B.J.; Wood, R.J.; Rolls, E.T.; Lind, H.; Lind, W.; Ledingham, J.G. Thirst following water deprivation in humans. Am. J. Physiol. 1980, 239, 476–482. [Google Scholar] [CrossRef] [PubMed]
- Grove, J.R.; Prapavessis, H. Preliminary evidence for the reliability and validity of an abbreviated profile of mood states. Int. J. Sport Psychol. 1992, 23, 93–109. [Google Scholar]
- Edmonds, C.J.; Crombie, R.; Ballieux, H.; Gardner, M.R.; Dawkins, L. Water consumption, not expectancies about water consumption, affects cognitive performance in adults. Appetite 2013, 60, 148. [Google Scholar] [CrossRef] [PubMed]
- Brukner, P.; Khan, K.; Kron, J. The Encyclopedia of Exercise, Sport and Health; Independent Pub Group: Chicago, IL, USA, 2004. [Google Scholar]
- Griksiene, R.; Ruksenas, O. Cognitive effects of hormone-based contraception in young healthy women. Biologija 2009, 55, 115–124. [Google Scholar] [CrossRef]
- Oliveira, R.M.; Mograbi, D.C.; Gabrig, I.A.; Charchatfichman, H. Normative data and evidence of validity for the Rey Auditory Verbal Learning Test, Verbal Fluency Test, and Stroop Test with Brazilian children. Psychol. Neurosci. 2016, 9, 54–67. [Google Scholar] [CrossRef]
- Erdodi, L.A.; Sagar, S.; Seke, K.; Zuccato, B.G.; Schwartz, E.S.; Roth, R.M. The Stroop test as a measure of performance validity in adults clinically referred for neuropsychological assessment. Psychol. Assess. 2018, 30, 755–766. [Google Scholar] [CrossRef]
- Szinnai, G.; Schachinger, H.; Arnaud, M.J.; Linder, L.; Keller, U. Effect of water deprivation on cognitive-motor performance in healthy men and women. Am. J. Physiol. Regul. Integr. Comp. Physiol. 2005, 289, R275. [Google Scholar] [CrossRef]
- Petri, N.M.; Dropulic, N.; Kardum, G. Effects of voluntary fluid intake deprivation on mental and psychomotor performance. Croat. Med. J. 2006, 47, 855–861. [Google Scholar]
- Smith, M.F.; Newell, A.J.; Baker, M.R. Effect of acute mild dehydration on cognitive-motor performance in golf. J. Strength Cond. Res. 2012, 26, 3075. [Google Scholar] [CrossRef] [PubMed]
- Tang, C.; Zelenak, C.; Völkl, J.; Eichenmüller, M.; Regel, I.; Fröhlich, H.; Kempe, D.; Jimenez, L.; Le, B.L.; Vergne, S. Hydration-sensitive gene expression in brain. Cell. Physiol. Biochem. 2011, 27, 757–768. [Google Scholar] [CrossRef]
- Kempton, M.J.; Ettinger, U.; Schmechtig, A.; Winter, E.M.; Smith, L.; Mcmorris, T.; Wilkinson, I.D.; Williams, S.C.; Smith, M.S. Effects of acute dehydration on brain morphology in healthy humans. Hum. Brain Mapp. 2009, 30, 291–298. [Google Scholar] [CrossRef]
- Irwin, C.; Leveritt, M.; Shum, D.; Desbrow, B. The effects of dehydration, moderate alcohol consumption, and rehydration on cognitive functions. Alcohol 2013, 47, 203–213. [Google Scholar] [CrossRef]
- Edmonds, C.J.; Crosbie, L.; Jacob, N.; Gardner, M. Dose-response effects of water supplementation on cognitive performance in children. Appetite 2016, 101, 230. [Google Scholar] [CrossRef]
- Masento, N.A.; John, A.; Wilton, V.; Benzesin, V.; Field, D.T.; Butler, L.T.; Reekum, C.M.V. Investigating the effects of acute water supplementation on cognitive performance and mood in young and older adults. Appetite 2014, 83, 355. [Google Scholar] [CrossRef]
- Perry, C.S.; Rapinett, G.; Glaser, N.S.; Ghetti, S. Hydration status moderates the effects of drinking water on children’s cognitive performance. Appetite 2015, 95, 520–527. [Google Scholar] [CrossRef] [PubMed]
- Mccartney, D.; Desbrow, B.; Irwin, C. The Effect of Fluid Intake Following Dehydration on Subsequent Athletic and Cognitive Performance: A Systematic Review and Meta-analysis. Sports Med. Open 2017, 3, 13. [Google Scholar] [CrossRef]


| Anthropometric Measurements | Baseline Test | Dehydration Test | Rehydration Test | F | p |
|---|---|---|---|---|---|
| Height (cm) | 176.0 ± 5.5 | 176.0 ± 5.5 | 176.0 ± 5.5 | - | - |
| Weight (kg) | 68.0 ± 10.9 | 67.2 ± 10.5 | 68.4 ± 10.3 | 0.04 | 0.963 |
| BMI (kg/m2) | 21.9 ± 3.0 | 21.6 ± 2.9 | 22.0 ± 2.8 | 0.05 | 0.948 |
| Blood pressure | |||||
| Systolic pressure (mmHg) | 114 ± 7 | 112 ± 8 | 116 ± 8 | 0.914 | 0.411 |
| Diastolic pressure (mmHg) | 75 ± 8 | 73 ± 7 | 75 ± 5 | 0.175 | 0.840 |
| Hydration State and Related Biomarkers | Baseline Test | Dehydration Test | Rehydration Test | F | p |
|---|---|---|---|---|---|
| Blood indices | |||||
| Osmolality (mOsm/kg) | 304.6 ± 7.1 | 305.7 ± 6.4 | 295.3 ± 7.8 # | 11.98 | <0.001 † |
| Glucose (mmol/L) | 4.3 ± 0.3 | 4.5 ± 0.4 | 4.9 ± 0.2 # | 11.67 | <0.001 † |
| Urine indices | |||||
| Osmolality (mOsm/kg) | 803.2 ± 171.7 * | 1123.3 ± 65.7 | 387.0 ± 268.3 # | 49.13 | <0.001 † |
| Thirsty | 3.3 ± 2.2 * | 6.8 ± 2.6 | 1.9 ± 1.5 # | 20.06 | <0.001 † |
| Hydration state | |||||
| Dehydration state | 6 (50.0%) * | 12 (100.0%) | 1 (8.3%) # | 34.58 Ф | <0.001 † |
| Optimal hydration state | 0 (0.0%) * | 0 (0.0%) | 9 (75.0%) # | ||
| Middle hydration state | 6 (50.0%) * | 0 (0.0%) | 2 (16.7%) # |
| POMS | Baseline Test | Dehydration Test | Rehydration Test | F | p |
|---|---|---|---|---|---|
| Tension | 3.4 ± 2.5 | 3.0 ± 3.6 | 1.8 ± 2.7 | 2.21 | 0.134 |
| Anger | 0.9 ± 1.7 | 1.1 ± 1.6 | 0.1 ± 0.3 | 2.26 | 0.092 |
| Fatigue | 2.6 ± 2.0 | 4.3 ± 3.8 | 2.1 ± 3.0 # | 3.93 | 0.035 † |
| Depression | 1.2 ± 1.6 | 2.2 ± 3.1 | 0.9 ± 1.6 | 2.03 | 0.155 |
| Confusion | 2.9 ± 2.2 | 2.8 ± 2.4 | 1.6 ± 1.9 | 2.33 | 0.136 |
| Vigor | 11.9 ± 2.5 * | 8.8 ± 4.5 | 9.8 ± 4.3 | 5.52 | 0.011 † |
| Esteem-related affect | 8.2 ± 2.2 * | 5.7 ± 2.3 | 6.5 ± 2.3 | 7.16 | 0.004 † |
| TMD | 90.9 ± 8.6 | 99.0 ± 17.0 | 90.2 ± 12.3 # | 3.94 | 0.035 † |
| Cognitive Performance | Baseline Test | Dehydration Test | Rehydration Test | F | p |
|---|---|---|---|---|---|
| Digit span | |||||
| Forward score | 7.9 ± 0.9 | 7.7 ± 0.8 | 8.6 ± 0.9 # | 6.39 | 0.007 † |
| Backward score | 6.4 ± 1.3 | 5.7 ± 1.2 | 6.8 ± 1.6 # | 5.01 | 0.016 † |
| Total score | 14.3 ± 1.8 | 13.3 ± 1.4 | 15.4 ± 2.2 # | 15.83 | <0.001 † |
| Digit symbol substitution | |||||
| Correct number (n) | 67.5 ± 6.0 | 70.8 ± 5.4 | 75.4 ± 4.6 # | 14.93 | <0.001 † |
| Dose-work | |||||
| Reading speed (n/min) | 339.9 ± 76.6 * | 339.3 ± 69.8 | 486.4 ± 104.4 # | 43.63 | <0.001 † |
| Error rate (%) | 0.01 ± 0.04 * | 0.16 ± 0.15 | 0.12 ± 0.11 | 5.40 | 0.012 † |
| IMC | 337.3 ± 75.9 | 356.1 ± 83.3 | 450.2 ± 88.4 # | 33.73 | <0.001 † |
| Stroop | |||||
| Reaction time (s) | 30.7 ± 2.6 * | 30.2 ± 2.2 | 28.7 ± 1.7 # | 10.05 | <0.001 † |
| Correct number (n) | 23.3 ± 1.2 | 22.3 ± 1.9 | 23.2 ± 1.2 | 1.69 | 0.200 |
© 2019 by the authors. Licensee MDPI, Basel, Switzerland. This article is an open access article distributed under the terms and conditions of the Creative Commons Attribution (CC BY) license (http://creativecommons.org/licenses/by/4.0/).
Share and Cite
Zhang, N.; Du, S.M.; Zhang, J.F.; Ma, G.S. Effects of Dehydration and Rehydration on Cognitive Performance and Mood among Male College Students in Cangzhou, China: A Self-Controlled Trial. Int. J. Environ. Res. Public Health 2019, 16, 1891. https://doi.org/10.3390/ijerph16111891
Zhang N, Du SM, Zhang JF, Ma GS. Effects of Dehydration and Rehydration on Cognitive Performance and Mood among Male College Students in Cangzhou, China: A Self-Controlled Trial. International Journal of Environmental Research and Public Health. 2019; 16(11):1891. https://doi.org/10.3390/ijerph16111891
Chicago/Turabian StyleZhang, Na, Song M. Du, Jian F. Zhang, and Guan S. Ma. 2019. "Effects of Dehydration and Rehydration on Cognitive Performance and Mood among Male College Students in Cangzhou, China: A Self-Controlled Trial" International Journal of Environmental Research and Public Health 16, no. 11: 1891. https://doi.org/10.3390/ijerph16111891
APA StyleZhang, N., Du, S. M., Zhang, J. F., & Ma, G. S. (2019). Effects of Dehydration and Rehydration on Cognitive Performance and Mood among Male College Students in Cangzhou, China: A Self-Controlled Trial. International Journal of Environmental Research and Public Health, 16(11), 1891. https://doi.org/10.3390/ijerph16111891