Article

Assessing the Impact of Vehicle Speed Limits and Fleet Composition on Air Quality Near a School

1
Department of Civil, Structural and Environmental Engineering, Trinity College Dublin, College Green, Dublin D02 PN40, Ireland
2
Global Centre for Clean Air Research, Department of Civil and Environmental Engineering, Faculty of Engineering and Physical Sciences (FEPS), University of Surrey, Guildford GU2 7XH, UK
3
Department of Planning and Environmental Policy, University College Dublin, Belfield, Dublin D04 V1W8, Ireland
4
Jacobs Engineering Group Inc., Dublin D04 R2C5, Ireland
*
Author to whom correspondence should be addressed.
Int. J. Environ. Res. Public Health 2019, 16(1), 149; https://doi.org/10.3390/ijerph16010149
Submission received: 7 August 2018 / Revised: 14 December 2018 / Accepted: 2 January 2019 / Published: 8 January 2019

Abstract

:
Traffic is a major source of urban air pollution that affects health, especially among children. As lower speed limits are commonly applied near schools in many cities, and different governments have different policies on vehicle fleet composition, this research estimated how different speed limits and fleet emissions affect air quality near a primary school. Based on data of traffic, weather, and background air quality records in Dublin from 2013, traffic, emission, and dispersion models were developed to assess the impact of different speed limits and fleet composition changes against current conditions. Outside the school, hypothetical speed limit changes from 30 km/h to 50 km/h could reduce the concentration of NO2 and PM10 by 3% and 2%; shifts in the fleet from diesel to petrol vehicles could reduce these pollutants by 4% and 3% but would increase the traffic-induced concentrations of CO and Benzene by 63% and 35%. These changes had significantly larger impacts on air quality on streets with higher pollutant concentrations. Findings suggest that both road safety and air quality should be considered when determining speed limits. Furthermore, fleet composition has different impacts on different pollutants and there are no clear benefits associated with incentivising either diesel or petrol engine vehicles.

1. Introduction

Research has shown significant associations between traffic pollution and adverse human health effects related to lung, heart, psychological, and other body systems (e.g., increasing lung cancer, heart disease, dementia, and other health problems) [1,2,3,4,5,6,7,8,9,10,11]. Air pollution is a major environmental problem that causes 6.4 million premature deaths worldwide per year, which is 72% out of 9 million deaths from all types of pollution [12]. Children in particular have been noted to be at high risk of pollution-related disease. Even very low-level exposures to air pollutants during windows of developmental vulnerability can result in disease, disability, and death in childhood and in later life [13]. Traffic related air pollution is not only linked to worsening existing health problems in children, but is also connected with the development of diseases, such as asthma [14]. Traffic related air pollution is harmful to the development of children’s nervous system, causing neurodegeneration, neuro-inflammation, and problems connected to cognition [15,16,17]. Many other problems such as allergy and autism spectrum disorders have been found to be associated with traffic air pollution [18,19].
In Europe, the transport sector contributes approximately 15% of Particulate Matter (PM) emissions and 41% nitrogen oxides (NOX) emissions [20], and thus poses a significant threat to children. In Ireland, road transport contributed 46% of NOX, 26% of PM2.5, and 9% of PM10 in 2014 [21,22].
Many strategies have been investigated which aim at addressing the aforementioned health risks from transport sources and improving air quality. These have involved traffic management strategies, vehicle fleet composition upgrades, land use, and infrastructure optimisation. Traffic management strategies include implementing road or congestion pricing, setting up low emission zones, executing vehicle operating restrictions, optimising traffic signal timing, changing speed limits, encouraging eco-driving, providing pedestrian and bike facilities, and more. A recent review found some limited evidence suggesting that these strategies can reduce total traffic emissions or improve local air quality [23]. For example, increasing the number of electric vehicles in the fleet has been shown to reduce the emissions of both CO2 and PM2.5 [24]. However, Tang et al. [25] illustrated that traffic management strategies implemented in Dublin, Ireland, including changes to the heavy goods vehicle management and road infrastructure, had both positive and negative impacts on air pollution and greenhouse gas (GHG) emissions. Alam & McNabola [26,27] highlighted the limitations and potential negative impacts of Eco-driving on fleet-wide emissions. Ghafghazi & Hatzopoulou [28] found that traffic calming schemes (speed bumps) could increase both NO2 and NOX concentrations. In addition, low emissions zones have been found to bring about positive effects on reducing PM10 and NO2 concentrations in Germany [29], whilst it had no clear effect on PM10 and NO2 concentrations elsewhere [30]. As such, the impact of traffic management strategies on air quality is not always clear and requires careful investigation. Moreover, research has found that both positive and negative impacts can be brought about by similar strategies [23]. It was suggested that the impact of similar strategies may vary from case to case. Therefore, the impacts of traffic management should be scrutinized in each case.
Since it is evident that traffic air pollution is harmful to human health, especially in children, the impact of traffic management strategies on air quality near schools is worthy of investigation. Reductions in speed limits near schools are commonly implemented for traffic safety reasons, yet the air quality impact of this measure is unclear and not often considered.
Traffic conditions are important for the accuracy of evaluating traffic management strategies. In this paper, we utilized a traffic model and an emission and dispersion model to estimate the air quality conditions in the vicinity of a school in Dublin (Ireland) across a particular year (2013, see below for justification), based on traffic count records, background pollutant concentrations, meteorological data, and the topography of the area near the school. We evaluated a number of traffic management strategies that could have impacts on air quality near the school (i.e., different speed limit settings and fleet changes). Predicted air quality impacts of traffic management changes were compared against current conditions.
Assessing the effect of these elements helps increase the awareness of policy makers as to the extent to which these strategies influence air quality, and enables informed evaluation of whether it is worthwhile to apply these strategies to improve children’s health.

2. Research Methodology

A modelling chain approach was applied to evaluate the traffic and air quality conditions near a school, and to estimate potential impacts of changes in speed limits and fleet composition on air quality. The year 2013 was chosen for the analysis as it had the most complete and up to date dataset available. The area selected for the case study contained a primary school (children aged 4–11) located in Dublin City centre in Ireland (Figure 1). Road-side air quality monitoring has been conducted 200 m to the east of the school as part of the fixed site air quality monitoring network within Dublin [31]. Section 2.1 discusses the model development and the data used for the estimation of air quality. Section 2.2 describes the hypothetical scenarios that were used to estimate the impact of speed limit and fleet composition changes.

2.1. Model Development

The modelling chain comprised a traffic model and an emission and dispersion model (See Figure 2). The size of the modelled area was approximately 40 hectares. A primary school was located at the centre of the modelling area. This area was chosen to represent the vicinity of the school, and the traffic and air quality conditions around the school. Distance–decay studies on traffic air pollutant concentrations have found that motorways have impacts on concentrations of NOX and PM typically up to 200m away from the roadside [6]. Roads in the city centre generally have lower traffic volumes than motorways, and a street canyon topography is often present, which concentrates the air pollution and prevents it from dispersing freely. Therefore, roads in the city centre have a smaller area of influence compared to motorways. In addition, many pupils of the school live within the modelled area, and thus its air quality is crucial for their health.
The traffic model was developed in VISUM [32] and was used to assess the traffic volume and vehicle speed on the road network. The traffic condition outputs from the traffic model were used as an important input to the emission and dispersion model, which was developed using the Operational Street Pollution Model (OSPM) [33]. The methodology for emission calculations and emission factors for different types of vehicles that were applied in OSPM were based on the European Emission Model COPERT4 [34]. The study focused on hourly pollutant concentration predictions across a full year, and the implementation of a traffic assignment model (VISUM) and emission calculation method based on hourly average speed (COPERT4) complied with the objective of the study. The details of the development of the traffic model, and the emission and dispersion model, are explained in the following subsections.

2.1.1. Traffic Model

The flow chart of the traffic model is illustrated as part of the modelling chain in Figure 2. The traffic model estimated traffic volume and traffic speed based on speed limit and traffic condition inputs on each road in the network. VISUM was chosen as the traffic model because of the flexibility to adjust traffic volume based on traffic count, and the ability to use Python script to control the modelling process.
The road network was developed in VISUM to represent the roads of the modelling area shown in Figure 1. The original travel demand was presented as an OD matrix for the modelled area and was derived from a traffic model for the city, developed by Tang et al. [25]. This traffic model for the city was obtained by extracting Dublin city from the National Transport Model (NTpM) of Ireland and was calibrated with the annual average traffic count records of 2013 for roads in Dublin.
The original OD matrix was then calibrated with traffic count data throughout the year 2013 to obtain a more precise travel demand. The traffic count data were derived from hourly traffic counter data from Dublin City Council (DCC). The traffic conditions for weekdays during ten months of 2013—excluding July and August—were modelled to represent the days when the traffic pollution in the modelled area were of most relevance to pupils in the school (pupils did not attend school during weekends or in the summer holiday months of July and August). The traffic model was calibrated using one week of hourly traffic data from every two-month period in 2013. Analysis was conducted using a Python script because of the large amount of data involved in hourly travel data across a full year. The traffic data involved in the calibration were chosen to be representative of various traffic conditions throughout the school year (i.e., they included all weekdays, rainy and sunny days, spring, autumn, and winter periods).
During the calibration process, the original OD matrix was assigned to roads to obtain traffic volumes using a user-equilibrium assignment approach. Then the assigned volumes were compared to traffic counts and adjustments were made to OD matrices to obtain more accurate results. This step of the assignment of the OD matrix to roads, the comparison between the assigned volumes and traffic counts, and the adjustment of the OD matrix was repeated several times to obtain an accurate matrix to reflect the traffic condition for each hour corresponding to traffic count data. In this process, traffic count data had to be set as an input to VISUM for each hour at several roads. A second Python script was established to conduct this iterative process automatically. A validation process of the traffic volume was performed after the calibration process. Hourly traffic count data for 600 h of 37 roads were derived from DCC, among which 35 were chosen for calibration and the remaining 2 were reserved for validation. Roads that were calibrated and validated are indicated in Figure 1 with red and cyan colours, respectively.
The Geoff Havers (GEH) statistic was chosen to evaluate the validation. A guidance regulated in the Design Manual for Roads and Bridges (DMRB) in the United Kingdom was chosen as the criteria for the validation [36]. The calculation of GEH and the criteria is summarized in Table 1.
During the assignment process, the traffic volume on each road was determined not only by the OD matrices but also influenced by the relationship between traffic volume and speed, which was represented by a volume-delay function (VDF). A logistic form of the VDF was adopted as it was found to be more accurate when applied to the prediction of speed measurements in this study, as shown in Equation (1):
t c u r = t 0 + a 1 + f · e b d · s a t
where s a t =   q c · q m a x , tcur represents travel time modelled, t0 represents the free flow travel time, q represents the traffic volume, and qmax represents the road capacity. The values of the parameters in Equation (1) are listed below:
a = 0.1 ,   b = 9 ,   c = 2 ,   d = 28 ,   f = 1
The comparison between the modelled and recorded traffic average speeds and the result of traffic volume validation are presented in Section 3.1.

2.1.2. Dispersion and Emission Model

The flow chart of the emission and dispersion model is also shown in Figure 2. The traffic emissions were calculated in OSPM based on the predicted traffic flow in streets (vehicles/hour), the traffic speed, and the emission factors at certain speeds for particular types of vehicles (g/vehicle/km). Only the exhaust emissions were considered in this study.
The fleet composition was derived from traffic count data and the Irish national fleet composition. Fleet proportions for each category (e.g., cars, buses, and trucks) were derived from the count data (across 2013) in Dublin city centre. Within each category, the percentages for each vehicle sub-category (e.g., petrol > 2.0 l with PC Euro 3 and Diesel > 2.0 l with PC Euro 4) were assumed to be in proportion with the Irish national fleet composition [37], following the same methodology applied by [25]. Summarized fleet data are presented in Table 2. Further details of the fleet data are given in Table A1 in the Appendix A. A 1% composition of benzene in petrol was assumed, in line with the EU regulation [38].
Information on traffic conditions, which included the traffic volume and speed for each hour of the year and fleet composition information, was developed using a third Python script to gather information from the traffic model, and then formatted and inputted into OSPM.
Besides emissions, other inputs to OSPM that influenced pollutant concentrations included road and building geometry information, weather information and background pollutant concentration. These data were obtained from Google Maps, the Irish meteorological service, and the air quality monitoring network of the Environmental Protection Agency of Ireland, respectively. A summary of these elements is shown in Table 3.
In order to facilitate a holistic assessment of traffic emissions, the major harmful pollutants that originate from traffic were included, namely NOX, PM10, PM2.5, CO, and Benzene. Regarding NOX, a special focus was given to the modelling concentrations of NO2 (in the Modelling results section), as NO2 is a major pollutant concerning public health. The modelled concentrations consisted of a background concentration component and a component arising from the local traffic in each road. Whilst the impacts of speed limit and fleet composition changes on the concentrations of NOX, PM10, PM2.5, CO, and Benzene on each road were estimated, background concentrations were only available for PM10 and NOX. Therefore, while total concentrations of NOX and PM10 were modelled, the traffic-induced concentrations of PM2.5, CO, and Benzene were modelled.
In OSPM, concentrations of traffic emissions were calculated using a combination of a plume model for the direct contribution of traffic pollution, and a box model for the recirculating part of the pollutants in the street, taking street canyon geometry into account. The receptors (the points of which pollutant concentrations were estimated) were set to be on the building face in the centre of each street section at a height of 1.2 m. These street sections, with lengths of 80 m to 120 m, constituted the streets shown in Figure 1. The reason that the receptor height was set to 1.2 m was because the age of children in the school in the modelling area was in the range of 4 to 11, and the average height for children in this age range is around 1.2 m in Ireland [39]. The receptor height of the street on which the air quality monitoring site was located was set to 2m, the same height as the as the monitor.

2.2. Scenarios

The air quality conditions estimated from the traffic counts in 2013 near the school were considered as the baseline scenario. The air quality of hypothetical speed limit changes and fleet composition changes were evaluated as alternative scenarios and compared to the baseline. The baseline scenario and six hypothetical scenarios are summarized in Table 4.
At present, diesel cars account for only 3% of total passenger vehicles in the United States and less than 1% in China, whereas this is about 50% in Europe, and it is 45% in Ireland [37,40]. Compared to petrol cars, diesel cars have better fuel economy than petrol-powered cars, thus their emission of CO2 may be lower. However, diesel remains a major source of harmful pollutants (e.g., ozone-forming gases, including NOX and PM) [40]. Therefore, in line with several recent proposals to reduce the prevalence of this source of air pollution in European cities [41], this paper compares the impact on air quality outside a school in an urban setting of converting diesel cars to comparable petrol cars.
Also, Dublin City Council reduced the speed limit within the modelled area from 50 km/h to 30 km/h in 2009 because of road safety considerations within the city centre. This paper, therefore, also assesses the impact of the speed change by modelling the impact of two hypothetical speed limits on air quality.

3. Modelling Results

3.1. The Traffic Model

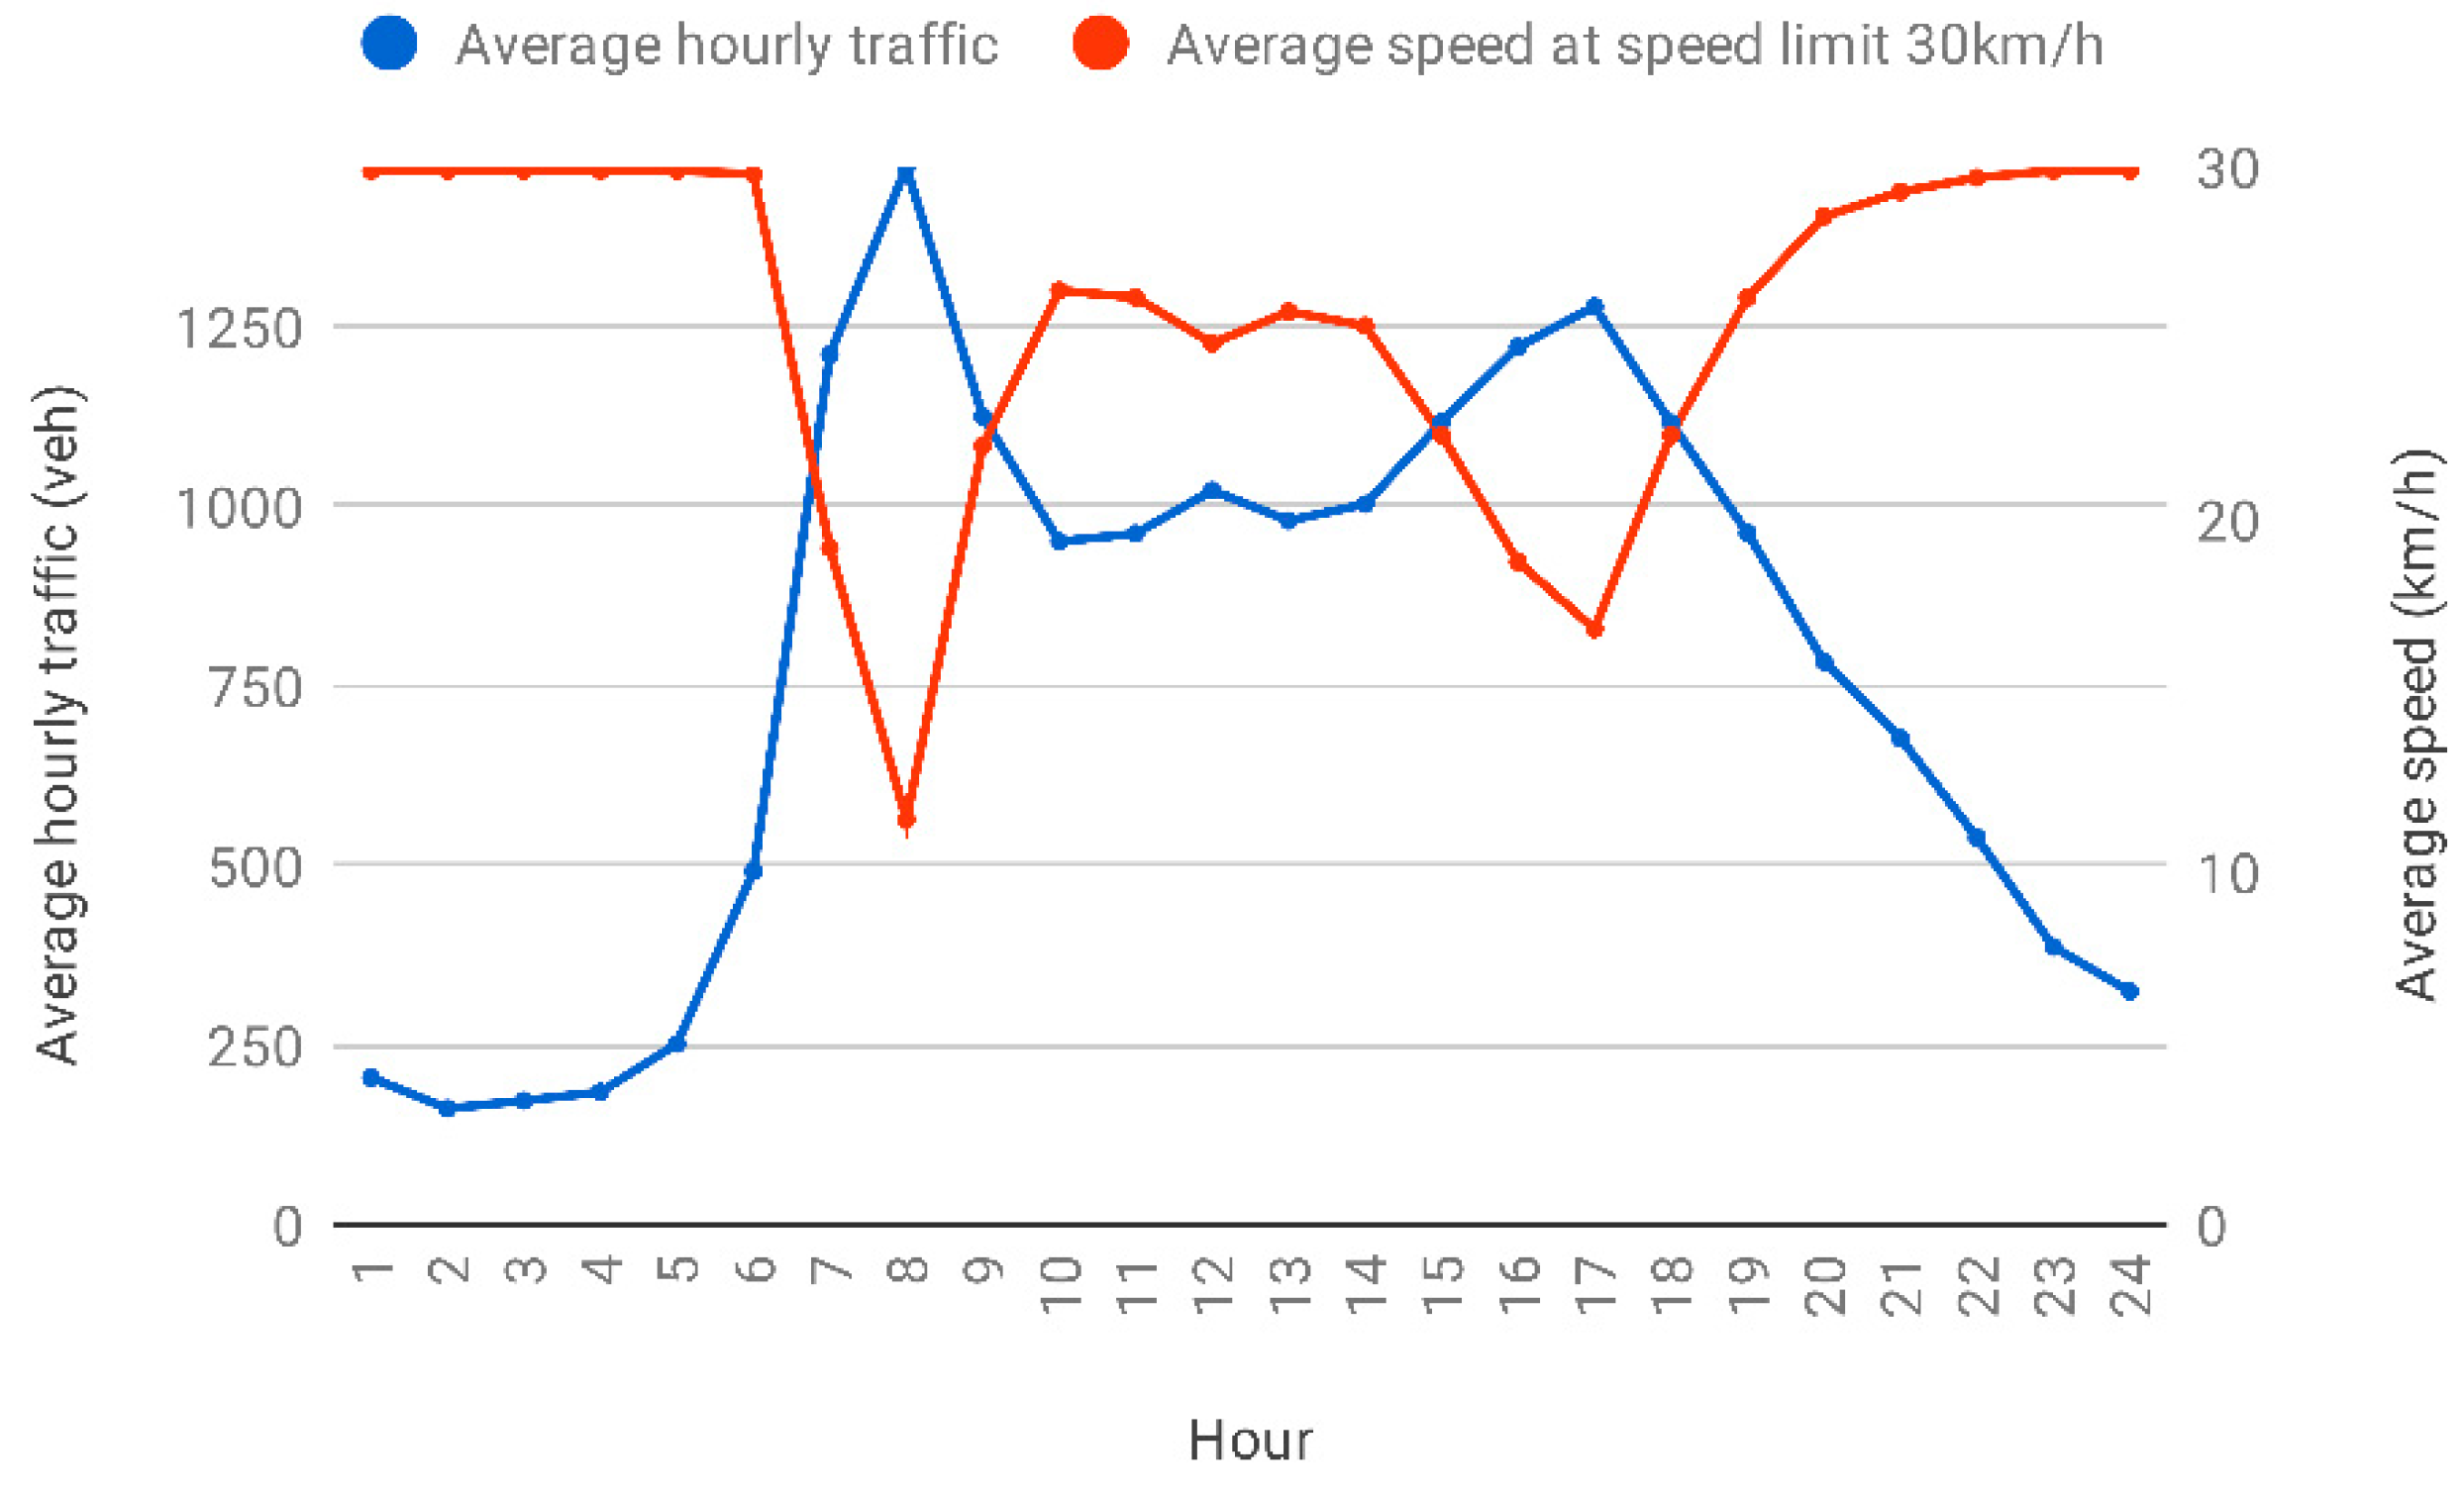
3.1.1. Volumes and Speeds

The average modelled traffic volumes and speeds within the modelled area are summarised in Figure 3, showing the average hourly traffic data and average speed for all road segments within the baseline scenario (speed limits of 30 km/h) during different hours of the day. The average modelled speed at AM peak hour (8 to 9 a.m.) and PM peak hour (5 to 6 p.m.) of 12 km/h and 21 km/h was very similar to the measured average traffic speed in the city centre of 13 km/h and 19 km/h [42]. During off-peak hours, the average modelled speed returned towards the relevant speed limit.

3.1.2. Result of Validation for Traffic Volumes

A summary of validation results, using the GEH statistics approach, is presented in Table 5. The validation satisfied the DMRB criteria shown in Table 1, resulting in a robust model which represented the travel demand after being calibrated using the recorded volumes.

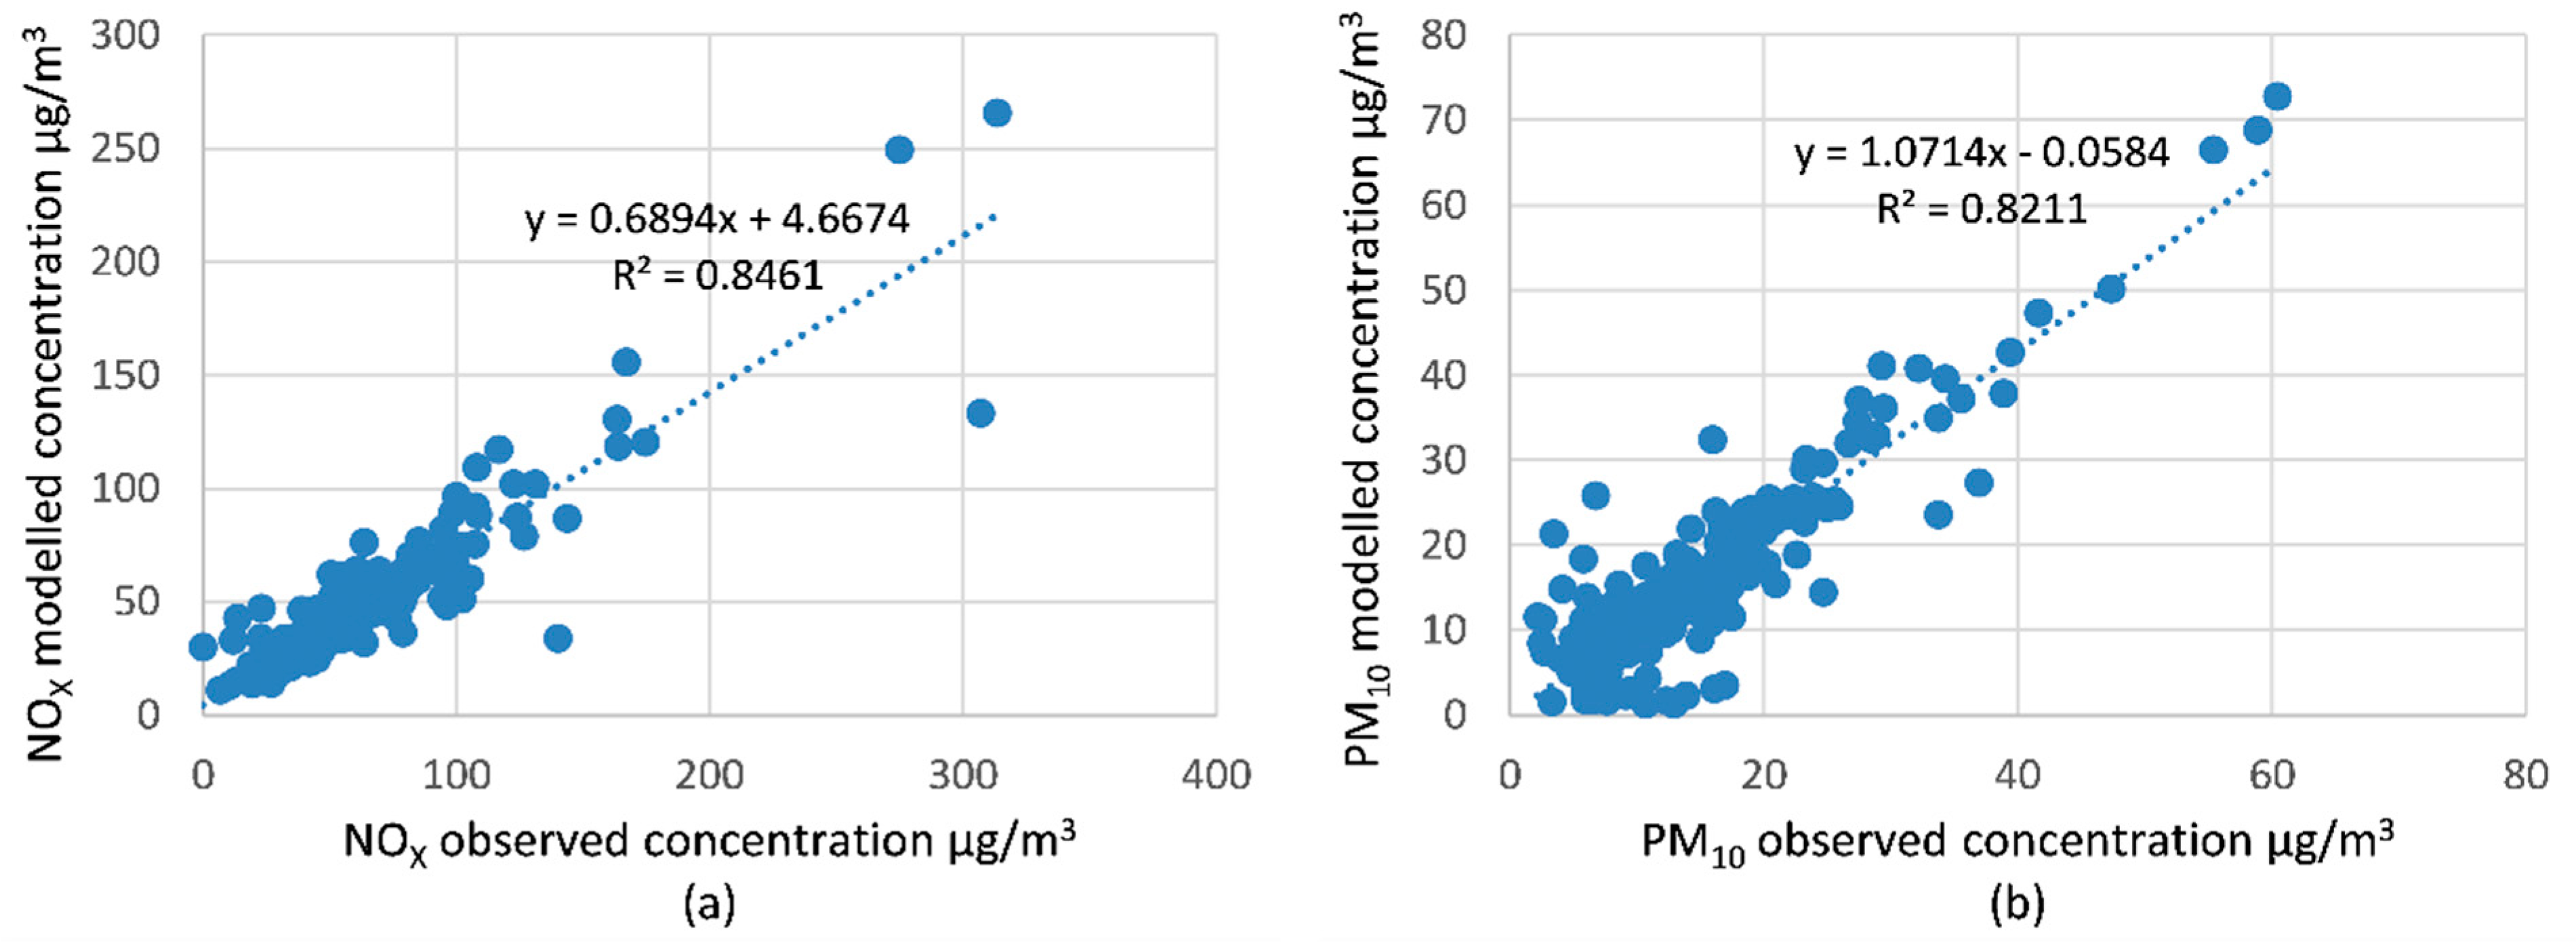
3.2. Dispersion Model Validation

Studies elsewhere have compared and validated local-scale emission and dispersion models (including OSPM) with in-situ measurements and have found a good fit with this modelling approach, especially for annual average concentrations [35]. Figure 4 shows the results of modelled NOX and PM10 daily average concentrations compared against the observed concentrations in Dublin city centre. The modelled concentrations were acquired from the particular road on the network where the monitoring site was located, and also on the side of that road where the monitor was located.
The modelled concentrations fitted the observed concentrations, with an R2 = 0.85 and 0.82 for NOX and PM10, respectively. The modelled PM10 concentrations had good accuracy, with a slope of 1.07. However, the modelled NOX data underestimated the measured concentration, where the slope was 0.69. Previous investigations have found similar underestimations of NOX using the OPSM model [43].

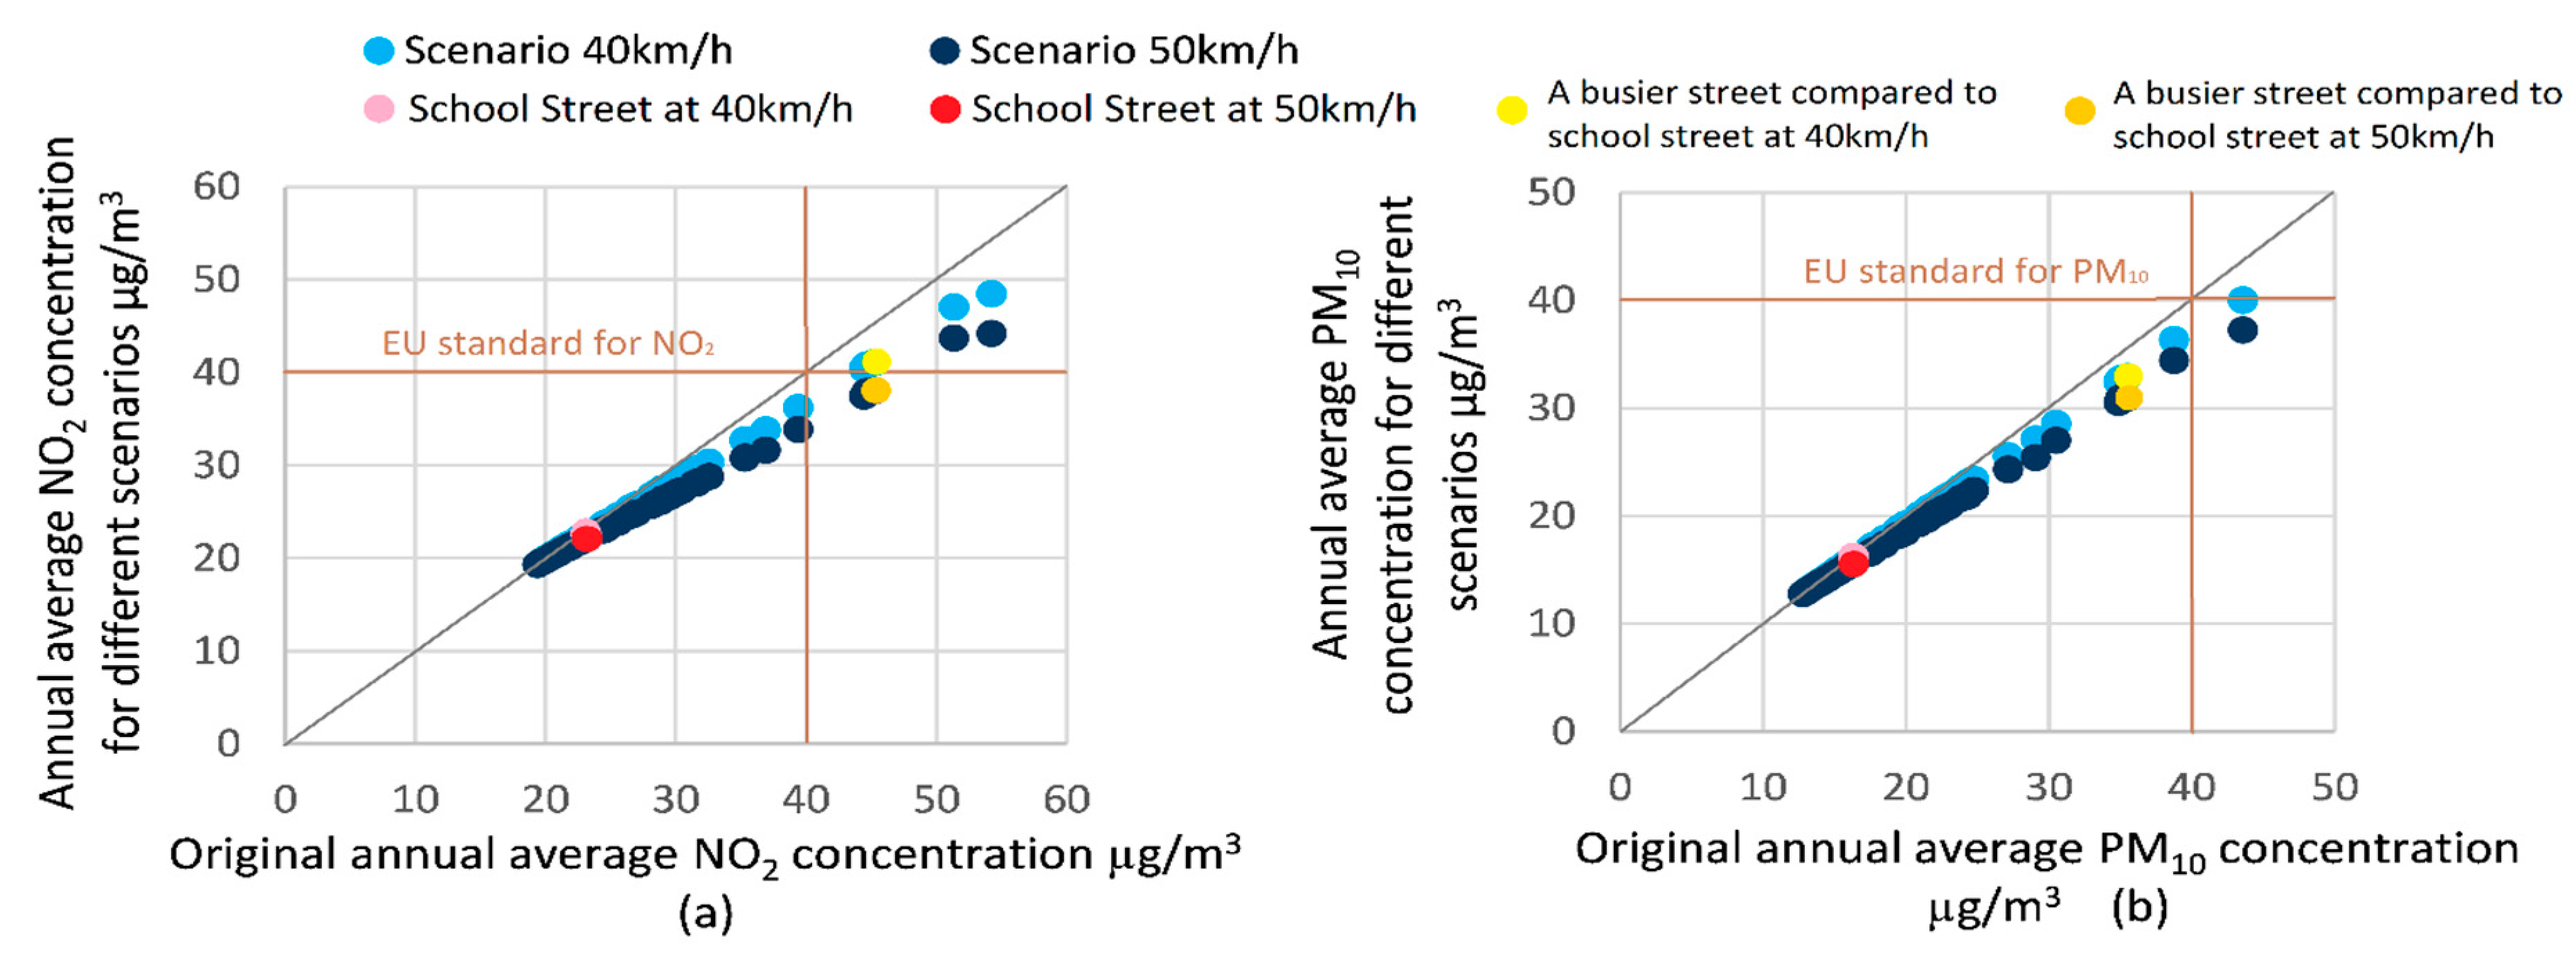
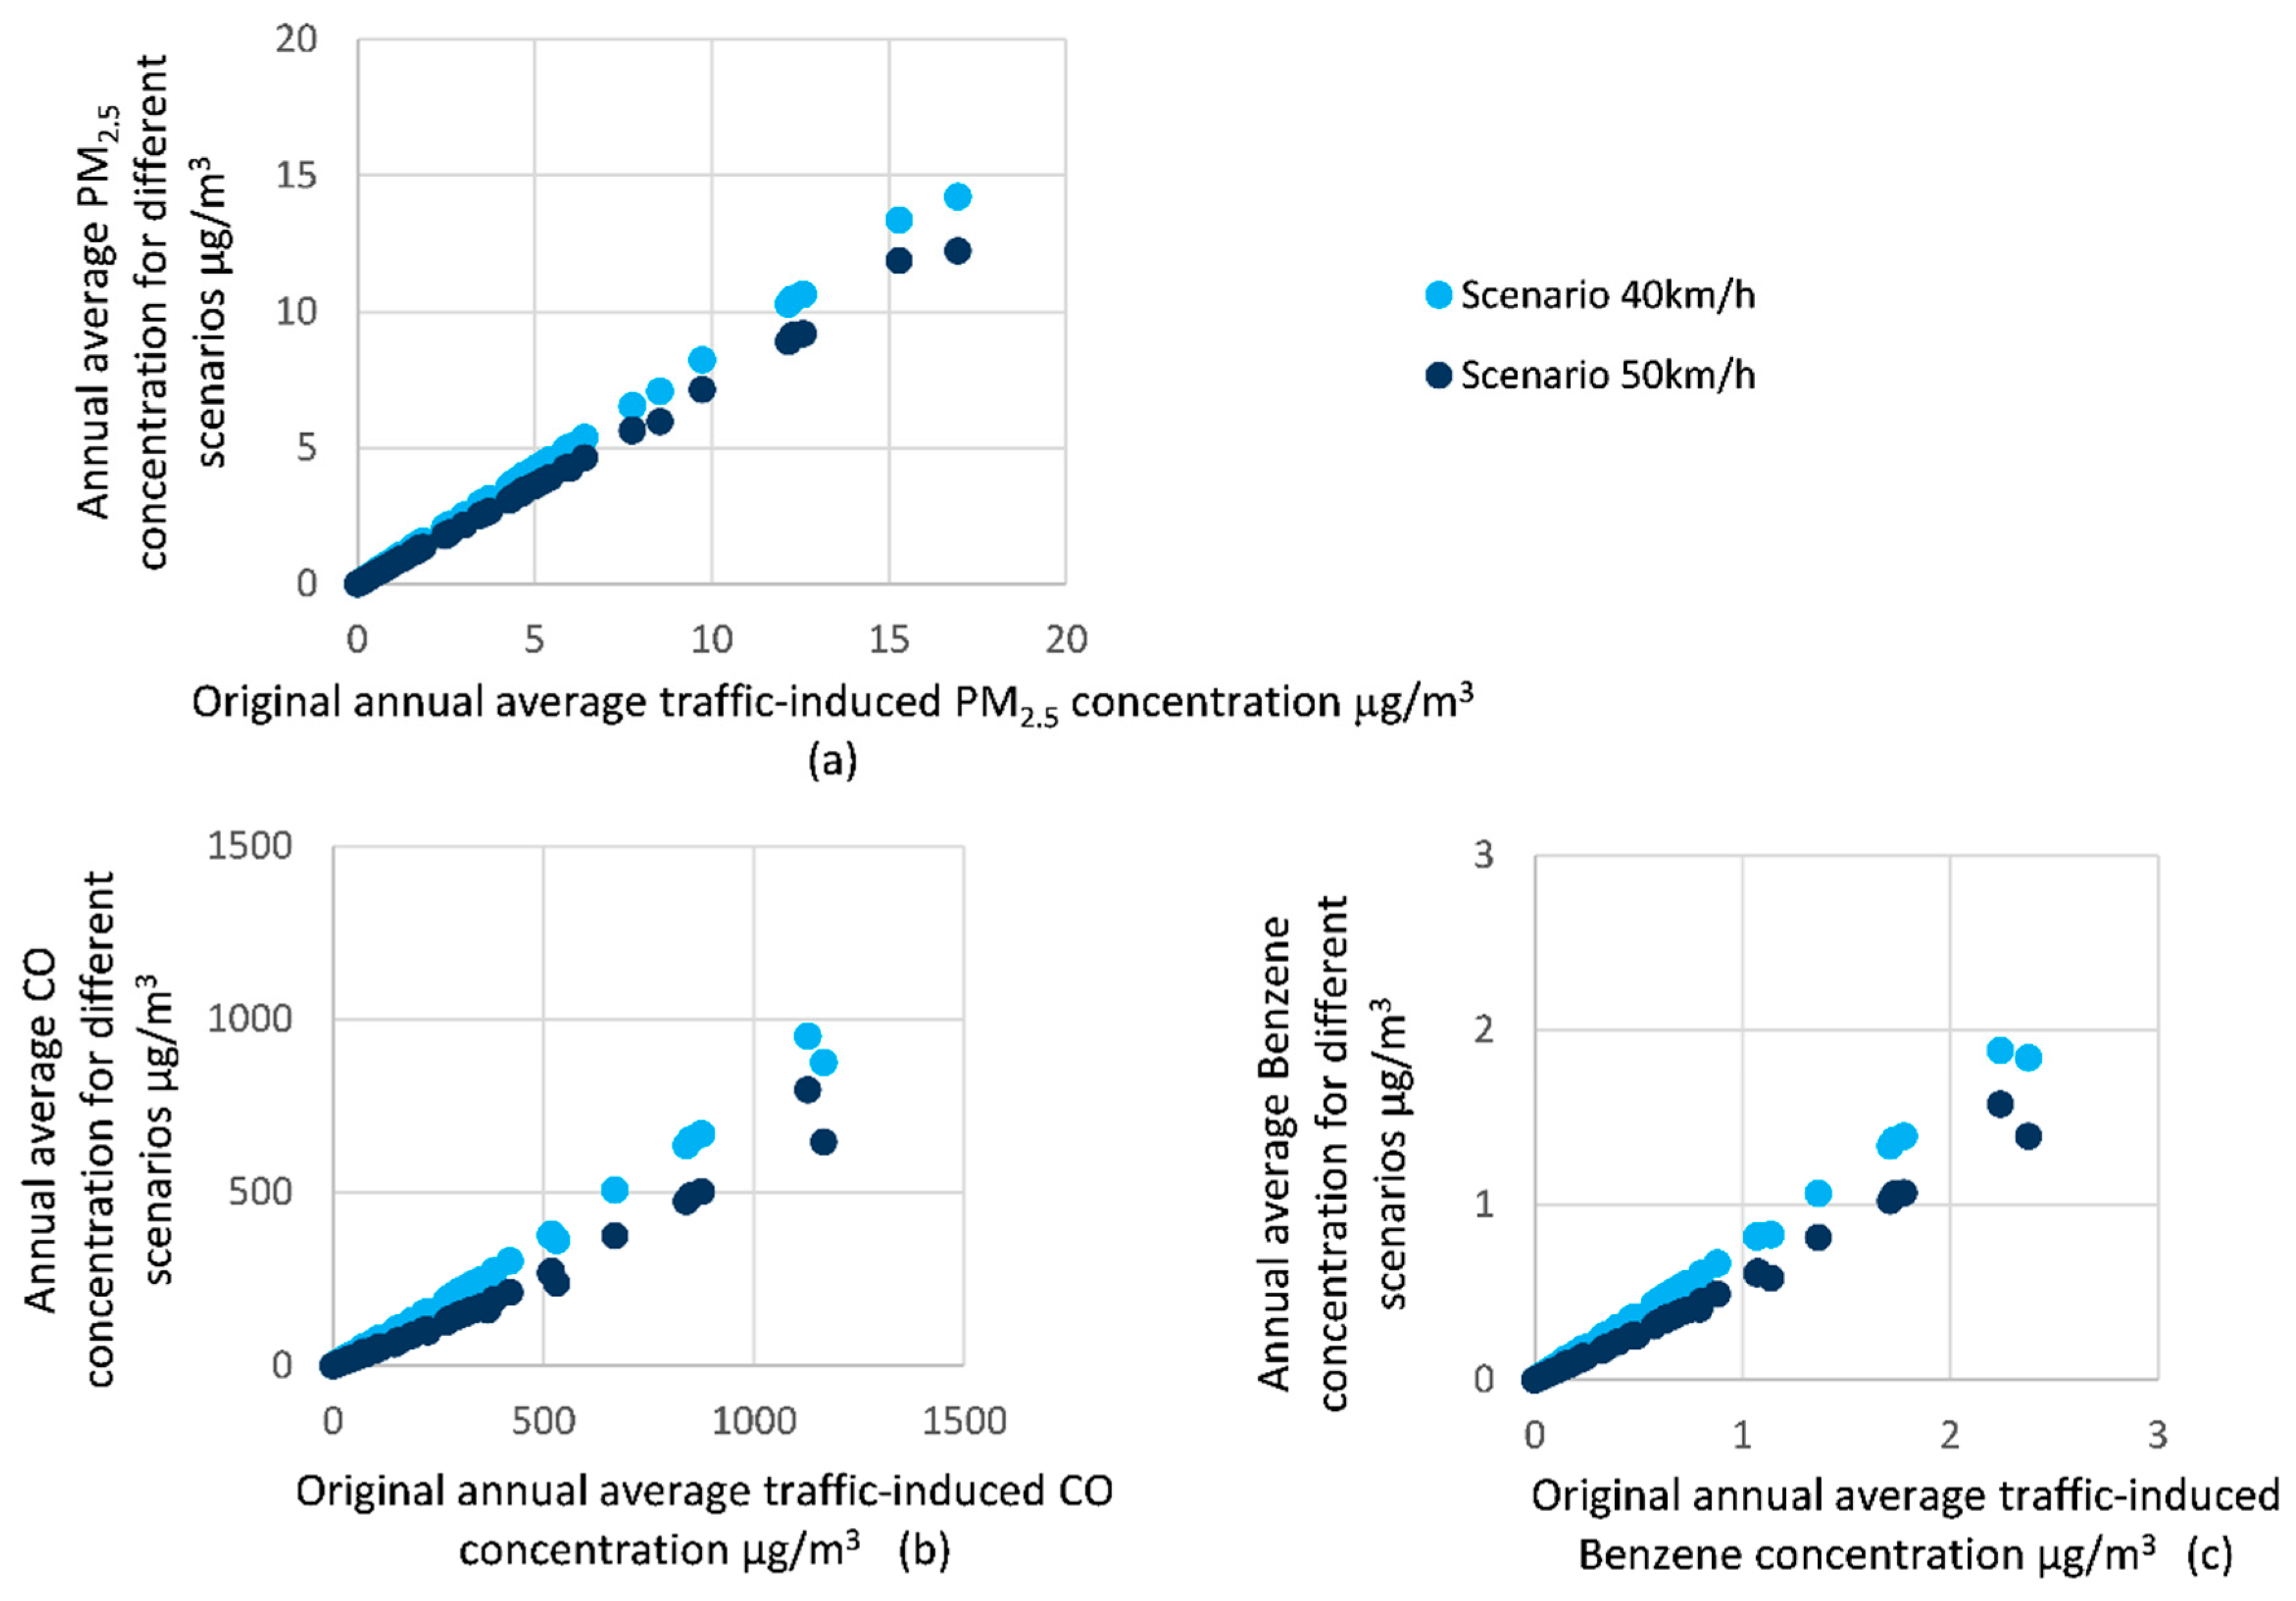
3.3. The Effect of Speed Limit Changes

The modelled impacts of speed limits on the total concentrations of NO2 and PM10 in each street section in the modelled area are summarised in Figure 5a,b. Each individual data point in Figure 5 represents the concentration on a specific road link for the speed limit change scenarios compared to the baseline scenario. The x-axis shows the baseline scenario concentration, and the y-axis shows the concentrations for two speed limit scenarios. A 1:1 relationship between the baseline scenario concentration and the speed limit change scenario is indicated with a grey diagonal line. A light red dot and a dark red dot highlight two speed limit change scenarios for the road on which the school is located. Traffic volumes, and consequently air pollution concentrations, on this street were less than for the majority of road links in the rest of modelled area. The EU air quality standards for annual NO2 and PM10 concentrations are also indicated with brown lines. The impact of speed limits on the traffic-induced concentrations of PM2.5, CO, and Benzene are summarised in Figure A1a–c, respectively, in the Appendix A.
Figure 5 shows a decline in both NO2 and PM10 concentration for scenarios with hypothetical increases of speed limits from 30 km/h to 40 km/h and 50 km/h. The alteration of the speed limit from 30 km/h to 50 km/h could reduce NO2 by up to 18%, depending on the original concentration in the street in the baseline scenario. This action could also reduce PM10 by up to 15%, also depending on the original concentration. The general trend shows that NO2 and PM10 concentrations could be reduced further for the streets that originally had higher NO2 and PM10 concentration. Regarding the traffic-induced concentration, alteration of the speed limit from 30 km/h to 50 km/h could reduce these concentrations of NO2 and PM10 by 21% to 30% and 14% to 22%, respectively, depending on the street in question. As background concentration for different streets was assumed to be the same, the higher the NO2 and PM10 concentration was on the street, the higher the pollutant concentration that was generated by traffic, and therefore, the speed limit change strategy that influences traffic conditions would have a larger effect on the pollutant concentration.
From Figure 5, for both NO2 and PM10, we can see that there were several streets where the original concentration was beyond the EU limit value, and this was predicted to reduce to below the limit as a result of the proposed speed changes. Therefore, the hypothetical speed limit changes modelled here would allow the pollutant concentrations on more streets to adhere to the EU air quality standards.
As the school was located in a place with low traffic volumes and was thus less polluted, the effect of the speed change on air quality was relatively small compared to other streets with heavier pollution. Comparing the speed limit change impact in front of the school with a busier street (yellow dots shown in Figure 5), the predicted concentrations of NO2 and PM10 could only be reduced by a maximum of 3% and 2%, respectively, on the street in front of the school. This corresponded to a 22% and 15% reduction of traffic-induced NO2 and PM10. These figures could be reduced by 15% and 12%, respectively, on the street with higher original pollutant concentration (corresponding to 27% and 19% reduction of traffic-induced NO2 and PM10).

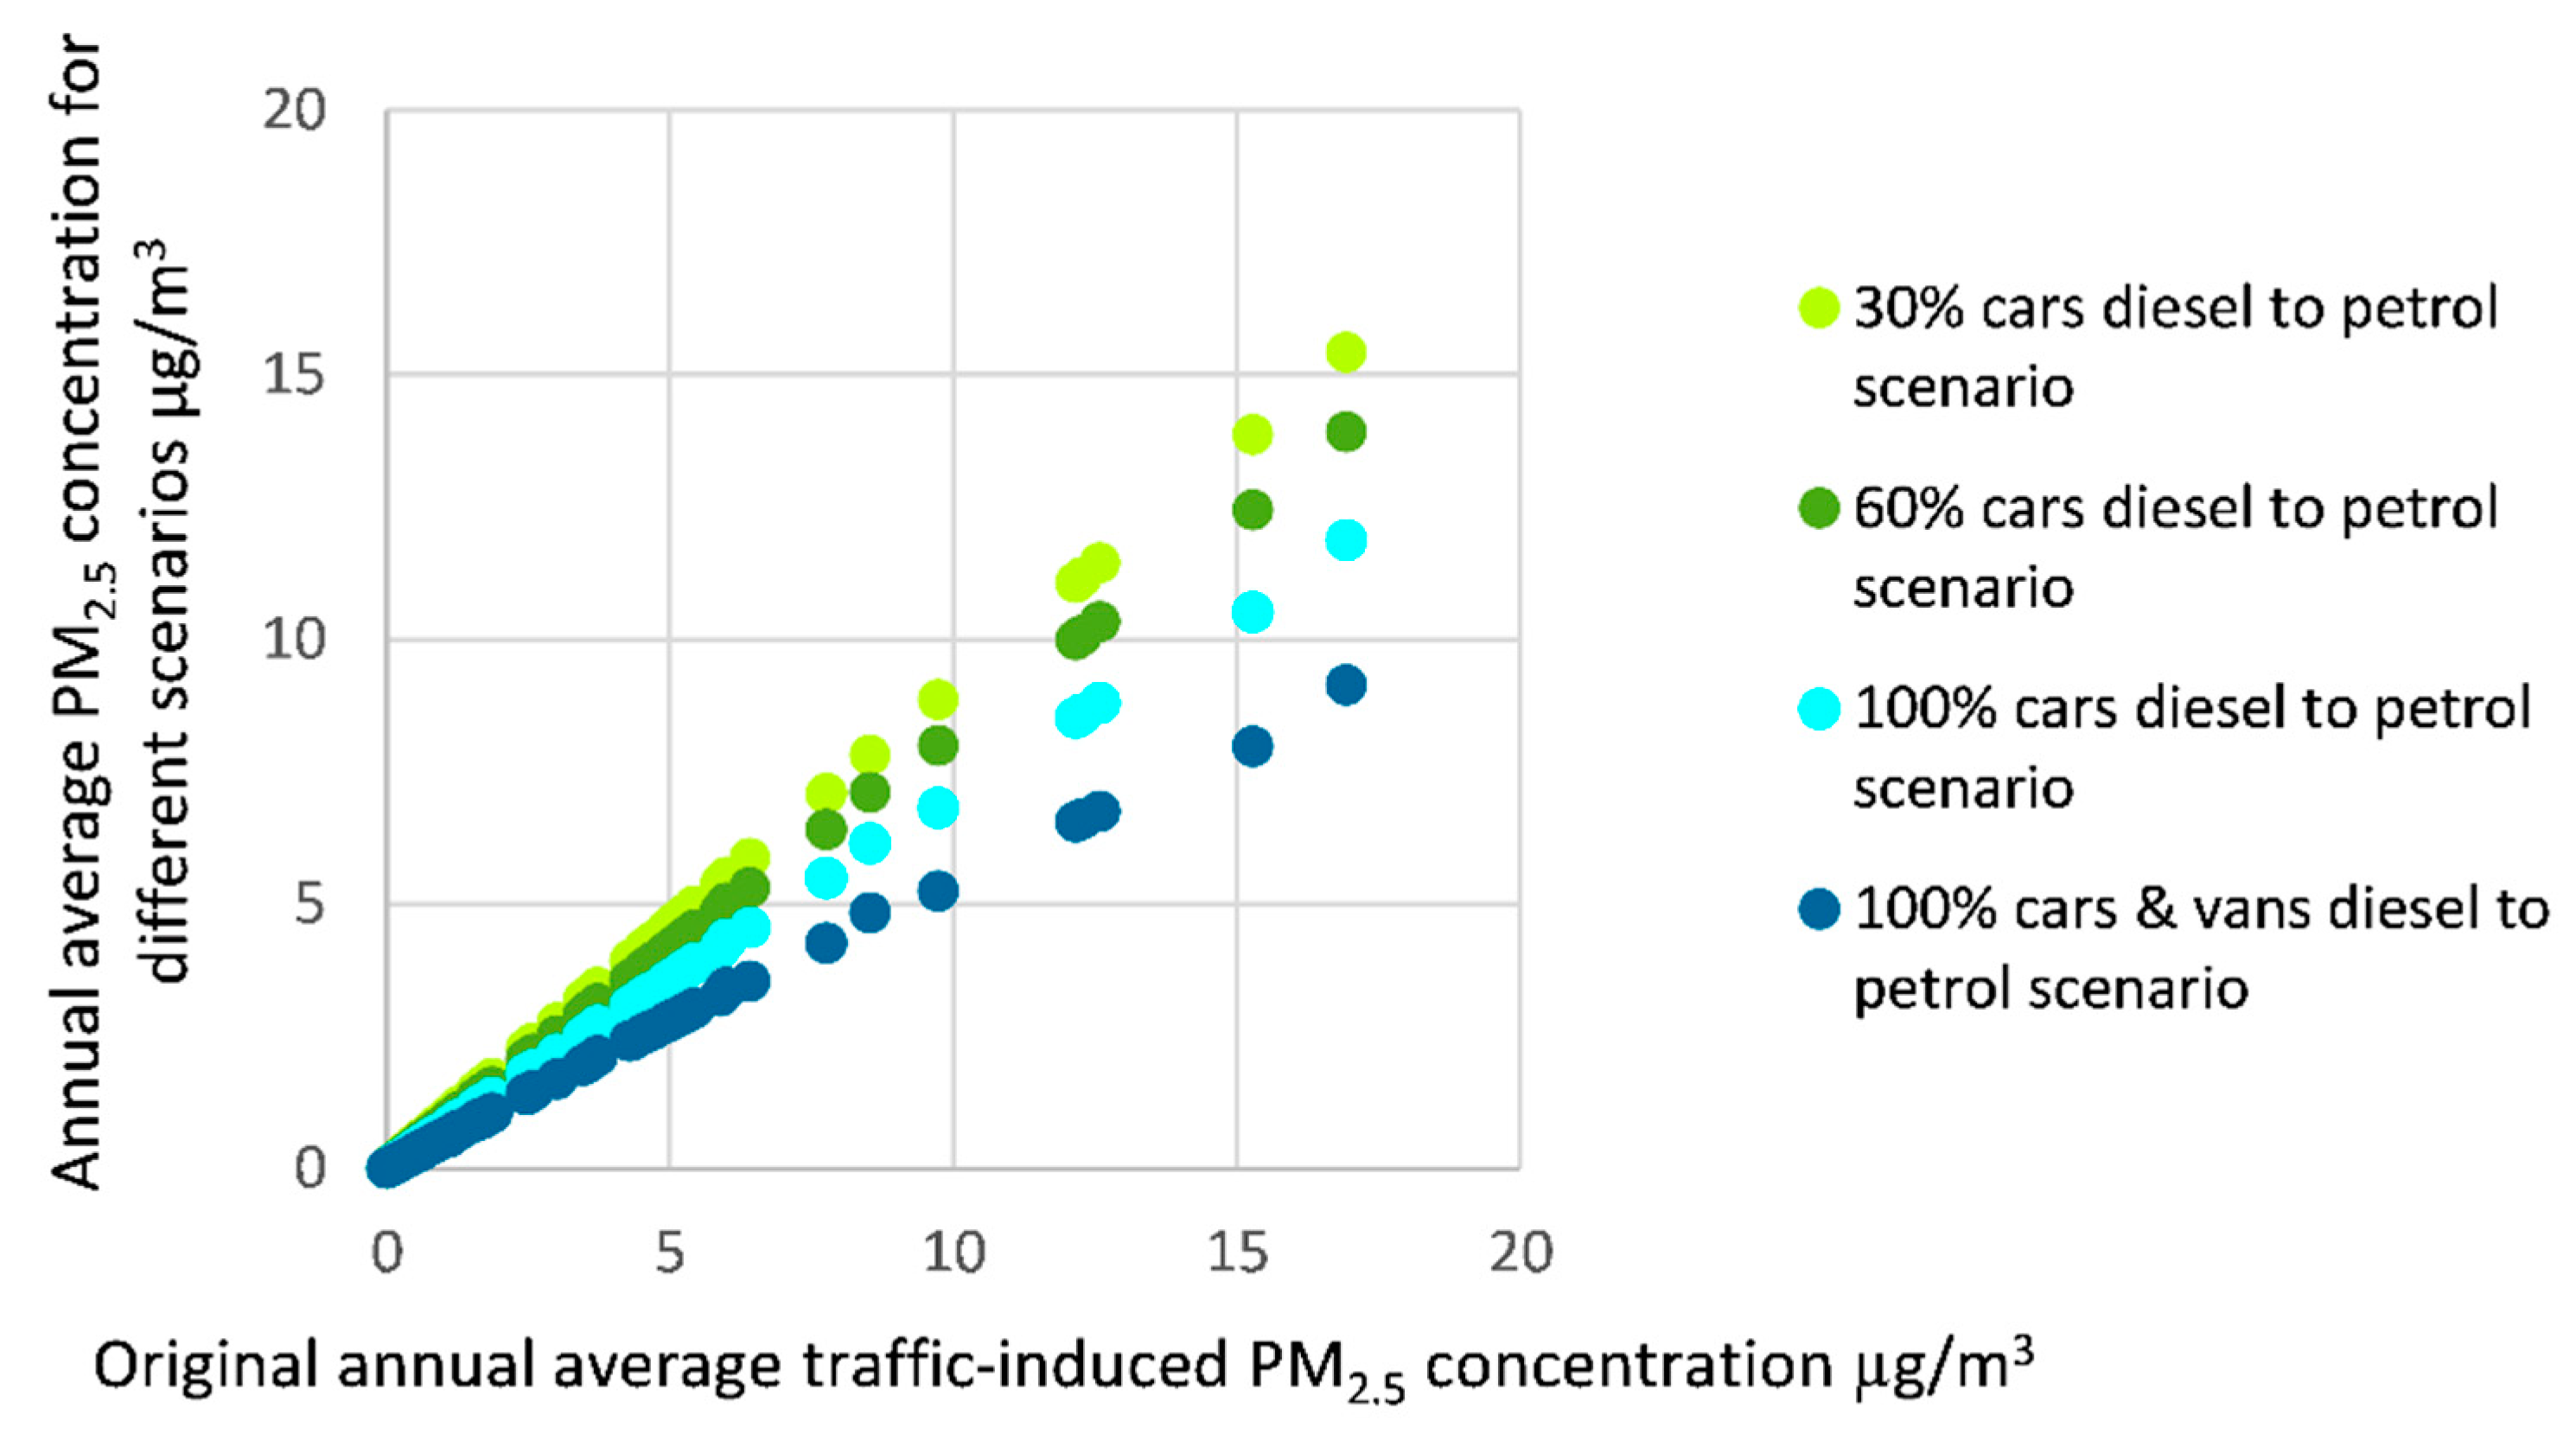
3.4. The Effect of Fleet Composition

The impact of fleet composition on the total concentrations of NO2 and PM10 in each street is shown in Figure 6a,b, whilst the impact of fleet composition on the traffic-induced concentrations of CO and Benzene is shown in Figure 6c,d. Traffic-induced concentrations were estimated instead of total concentration of CO and Benzene because of the absence of background concentration information for these gases. The impact of fleet composition on the traffic induced concentrations of PM2.5 is shown in Figure A2 in the Appendix A.
In Figure 6, the x-axis shows the baseline scenario concentration, and the y-axis shows the concentrations for four fleet composition change scenarios. Again, the grey diagonal line indicates the 1:1 relationship between the baseline scenario concentration and the fleet composition change scenario. Brown lines show the EU standards for annual NO2 and PM10 concentration.
Figure 6a,b show declines in NO2 and PM10 concentration for the modelled fleet composition change scenarios. This demonstrates that increasing the proportion of petrol vehicles can reduce the NO2 and PM10 by up to 23% and up to 19%, depending on the street in question. This hypothetical strategy can reduce the traffic-induced NO2 and PM10 by up to 35% and up to 28%, respectively. For similar reasons as outlined above, the general trend for NO2 and PM10 concentrations was that they could be reduced by a greater amount for the streets that originally had higher concentrations.
Among all these scenarios, including speed limit change scenarios, replacing all diesel cars and vans with petrol cars and vans had the greatest predicted impact on NO2 and PM10 concentration. The high original NO2 and PM10 concentration of several streets, which exceeded the EU limit value, as shown in Figure 6a,b, could be reduced to below the limit value with the shifting of diesel vehicles to petrol vehicles.
The effect of fleet composition change on the street in front of the school was relatively small compared to other streets with heavier pollution (Table 6). Regarding the reduction of the concentration of NO2 and PM10 on the street in front of school, the scenario of replacing all diesel cars and vans with petrol vehicles was the most efficient, reducing the NO2 and PM10 pollution concentrations by 4% and 3%, respectively. When compared to the 3% and 2% reductions found for the scenario of increasing the speed limit to 50 km/h, both interventions produced similar levels of impact.
Regarding the traffic-induced concentrations of CO and Benzene, Figure 6c,d depict that, in general, increasing the proportion of petrol cars and vans would increase these concentrations appreciably. Thus, in contrast to NO2 and PM10, increasing the proportion of petrol vehicles would exacerbate the CO and Benzene pollution. By changing all the diesel cars and vans to petrol cars and vans, the traffic-induced concentration of CO would be increased by 65% at maximum. This strategy would also increase traffic-induced Benzene concentration by 36% at maximum. The scenario of changing diesel vehicles to petrol vehicles could increase the traffic-induced CO and Benzene concentration at the school by 63% and 35%, respectively.

4. Discussion

This investigation showed that speed limits and fleet composition changes could have notable impacts on the air quality. These scenarios could potentially affect the air quality at the location of the school in question here, albeit to a lesser extent than they would affect the air quality along the more polluted streets away from the school.
Regarding speed limits, the hypothetical increase of speed limits from 30 km/h to 50 km/h was predicted to reduce the concentrations of all the pollutants examined here (i.e. NO2, PM, CO, and Benzene). Ghafghazi & Hatzopoulou [28] found that speed bumps that are used to reduce speeds could lead to an increase in both NO2 and NOX concentrations in urban areas. Int Panis et al. [44] estimated that a speed limit change from 50 km/h to 30 km/h would increase NOX and PM emissions by 2% to 5% and 3% to 8%, respectively, using the COPERT methodology. Carsten et al. [45] found that PM and NOX would increase by 1% and 0.7% when the number of vehicles conforming to a speed limit of 30 mph was increased. These results are in line with the results of the present study. Some studies have also found a decrease in traffic emissions with speed limit changes from 50 km/h to 30 km/h in Belgium, using microsimulation [44,46]. To date there have been few ex-post studies that can support the conclusions made by the different analyses of speed limit changes, and clear-cut conclusions about the impact of these strategies on air quality do not exist [23].
The results of this study also showed that for the streets that experienced more severe air pollution, the changing of speed limits would have more impact on traffic-related air pollution. For example, EU limit values could be achieved in some streets where the original pollutant concentration exceeded the limit. Regarding the speed limit decrease from 50 km/h to 30 km/h introduced in 2009, this would not have affected the children significantly in terms of the air quality health impacts as the school within this study area is located along a less-busy, less-polluted street. However, this study does also indicate that, for a busy and heavily polluted area, a strategy of decreasing the speed limit could potentially lead to a reduction in air quality, with consequent implications for health.
In assessing the potential risks of vehicle speed to human health, it is necessary that all risks are taken into account. In this respect, it is perhaps worth pointing out that air pollution is responsible for a considerable amount of premature deaths worldwide. In Ireland in 2014, 193 people were killed in road traffic accidents [47], while in the same year, air pollution was associated with 1,510 premature deaths [48]. However, transport is only one of many contributors to this figure. Therefore, it does not necessarily suggest that the influence of air pollution on human health outweighs that of traffic accidents. On the other hand, in terms of the relationship of speed limit and car accidents, a review suggests that “studies of the effectiveness of school zone limits have generally found poor driver compliance, particularly when the limits are set very low, and no relationship between pedestrian crashes and the special limits” [49].
In this study, measured traffic count data and speed records were used in the calibration and validation of the model. This enabled the traffic strategies being assessed to be based on the traffic conditions of Dublin in 2013. The emission calculation method used in the study is based on average speeds, which, although complying with the objective and time-scale scope of the study, restricted the evaluation of the impacts of acceleration and deceleration on traffic emission. The driving cycles that are adopted to develop the COPERT emission factors include the condition of driving in real urban roads, which infers that these EFs incorporate the emission related to acceleration and deceleration to some extent. However, changes that may be brought about in the amount of acceleration and deceleration occurring as a result of changes in speed limits are not fully captured using this approach. In order to quantify the instantaneous impacts of speed limit changes on emissions in more detail in future, a traffic micro-simulation would be required. However, such micro-simulations are often limited in their size of study area and length of time scale which can be covered, limiting the results of such investigations in contrast to the current approach. The current approach was based on the average speed in every hour of 2013 for the entirety of Dublin city, and as such was focused on the longer-term impacts of these traffic strategies over a large area.
The health impact of the traffic emissions resulting from reducing speed limits should be taken into consideration, especially for schools located on busy roads. In contrast, outside an urban setting, road transport may contribute significantly less than other sources of air pollution to total exposure, and in such circumstances a speed limit reduction would be especially beneficial.
As petrol and diesel vehicles are still dominant in the fleet, and will be for some time, and there is no alternative that can replace these two types of vehicles worldwide in the short-term, it is worthwhile to evaluate these two types of vehicles in terms of their impact on air quality. Also, the emission change estimation of the fleet conversion to hybrid or electric is worthy of research in the future in line with the development and roll-out of this technology.
For different air pollutants, the effects of the changes of speed limit and the fleet composition were different. Increasing the proportion of petrol vehicles could reduce the on-street concentration of NO2 and PM, but this strategy would lead to a rise in the concentration of CO and Benzene. Thus, although the most significant modelling result for reducing the pollution of NO2 and PM was obtained by replacing all diesel cars and vans with petrol cars and vans, when considering the pollution of CO, benzene, and other pollutants that were not covered by our paper, this strategy appears inconclusive, with positive and negative impacts. Policy makers should take as many pollutants as possible into account in order to make a full assessment of the advantages and disadvantages of using petrol and diesel cars. The results of this study highlight that the incentivisation of one fossil fuel type over another has advantages and disadvantages. The negative impacts of dieselisation of the European vehicle fleet are well publicized [50]. However, a similar incentivisation of petrol engines would have resulted in problems of a different nature. Determining which policy is effective in tackling traffic-related health impacts should involve a health impact assessment to quantify the impact of increases and decreases in different pollutants with different levels.
Similar to the effect of changing speed limits, for the streets that experienced more severe air pollution, the strategies of increasing the proportion of petrol cars were more effective in dealing with NO2 and PM pollution. The improvement in air quality of implementing different traffic management strategies depends on how much the traffic contributes to the air pollution. Therefore, cities with severe traffic pollution will receive larger benefits when applying these traffic air pollution reduction strategies than those found in Dublin, where air quality is relatively good.

5. Conclusions

This study analysed several strategies and related factors that could affect air pollution in a city centre near a school. Real traffic count data were applied and several vehicle fleet and speed limit scenarios were modelled. The results showed that both strategies can influence the traffic-induced air pollutant concentrations significantly. Changing diesel cars and vans to petrol cars and vans had both advantages and disadvantages; this strategy would lead to benefits in terms of reducing NO2 and PM pollution, but would increase the pollution from CO and Benzene. Thus, it is overly simplistic to provide incentives for using either petrol or diesel vehicles. Policy makers should seek to strike an appropriate balance of both in the fleet at present. Looking to the future, strategies should be implemented that are aimed at phasing out both types of vehicles and replacing these with e.g. electric vehicles or hybrid vehicles.
Decreasing speed limits near a school, although justified in terms of road safety, was shown to have potentially negative impacts in terms of air quality, especially for streets that are heavily polluted; thus, these impacts should be considered and balanced with the benefits to safety brought about by reducing the speed limit.

Author Contributions

Conceptualization, J.T., A.M., B.M., and F.P.; methodology, J.T., A.M., and B.M.; software, J.T.; validation, J.T.; formal analysis, J.T.; investigation, J.T.; resources, J.T., A.M., B.M., F.P., and M.S.A.; data curation, J.T.; writing—original draft preparation, J.T.; writing—review and editing, A.M., B.M., F.P., and M.S.A.; visualization, J.T., A.M., and B.M.; supervision, A.M. and B.M.; project administration, A.M. and B.M.; funding acquisition, A.M. and B.M.

Funding

This research was funded by Trinity College Dublin.

Acknowledgments

The authors would like to acknowledge the financial supports from Trinity College Dublin. The Irish National Roads Authority, Dublin City Council, and Irish Environmental Protection Agency are acknowledged for providing modelling data and air monitoring data, as well as the PTV company for the software and their technical support.

Conflicts of Interest

The authors declare no conflict of interest.

Appendix A

Table A1. Irish fleet data in 2013 (source: Duffy et al., 2015).
SectorSubsectorTechnologyVehicle # in 2013
Passenger CarsGasoline 0.8–1.4 lPRE ECE0
Passenger CarsGasoline 0.8–1.4 lECE 15/00-010
Passenger CarsGasoline 0.8–1.4 lECE 15/020
Passenger CarsGasoline 0.8–1.4 lECE 15/030
Passenger CarsGasoline 0.8–1.4 lECE 15/04949
Passenger CarsGasoline 0.8–1.4 lOpen Loop0
Passenger CarsGasoline 0.8–1.4 lPC Euro 1–91/441/EEC7739
Passenger CarsGasoline 0.8–1.4 lPC Euro 2–94/12/EEC201,061
Passenger CarsGasoline 0.8–1.4 lPC Euro 3–98/69/EC Stage2000276,634
Passenger CarsGasoline 0.8–1.4 lPC Euro 4–98/69/EC Stage2005251,944
Passenger CarsGasoline 0.8–1.4 lPC Euro 5–EC 715/200739,297
Passenger CarsGasoline 0.8–1.4 lPC Euro 6–EC 715/20070
Passenger CarsGasoline 1.4–2.0 lPRE ECE0
Passenger CarsGasoline 1.4–2.0 lECE 15/00-010
Passenger CarsGasoline 1.4–2.0 lECE 15/020
Passenger CarsGasoline 1.4–2.0 lECE 15/030
Passenger CarsGasoline 1.4–2.0 lECE 15/04504
Passenger CarsGasoline 1.4–2.0 lOpen Loop0
Passenger CarsGasoline 1.4–2.0 lPC Euro 1–91/441/EEC4434
Passenger CarsGasoline 1.4–2.0 lPC Euro 2–94/12/EEC106,786
Passenger CarsGasoline 1.4–2.0 lPC Euro 3–98/69/EC Stage2000146,907
Passenger CarsGasoline 1.4–2.0 lPC Euro 4–98/69/EC Stage2005136,307
Passenger CarsGasoline 1.4–2.0 lPC Euro 5–EC 715/200721,812
Passenger CarsGasoline 1.4–2.0 lPC Euro 6–EC 715/20070
Passenger CarsGasoline > 2.0 lPRE ECE0
Passenger CarsGasoline > 2.0 lECE 15/00-010
Passenger CarsGasoline > 2.0 lECE 15/020
Passenger CarsGasoline > 2.0 lECE 15/030
Passenger CarsGasoline > 2.0 lECE 15/0433
Passenger CarsGasoline > 2.0 lPC Euro 1–91/441/EEC425
Passenger CarsGasoline > 2.0 lPC Euro 2–94/12/EEC7055
Passenger CarsGasoline > 2.0 lPC Euro 3–98/69/EC Stage20009699
Passenger CarsGasoline > 2.0 lPC Euro 4–98/69/EC Stage20059733
Passenger CarsGasoline > 2.0 lPC Euro 5–EC 715/20071723
Passenger CarsGasoline > 2.0 lPC Euro 6–EC 715/20070
Passenger CarsDiesel 1.4–2.0 lConventional182
Passenger CarsDiesel 1.4–2.0 lPC Euro 1–91/441/EEC1452
Passenger CarsDiesel 1.4–2.0 lPC Euro 2–94/12/EEC38,544
Passenger CarsDiesel 1.4–2.0 lPC Euro 3–98/69/EC Stage2000132,268
Passenger CarsDiesel 1.4–2.0 lPC Euro 4–98/69/EC Stage2005288,016
Passenger CarsDiesel 1.4–2.0 lPC Euro 5–EC 715/2007160,045
Passenger CarsDiesel 1.4–2.0 lPC Euro 6–EC 715/20070
Passenger CarsDiesel > 2.0 lConventional26
Passenger CarsDiesel > 2.0 lPC Euro 1–91/441/EEC209
Passenger CarsDiesel > 2.0 lPC Euro 2–94/12/EEC5545
Passenger CarsDiesel > 2.0 lPC Euro 3–98/69/EC Stage200019,029
Passenger CarsDiesel > 2.0 lPC Euro 4–98/69/EC Stage200541,435
Passenger CarsDiesel > 2.0 lPC Euro 5–EC 715/200723,025
Passenger CarsDiesel > 2.0 lPC Euro 6–EC 715/20070
Passenger CarsLPGConventional0
Passenger CarsLPGPC Euro 1–91/441/EEC72
Passenger CarsLPGPC Euro 2–94/12/EEC57
Passenger CarsLPGPC Euro 3–98/69/EC Stage200057
Passenger CarsLPGPC Euro 4–98/69/EC Stage200557
Passenger CarsLPGPC Euro 5–EC 715/20070
Passenger CarsLPGPC Euro 6–EC 715/20070
Passenger CarsHybrid Gasoline < 1.4 lPC Euro 4–98/69/EC Stage20050
Passenger CarsHybrid Gasoline 1.4–2.0 lPC Euro 4–98/69/EC Stage20050
Passenger CarsHybrid Gasoline > 2.0 lPC Euro 4–98/69/EC Stage20050
Light Commercial VehiclesGasoline < 3.5 tConventional4
Light Commercial VehiclesGasoline < 3.5 tLD Euro 1–93/59/EEC28
Light Commercial VehiclesGasoline < 3.5 tLD Euro 2–96/69/EEC101
Light Commercial VehiclesGasoline < 3.5 tLD Euro 3–98/69/EC Stage2000236
Light Commercial VehiclesGasoline < 3.5 tLD Euro 4–98/69/EC Stage2005292
Light Commercial VehiclesGasoline < 3.5 tLD Euro 5–2008 Standards78
Light Commercial VehiclesGasoline < 3.5 tLD Euro 60
Light Commercial VehiclesDiesel < 3.5 tConventional1441
Light Commercial VehiclesDiesel < 3.5 tLD Euro 1–93/59/EEC10,951
Light Commercial VehiclesDiesel < 3.5 tLD Euro 2–96/69/EEC39,482
Light Commercial VehiclesDiesel < 3.5 tLD Euro 3–98/69/EC Stage200092,220
Light Commercial VehiclesDiesel < 3.5 tLD Euro 4–98/69/EC Stage2005113,834
Light Commercial VehiclesDiesel < 3.5 tLD Euro 5–2008 Standards30,260
Light Commercial VehiclesDiesel < 3.5 tLD Euro 60
Heavy Duty TrucksGasoline >3.5 tConventional24
Heavy Duty TrucksRigid ≤ 7.5 tConventional108
Heavy Duty TrucksRigid <= 7.5 tHD Euro I–91/542/EEC Stage I287
Heavy Duty TrucksRigid <= 7.5 tHD Euro II–91/542/EEC Stage II1228
Heavy Duty TrucksRigid <= 7.5 tHD Euro III–2000 Standards2868
Heavy Duty TrucksRigid <= 7.5 tHD Euro IV–2005 Standards3541
Heavy Duty TrucksRigid <= 7.5 tHD Euro V–2008 Standards932
Heavy Duty TrucksRigid <= 7.5 tHD Euro VI0
Heavy Duty TrucksRigid 7.5–12 tConventional129
Heavy Duty TrucksRigid 7.5–12 tHD Euro I–91/542/EEC Stage I345
Heavy Duty TrucksRigid 7.5–12 tHD Euro II–91/542/EEC Stage II1477
Heavy Duty TrucksRigid 7.5–12 tHD Euro III–2000 Standards3450
Heavy Duty TrucksRigid 7.5–12 tHD Euro IV–2005 Standards4258
Heavy Duty TrucksRigid 7.5–12 tHD Euro V–2008 Standards1121
Heavy Duty TrucksRigid 7.5–12 tHD Euro VI0
Heavy Duty TrucksRigid 12–14 tConventional66
Heavy Duty TrucksRigid 12–14 tHD Euro I–91/542/EEC Stage I176
Heavy Duty TrucksRigid 12–14 tHD Euro II–91/542/EEC Stage II754
Heavy Duty TrucksRigid 12–14 tHD Euro III–2000 Standards1761
Heavy Duty TrucksRigid 12–14 tHD Euro IV–2005 Standards2173
Heavy Duty TrucksRigid 12–14 tHD Euro V–2008 Standards572
Heavy Duty TrucksRigid 12–14 tHD Euro VI0
Heavy Duty TrucksRigid 14–20 tConventional43
Heavy Duty TrucksRigid 14–20 tHD Euro I–91/542/EEC Stage I114
Heavy Duty TrucksRigid 14–20 tHD Euro II–91/542/EEC Stage II487
Heavy Duty TrucksRigid 14–20 tHD Euro III–2000 Standards1137
Heavy Duty TrucksRigid 14–20 tHD Euro IV–2005 Standards1403
Heavy Duty TrucksRigid 14–20 tHD Euro V–2008 Standards370
Heavy Duty TrucksRigid 14–20 tHD Euro VI0
Heavy Duty TrucksRigid 20–26 tConventional0
Heavy Duty TrucksRigid 20–26 tHD Euro I–91/542/EEC Stage I0
Heavy Duty TrucksRigid 20–26 tHD Euro II–91/542/EEC Stage II1
Heavy Duty TrucksRigid 20–26 tHD Euro III–2000 Standards3
Heavy Duty TrucksRigid 20–26 tHD Euro IV–2005 Standards4
Heavy Duty TrucksRigid 20–26 tHD Euro V–2008 Standards1
Heavy Duty TrucksRigid 20–26 tHD Euro VI0
Heavy Duty TrucksRigid 26–28 tConventional0
Heavy Duty TrucksRigid 26–28 tHD Euro I–91/542/EEC Stage I0
Heavy Duty TrucksRigid 26–28 tHD Euro II–91/542/EEC Stage II1
Heavy Duty TrucksRigid 26–28 tHD Euro III–2000 Standards3
Heavy Duty TrucksRigid 26–28 tHD Euro IV–2005 Standards4
Heavy Duty TrucksRigid 26–28 tHD Euro V–2008 Standards1
Heavy Duty TrucksRigid 26–28 tHD Euro VI0
Heavy Duty TrucksRigid 28–32 tConventional0
Heavy Duty TrucksRigid 28–32 tHD Euro I–91/542/EEC Stage I0
Heavy Duty TrucksRigid 28–32 tHD Euro II–91/542/EEC Stage II1
Heavy Duty TrucksRigid 28–32 tHD Euro III–2000 Standards3
Heavy Duty TrucksRigid 28–32 tHD Euro IV–2005 Standards4
Heavy Duty TrucksRigid 28–32 tHD Euro V–2008 Standards1
Heavy Duty TrucksRigid 28–32 tHD Euro VI0
Heavy Duty TrucksRigid > 32 tConventional0
Heavy Duty TrucksRigid > 32 tHD Euro I–91/542/EEC Stage I0
Heavy Duty TrucksRigid > 32 tHD Euro II–91/542/EEC Stage II1
Heavy Duty TrucksRigid > 32 tHD Euro III–2000 Standards3
Heavy Duty TrucksRigid > 32 tHD Euro IV–2005 Standards4
Heavy Duty TrucksRigid > 32 tHD Euro V–2008 Standards1
Heavy Duty TrucksRigid > 32 tHD Euro VI0
Heavy Duty TrucksArticulated 40–50 tConventional0
Heavy Duty TrucksArticulated 40–50 tHD Euro I–91/542/EEC Stage I0
Heavy Duty TrucksArticulated 40–50 tHD Euro II–91/542/EEC Stage II1
Heavy Duty TrucksArticulated 40–50 tHD Euro III–2000 Standards3
Heavy Duty TrucksArticulated 40–50 tHD Euro IV–2005 Standards4
Heavy Duty TrucksArticulated 40–50 tHD Euro V–2008 Standards1
Heavy Duty TrucksArticulated 40–50 tHD Euro VI0
Heavy Duty TrucksArticulated 50–60 tConventional0
Heavy Duty TrucksArticulated 50–60 tHD Euro I–91/542/EEC Stage I0
Heavy Duty TrucksArticulated 50–60 tHD Euro II–91/542/EEC Stage II1
Heavy Duty TrucksArticulated 50–60 tHD Euro III–2000 Standards3
Heavy Duty TrucksArticulated 50–60 tHD Euro IV–2005 Standards4
Heavy Duty TrucksArticulated 50–60 tHD Euro V–2008 Standards1
Heavy Duty TrucksArticulated 50–60 tHD Euro VI0
BusesUrban Buses Standard 15–18 tConventional273
BusesUrban Buses Standard 15–18 tHD Euro I–91/542/EEC Stage I190
BusesUrban Buses Standard 15–18 tHD Euro II–91/542/EEC Stage II752
BusesUrban Buses Standard 15–18 tHD Euro III–2000 Standards849
BusesUrban Buses Standard 15–18 tHD Euro IV–2005 Standards596
BusesUrban Buses Standard 15–18 tHD Euro V–2008 Standards369
BusesUrban Buses Standard 15–18 tHD Euro VI0
BusesCoaches Standard <= 18 tConventional639
BusesCoaches Standard <= 18 tHD Euro I–91/542/EEC Stage I445
BusesCoaches Standard <= 18 tHD Euro II–91/542/EEC Stage II1765
BusesCoaches Standard <= 18 tHD Euro III–2000 Standards1990
BusesCoaches Standard <= 18 tHD Euro IV–2005 Standards1397
BusesCoaches Standard <= 18 tHD Euro V–2008 Standards866
BusesCoaches Standard <= 18 tHD Euro VI0
Mopeds2-stroke < 50 cm3Conventional188
Mopeds2-stroke < 50 cm3Mop–Euro I296
Mopeds2-stroke < 50 cm3Mop–Euro II161
Mopeds2-stroke < 50 cm3Mop–Euro III251
Mopeds4-stroke < 50 cm3Conventional188
Mopeds4-stroke < 50 cm3Mop–Euro I295
Mopeds4-stroke < 50 cm3Mop–Euro II161
Mopeds4-stroke < 50 cm3Mop–Euro III251
Motorcycles2-stroke > 50 cm3Conventional3329
Motorcycles4-stroke < 250 cm3Conventional699
Motorcycles4-stroke < 250 cm3Mot–Euro I1099
Motorcycles4-stroke < 250 cm3Mot–Euro II599
Motorcycles4-stroke < 250 cm3Mot–Euro III932
Motorcycles4-stroke 250–750 cm3Conventional5325
Motorcycles4-stroke 250–750 cm3Mot–Euro I8368
Motorcycles4-stroke 250–750 cm3Mot–Euro II4564
Motorcycles4-stroke 250–750 cm3Mot–Euro III7100
Motorcycles4-stroke > 750 cm3Conventional592
Motorcycles4-stroke > 750 cm3Mot–Euro I930
Motorcycles4-stroke > 750 cm3Mot–Euro II507
Motorcycles4-stroke > 750 cm3Mot–Euro III789
Figure A1. Predicted change in (a) PM2.5, (b) CO, and (c) Benzene traffic induced concentrations on each road segment in the model domain for varying speed limits.
Ijerph 16 00149 g0a1
Figure A2. Predicted change in PM2.5 traffic induced concentrations on each road segment in the model domain for varying fleet compositions.
Ijerph 16 00149 g0a2

References

  1. Bowatte, G.; Lodge, C.J.; Knibbs, L.D.; Lowe, A.J.; Erbas, B.; Dennekamp, M.; Marks, G.B.; Giles, G.; Morrison, S.; Thompson, B.; et al. Traffic-related air pollution exposure is associated with allergic sensitization, asthma, and poor lung function in middle age. J. Allergy Clin. Immunol. 2017, 139, 122–129. [Google Scholar] [CrossRef] [PubMed]
  2. Chen, H.; Kwong, J.C.; Copes, R.; Hystad, P.; van Donkelaar, A.; Tu, K.; Brook, J.R.; Goldberg, M.S.; Martin, R.V.; Murray, B.J.; et al. Exposure to ambient air pollution and the incidence of dementia: A population-based cohort study. Environ. Int. 2017, 108, 271–277. [Google Scholar] [CrossRef] [PubMed]
  3. Estarlich, M.; Ballester, F.; Davdand, P.; Llop, S.; Esplugues, A.; Fernández-Somoano, A.; Lertxundi, A.; Guxens, M.; Basterrechea, M.; Tardón, A.; et al. Exposure to ambient air pollution during pregnancy and preterm birth: A Spanish multicenter birth cohort study. Environ. Res. 2016, 147, 50–58. [Google Scholar] [CrossRef] [PubMed]
  4. Raaschou-Nielsen, O.; Beelen, R.; Wang, M.; Hoek, G.; Andersen, Z.J.; Hoffmann, B.; Stafoggia, M.; Samoli, E.; Weinmayr, G.; Dimakopoulou, K.; et al. Particulate matter air pollution components and risk for lung cancer. Environ. Int. 2016, 87, 66–73. [Google Scholar] [CrossRef] [PubMed] [Green Version]
  5. Andersen, Z.J.; Raaschou-Nielsen, O.; Ketzel, M.; Jensen, S.S.; Hvidberg, M.; Loft, S.; Tjønneland, A.; Overvad, K.; Sørensen, M. Diabetes incidence and long-term exposure to air pollution: A cohort study. Diabetes Care 2012, 35, 92–98. [Google Scholar] [CrossRef] [PubMed]
  6. Health Effects Institute. Traffic-Related Air Pollution: A Critical Review of the Literature on Emissions, Exposure, and Health Effects; Health Effects Institute: Boston, MA, USA, 2010. [Google Scholar]
  7. Rosenlund, M.; Picciotto, S.; Forastiere, F.; Stafoggia, M.; Perucci, C.A. Traffic-Related Air Pollution in Relation to Incidence and Prognosis of Coronary Heart Disease. Epidemiology 2008, 19, 121–128. [Google Scholar] [CrossRef] [PubMed]
  8. Eze, I.C.; Schaffner, E.; Fischer, E.; Schikowski, T.; Adam, M.; Imboden, M.; Tsai, M.; Carballo, D.; von Eckardstein, A.; Künzli, N.; et al. Long-term air pollution exposure and diabetes in a population-based Swiss cohort. Environ. Int. 2014, 70, 95–105. [Google Scholar] [CrossRef] [PubMed] [Green Version]
  9. Raaschou-Nielsen, O.; Andersen, Z.J.; Beelen, R.; Samoli, E.; Stafoggia, M.; Weinmayr, G.; Hoffmann, B.; Fischer, P.; Nieuwenhuijsen, M.J.; Brunekreef, B.; et al. Air pollution and lung cancer incidence in 17 European cohorts: Prospective analyses from the European Study of Cohorts for Air Pollution Effects (ESCAPE). Lancet Oncol. 2013, 14, 813–822. [Google Scholar] [CrossRef]
  10. Llop, S.; Ballester, F.; Estarlich, M.; Esplugues, A.; Rebagliato, M.; Iñiguez, C. Preterm birth and exposure to air pollutants during pregnancy. Environ. Res. 2010, 110, 778–785. [Google Scholar] [CrossRef]
  11. Krämer, U.; Herder, C.; Sugiri, D.; Strassburger, K.; Schikowski, T.; Ranft, U.; Rathmann, W. Traffic-related air pollution and incident type 2 diabetes: Results from the SALIA cohort study. Environ. Health Perspect. 2010, 118, 1273–1279. [Google Scholar] [CrossRef]
  12. World Health Organization. Burden of Disease from Ambient Air Pollution for 2016; World Health Organization: Geneva, Switzerland, 2018. [Google Scholar]
  13. Landrigan, P.J.; Fuller, R.; Acosta, N.J.R.; Adeyi, O.; Arnold, R.; Basu, N.; Baldé, A.B.; Bertollini, R.; Bose-O’Reilly, S.; Boufford, J.I.; et al. The Lancet Commission on pollution and health. Lancet 2017, 391. [Google Scholar] [CrossRef]
  14. Bowatte, G.; Lodge, C.J.; Knibbs, L.D.; Erbas, B.; Perret, J.L.; Jalaludin, B.; Morgan, G.G.; Bui, D.S.; Giles, G.G.; Hamilton, G.S.; et al. Traffic related air pollution and development and persistence of asthma and low lung function. Environ. Int. 2018, 113, 170–176. [Google Scholar] [CrossRef]
  15. Calderón-Garcidueñas, L.; Leray, E.; Heydarpour, P.; Torres-Jardón, R.; Reis, J. Air pollution, a rising environmental risk factor for cognition, neuro inflammation and neurodegeneration: The clinical impact on children and beyond. Rev. Neurol. 2016, 172, 69–80. [Google Scholar] [CrossRef] [PubMed]
  16. Chiu, Y.-H.M.; Hsu, H.-H.L.; Coull, B.A.; Bellinger, D.C.; Kloog, I.; Schwartz, J.; Wright, R.O.; Wright, R.J. Prenatal particulate air pollution and neurodevelopment in urban children: Examining sensitive windows and sex-specific associations. Environ. Int. 2016, 87, 56–65. [Google Scholar] [CrossRef] [PubMed] [Green Version]
  17. Saenen, N.D.; Provost, E.B.; Viaene, M.K.; Vanpoucke, C.; Lefebvre, W.; Vrijens, K.; Roels, H.A.; Nawrot, T.S. Recent versus chronic exposure to particulate matter air pollution in association with neurobehavioral performance in a panel study of primary schoolchildren. Environ. Int. 2016, 95, 112–119. [Google Scholar] [CrossRef] [PubMed]
  18. Lee, C.; Kim, H.; Lim, Y.; Yang, J.; Yu, S.; Lee, J.; Chang, J.; Son, H.; Park, J.; Shin, D. Evaluation of the relationship between allergic diseases in school children at Seoul’s roadside elementary schools and air pollution. Atmos. Pollut. Res. 2015, 6, 1001–1012. [Google Scholar] [CrossRef]
  19. Flores-Pajot, M.-C.; Ofner, M.; Do, M.T.; Lavigne, E.; Villeneuve, P.J. Childhood autism spectrum disorders and exposure to nitrogen dioxide, and particulate matter air pollution: A review and meta-analysis. Environ. Res. 2016, 151, 763–776. [Google Scholar] [CrossRef] [PubMed]
  20. European Environment Agency (EEA). National Emissions Reported to the Convention on Long-Range Transboundary Air Pollution (LRTAP Convention); European Environmental Agency: Copenhagen, Denmark, 2012.
  21. Environmental Protection Agency. Ireland’s Informative Inventory Report 2017; Environmental Protection Agency: Washington, DC, USA, 2017.
  22. European Environment Agency. Air Pollution Fact Sheet 2014 Ireland; European Environment Agency: Copenhagen, Denmark, 2014.
  23. Bigazzi, A.Y.; Rouleau, M. Can traffic management strategies improve urban air quality? A review of the evidence. J. Transp. Heal. 2017, 7, 111–124. [Google Scholar] [CrossRef]
  24. Alam, M.S.; Hyde, B.; Duffy, P.; McNabola, A. Analysing the Co-Benefits of transport fleet and fuel policies in reducing PM 2.5 and CO2 emissions. J. Clean. Prod. 2018, 172, 623–634. [Google Scholar] [CrossRef]
  25. Tang, J.; McNabola, A.; Misstear, B.; Caulfield, B. An evaluation of the impact of the Dublin Port Tunnel and HGV management strategy on air pollution emissions. Transp. Res. Part D Transp. Environ. 2017, 52, 1–14. [Google Scholar] [CrossRef] [Green Version]
  26. Alam, M.S.; McNabola, A. A critical review and assessment of Eco-Driving policy & technology: Benefits & limitations. Transp. Policy 2014, 35, 42–49. [Google Scholar]
  27. Alam, M.S.; McNabola, A. Network-wide traffic and environmental impacts of acceleration and deceleration among Eco-Driving Vehicles in different road configurations. Transp. Plan. Technol. 2018, 41, 244–264. [Google Scholar] [CrossRef]
  28. Ghafghazi, G.; Hatzopoulou, M. Simulating the air quality impacts of traffic calming schemes in a dense urban neighborhood. Transp. Res. Part D Transp. Environ. 2015, 35, 11–22. [Google Scholar] [CrossRef]
  29. Jiang, W.; Boltze, M.; Groer, S.; Scheuvens, D. Impacts of low emission zones in Germany on air pollution levels. In Proceedings of the Transportation Research Procedia. Transp. Res. Procedia 2017, 25, 3374–3386. [Google Scholar] [CrossRef]
  30. Holman, C.; Harrison, R.; Querol, X. Review of the efficacy of low emission zones to improve urban air quality in European cities. Atmos. Environ. 2015, 111, 161–169. [Google Scholar] [CrossRef]
  31. EPA Other Metadata and Data Resources on SAFER. Available online: http://erc.epa.ie/safer/resourcelisting.jsp?oID=10136&username=R0 (accessed on 15 June 2018).
  32. PTV AG. VISUM 15 User Manual; PTV AG: Karlsruhe, Germany, 2015. [Google Scholar]
  33. Berkowicz, R.; Olesen, H.R.; Jensen, S.S. User’s Guide to WinOSPM: Operational Street Pollution Model; National Environmental Research Institute: Aarhus, Denmark, 2003. [Google Scholar]
  34. Kakosimos, K.E.; Hertel, O.; Ketzel, M.; Berkowicz, R. Operational Street Pollution Model (OSPM)—A review of performed application and validation studies, and future prospects. Environ. Chem. 2010, 7, 485. [Google Scholar] [CrossRef]
  35. Aquilina, N.; Micallef, A. Evaluation of the operational street pollution model using data from European cities. Environ. Monit. Assess. 2004, 95, 75–96. [Google Scholar] [CrossRef]
  36. UK DMRB. Design Manual for Roads and Bridges: Volume 12—Traffic Appraisal of Road Schemes; DMRB: Birmingham, UK, 1997. [Google Scholar]
  37. Duffy, P.; Hanley, E.; Black, K.; O’Brien, P.; Hyde, B.; Ponzi, J.; Alam, S. Ireland’s National Inventory Report; Environmental Protection Agency: Washington, DC, USA, 2015. [Google Scholar]
  38. European Parliament. Directive 2009/28/EC of the European Parliament and of the Council of 23 April 2009. Off. J. Eur. Union 2009, 140, 16–62. [Google Scholar]
  39. Heinen, M.; Murrin, C.; Daly, L.; O’Brien, J.; Heavey, P.; Kilroe, J.; O’Brien, M.; Scully, H.; Mulhern, L.-M.; Lynam, A.; et al. The Childhood Obesity Surveillance Initiative (COSI) in the Republic of Ireland: Findings from 2008, 2010 and 2012; Health Service Executive: Dublin, Ireland, 2014. [Google Scholar]
  40. Chambers, M.; Schmitt, R. Diesel-powered Passenger Cars and Light Trucks. Available online: https://www.rita.dot.gov/bts/sites/rita.dot.gov.bts/files/publications/bts_fact_sheets/oct_2015/html/entire.html (accessed on 15 January 2018).
  41. Knight, S.; Qureshi, M.; Cleverly, J.; Duvall, L.; Gavron, N.; Jones, J.; Malthouse, K. Driving Away from Diesel: Reducing Air Pollution from Diesel Vehicles; Environment Committee: London, UK, 2015. [Google Scholar]
  42. National Transport Authority. 2016 Quality Bus Corridor Monitoring Report—Dublin; National Transport Authority: Dublin, Ireland, 2016.
  43. Fallah-Shorshani, M.; Shekarrizfard, M.; Hatzopoulou, M. Integrating a street-canyon model with a regional Gaussian dispersion model for improved characterisation of near-road air pollution. Atmos. Environ. 2017, 153, 21–31. [Google Scholar] [CrossRef]
  44. Int Panis, L.; Beckx, C.; Broekx, S.; De Vlieger, I.; Schrooten, L.; Degraeuwe, B.; Pelkmans, L. PM, NOx and CO2 emission reductions from speed management policies in Europe. Transp. Policy 2011, 18, 32–37. [Google Scholar] [CrossRef]
  45. Carsten, O.; Lai, F.; Chorlton, K.; Goodman, P.; Carslaw, D.; Hess, S. Speed Limit Adherence and Its Effect on Road Safety and Climate Change—Final Report; University of Leeds: Leeds, UK, 2008. [Google Scholar]
  46. Madireddy, M.; De Coensel, B.; Can, A.; Degraeuwe, B.; Beusen, B.; De Vlieger, I.; Botteldooren, D. Assessment of the impact of speed limit reduction and traffic signal coordination on vehicle emissions using an integrated approach. Transp. Res. Part D Transp. Environ. 2011, 16, 504–508. [Google Scholar] [CrossRef] [Green Version]
  47. Road Safety Authority. A Review of 2015 Fatal Collision Statistics as of 31 December 2015; Road Safety Authority: Ballina, Ireland, 2015.
  48. Environmental Protection Agency. Air Quality in Ireland 2016; Environmental Protection Agency: Washington, DC, USA, 2016.
  49. National Research Council (U.S.); Transportation Research Board; Committee for Guidance on Setting and Enforcing Speed Limits. Managing Speed: Review of Current Practice for Setting and Enforcing Speed Limits; National Academy Press: Washington, DC, USA, 1998; ISBN 0-309-06502-X. [Google Scholar]
  50. Cames, M.; Helmers, E. Critical evaluation of the European diesel car boom—Global comparison, environmental effects and various national strategies. Environ. Sci. Eur. 2013, 25, 15. [Google Scholar] [CrossRef]
Figure 1. Modelled area. (Calibrated roads (red) and validated roads (cyan)).
Ijerph 16 00149 g001
Figure 2. Schematic representation of the principal modules of VISUM & OSPM modelling chain. (Adapted from: Aquilina & Micallef, 2004 [35]).
Ijerph 16 00149 g002
Figure 3. The average hourly traffic and average speed at the speed limit of 30 km/h at different hours of a day for all road segments across 2013.
Ijerph 16 00149 g003
Figure 4. Modelled vs. observed concentrations for (a) NOX and (b) PM10 daily average concentration in 2013.
Ijerph 16 00149 g004
Figure 5. Predicted change in (a) NO2 and (b) PM10 total street concentrations on each road segment in the model domain for varying speed limits.
Ijerph 16 00149 g005
Figure 6. Predicted percentage change in (a) NO2 and (b) PM10 total street concentrations, and (c) CO and (d) Benzene traffic induced concentrations on each road segment in the model domain for varying fleet compositions.
Ijerph 16 00149 g006
Table 1. Validation criteria (Adapted from U.K. DMRB, [36]). In GEH calculation formula, M is the hourly traffic volume from the traffic model and C is the real-world hourly traffic count.
MeasureCriteriaGuideline
G E H = 2 ( M C ) 2 M + C GEH < 5>85% of cases
Table 2. Fleet data for each category and fuel type for different fleet change scenarios.
Category% of FleetFuel TypePercentage in Each Category by Scenario (with Scenario Number Shown in Table 4)
Baseline 30% Diesel Cars to Petrol (iv)60% Diesel Cars to Petrol (v)100% Diesel Cars to Petrol (vi)100% Diesel Cars and Vans to Petrol (vii)
Passenger car82%Petrol63%74%85%100%100%
Diesel 37%26%15%0%0%
Van12%Petrol0.30%0.30%0.30%0.30%100.00%
Diesel 99.70%99.70%99.70%99.70%0%
Truck1%Petrol00000
Diesel 100%100%100%100%100%
Bus5%Petrol00000
Diesel 100%100%100%100%100%
Table 3. Input data for background concentration, building geometry and weather condition.
Input TypeElementDescriptive StatisticsNotes
MeanStandard Deviation
Background concentrationPM1013.58 µg/m39.43Data source: PM10 monitoring site located at inner suburb in Dublin
NOX28.06 µg/m338.37Data source: NOX monitoring site located at a park in Dublin
Building geometryBuilding height/road width (H/W)0.980.41Data source: Google Maps
Weather conditionWind speed5.63 m/s2.86Data source: the Irish meteorological service.
Wind direction: Prevailing winds are westerly and south-westerly winds
Temperature9.52 °C5.46
Relative humidity0.820.12
Table 4. Scenarios information.
Scenario TypeScenarioNotes
Baseline
i.
30 km/h with Irish national fleet composition in 2013
Reflection of the actual condition of 2013
Speed limit
ii.
40 km/h
iii.
50 km/h
Baseline fleet composition was applied; speed limit was changed for these scenarios.
Fleet composition
iv.
30% of diesel cars converting to petrol cars
v.
60% of diesel cars converting to petrol cars
vi.
100% of diesel cars converting to petrol cars
vii.
100% of diesel cars and vans converting to petrol vehicles
30 km/h speed limit was applied; detailed percentages of petrol and diesel vehicles for these scenarios are shown in Table 2 with the scenario number corresponding to each scenario number in this table.
Table 5. Summary of the result of traffic volume validation.
Validation# of Links and Turns# of Hours# of Cases# of Cases with GEH <5% of Cases with GEH <5
26001200104187%
Table 6. The impact of fleet composition changes on the concentration of NO2 and PM10 comparison between the street in front of the school (indicated by red dots in Figure 6) and a street with high original pollutant concentration (indicated by yellow dots in Figure 6).
Scenarios Street in Front of the School A Street with High Original Concentration
Original concentrationNO222 µg/m345 µg/m3
PM1014 µg/m335 µg/m3
Concentration with 30% diesel changing to petrol cars (change in traffic-induced concentration)NO2−1% (−5%)−3% (−5%)
PM10−1% (−4%)−3% (−5%)
Concentration with 60% diesel changing to petrol cars (change in traffic-induced concentration)NO2−2% (−10%)−6% (−10%)
PM10−1% (−8%)−6% (−10%)
Concentration with 100% diesel changing to petrol cars (change in traffic-induced concentration)NO2−2% (−16%)−9% (−17%)
PM10−2% (−14%)−11% (−17%)
Concentration with 100% diesel changing to petrol cars and vans (change in traffic-induced concentration)NO2−4% (−35%)−20% (−35%)
PM10−3% (−22%)−16% (−26%)

