The Association between US Adolescents’ Weight Status, Weight Perception, Weight Satisfaction, and Their Physical Activity and Dietary Behaviors


Abstract
1. Introduction
2. Methods
2.1. Analytic Sample
2.2. Weight Status
2.3. Weight Perception and Weight Perception Accuracy
2.4. Weight Satisfaction
2.5. Physical Activity
2.6. Diet Quality
2.7. Lifestyle Groups
2.8. Demographic Characteristics
2.9. Statistical Analysis
3. Results
4. Discussion
5. Conclusions
Author Contributions
Funding
Conflicts of Interest
Declaration
References
- Hales, C.M.; Fryar, C.D.; Carroll, M.D.; Freedman, D.S.; Ogden, C.L. Trends in obesity and severe obesity prevalence in US youth and adults by sex and age, 2008–2008 to 2015–2016. JAMA 2018, 319, 1723–1725. [Google Scholar] [CrossRef] [PubMed]
- Barlow, S.E.; Expert Committee. Expert committee recommendations regarding the prevention, assessment, and treatment of child and adolescent overweight and obesity: Summary report. Pediatrics 2007, 120, S164–S192. [Google Scholar] [CrossRef] [PubMed]
- Centers for Disease Control and Prevention. Youth Risk Behavior Surveillance System. Available online: http://www.cdc.gov/HealthyYouth/yrbs/index.htm (accessed on 7 September 2017).
- Sallis, J.F.; Prochaska, J.J.; Taylor, W.C. A review of correlates of physical activity of children and adolescents. Med. Sci. Sports Exerc. 2000, 32, 963–975. [Google Scholar] [CrossRef] [PubMed]
- Haerens, L.; Vereecken, C.; Maes, L.; De Bourdeaudhuij, I. Relationship of physical activity and dietary habits with body mass index in the transition from childhood to adolescence: A 4-year longitudinal study. Public Health Nutr. 2010, 13, 1722–1728. [Google Scholar] [CrossRef] [PubMed]
- Gokler, M.E.; Bugrul, N.; Sari, A.O.; Metintas, S. The validity of self-reported vs. measured body weight and height and the effect of self-perception. Arch. Med. Sci. 2018, 14, 174–181. [Google Scholar] [CrossRef] [PubMed]
- Harris, K.C.; Kuramoto, L.K.; Schulzer, M.; Retallack, J.E. Effect of school-based physical activity interventions on body mass index in children: A meta-analysis. CMAJ 2009, 180, 719–726. [Google Scholar] [CrossRef] [PubMed]
- Marshall, S.; Burrows, T.; Collins, C.E. Systematic review of diet quality indices and their associations with health-related outcomes in children and adolescents. J. Hum. Nutr. Diet. 2014, 27, 577–598. [Google Scholar] [CrossRef] [PubMed]
- Manore, M.M.; Larson-Meyer, D.E.; Lindsay, A.R.; Hongu, N.; Houtkooper, L. Dynamic energy balance: An integrated framework for discussing diet and physical activity in obesity prevention—Is it more than eating less and exercising more? Nutrients 2017, 9, 905. [Google Scholar] [CrossRef] [PubMed]
- Wang, Y.C.; Gortmaker, S.L.; Sobol, A.M.; Kuntz, K.M. Estimating the energy gap among U.S. children: A counterfactual approach. Pediatrics 2006, 118, 1721–1733. [Google Scholar] [CrossRef] [PubMed]
- An, R. Diet quality and physical activity in relation to childhood obesity. Int. J. Adolesc. Med. Health 2015, 29. [Google Scholar] [CrossRef] [PubMed]
- Kim, K.H. Religion, weight perception, and weight control behavior. Eat. Behav. 2007, 8, 121–131. [Google Scholar] [CrossRef] [PubMed]
- Yost, J.; Krainovich-Miller, B.; Budin, W.; Norman, R. Assessing weight perception accuracy to promote weight loss among U.S. female adolescents: A secondary analysis. BMC Public Health 2010, 10, 465. [Google Scholar] [CrossRef] [PubMed]
- Fan, M.; Jin, Y. The effects of weight perception on adolescents’ weight-loss intentions and behaviors: Evidence from the youth risk behavior surveillance survey. Int. J. Environ. Res. Public Health 2015, 12, 14640–14668. [Google Scholar] [CrossRef] [PubMed]
- Edwards, N.M.; Pettingell, S.; Borowsky, I.W. Where perception meets reality: Self-perception of weight in overweight adolescents. Pediatrics 2010, 125, e452–e458. [Google Scholar] [CrossRef] [PubMed]
- Bhurtun, D.D.; Jeewon, R. Body weight perception and weight control practices among teenagers. ISRN Nutr. 2013, 2013, 395125. [Google Scholar] [CrossRef] [PubMed]
- Nystrom, A.A.; Schmitz, K.H.; Perry, C.L. The relationship of weight-related perceptions, goals, and behaviors with fruit and vegetable consumption in young adolescents. Prev. Med. 2005, 40, 203–208. [Google Scholar] [CrossRef] [PubMed]
- Wong, S.L.; Leatherdale, S.T. Association between sedentary behavior, physical activity, and obesity: Inactivity among active kids. Prev. Chronic Dis. 2009, 6, A26. [Google Scholar] [PubMed]
- Fredrickson, J.; Kremer, P.; Swinburn, B.; de Silva, A.; McCabe, M. Weight perception in overweight adolescents: Associations with body change intentions, diet and physical activity. J. Health Psychol. 2015, 20, 774–784. [Google Scholar] [CrossRef] [PubMed]
- Furnham, A.; Badmin, N.; Sneade, I. Body image dissatisfaction: Gender differences in eating attitudes, self-esteem, and reasons for exercise. J. Psychol. 2002, 136, 581–596. [Google Scholar] [CrossRef] [PubMed]
- Christofaro, D.G.D.; Ritti Dias, R.M.; de Andrade, S.M.; de Moraes, A.C.F.; Cabrera, M.A.S.; Feranades, R.A. Body weight dissatisfaction and its correlates among Brazilian adolescents. Med. Express. 2015, 2, 1–4. [Google Scholar] [CrossRef]
- Al Sabbah, H.; Vereecken, C.; Abdeen, Z.; Coats, E.; Maes, L. Associations of overweight and of weight dissatisfaction among Palestinian adolescents: Findings from the national study of Palestinian schoolchildren (HBSCWBG2004). J. Hum. Nutr. Diet. 2009, 22, 40–49. [Google Scholar] [CrossRef] [PubMed]
- Centers for Disease Control and Prevention. National Health and Nutrition Examination Survey. Available online: https://wwwn.cdc.gov/nchs/nhanes (accessed on 12 July 2017).
- Ahluwalia, N.; Dwyer, J.; Terry, A.; Moshfegh, A.; Johnson, C. Update on NHANES dietary data: Focus on collection, release, analytical considerations, and uses to inform public policy. Adv. Nutr. 2016, 7, 121–134. [Google Scholar] [CrossRef] [PubMed]
- United States Department of Agriculture. Food Patterns Equivalents Database. Available online: https://www.ars.usda.gov/northeast-area/beltsville-md/beltsville-human-nutrition-research-center/food-surveys-research-group/docs/fped-databases/ (accessed on 12 December 2017).
- Nadal, K. The Sage Encyclopedia of Psychology and Gender; SAGE Publications: Newbury Park, CA, USA, 2017. [Google Scholar]
- Centers for Disease Control and Prevention, National Center for Health Statistics. CDC Growth Charts: United States. Available online: http://www.cdc.gov/growthcharts/ (accessed on 30 May 2017).
- Armstrong, T.; Bull, F. Development of the world health organization global physical activity questionnaire (GPAQ). J. Public Health 2006, 14, 66–70. [Google Scholar] [CrossRef]
- Oja, P.; Titze, S. Physical activity recommendations for public health: Development and policy context. EPMA J. 2011, 2, 253–259. [Google Scholar] [CrossRef] [PubMed]
- National Cancer Institute, Division of Cancer Control & Population Sciences. Developing the Healthy Eating index. Available online: https://epi.grants.cancer.gov/hei/developing.html#2015 (accessed on 14 January 2018).
- National Cancer Institute. The Healthy Eating Index—HEI Scoring Algorithm Method. Available online: https://epi.grants.cancer.gov/hei/hei-scoring-method.html (accessed on 14 January 2018).
- U.S. Census Bureau, Population Division, Fertility & Family Statistics Branch. Current Population Survey: Definitions and Explanations. Available online: http://www.census.gov (accessed on 15 December 2017).
- CDC National Center for Health Statistics. Specifying Weighting Parameters. 2013. Available online: https://www.cdc.gov/nchs/tutorials/nhanes/surveydesign/weighting/intro.htm (accessed on 11 August 2017).
- Patte, K.A.; Laxer, R.E.; Qian, W.; Leatherdale, S.T. An analysis of weight perception and physical activity and dietary behaviours among youth in the COMPASS study. SSM-Popul. Health 2016, 2016, 841–849. [Google Scholar] [CrossRef] [PubMed]
- Storey, K.; Forbes, L.E.; Fraser, S.N.; Spence, J.C.; Plotnikoff, R.C.; Raine, K.D.; McCargar, L.J. Diet quality, nutrition and physical activity among adolescents: The Web-SPAN (Web-Survey of Physical Activity and Nutrition) project. Public Health Nutr. 2009, 12, 2009–2017. [Google Scholar] [CrossRef] [PubMed]
- Iannotti, R.J.; Wang, J. Trends in physical activity, sedentary behavior, diet, and BMI among US adolescents, 2001–2009. Pediatrics 2013, 132, 606–614. [Google Scholar] [CrossRef] [PubMed]
- Gu, X.; Tucker, K.L. Dietary quality of the US child and adolescent population: Trends from 1999 to 2012 and associations with the use of federal nutrition assistance programs. Am. J. Clin. Nutr. 2017, 105, 194–202. [Google Scholar] [CrossRef] [PubMed]
- Basiotis, P.P.; Carlson, A.; Gerrior, S.A.; Juan, W.Y.; Lino, M. Reporet Card on the Quality of Americans’ Diets, USDA Center for Nutrition Policy and Promotion Insight 2002. Available online: https://www.cnpp.usda.gov/sites/default/files/archived_projects/fenrv16n2.pdf (accessed on 12 January 2018).
- de Assumpção, D.; Barros, M.B.; Fisberg, R.M.; Carandina, L.; Goldbaum, M.; Cesar, C.L. Diet quality among adolescents: A population-based study in Campinas, Brazil. Rev. Bras. Epidemiol. 2012, 15, 605–616. [Google Scholar] [CrossRef] [PubMed]
- Shriver, L.H.; Harrist, A.W.; Page, M.; Hubbs-Tait, L.; Moulton, M.; Topham, G. Differences in body esteem by weight status, gender, and physical activity among young elementary school-aged children. Body Image 2013, 10, 78–84. [Google Scholar] [CrossRef] [PubMed]


| Total | Males | Females | p Value | |
|---|---|---|---|---|
| n = 2965 | n = 1504 | n = 1461 | ||
| Gender, n (weighted %) | ||||
| Males | 1504 (50.3) | - | - | - |
| Females | 1461 (49.7) | - | - | - |
| Age (years) (mean ± SE) | 14.5 ± 0.0 | 14.5 ± 0.1 | 14.6 ± 0.1 | 0.409 |
| Ethnicity, n (weighted %) | ||||
| Non-Hispanic White | 827 (57.7) | 435 (57.4) | 392 (57.9) | 0.804 |
| Non-Hispanic Black | 748 (14.1) | 378 (14.0) | 370 (14.2) | 0.856 |
| Mexican American | 695 (13.7) | 346 (13.8) | 349 (13.5) | 0.787 |
| Other Hispanic | 342 (6.5) | 171 (6.6) | 171 (6.4) | 0.772 |
| Others | 353 (8.0) | 174 (8.1) | 179 (7.9) | 0.857 |
| Parent education level, n (weighted %) | ||||
| High school or less | 1420 (39.6) | 719 (38.9) | 701 (40.3) | 0.524 |
| College or above | 1451 (60.4) | 736 (61.1) | 715 (59.7) | 0.524 |
| Poverty to income ratio, n (weighted %) | ||||
| <1.0 | 793 (19.4) | 394 (19.0) | 399 (19.9) | 0.589 |
| ≥1.0 | 1941 (80.6) | 994 (81.0) | 947 (80.1) | 0.589 |
| BMI (kg/m2) | 23.5 ± 0.1 | 23.4 ± 0.2 | 23.6 ± 0.2 | 0.446 |
| Weight status, n (weighted %) | ||||
| Normal weight | 1765 (62.1) | 905 (60.6) | 860 (63.6) | 0.308 |
| Overweight | 521 (17.1) | 254 (17.6) | 267 (16.6) | 0.604 |
| Obesity | 679 (20.8) | 345 (21.8) | 334 (19.8) | 0.291 |
| Perceived weight status, n (weighted %) | ||||
| Thin | 196 (5.5) | 128 (7.3) | 68 (3.6) | <0.001 * |
| Normal | 2055 (72.6) | 1093 (75.6) | 962 (69.6) | <0.001 * |
| Overweight/Obese | 714 (21.9) | 283 (17.1) | 431 (26.8) | <0.001 * |
| Accurate weight perception # | ||||
| Normal | 1481 (74.1) | 760 (76.3) | 721 (72.0) | 0.072 |
| Overweight | 148 (6.4) | 46 (4.3) | 102 (8.3) | 0.012 * |
| Obese | 471 (19.6) | 217 (19.4) | 254 (19.7) | 0.898 |
| Weight satisfaction, n (weighted %) | ||||
| Satisfied | 938 (44.2) | 471 (46.0) | 467 (42.6) | 0.191 |
| Dissatisfied | 1358 (55.8) | 634 (54.0) | 724 (57.4) | 0.191 |
| Weight satisfaction by weight category, n (weighted %) | ||||
| Normal weight | ||||
| Satisfied | 727(61.6) | 343(61.6) | 384(61.6) | 0.993 |
| Dissatisfied | 474(38.4) | 225(38.4) | 249(38.4) | 0.993 |
| Overweight | ||||
| Satisfied | 134(33.8) | 80(45.0) | 54(21.9) | <0.001 * |
| Dissatisfied | 313(66.2) | 132(55.0) | 181(78.1) | <0.001 * |
| Obesity | ||||
| Satisfied | 77(14.8) | 48(18.7) | 29(10.6) | 0.079 |
| Dissatisfied | 571(85.2) | 277(81.3) | 294(89.4) | 0.079 |
| Physical activity (PA) | ||||
| Total PA (MET-minutes/week) | 2798.1 ± 85.2 | 3350.7 ± 121.7 | 2239.8 ± 92.1 | <0.001 * |
| Met PA recommendation $, n (weighted %) | 1491 (54.9) | 900 (63.8) | 591 (45.9) | <0.001 * |
| Sedentary (sitting) in minutes/day | 498.1 ± 5.5 | 489.1 ± 7.1 | 507.1 ± 6.4 | 0.026 * |
| Diet quality score (HEI 2015) | ||||
| Total diet quality (mean ± SE) | 47.5 ± 0.3 | 46.9 ± 0.4 | 48.1 ± 0.4 | 0.016 * |
| Tertile classification of total diet quality score, n (weighted %) | ||||
| First tertile (<42.1) | 978 (34.3) | 517 (34.7) | 461 (34.0) | 0.741 |
| Second tertile (42.1–51.7) | 978 (32.7) | 518 (34.6) | 460 (30.8) | 0.108 |
| Third tertile (>51.7) | 1009 (32.9) | 469 (30.7) | 540 (35.2) | 0.023 * |
| Total | Males | Females | Proportion Difference between Females and Males (95% CI) | p Value | |
|---|---|---|---|---|---|
| Groups, n (weighted %) | n = 2965 | n = 1504 | n = 1461 | n = 2965 | |
| Group 1: Healthier behaviors | 515 (18.6) | 282 (19.3) | 233 (18.0) | −1.27 (−4.84, 2.31) | 0.481 |
| Group 2: Healthier diet only | 494 (14.3) | 187 (11.4) | 307 (17.2) | 5.75 (2.56, 8.94) | <0.001 * |
| Group 3: Physically active only | 976 (36.3) | 618 (44.5) | 358 (27.9) | −16.63 (−20.1, −13.15) | <0.001 * |
| Group 4: Unhealthier behaviors | 980 (30.8) | 417 (24.7) | 563 (36.9) | 12.14 (8.48, 15.81) | <0.001 * |
| Group 1: Healthier Behaviors | Group 2: Healthier Diet Only | Group 3: Physically Active Only | Group 4: Unhealthier Behaviors | Overall p Value | |
|---|---|---|---|---|---|
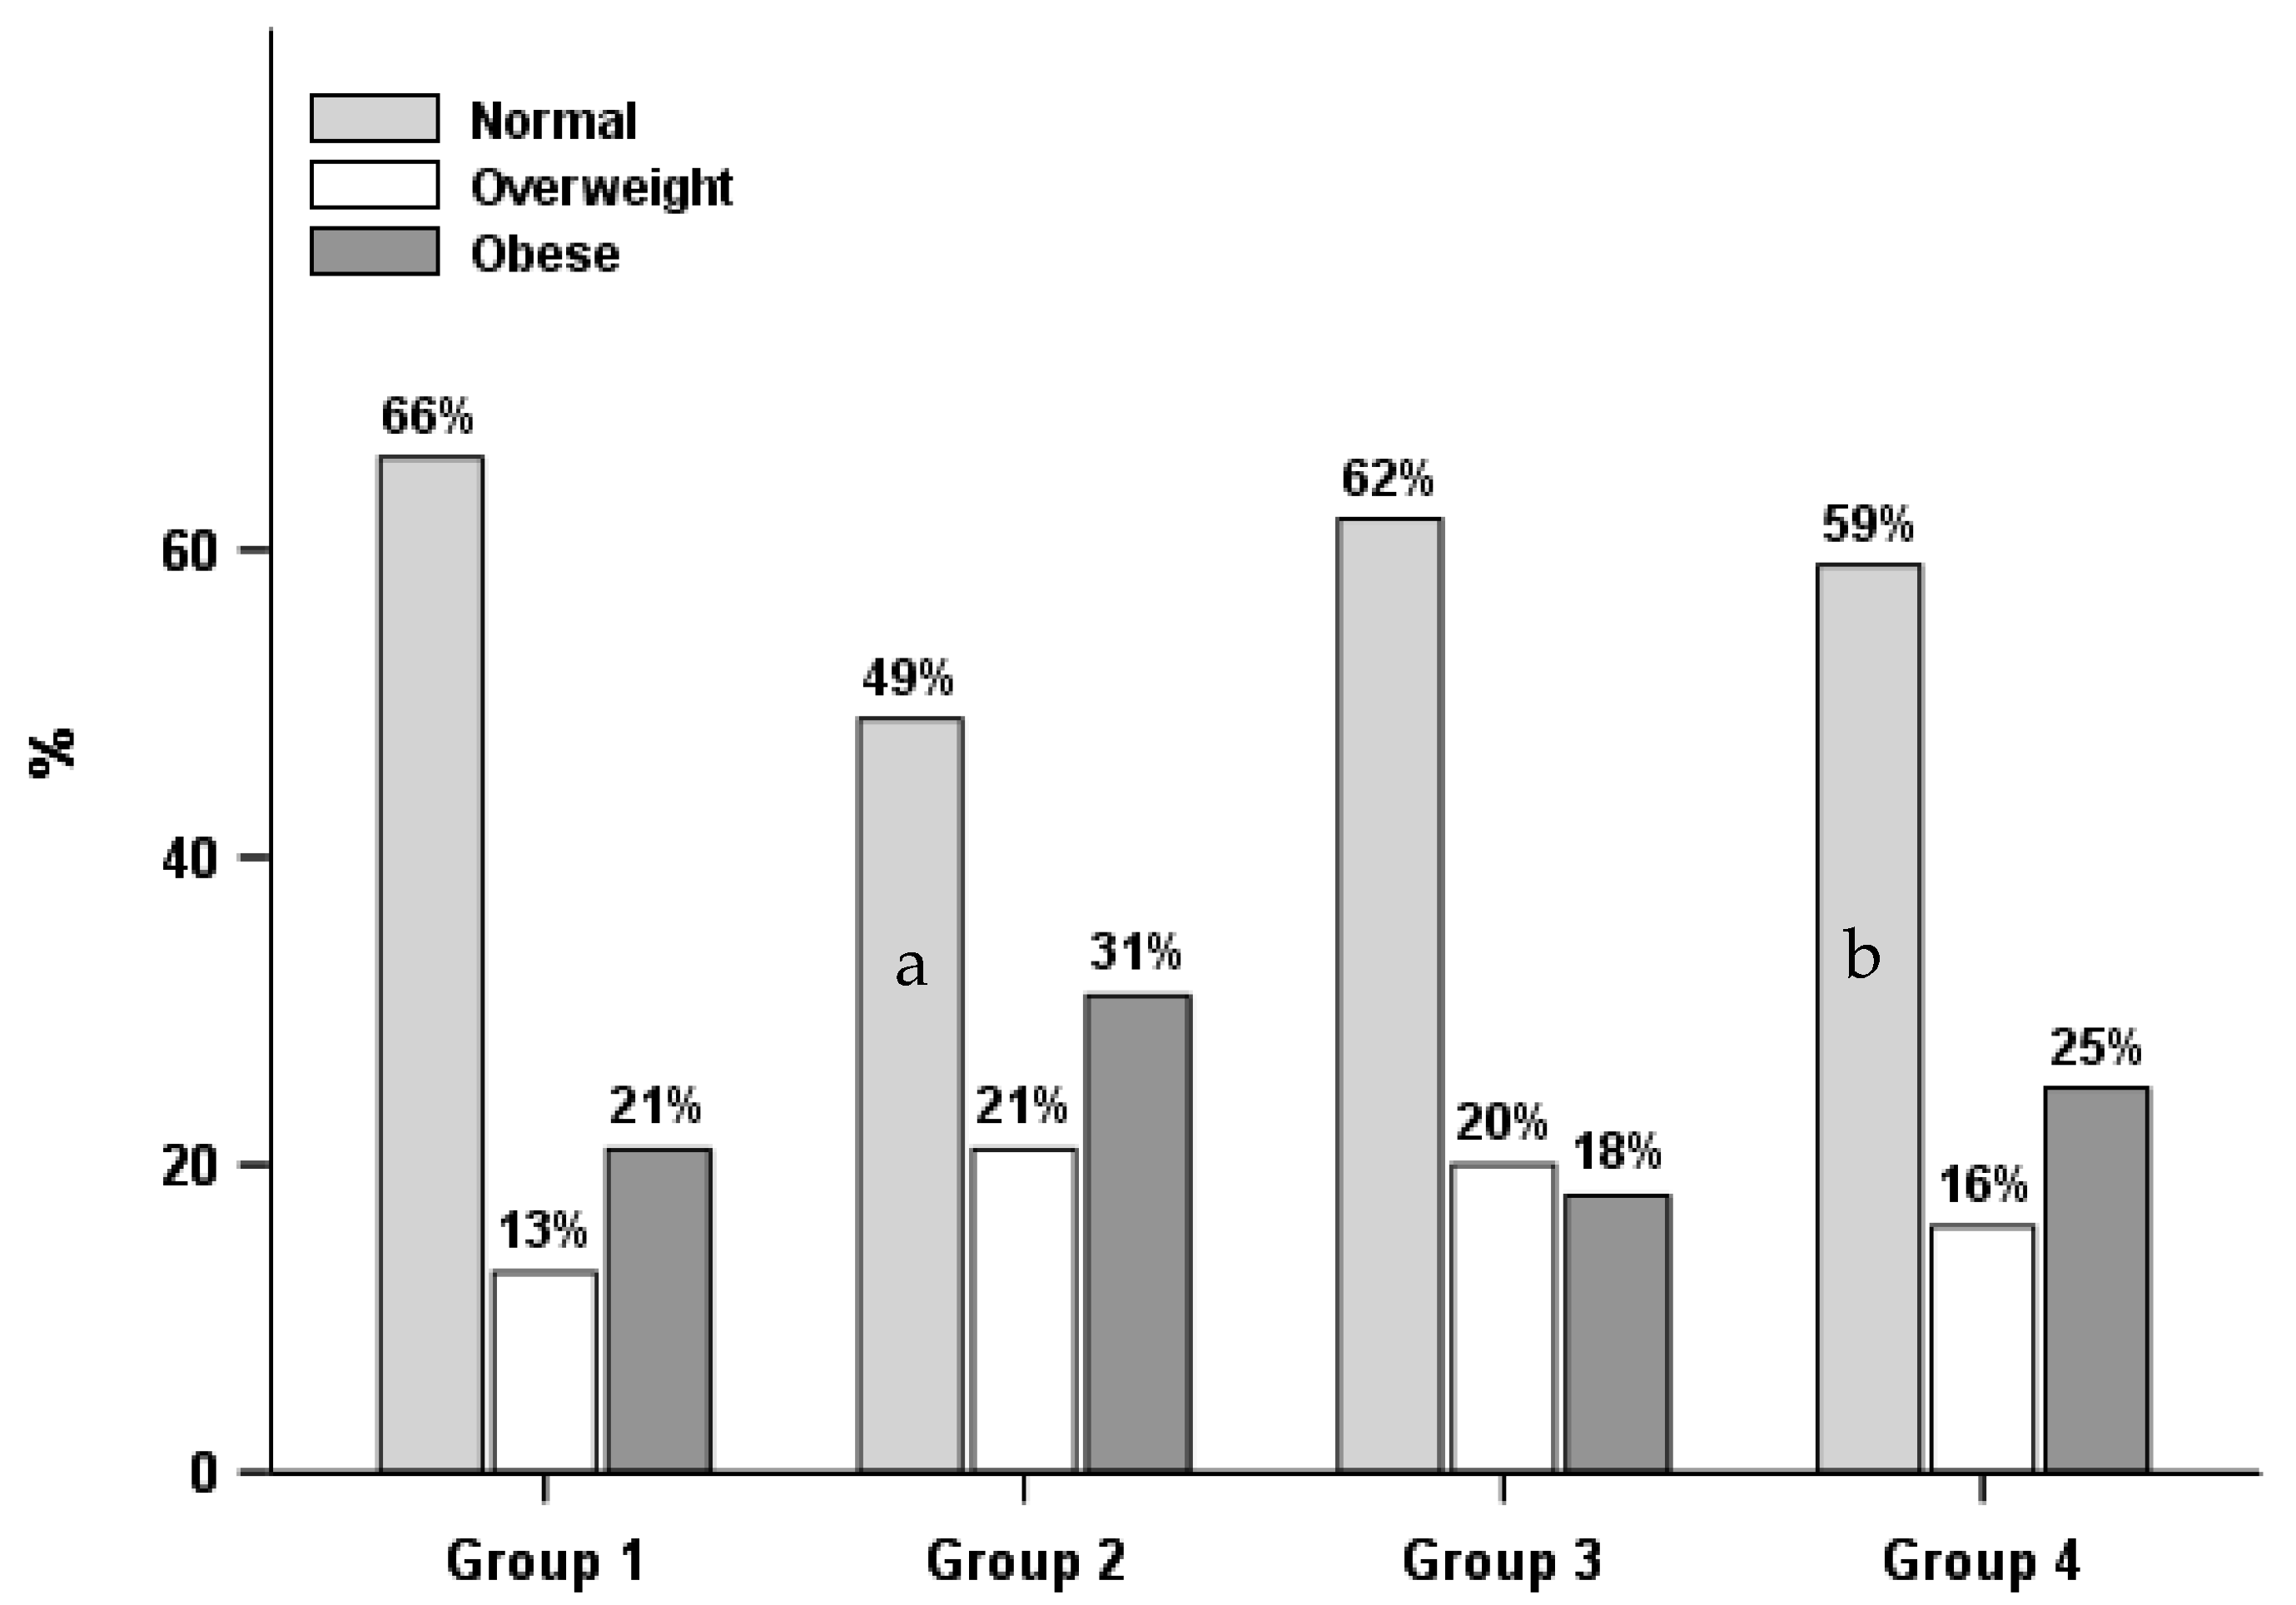
| Males (n = 1504) | n = 282 (19.3%) | n = 187 (11.4%) | n = 618 (44.5%) | n = 417 (24.7%) | |
| Weight status | |||||
| Normal weight | 173 (65.9) | 92 (48.7) a | 386 (62.1) | 254 (59.2) c | 0.017 * |
| Overweight | 43 (12.8) | 37 (20.6) | 109 (20.1) | 65 (15.6) | 0.041 * |
| Obese | 66 (21.4) | 58 (30.7) | 123 (17.7) | 98 (25.2) | 0.038 * |
| Perceived weight status | |||||
| Thin | 18 (5.0) | 16 (7.8) | 58 (7.9) | 36 (7.9) | 0.258 |
| Normal | 210 (78.1) | 121 (66.4) a | 466 (79.3) | 296 (71.0) | 0.022 * |
| Overweight/Obese | 54 (16.9) | 50 (25.8) a | 94 (12.8) b | 85 (21.1) | 0.005 * |
| Accurate weight perception | |||||
| Normal | 150 (79.3) | 73 (61.7) a | 323 (81.5) b | 214 (71.4) | 0.007 * |
| Overweight | 7 (3.2) | 9 (6.9) | 13 (2.5) | 17 (6.9) | 0.048 * |
| Obese | 41 (17.5) | 38 (31.5) | 75 (16.0) | 63 (21.7) | 0.045 * |
| Weight satisfaction | |||||
| Satisfied | 94 (53.0) | 54 (43.8) | 193 (44.7) | 130 (43.9) | 0.468 |
| Dissatisfied | 119 (47.0) | 94 (56.2) | 255 (55.3) | 166 (56.1) | 0.468 |
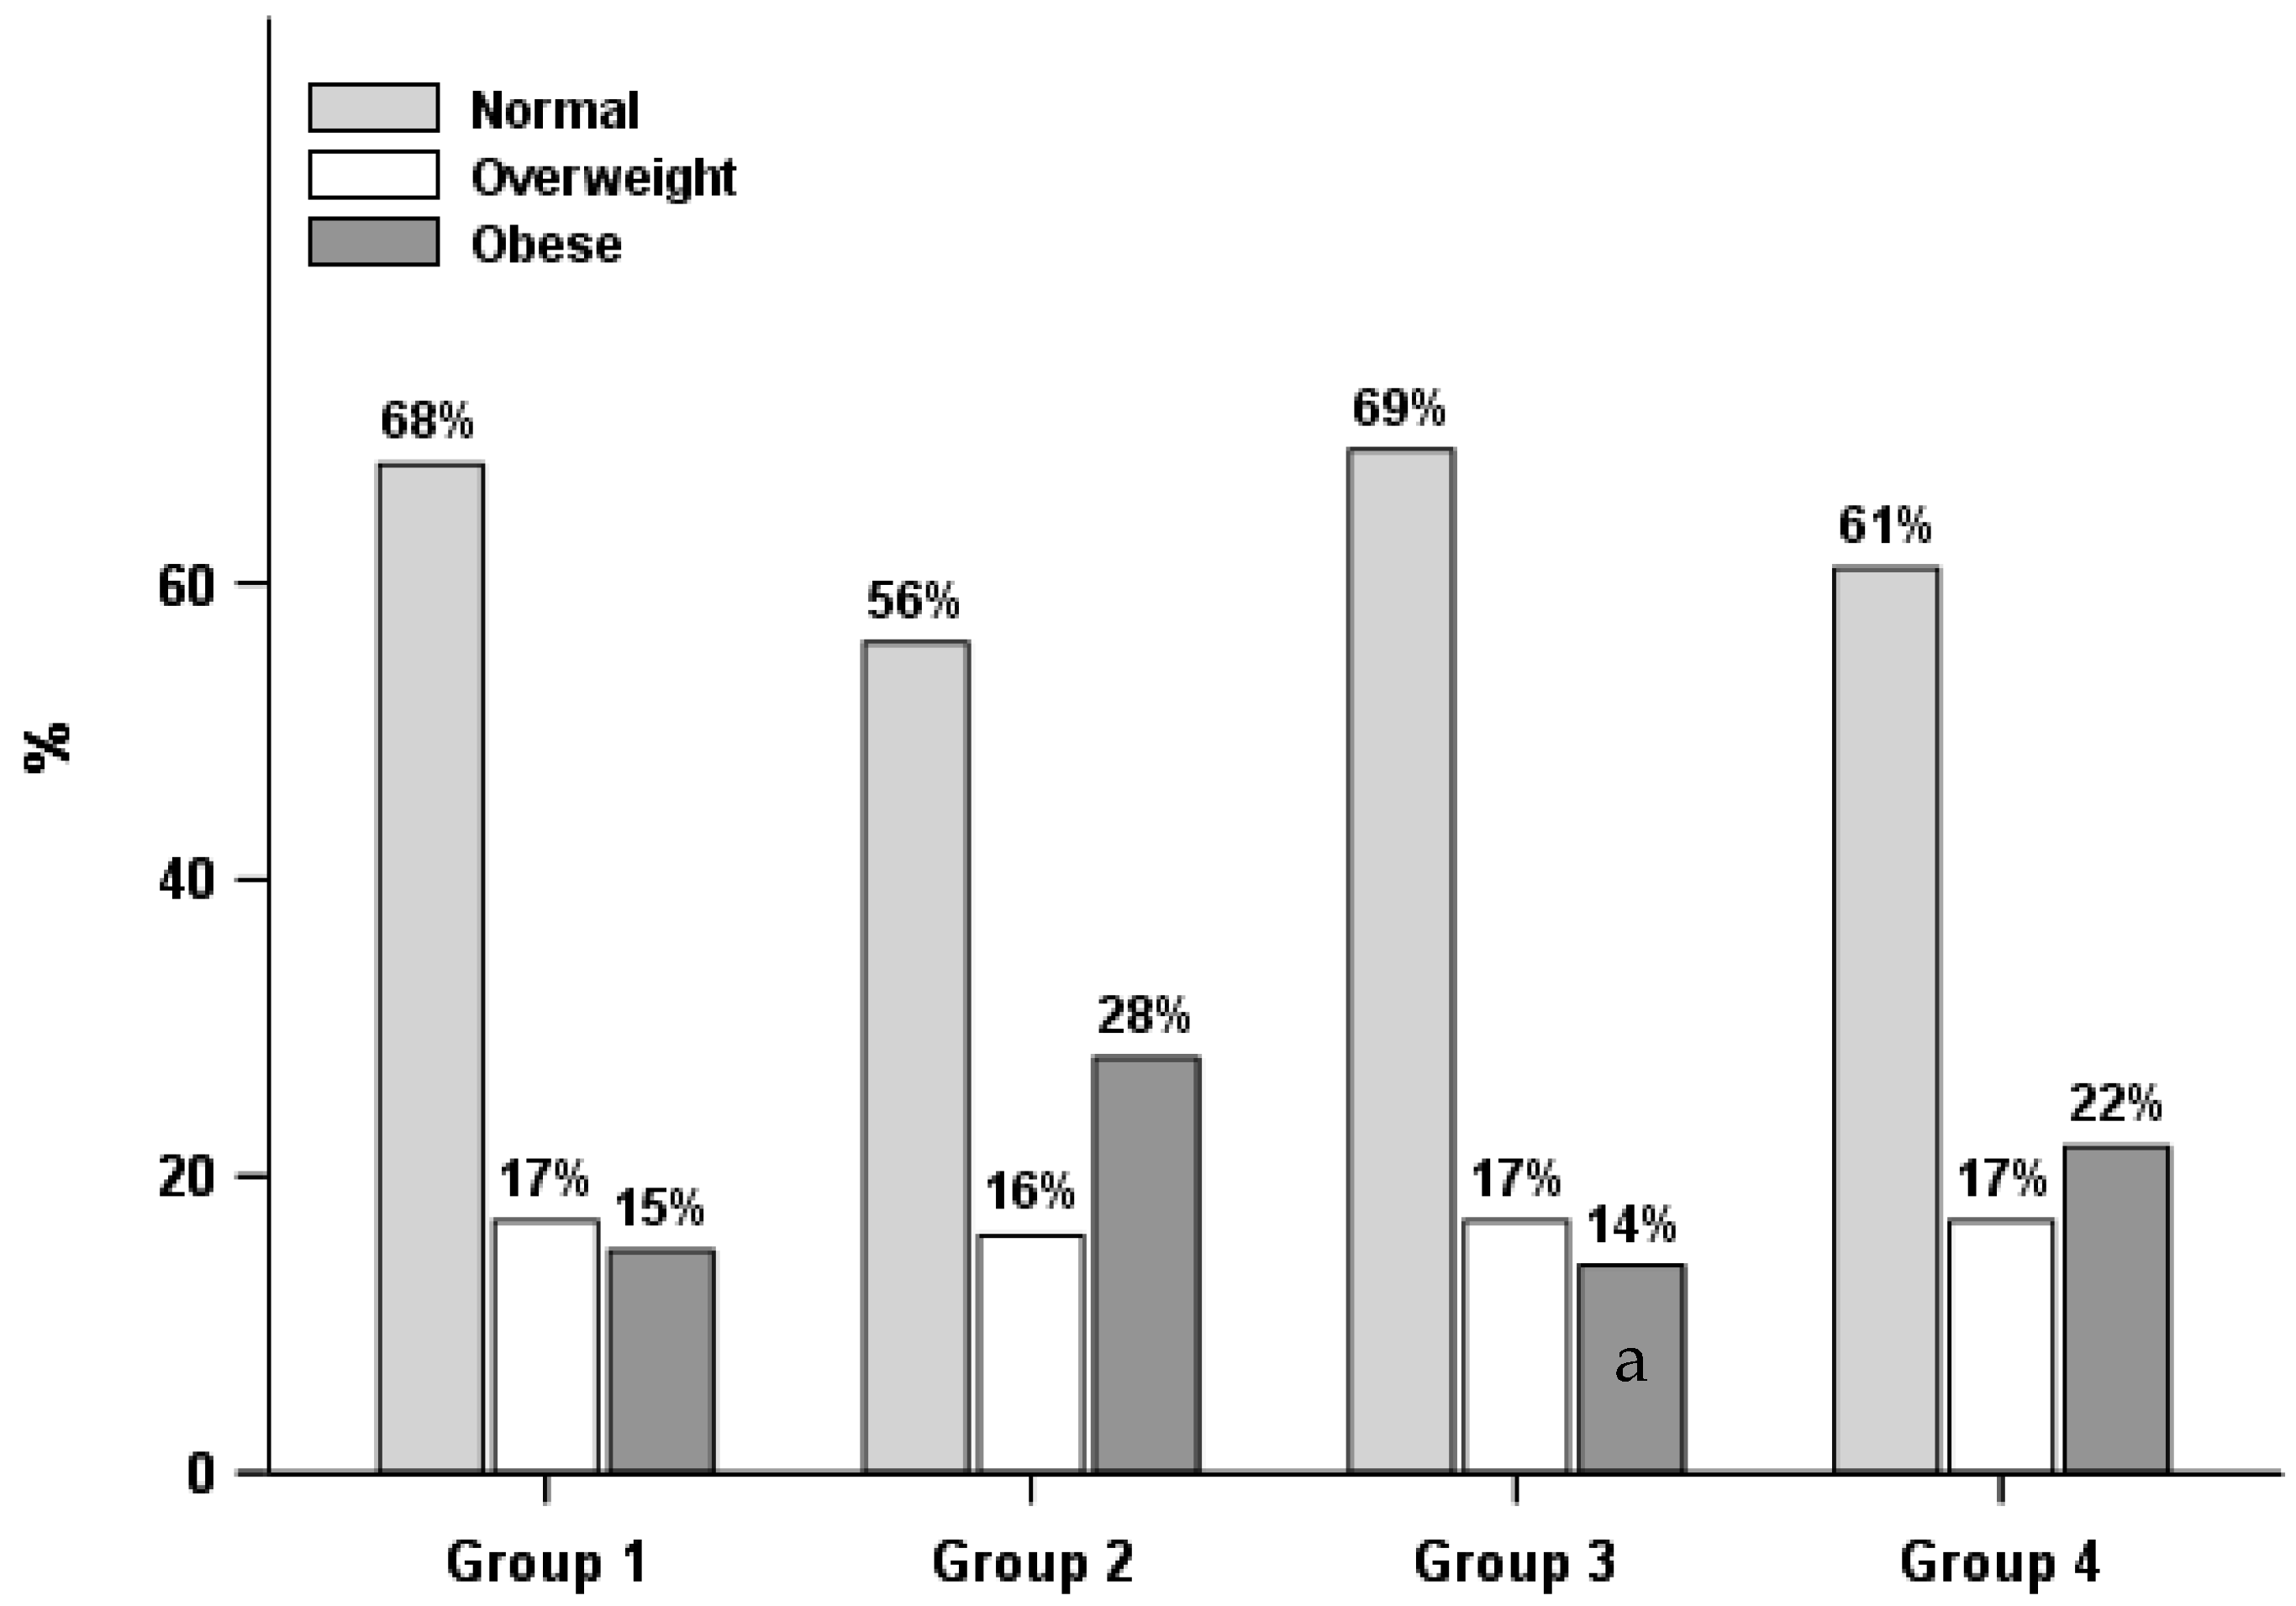
| Females (n = 1461) | n = 233 (18.0%) | n = 307 (17.2%) | n = 358 (27.9%) | n = 563 (36.9%) | |
| Weight status | |||||
| Normal weight | 145 (68.0) | 165 (56.3) | 216 (68.8) | 334 (60.9) | 0.222 |
| Overweight | 42 (16.7) | 58 (15.7) | 74 (17.0) | 93 (16.6) | 0.956 |
| Obese | 46 (15.3) | 84 (28.1) | 68 (14.2) b | 136 (22.5) | 0.007 * |
| Perceived weight status | |||||
| Thin | 9 (3.4) | 16 (4.7) | 15 (2.8) | 28 (3.8) | 0.538 |
| Normal | 168 (73.7) | 181 (59.2) | 250 (75.4) b | 363 (68.1) | 0.023 * |
| Overweight/Obese | 56 (23.0) | 110 (36.1) | 93 (21.8) b | 172 (28.1) | 0.049 * |
| Accurate weight perception | |||||
| Normal | 132 (76.4) | 132 (60.6) | 182 (78.7) b | 275 (69.7) | 0.036 * |
| Overweight | 15 (8.2) | 30 (11.1) | 25 (7.8) | 32 (7.4) | 0.863 |
| Obese | 35 (15.5) | 63 (28.3) | 49 (13.5) | 107 (22.9) | 0.011 * |
| Weight satisfaction | |||||
| Satisfied | 88 (52.0) | 80 (29.1) a | 110 (43.5) | 189 (43.8) c | 0.009 * |
| Dissatisfied | 103 (48.0) | 175 (70.9) a | 178 (56.5) | 268 (56.2) c | 0.009 * |
| Group 2: Healthier Diet Only vs. Group 1: Healthier Behaviors | Group 3: Physically Active Only vs. Group 1: Healthier Behaviors | Group 4: Unhealthier Behaviors vs. Group 1: Healthier Behaviors | ||||
|---|---|---|---|---|---|---|
| Males (n = 1504) | Adjusted ORs (95% CI) | p Value | Adjusted ORs (95% CI) | p Value | Adjusted ORs (95% CI) | p Value |
| Weight status | ||||||
| Normal weight | 1.0 (REF) | 1.0 (REF) | 1.0 (REF) | |||
| Overweight | 2.33 (1.15, 4.68) | 0.016* | 1.73 (1.00, 3.00) | 0.046 * | 1.21 (0.67, 2.19) | 0.528 |
| Obese | 1.90 (1.02, 3.52) | 0.038* | 0.85 (0.50, 1.44) | 0.537 | 1.14 (0.69, 1.86) | 0.605 |
| Perceived weight status | ||||||
| Normal | 1.0 (REF) | 1.0 (REF) | 1.0 (REF) | |||
| Thin | 0.89 (0.34, 2.32) | 0.805 | 1.43 (0.71, 2.88) | 0.308 | 1.45 (0.71, 2.95) | 0.301 |
| Overweight/Obese | 2.09 (1.09, 3.99) | 0.024* | 0.82 (0.49, 1.38) | 0.444 | 1.37 (0.87, 2.16) | 0.164 |
| Accurate weight perception | ||||||
| Normal | 1.0 (REF) | 1.0 (REF) | 1.0 (REF) | |||
| Overweight | 3.87 (1.01, 15.69) | 0.047 * | 1.09 (0.33, 3.63) | 0.886 | 3.15 (1.00, 10.04) | 0.048 * |
| Obese | 2.33 (1.12, 4.88) | 0.022 * | 0.90 (0.48, 1.68) | 0.74 | 1.18 (0.66, 2.10) | 0.571 |
| Weight satisfaction | ||||||
| Dissatisfied | 1.0 (REF) | 1.0 (REF) | 1.0 (REF) | |||
| Satisfied | 0.69 (0.40, 1.19) | 0.174 | 0.73 (0.46, 1.15) | 0.165 | 0.75 (0.45, 1.24) | 0.256 |
| Females (n = 1461) | ||||||
| Weight status | ||||||
| Normal weight | 1.0 (REF) | 1.0 (REF) | 1.0 (REF) | |||
| Overweight | 1.05 (0.51, 2.17) | 0.885 | 1.02 (0.51, 2.05) | 0.953 | 1.06 (0.56, 2.00) | 0.856 |
| Obese | 1.97 (0.96, 4.04) | 0.058 | 0.92 (0.51, 1.66) | 0.779 | 1.52 (0.85, 2.73) | 0.153 |
| Perceived weight status | ||||||
| Normal | 1.0 (REF) | 1.0 (REF) | 1.0 (REF) | |||
| Thin | 1.47 (0.37, 5.80) | 0.576 | 0.54 (0.13, 2.19) | 0.383 | 1.04 (0.27, 3.98) | 0.949 |
| Overweight/Obese | 1.53 (0.83, 2.84) | 0.167 | 0.84 (0.51, 1.38) | 0.472 | 1.25 (0.75, 2.10) | 0.378 |
| Accurate weight perception | ||||||
| Normal | 1.0 (REF) | 1.0 (REF) | 1.0 (REF) | |||
| Overweight | 1.41 (0.48, 4.20) | 0.525 | 0.86 (0.39, 1.87) | 0.69 | 0.94 (0.37, 2.36) | 0.889 |
| Obese | 1.80 (0.87, 3.72) | 0.105 | 0.79 (0.41, 1.53) | 0.477 | 1.42 (0.74, 2.70) | 0.28 |
| Weight satisfaction | ||||||
| Dissatisfied | 1.0 (REF) | 1.0 (REF) | 1.0 (REF) | |||
| Satisfied | 0.41 (0.23, 0.75) | 0.003 * | 0.74 (0.43, 1.27) | 0.269 | 0.74 (0.41, 1.34) | 0.307 |
© 2018 by the authors. Licensee MDPI, Basel, Switzerland. This article is an open access article distributed under the terms and conditions of the Creative Commons Attribution (CC BY) license (http://creativecommons.org/licenses/by/4.0/).
Share and Cite
Xu, F.; Cohen, S.A.; Greaney, M.L.; Greene, G.W. The Association between US Adolescents’ Weight Status, Weight Perception, Weight Satisfaction, and Their Physical Activity and Dietary Behaviors. Int. J. Environ. Res. Public Health 2018, 15, 1931. https://doi.org/10.3390/ijerph15091931
Xu F, Cohen SA, Greaney ML, Greene GW. The Association between US Adolescents’ Weight Status, Weight Perception, Weight Satisfaction, and Their Physical Activity and Dietary Behaviors. International Journal of Environmental Research and Public Health. 2018; 15(9):1931. https://doi.org/10.3390/ijerph15091931
Chicago/Turabian StyleXu, Furong, Steven A. Cohen, Mary L. Greaney, and Geoffrey W. Greene. 2018. "The Association between US Adolescents’ Weight Status, Weight Perception, Weight Satisfaction, and Their Physical Activity and Dietary Behaviors" International Journal of Environmental Research and Public Health 15, no. 9: 1931. https://doi.org/10.3390/ijerph15091931
APA StyleXu, F., Cohen, S. A., Greaney, M. L., & Greene, G. W. (2018). The Association between US Adolescents’ Weight Status, Weight Perception, Weight Satisfaction, and Their Physical Activity and Dietary Behaviors. International Journal of Environmental Research and Public Health, 15(9), 1931. https://doi.org/10.3390/ijerph15091931