Advice and Frequently Asked Questions (FAQs) for Citizen-Science Environmental Health Assessments

Abstract
1. Introduction
2. Methods
- Form partnership and identify stakeholders
- Define goals, objectives, and hypotheses
- Identify environmental health stressors and salutary factors
- Collect data, topic-expert knowledge, and local input
- Rank environmental health stressors and salutary factors
- Identify risk mitigation strategies
- Collect information on technical, financial, and human resources for mitigation
- Prioritize risk mitigation strategies
- Plan post-project long-term goals
- Measure success using agreed-upon metrics
2.1. Newark Project
2.1.1. Location Description
2.1.2. Partners, Goals, Objectives
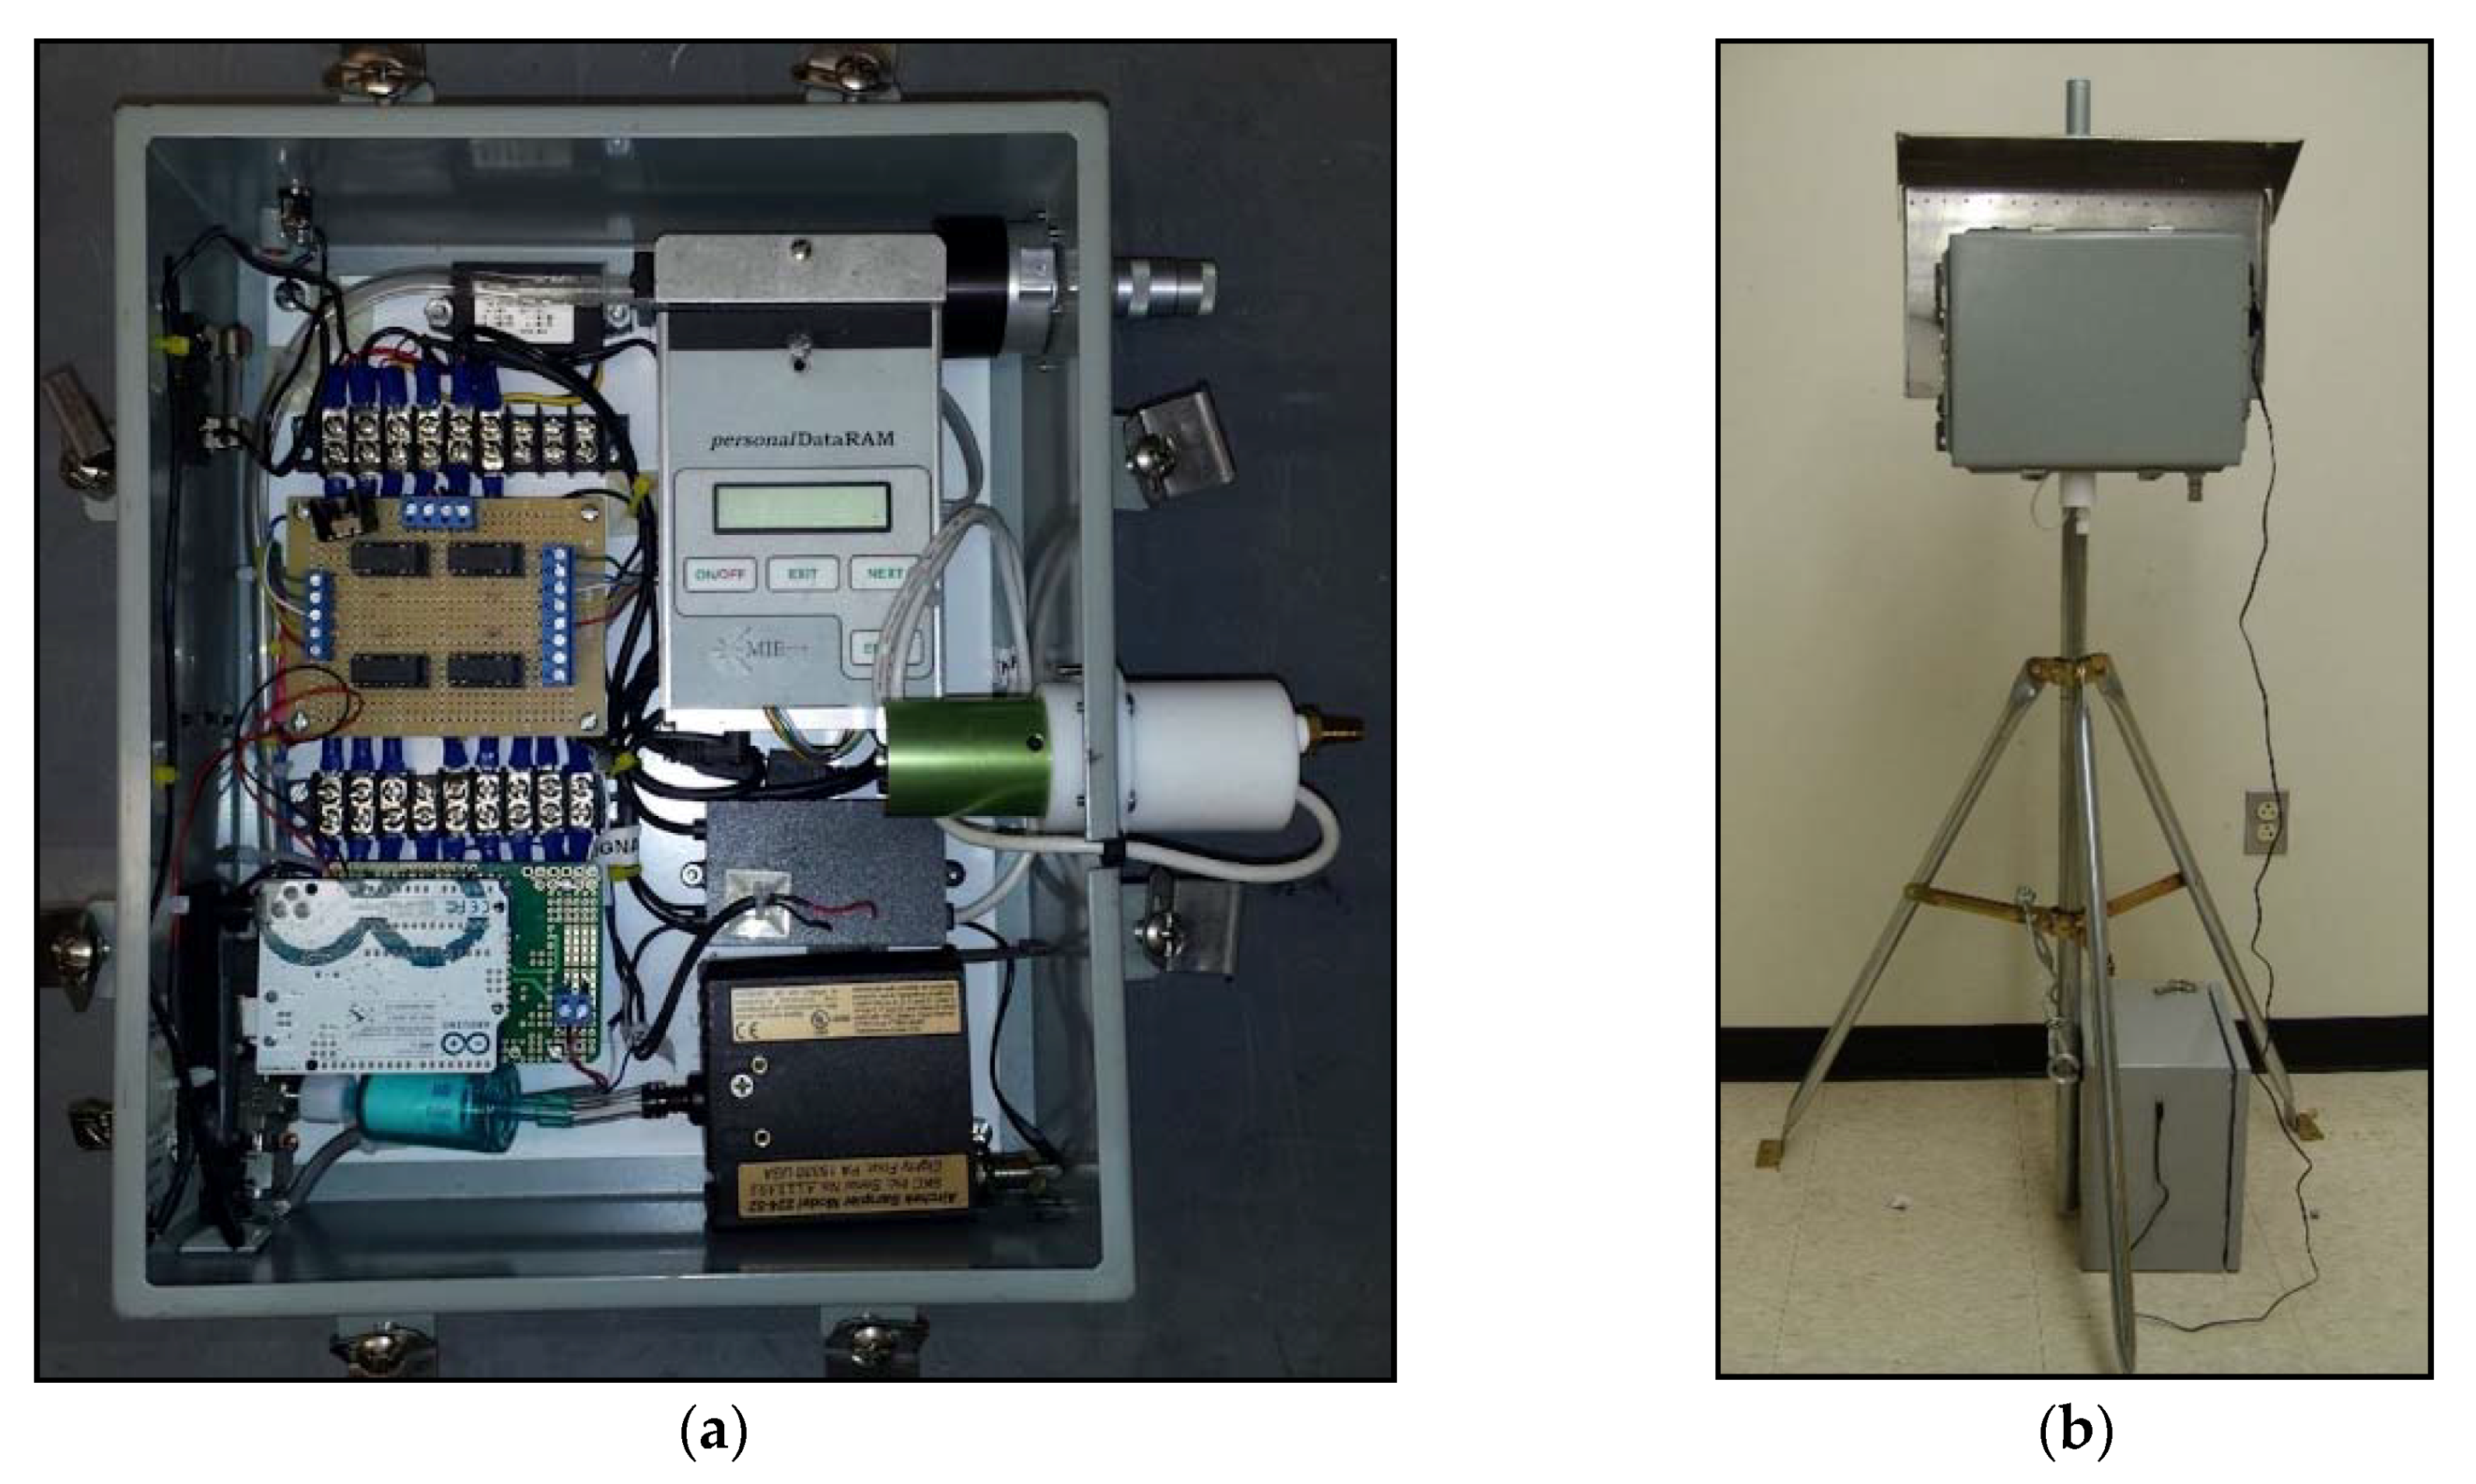
2.1.3. Data Collection
2.2. Newport News Project
2.2.1. Location Description
2.2.2. Partners, Goals, Objectives
2.2.3. Data Collection
3. Results
3.1. Newark
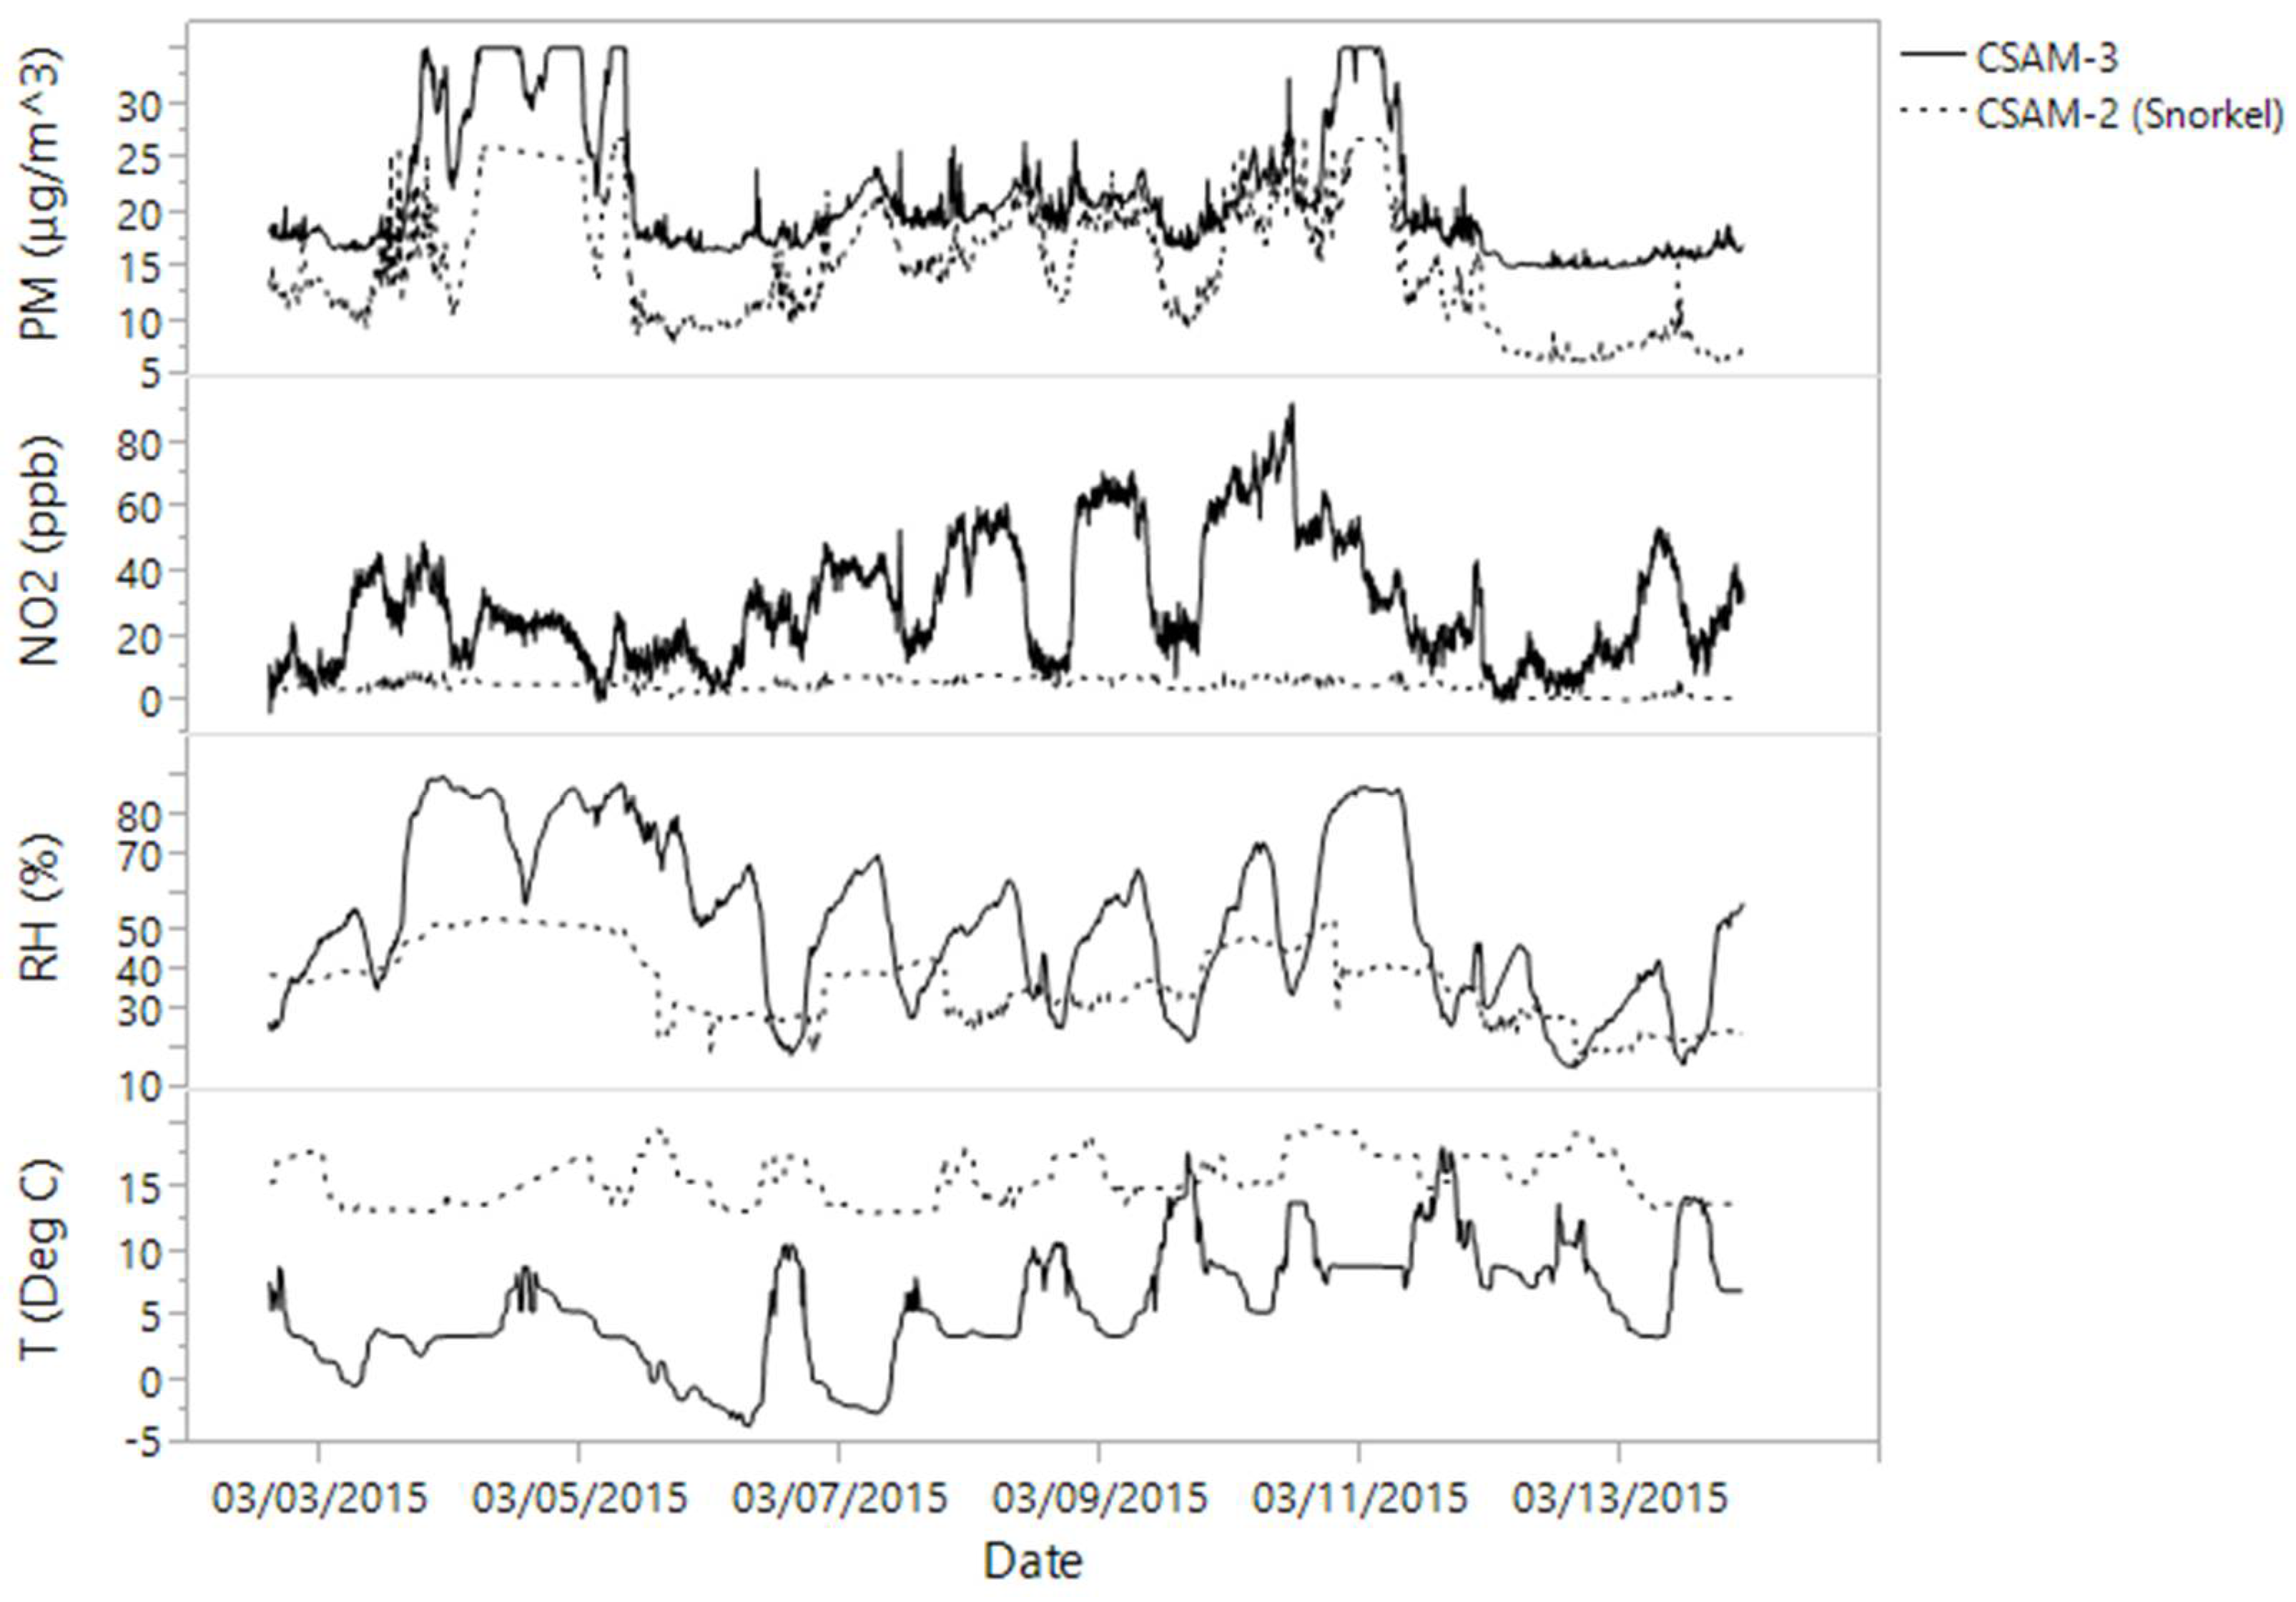
3.1.1. Data Summary
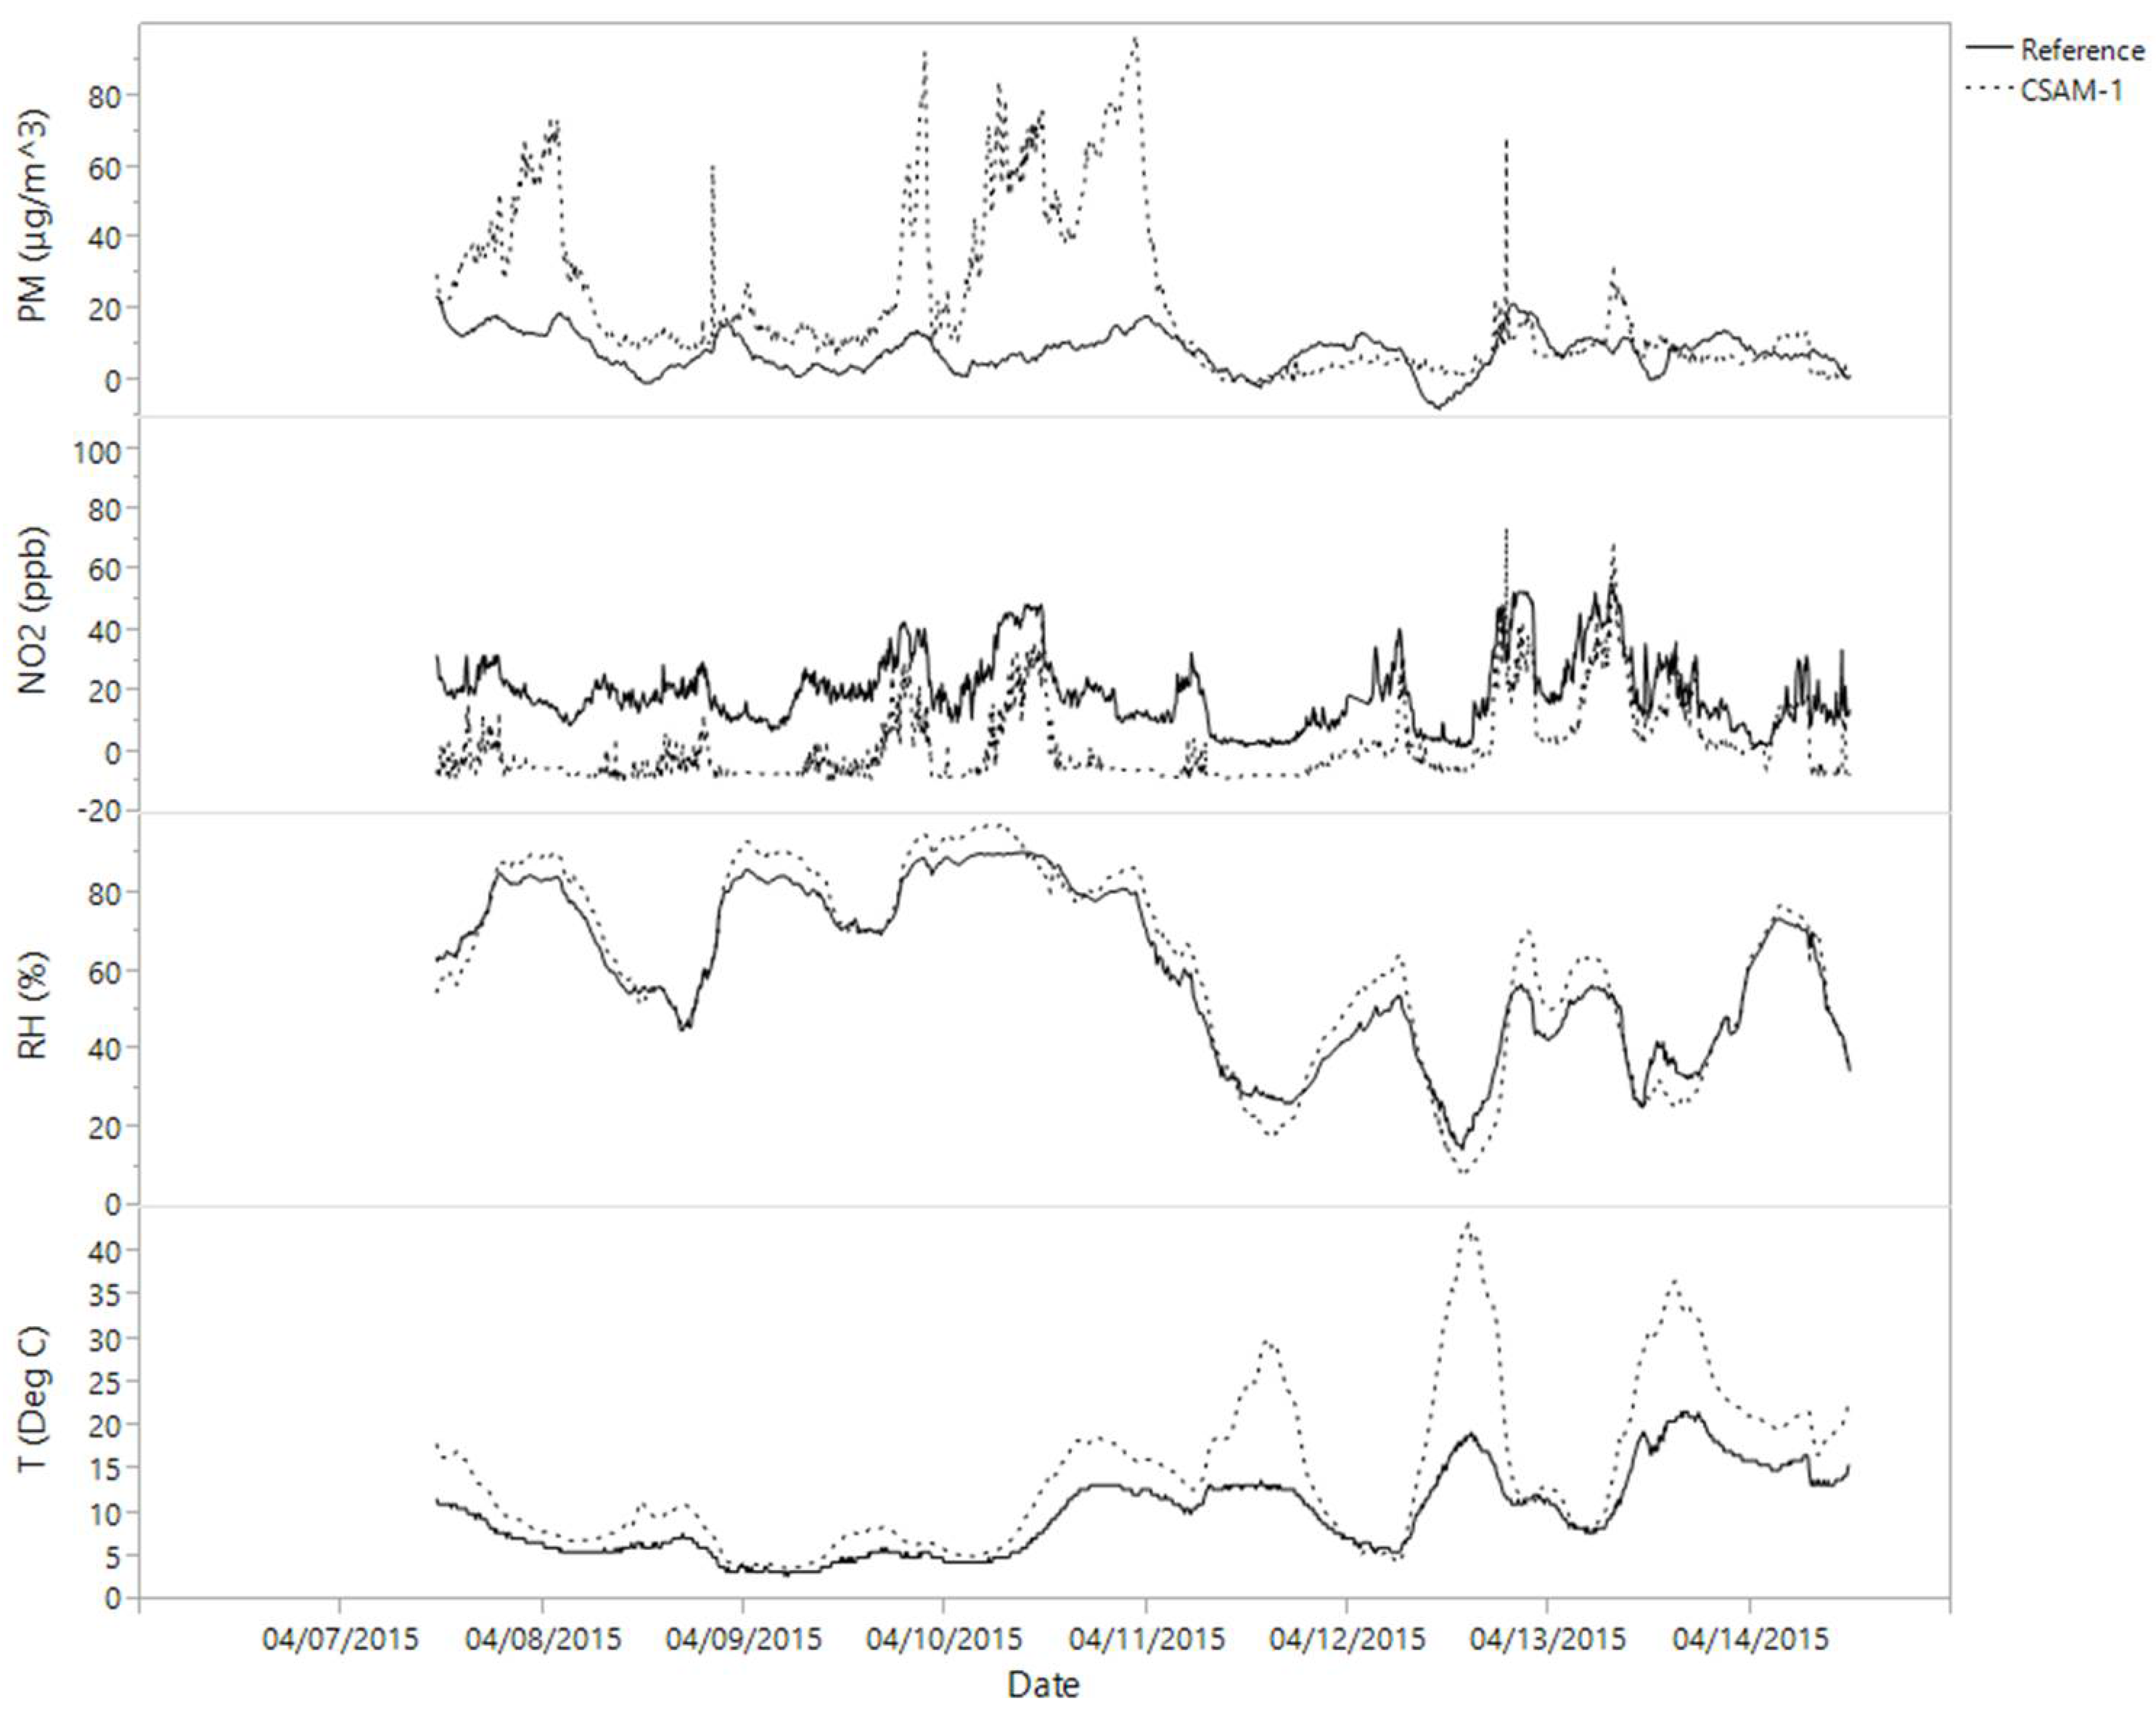
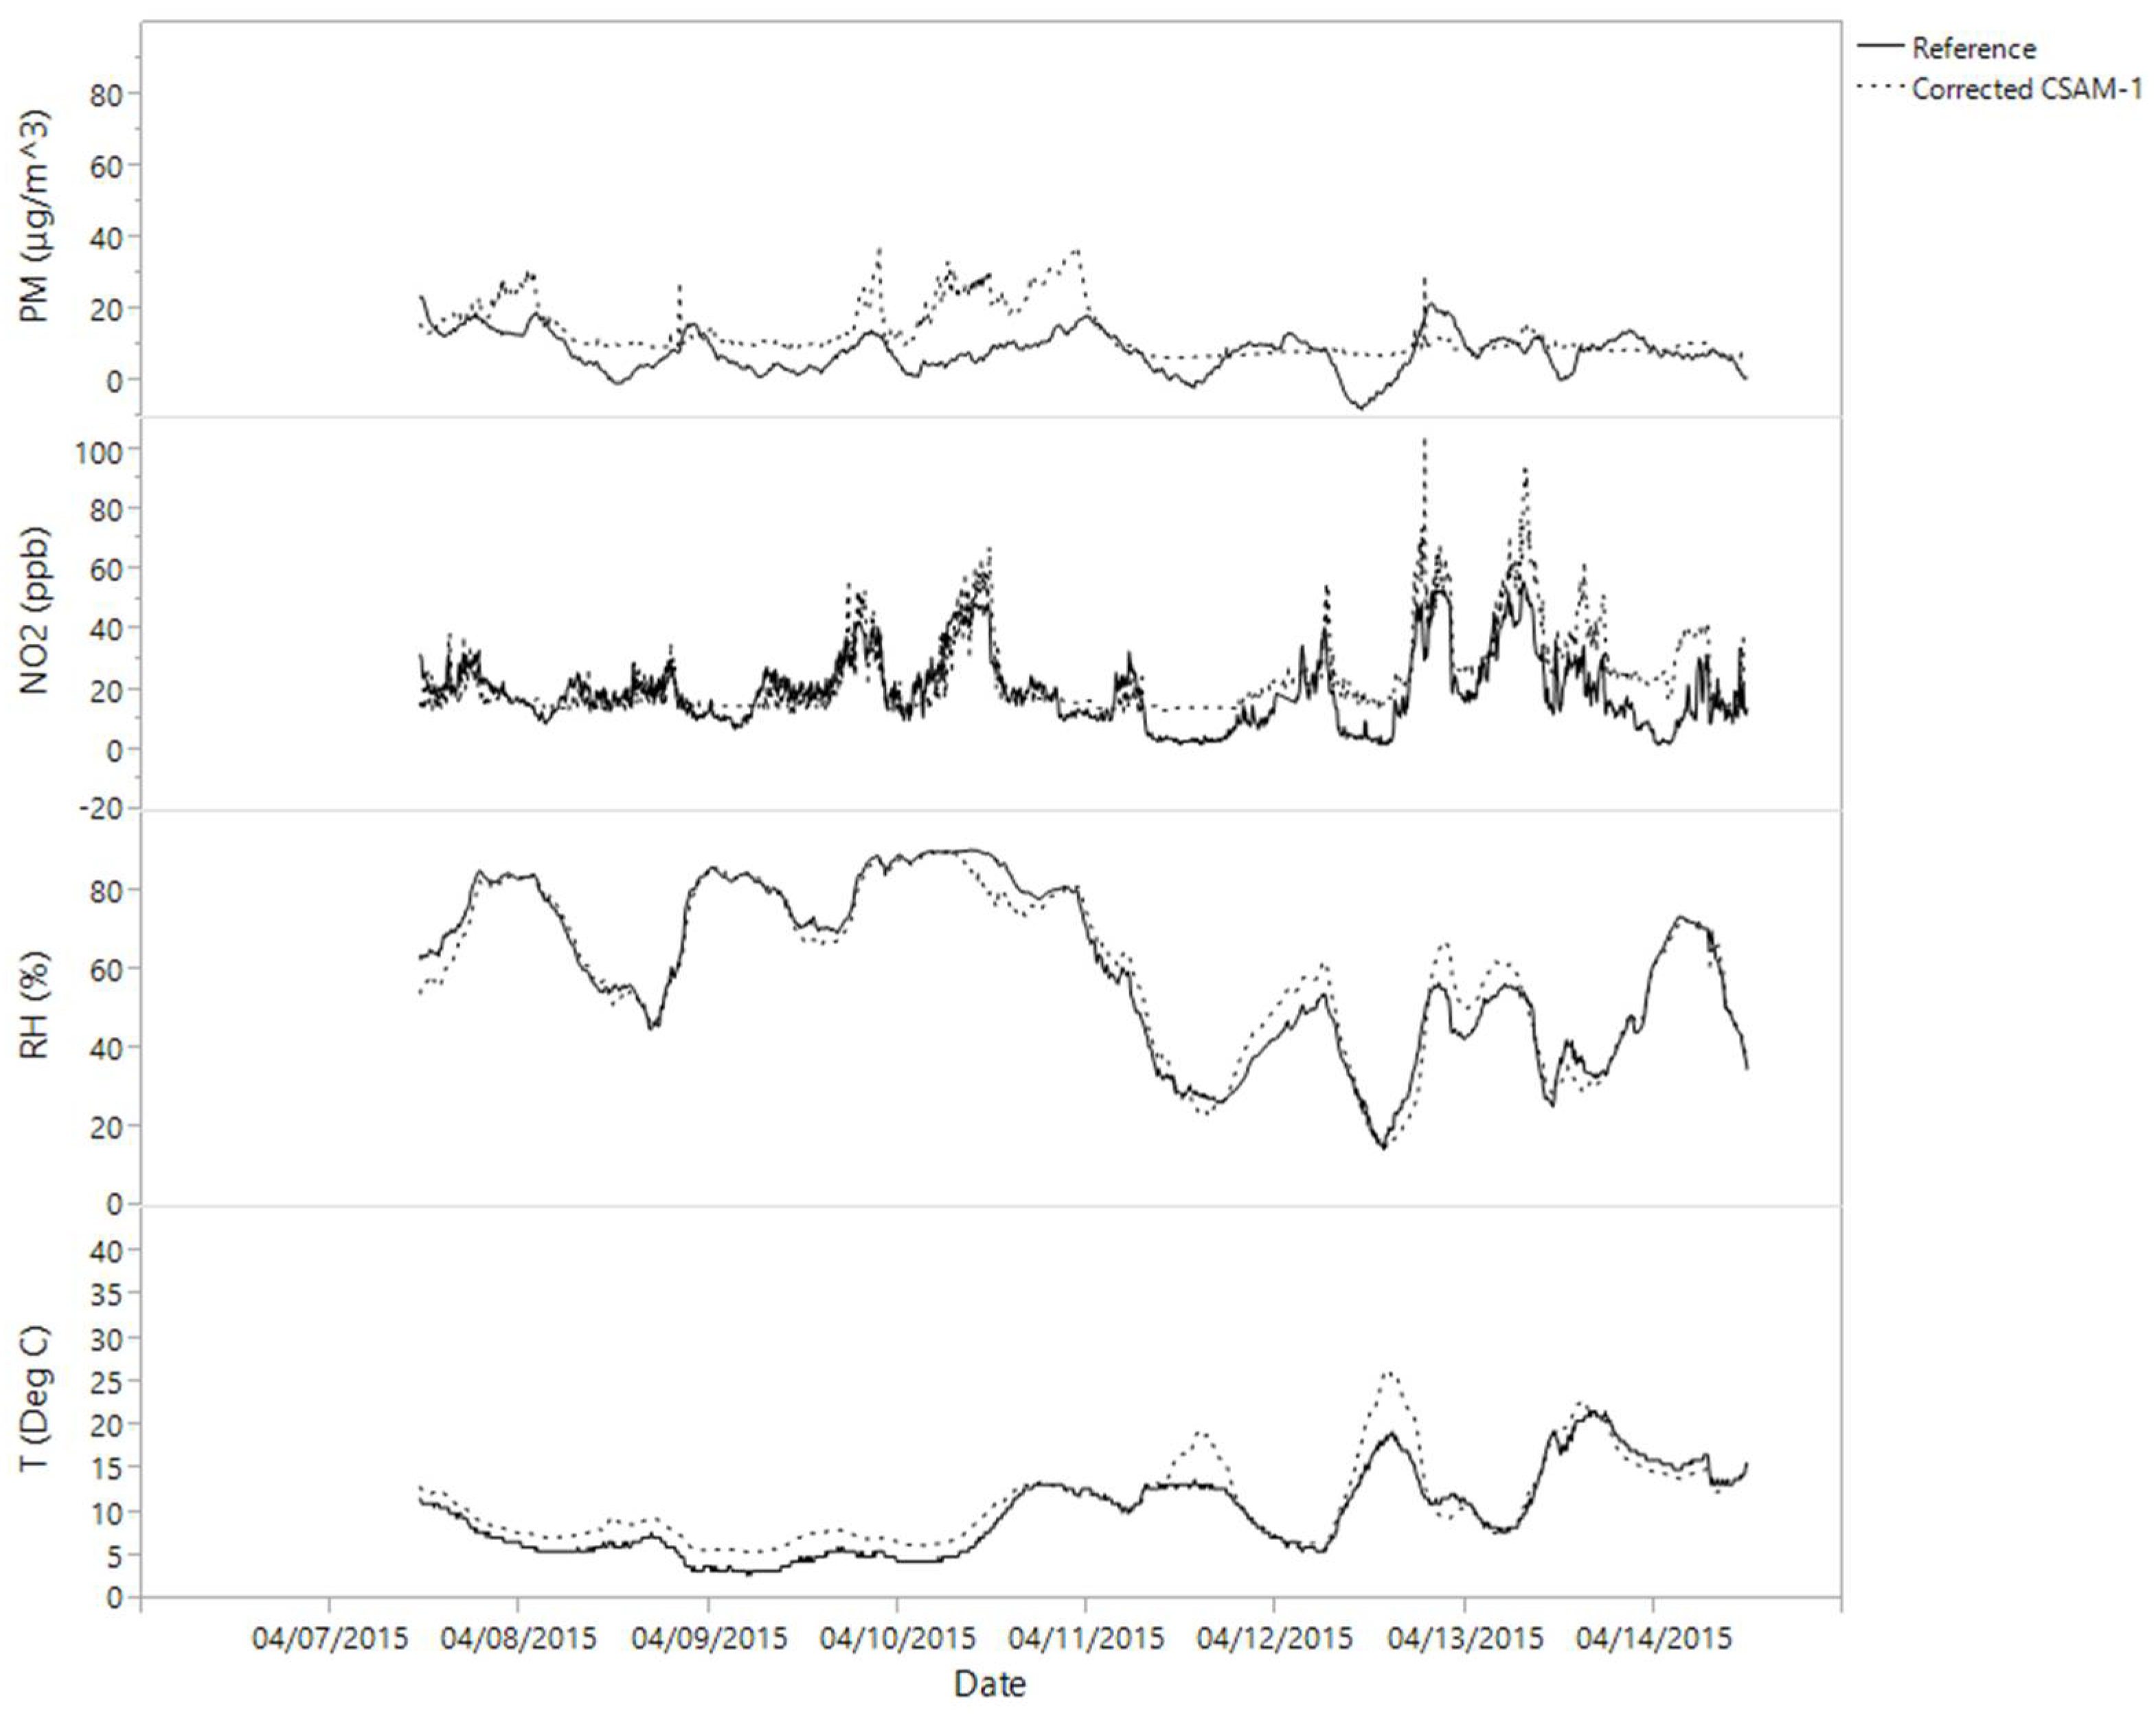
3.1.2. Collocation and Sensor Corrections
3.1.3. Next Steps
3.2. Newport News
3.2.1. Data Summary
3.2.2. Next Steps
- Increase Trust—Engage local groups to reduce mistrust between them and the city, and assist city employees to improve their comfort level of working with community-based organizations.
- Encourage Business Development—Secure Housing and Urban Development funds and create an environment for small businesses to open and thrive and make the city more livable.
- Transportation—Evaluate quick, reliable transportation options to shuttle workers to jobs to facilitate local employment and create more livable circumstances in the community.
- Promote Home Ownership—Develop a rental rehabilitation and rental inspection program; explore an education program to promote relationships between banks and borrowers; explore a demolition program to remove old infrastructure and rehab vacant lots.
- Infrastructure—Promote building a new grocery store; improve natural landscapes by planting trees.
4. Discussion
4.1. Decision-Making: People Versus Data
4.2. Three Lessons
4.2.1. Partners May Share Goals, but Not Objectives
4.2.2. Graphs Do Not Make Decisions, People Do
4.2.3. Measure Success and Manage Expectations Regularly and Often
4.3. FAQs
5. Conclusions
Supplementary Materials
Author Contributions
Acknowledgments
Conflicts of Interest
Disclaimer
References
- Barzyk, T.M.; Wilson, S.; Wilson, A. Community, state, and federal approaches to cumulative risk assessment: Challenges and opportunities for integration. Int. J. Environ. Res. Public Health 2015, 12, 4546–4571. [Google Scholar] [CrossRef] [PubMed]
- Sadd, J.L.; Hall, E.S.; Pastor, M.; Morello-Frosch, R.A.; Lowe-Liang, D.; Hayes, J.; Swanson, C. Ground-truthing validation to assess the effect of facility locational error on cumulative impacts screening tools. Geogr. J. 2015, 2015, 324683. [Google Scholar] [CrossRef] [PubMed]
- Rider, C.V.; Dourson, M.L.; Hertzberg, R.C.; Mumtaz, M.M.; Price, P.S.; Simmons, J.E. Incorporating nonchemical stressors into cumulative risk assessments. Toxicol. Sci. 2012, 127, 10–17. [Google Scholar] [CrossRef] [PubMed]
- Tian, N.; Xue, J.; Barzyk, T.M. Evaluating socioeconomic and racial differences in traffic-related metrics in the United States using a GIS approach. J. Expo. Sci. Environ. Epidemiol. 2012, 23, 215–222. [Google Scholar] [CrossRef] [PubMed]
- Sexton, K. Cumulative risk assessment: An overview of methodological approaches for evaluating combined health effects from exposure to multiple environmental stressors. Int. J. Environ. Res. Public Health 2012, 9, 370–390. [Google Scholar] [CrossRef] [PubMed]
- Williams, P.R.; Dotson, G.S.; Maier, A. Cumulative Risk Assessment (CRA): Transforming the way we assess health risks. Environ. Sci. Technol. 2012, 46, 10868–10874. [Google Scholar] [CrossRef] [PubMed]
- Sadd, J.L.; Pastor, M.; Morello-Frosch, R.; Scoggins, J.; Jesdale, B. Playing it safe: Assessing cumulative impact and social vulnerability through an environmental justice screening method in the South Coast Air Basin, California. Int. J. Environ. Res. Public Health 2011, 8, 1441–1459. [Google Scholar] [CrossRef] [PubMed]
- White, B.M.; Hall, E.S.; Johnson, C. Environmental Health Literacy in Support of Social Action: An Environmental Justice Perspective. J. Environ. Health 2014, 77, 24–29. [Google Scholar] [PubMed]
- Clougherty, J.E.; Shmool, J.L.C.; Kubzansky, L.D. The role of non-chemical stressors in mediating socioeconomic susceptibility to environmental chemicals. Curr. Environ. Health Rep. 2014, 1, 302–313. [Google Scholar] [CrossRef]
- Young, G.S.; Fox, M.A.; Trush, M.; Kanarek, N.; Glass, T.A.; Curriero, F.C. Differential exposure to hazardous air pollution in the United States: A multilevel analysis of urbanization and neighborhood socioeconomic deprivation. Int. J. Environ. Res. Public Health 2012, 9, 2204–2225. [Google Scholar] [CrossRef] [PubMed]
- Lewis, A.S.; Sax, S.N.; Wason, S.C.; Campleman, S.L. Non-chemical stressors and cumulative risk assessment: An overview of current initiatives and potential air pollutant interactions. Int. J. Environ. Res. Public Health 2011, 8, 2020–2073. [Google Scholar] [CrossRef] [PubMed]
- Hammond, D.; Conlon, K.; Barzyk, T.M.; Chahine, T.; Zartarian, V.; Schultz, B. Assessment and application of national environmental databases and mapping tools at the local level to two community case studies. Risk Anal. 2011, 31, 475–487. [Google Scholar] [CrossRef] [PubMed]
- Mittelmark, M.B. Promoting social responsibility for health: Health impact assessment and healthy public policy at the community level. Health Promot. Int. 2001, 16, 269–274. [Google Scholar] [CrossRef] [PubMed][Green Version]
- Scammell, M.K.; Montague, P.; Raffensperger, C. Tools for addressing cumulative impacts on human health and the environment. Environ. Justice 2014, 7, 102–109. [Google Scholar] [CrossRef]
- Alves, S.; Tilghman, J.; Rosenbaum, A.; Payne-Sturges, D.C. U.S. EPA authority to use cumulative risk assessments in environmental decision-making. Int. J. Environ. Res. Public Health 2012, 9, 1997–2019. [Google Scholar] [CrossRef] [PubMed]
- Gallagher, S.S.; Rice, G.E.; Scarano, L.J.; Teuschler, L.K.; Bollweg, G.; Martin, L. Cumulative risk assessment lessons learned: A review of case studies and issue papers. Chemosphere 2015, 120, 697–705. [Google Scholar] [CrossRef] [PubMed]
- Ellickson, K.M.; Sevcik, S.M.; Burman, S.; Pak, S.; Kohlasch, F.; Pratt, G.C. Cumulative risk assessment and environmental equity in air permitting: Interpretation, methods, community participation and implementation of a unique statute. Int. J. Environ. Res. Public Health 2011, 8, 4140–4159. [Google Scholar] [CrossRef] [PubMed]
- Kaufman, A.; Williams, R.; Barzyk, T.M.; Greenberg, M.; O’Shea, M.; Sheridan, P.; Hoang, A.; Ash, C.; Teitz, A.; Mustafa, M.; et al. A citizen science and government collaboration: Developing tools to facilitate community air monitoring. Environ. Justice 2017, 10, 51–61. [Google Scholar] [CrossRef]
- Mabahwi, N.A.B.; Leh, O.L.H.; Omar, D. Human health and wellbeing: Human health effect of air pollution. Soc. Behav. Sci. 2014, 153, 221–229. [Google Scholar] [CrossRef]
- Kampa, M.; Castanas, E. Human health effects of air pollution. Environ. Pollut. 2008, 151, 362–367. [Google Scholar] [CrossRef] [PubMed]
- Baldauf, R.; Thoma, E.; Hays, M.; Shores, R.; Kinsey, J.; Gullett, B.; Kimbrough, S.; Isakov, V.; Long, T.; Snow, R.; et al. Traffic and meteorological impacts on near-road air quality: Summary of methods and trends from the Raleigh near-road study. J. Air Waste Manag. Assoc. 2008, 58, 865–878. [Google Scholar] [CrossRef] [PubMed]
- Weber, S.A.; Insaf, T.Z.; Hall, E.S.; Talbot, T.O.; Huff, A.K. Assessing the impact of fine particulate matter (PM2.5) sources on respiratory-cardiovascular chronic diseases in the New York City metropolitan area using hierarchical Bayesian model estimates. Environ. Res. 2016, 151, 399–409. [Google Scholar] [CrossRef] [PubMed]
- Kim, K.H.; Kabir, E.; Kabir, S. A review on the human health impact of airborne particulate matter. Environ. Int. 2015, 74, 136–143. [Google Scholar] [CrossRef] [PubMed]
- U.S. EPA. A Collaborative Effort to Assess Environmental Health in Newport News, Virginia; EPA/600/R-17/270; U.S. Environmental Protection Agency, Office of Research and Development, National Exposure Research Laboratory, Research Triangle Park: Washington, DC, USA, 2017.
- Jiang, Q.; Bregt, A.K.; Kooistra, L. Formal and informal environmental sensing data and integration potential: Perceptions of citizens and experts. Sci. Total Environ. 2018, 619–620, 1133–1142. [Google Scholar] [CrossRef] [PubMed]
- Jansujwicz, J.S.; Calhoun, A.J.K.; Lilieholm, R.J. The Maine vernal pool mapping and assessment program: Engaging municipal officials and private landowners in community-based citizen science. Environ. Manag. 2013, 52, 1369–1385. [Google Scholar] [CrossRef] [PubMed]
- Verbrugge, L.N.H.; Ganzevoort, W.; Fliervoet, J.M.; Panten, K. Implementing participatory monitoring in river management: The role of stakeholders’ perspectives and incentives. J. Environ. Manag. 2017, 195, 62–69. [Google Scholar] [CrossRef] [PubMed]
- Tredick, C.A.; Lewison, R.L.; Deutschman, D.H.; Hunt, T.A.; Gordon, K.L.; Von Hendy, P. A rubric to evaluate citizen-science programs for long-term ecological monitoring. BioScience 2017, 67, 834–844. [Google Scholar] [CrossRef]
- Resnik, D.B.; Elliott, K.C.; Miller, A.K. A framework for addressing ethical issues in citizen science. Environ. Sci. Policy 2015, 54, 475–481. [Google Scholar] [CrossRef]
- Kosmala, M.; Wiggins, A.; Swanson, A.; Simmons, B. Assessing data quality in citizen science. Front. Ecol. Environ. 2016, 14, 551–560. [Google Scholar] [CrossRef]
- Conrad, C.C.; Hilchey, K.G. A review of citizen science and community-based environmental monitoring: Issues and opportunities. Environ. Monit. Assess. 2011, 176, 273–291. [Google Scholar] [CrossRef] [PubMed]
- Jiao, Y.; Bower, J.K.; Im, W.; Basta, N.; Obrycki, J.; Al-Hamdan, M.Z.; Wilder, A.; Bollinger, C.E.; Zhang, T.; Hatten, L.; et al. Application of citizen science risk communication tools in a vulnerable urban community. Int. J. Environ. Res. Public Health 2016, 13, 11. [Google Scholar] [CrossRef] [PubMed]
- Barzyk, T.M.; Conlon, K.C.; Chahine, T.; Hammond, D.; Zartarian, V.; Schultz, B.D. Tools available to communities for conducting cumulative exposure and risk assessments. J. Expo. Sci. Environ. Epidemiol. 2010, 20, 371–384. [Google Scholar] [CrossRef] [PubMed]
- Linkov, I.; Satterstrom, F.K.; Kiker, G.; Batchelor, C.; Bridges, T.; Ferguson, E. From comparative risk assessment to multi-criteria decision analysis and adaptive management: Recent developments and applications. Environ. Int. 2006, 32, 1072–1093. [Google Scholar] [CrossRef] [PubMed]
- Martin, Y.; Mimbrero, M.R.; Zuniga-Anton, M. Community vulnerability to hazards: Introducing local expert knowledge into the equation. Nat. Hazards 2017, 89, 367–386. [Google Scholar] [CrossRef]
- Fernandez, R.J. How to be a more effective environmental scientist in management and policy contexts. Environ. Sci. Policy 2016, 64, 171–176. [Google Scholar] [CrossRef]


| General Area | Summary |
|---|---|
| Detroit, MI; Holyoke, MA | Developed GIS community mapping process and maps |
| Milwaukee, WI; Chicago, IL; Port Arthur, TX | Environmental Justice indicators were compiled and displayed for comparison at four spatial scales: local, city, county, and state |
| Charleston, SC | Air quality characterization of freight movement operations related to port expansion activities |
| Birmingham, AL | Characterize historical, current, and future environmental conditions, including blight, proximity to industry and rail yards, lack of health care and retail, unemployment, and decline in residential population |
| Chicago, IL | Analyze and interpret multiple stressors in communities adjacent to landfills, industrial areas, brownfields, and interstates |
| Newark, NJ * | Conduct a citizen science air quality sensor project to identify trends and high concentration areas |
| Newport News, VA * | Assess potential impacts of environmental stressors with additional social, economic, demographic factors that relate to community well-being |
| Kansas City, KS | Measure local air quality in neighborhoods surrounded by multiple emission sources, including industry, diesel trucks, rail facilities and major highways |
| Wichita, KS | Compile metrics and actions to address multiple issues, including infant mortality, asthma, industrial emissions, susceptible and vulnerable populations, awareness, and life expectancy |
| Portland, OR | Assess children’s potential exposure to particulate matter and emissions during school bus commute and school attendance near busy roads |
| Partner | Objectives |
|---|---|
| ICC |
|
| EPA Region 2 |
|
| EPA ORD |
|
| Role | Responsibility |
|---|---|
| ICC Project Manager |
|
| ICC Community Liaison |
|
| Community Volunteers |
|
| Region 2 Project Coordinator |
|
| Region 2 Citizen Science Liaison |
|
| Region 2 Community Technical Support |
|
| ORD Principal Investigator |
|
| ORD Technical Advisor(s) |
|
| Partner | Role | Responsibility/Objective |
|---|---|---|
| Southeast CARE Coalition | Community Organizer: assess and improve environmental health outcomes in Newport News, Virginia | Generate action to improve community health; assemble, analyze, and disseminate community-specific information on pollutants, risks, and impacts |
| Greater Southeast Development Corporation | Reduce exposure to toxic pollutants and improving the environment | Engage residents, businesses, academics, non-profit/grassroots, city/state/federal agencies |
| EPA Region 3 | Research collaborator and liaison between community and partners | Provide local support based on multi-state expertise |
| EPA Office of Research and Development | Research support and method development | Assist with data collection, analysis, interpretation, and communication |
| Sierra Club of Virginia | Help Coalition stay on target and maintain positive efforts | Plan community events, organize tours, support coalition efforts |
| University of North Carolina Capstone Class | Student-led undergraduate research to support project needs | Support data collection, analysis, and interpretation |
| Old Dominion University | Research support and community outreach/education | Research major sources of toxics in the community and the health risk associated with exposure |
| Location & Unit. | Time Period | Snorkel Y/N | Flag G/Y/R (Reason) | PM2.5 (μg/m3) | NO2 (ppb) | T (°C) | RH (%) | ||
|---|---|---|---|---|---|---|---|---|---|
| Mean | 90th Percentile | Mean | 90th Percentile | Mean | Mean | ||||
| L1 U1 | 12–27 February | N | G | 13.1 | 20.8 | 41.4 | 80.8 | 1.2 | 53.0 |
| L2 U2 | 12–27 February | Y | Y (High T; Low ΔT) | 13.2 | 18.8 | 10.9 | 26.8 | 20.6 | 27.6 |
| L3 U3 | 12–24 February | N | G | 19.4 | 25.0 | 18.3 | 40.2 | -1.3 | 48.1 |
| L4 U4 | 12–27 February | Y | Y (High T; Low ΔT; PM N/A) | -- | -- | 18.6 | 38.1 | 16.1 | 37.8 |
| L5 U1 | 3–16 March | Y | Y (High T; Low ΔT) | 12.1 | 17.7 | 13.8 | 15.0 | 17.6 | 25.0 |
| L6 U2 | 28 February–16 March | Y | Y (High T; Low ΔT) | 14.7 | 21.5 | 5.3 | 8.1 | 15.6 | 37.0 |
| L7 U3 | 3–16 March | N | G | 20.9 | 31.8 | 27.2 | 56.2 | 6.1 | 55.8 |
| L8 U4 | 2–16 March | Y | R (Pump Failed) | -- | -- | -- | -- | -- | -- |
| L9 U1 | 18–25 March | N | G | 10.4 | 14.8 | 27.5 | 56.2 | 7.8 | 39.6 |
| L10 U2 | 17 March–6 April | Y | R (No data) | -- | -- | -- | -- | -- | -- |
| L11 U3 | 18–25 March | Y | G | 16.6 | 17.8 | 8.7 | 28.4 | 9.4 | 25.4 |
| L12 U4 | 18 March–6 April | Y | R (No data) | -- | -- | -- | -- | -- | -- |
| L13 U1–4 | 7–15 April | N | Collocation | -- | -- | -- | -- | -- | -- |
| L14 U1 | 21 April–12 May | Y | G | 10.8 | 17.7 | 38.2 | 87.4 | 19.5 | 34.7 |
| L15 U2 | 21 April–11 May | Y | Y (High T; Low ΔT; PM N/A) | -- | -- | 15.1 | 43.4 | 19.8 | 42.3 |
| L16 U3 | 24 April–11 May | Y | G | 16.6 | 21.5 | 22.0 | 49.7 | 13.2 | 46.9 |
| L17 U1 | 25 June–10 July | Y | Y (6/29–7/1; 7/5–7/10) | 10.9 | 16.1 | 27.0 | 46.2 | 19.9 | 53.9 |
| L18 U2 | 25 June–14 July | N | R (Card taken; battery unplugged) | -- | -- | -- | -- | -- | -- |
| L19 U3 | 25 June–14 July | Y | G | 16.2 | 19.5 | 4.0 | 16.2 | 18.3 | 51.2 |
| L20 U4 | 16 June–14 July | Y | Y (6/16–6/26; PM N/A) | -- | -- | 5.2 | 13.4 | 22.4 | 63.8 |
| L21 U3 | 30 July | N | G (single day) | 16.6 | 17.22 | 1.0 | 6.9 | 19.5 | 62.4 |
| Chemical | Potential Exposure-Response Symptoms |
|---|---|
| Industry-related | |
| N-butyl alcohol | Impaired hearing and reduced vision |
| Xylene (o-xylene) | Eye damage; nausea; poor coordination |
| Sulfuric acid | Dental effects; pulmonary edema |
| 1,2,4-Trimethylbenzene | Anemia; nausea; skin, eye, throat, and respiratory irritation |
| Ethylbenzene | Headaches; irritation of mucous membranes |
| Copper | Anemia; damage to lungs, liver, kidneys, and nasal septum |
| Manganese | Cough and fever; insomnia; kidney damage; weakness; back pain |
| Nickel | Sensitizing dermatitis; allergic asthma; potential carcinogen |
| Chromium | Lung fibrosis; eye and skin irritant; potential carcinogen |
| Trichloroethylene | Visual distortions; headaches; potential carcinogen in liver and kidney cells; cardiac arrhythmia |
| Zinc (zinc chloride) | Metal fever, nausea, and cough, which reduces pulmonary function; vomiting; back pain |
| Toluene | Effects on central nervous system; fatigue; sleepiness; headaches; nausea; irritation of respiratory tract, eyes, throat; dizziness; headache; pregnancy-related developmental effects, including attention deficits |
| Traffic-related | |
| Particulate Matter 2.5 (PM2.5) | Heart attacks; irregular heartbeats; increased asthma symptoms; airway irritation; decreased lung function |
| Acetaldehyde | Eye, respiratory, and skin irritation; increased blood pressure; decreased respiratory rate |
| Acrolein | Eye, respiratory, nasal, skin irritation; respiratory congestion |
| Benzene | Drowsiness; dizziness; headaches; respiratory, skin, and eye irritation; blood disorders; leukemia; reproductive effects; known carcinogen |
| 1,3 Butadiene | Eye, nasal, respiratory irritation; cardiovascular effects; leukemia; known carcinogen |
| Formaldehyde | Respiratory irritation; coughing; sneezing; wheezing; chest pain; bronchitis; reproductive damage; known carcinogen, including lung and nasopharyngeal cancer |
| Carbon Monoxide | Reduced oxygen delivery; exacerbates cardiovascular disease and chest pain |
| Nitrogen Oxides (NOX) | Cardiovascular disease; asthma exacerbation; bronchitis; emphysema |
| Sulfur Oxides (SOX) | Bronchoconstriction; asthma exacerbation; cardiovascular disease |
| Volatile Organic Compounds (VOCs) | Eye, respiratory irritation; liver, kidney, and central nervous system damage is possible depending on specific chemical |
| Issue | Metrics | Data Sources | Potential Risk-Reduction Approaches |
|---|---|---|---|
| Ports |
|
|
|
| Coal Piles |
|
| |
| Shipbuilding |
|
| |
| Toluene |
|
|
|
| Interstate |
|
|
|
| Asthma |
|
|
|
| Brownfields |
|
|
|
| Food Deserts |
|
| -- |
| Wastewater Treatment Facility |
|
| -- |
| Stormwater and Sewer Line Breaks |
| -- | -- |
| Watershed PCB Contamination |
|
| -- |
| Vulnerable Populations |
|
|
|
| What Is the Purpose of the Study? |
| Describe the problem the study is addressing, and the ultimate benefit the study will have for the community as well as its science, research, and/or programmatic purpose. |
| Who is leading the study? |
| Which community is involved in the study? |
| Why this community? (How was the community selected?) |
| What previous studies have been performed in this community/area? How does this study complement those or how is it different? What is the added value of this work? |
| What stakeholders are involved in the study? |
| What level of participation is the community being included in? |
| How is the community involved in the study process? |
| How long will the study last? When will the study start and end? |
| What is the benefit to the community overall and to individuals in the community? How does this benefit the community? What will the community get out of this study? |
| What is the end goal of the study? How will the results be used? |
| What are the results intended to show? Are sensors supposed to capture absolute concentrations, relative differences (i.e., hotspots), spatio-temporal trends? |
| How does this study benefit the community? What will the community get out of this study? |
| How can you (as a community member) use these tools, data, and sensors to gather information on environmental health risks to you and your community? (What is in it for you?) |
| How will information be shared with the community? |
| Where and how will information be shared with the community? |
| Ask community: What is the best method for sharing information with you? |
| How will private or sensitive information be protected? |
| How can the community keep up with what is going on with the project? Where can I find updates? |
| How will concerns of community members about the data or results be addressed? |
| How can community members contact the study team if they have questions about the study? |
| What topics and research methods does the study include? |
| Pollutants being considered |
| Which pollutants are included in the study? Which are being measured or modeled? |
| Are there regulations for these pollutants? If so, then why are we measuring it? |
| Where do these pollutants come from? What are the major sources of these pollutants? |
| Where are these pollutants found—in the air, water, soil, food, household? |
| Why are other pollutants not being investigated? |
| Types of Measurements, Models, and Results |
| What sensors are being used to measure these pollutants? What are the benefits and limitations of these sensors |
| Which computer models are being used to estimate pollutant concentrations? What are the benefits and limitations of these models? |
| Will this study pinpoint who is producing these pollutants? |
| Are these measurements and models the same ones the EPA uses to enforce regulations, such as the Clean Air Act? Can results from measurements or models be used to make the sources reduce their emissions or output of these pollutants? |
| Will the community or public have access to the results of this study? Who ‘owns’ the data that is collected? Where will the results be kept? |
| How will results be reported—as a written report, charts and graphs, maps? |
| Public Health |
| Which health effects are associated with these pollutants? |
| What are considered ‘high’ or ‘dangerous’ concentrations of these pollutants? What happens if we measure high concentrations? Does this mean my health is at risk, or that we can take legal actions to reduce the amount of pollution? |
| What are different ways to reduce exposure to pollution? |
| Which other things might be present in the community that could influence my health? Are these being considered? |
| Other Studies or Analyses? |
| What other studies or analyses have been conducted in the vicinity of our community? |
| What are the results of these studies/analyses? |
| How scientifically grounded are these studies/analyses? |
© 2018 by the authors. Licensee MDPI, Basel, Switzerland. This article is an open access article distributed under the terms and conditions of the Creative Commons Attribution (CC BY) license (http://creativecommons.org/licenses/by/4.0/).
Share and Cite
Barzyk, T.M.; Huang, H.; Williams, R.; Kaufman, A.; Essoka, J. Advice and Frequently Asked Questions (FAQs) for Citizen-Science Environmental Health Assessments. Int. J. Environ. Res. Public Health 2018, 15, 960. https://doi.org/10.3390/ijerph15050960
Barzyk TM, Huang H, Williams R, Kaufman A, Essoka J. Advice and Frequently Asked Questions (FAQs) for Citizen-Science Environmental Health Assessments. International Journal of Environmental Research and Public Health. 2018; 15(5):960. https://doi.org/10.3390/ijerph15050960
Chicago/Turabian StyleBarzyk, Timothy M., Hongtai Huang, Ronald Williams, Amanda Kaufman, and Jonathan Essoka. 2018. "Advice and Frequently Asked Questions (FAQs) for Citizen-Science Environmental Health Assessments" International Journal of Environmental Research and Public Health 15, no. 5: 960. https://doi.org/10.3390/ijerph15050960
APA StyleBarzyk, T. M., Huang, H., Williams, R., Kaufman, A., & Essoka, J. (2018). Advice and Frequently Asked Questions (FAQs) for Citizen-Science Environmental Health Assessments. International Journal of Environmental Research and Public Health, 15(5), 960. https://doi.org/10.3390/ijerph15050960