A National County-Level Assessment of U.S. Nursing Facility Characteristics Associated with Long-Term Exposure to Traffic Pollution in Older Adults


Abstract
1. Introduction
2. Methods
2.1. Facility-Level and Census-Tract-Level Characteristics of Nursing Facilities
2.2. Facility-Level Characteristics
2.3. Census Tract-Level Characteristics
2.4. Additional Facility-Level Characteristics
2.5. Measures of Exposure to Traffic-Related Pollution
2.6. Statistical Analysis
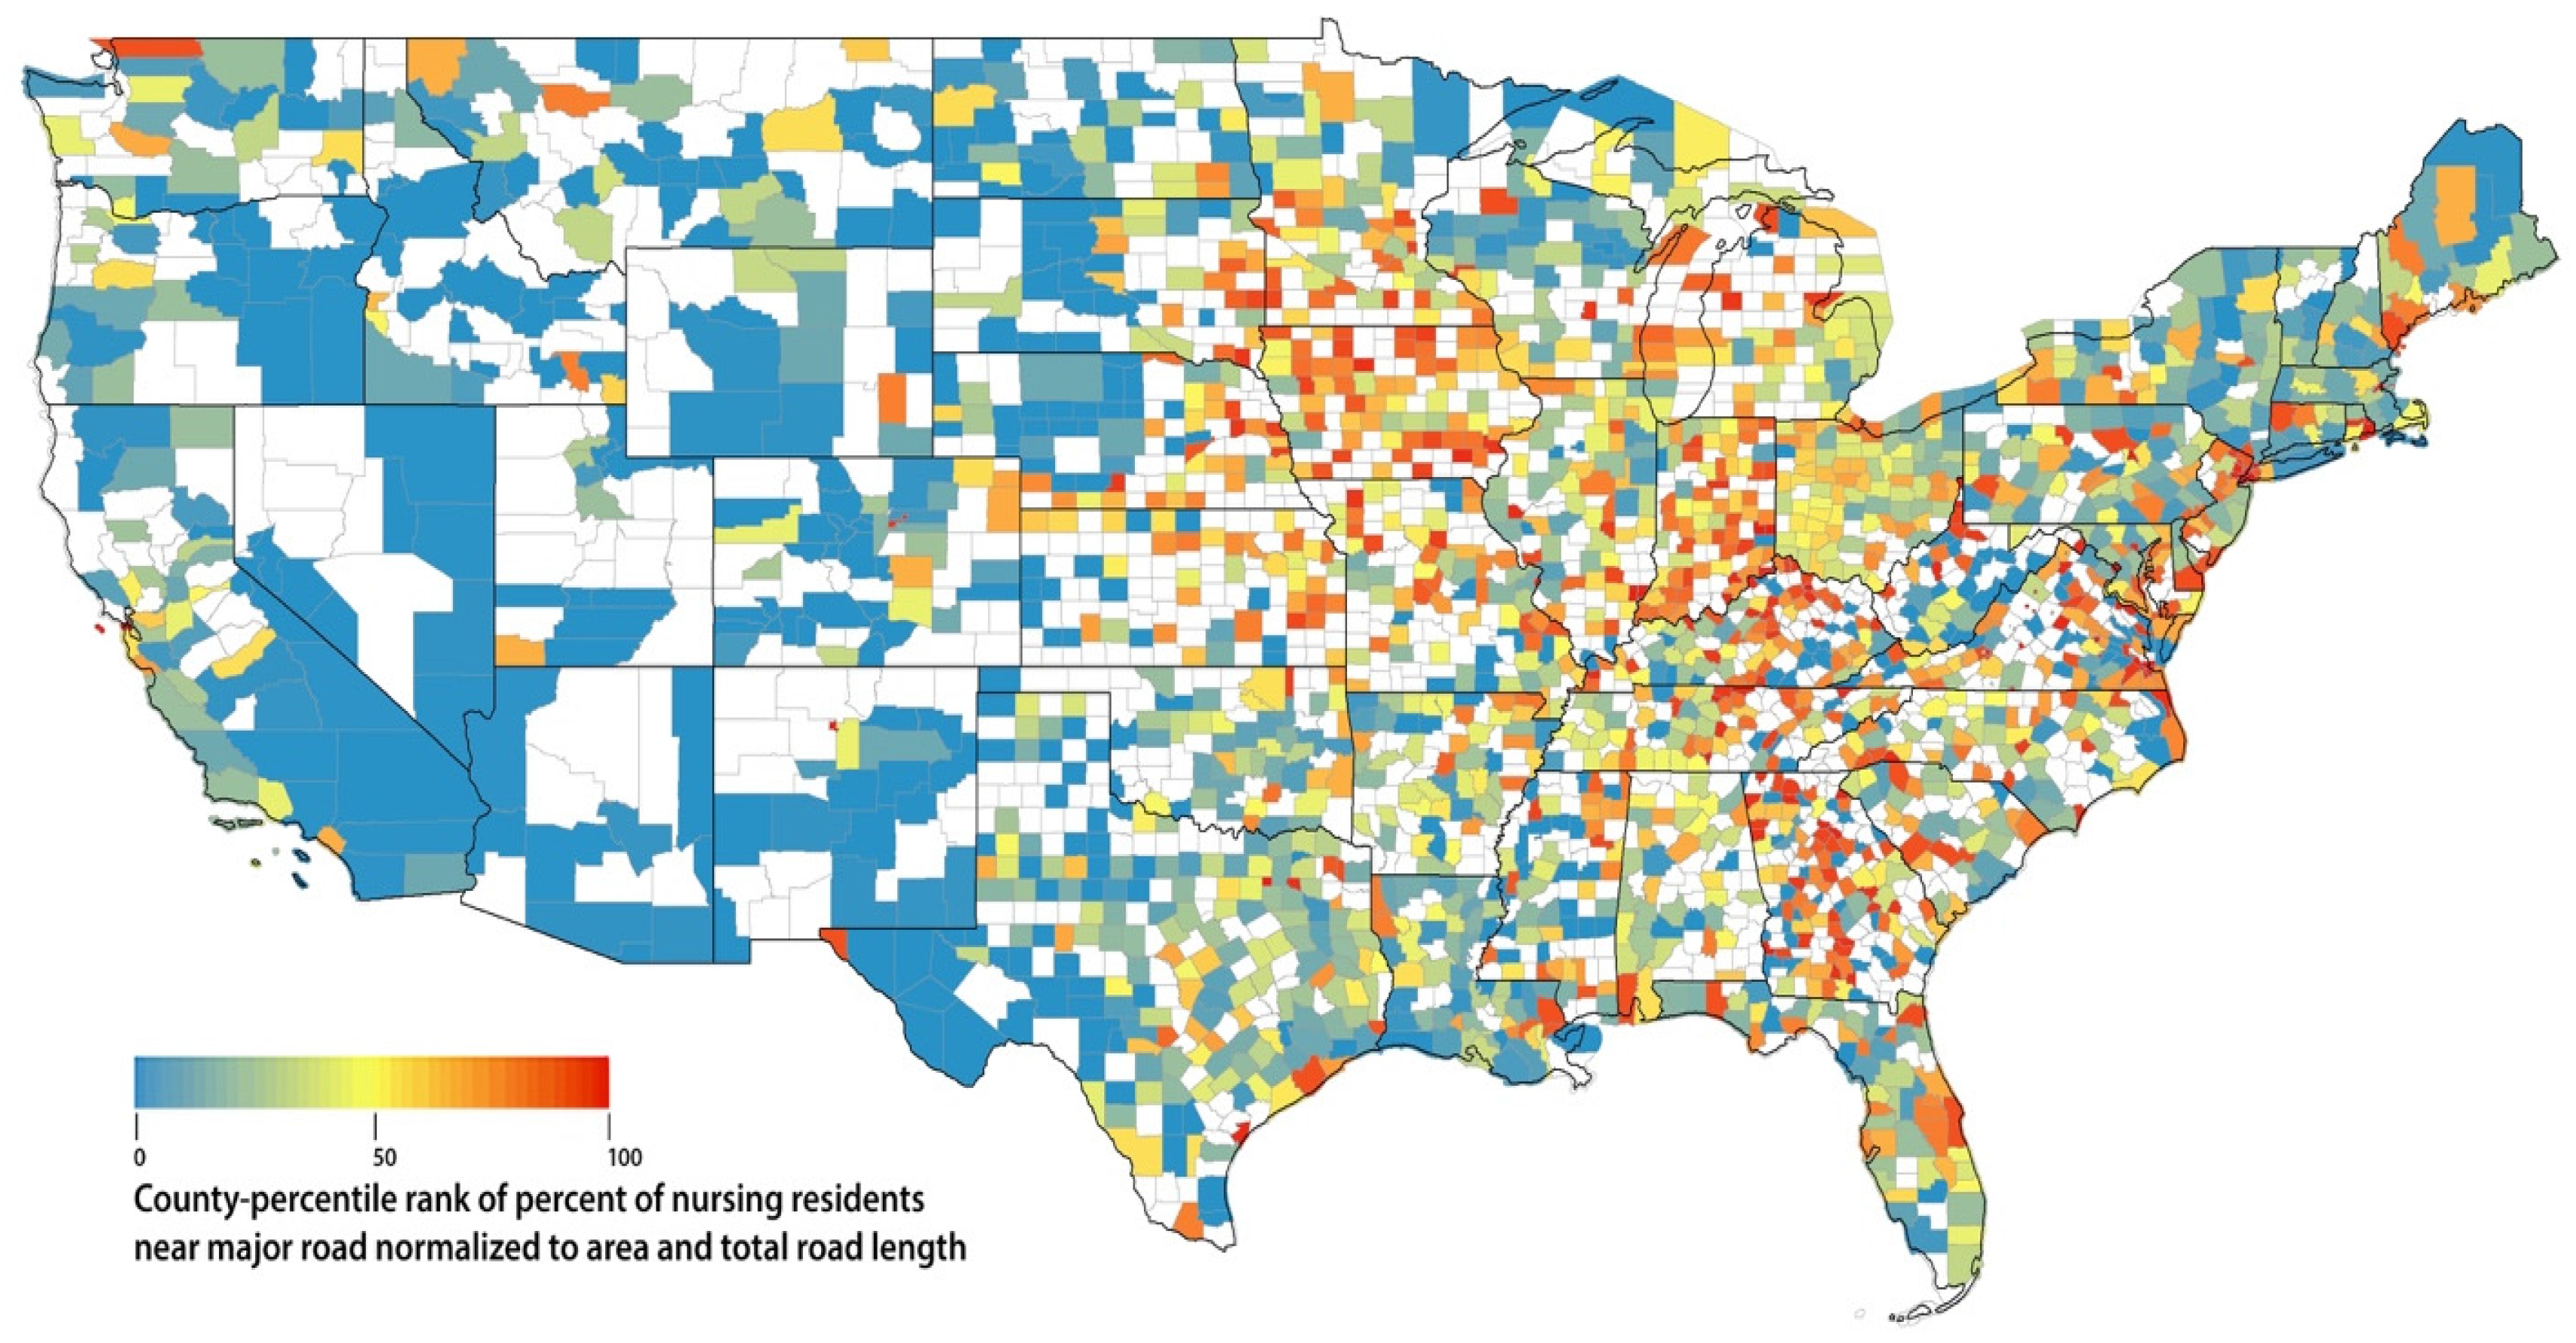
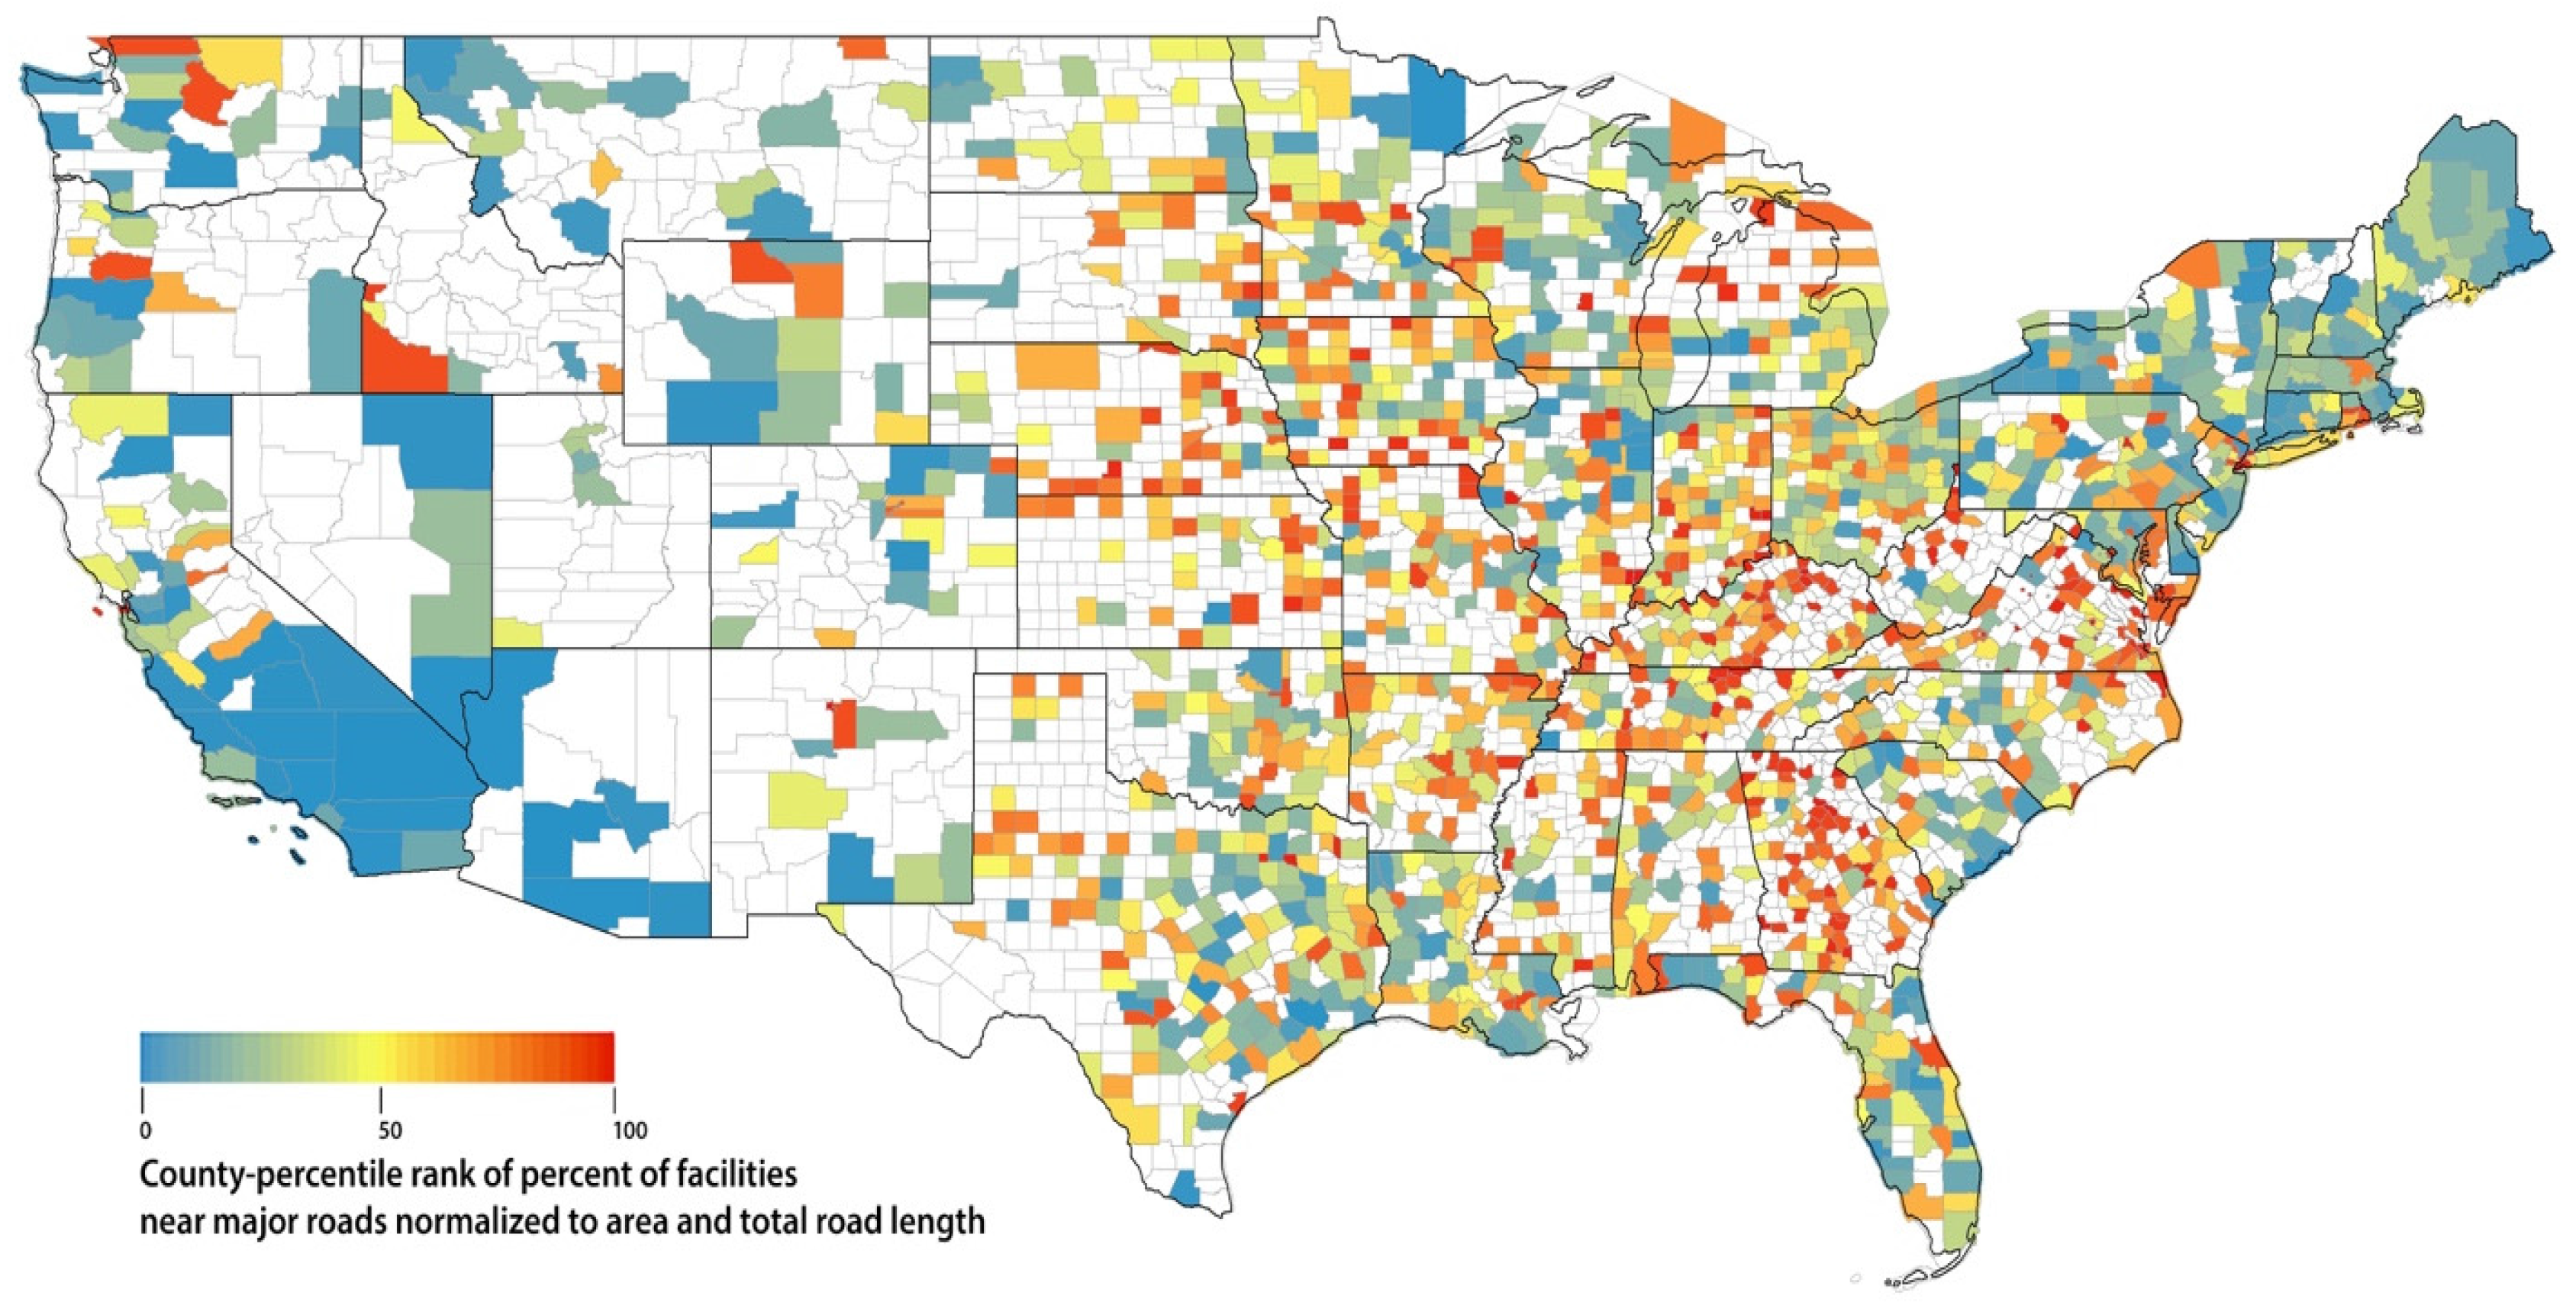
2.7. Normalized County-Specific Percent of Nursing Residents and Facilities near Major Roadways
3. Results
3.1. Facility-Level and Census-Tract-Level Characteristics
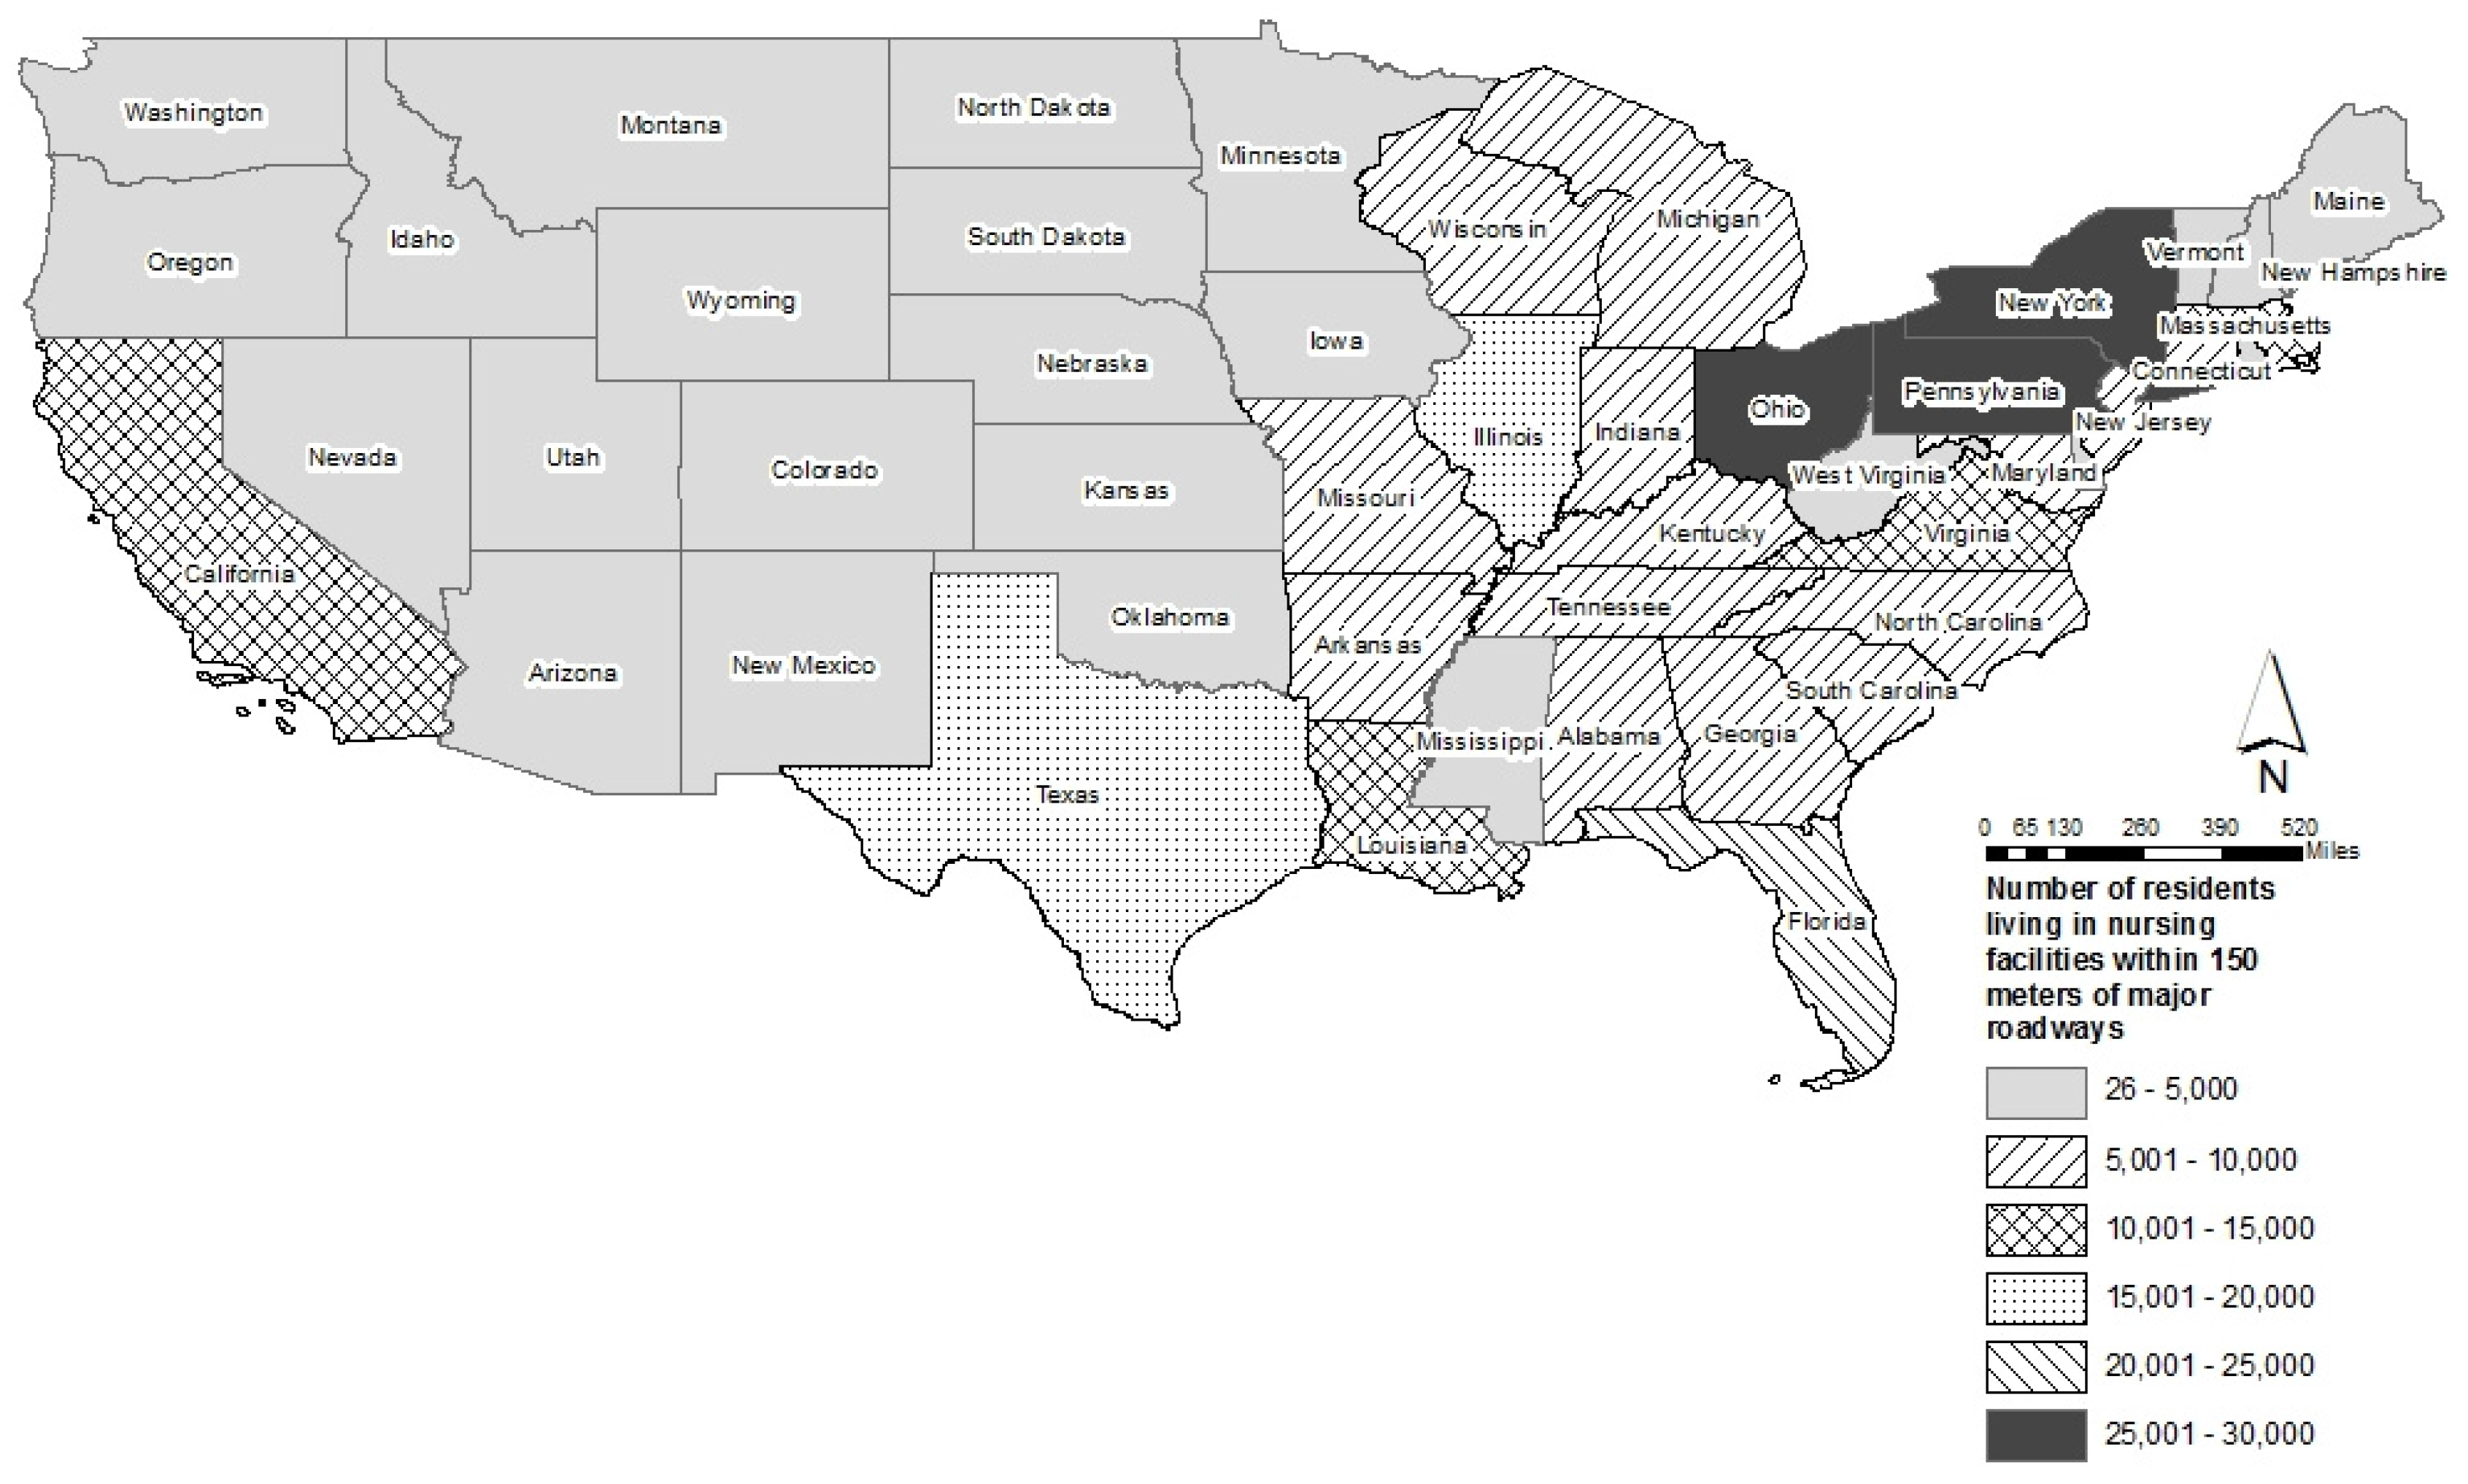
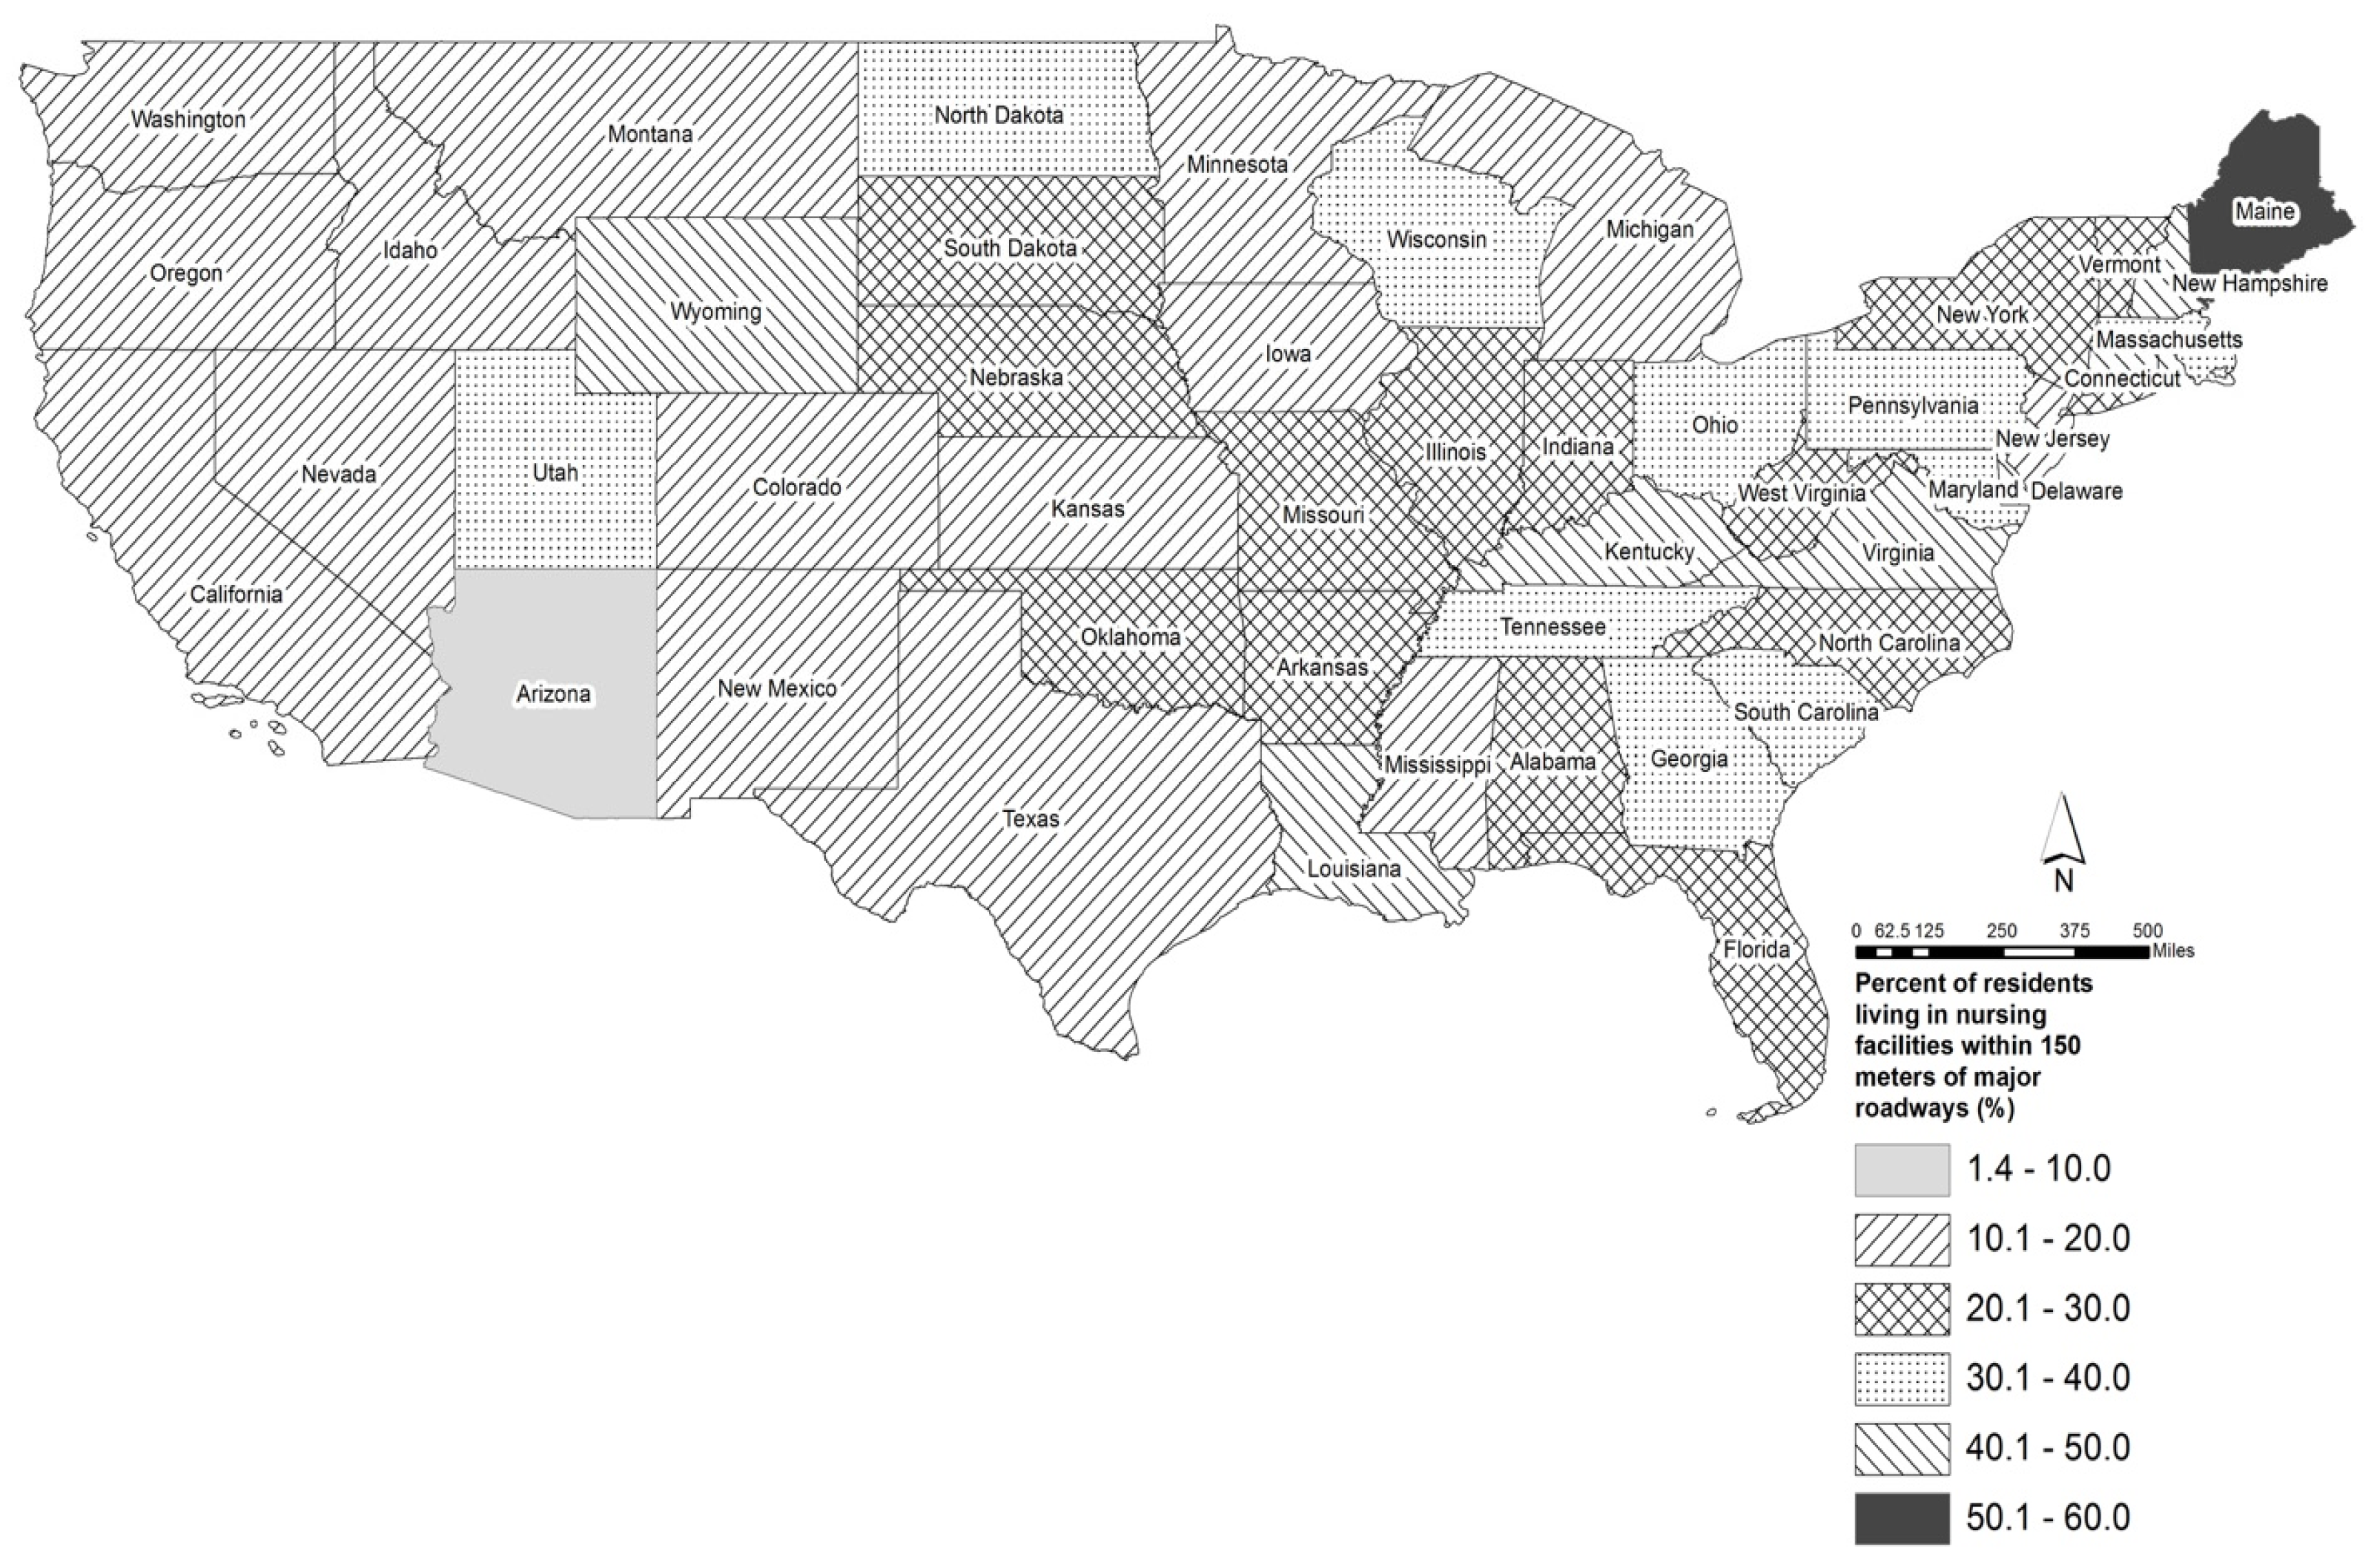
3.2. Variation by Geographic Region and by U.S. County
4. Discussion
5. Conclusions
Supplementary Materials
Acknowledgments
Author Contributions
Conflicts of Interest
References
- Brook, R.D.; Rajagopalan, S. Particulate matter air pollution and atherosclerosis. Curr. Atheroscler. Rep. 2010, 12, 291–300. [Google Scholar] [CrossRef] [PubMed]
- Weaver, A.M.; Wellenius, G.A.; Wu, W.C.; Hickson, D.A.; Kamalesh, M.; Wang, Y. Residential distance to major roadways and cardiac structure in African Americans: Cross-sectional results from the Jackson Heart Study. Environ. Health 2017, 16, 21. [Google Scholar] [CrossRef] [PubMed]
- Kingsley, S.L.; Eliot, M.N.; Whitsel, E.A.; Wang, Y.; Coull, B.A.; Hou, L.; Margolis, H.G.; Margolis, K.L.; Mu, L.; Wu, W.C.; et al. Residential proximity to major roadways and incident hypertension in post-menopausal women. Environ. Res. 2015, 142, 522–528. [Google Scholar] [CrossRef] [PubMed]
- Ranft, U.; Schikowski, T.; Sugiri, D.; Krutmann, J.; Kramer, U. Long-term exposure to traffic-related particulate matter impairs cognitive function in the elderly. Environ. Res. 2009, 109, 1004–1011. [Google Scholar] [CrossRef] [PubMed]
- Weuve, J.; Puett, R.C.; Schwartz, J.; Yanosky, J.D.; Laden, F.; Grodstein, F. Exposure to particulate air pollution and cognitive decline in older women. Arch. Intern. Med. 2012, 172, 219–227. [Google Scholar] [CrossRef] [PubMed]
- Wang, Y.; Eliot, M.N.; Wellenius, G.A. Short-term changes in ambient particulate matter and risk of stroke: A systematic review and meta-analysis. J. Am. Heart Assoc. 2014, 3, e000983. [Google Scholar] [CrossRef] [PubMed]
- Wang, Y.; Eliot, M.N.; Koutrakis, P.; Gryparis, A.; Schwartz, J.D.; Coull, B.A.; Mittleman, M.A.; Milberg, W.P.; Lipsitz, L.A.; Wellenius, G.A. Ambient air pollution and depressive symptoms in older adults: Results from the MOBILIZE Boston study. Environ. Health Perspect. 2014, 122, 553–558. [Google Scholar] [CrossRef] [PubMed]
- Lim, Y.H.; Kim, H.; Kim, J.H.; Bae, S.; Park, H.Y.; Hong, Y.C. Air pollution and symptoms of depression in elderly adults. Environ. Health Perspect. 2012, 120, 1023–1028. [Google Scholar] [CrossRef] [PubMed]
- Moulton, P.V.; Yang, W. Air pollution, oxidative stress, and Alzheimer’s disease. J. Environ. Public Health 2012, 2012, 472751. [Google Scholar] [CrossRef] [PubMed]
- Jayaraj, R.L.; Rodriguez, E.A.; Wang, Y.; Block, M.L. Outdoor Ambient Air Pollution and Neurodegenerative Diseases: The Neuroinflammation Hypothesis. Curr. Environ. Health Rep. 2017, 4, 166–179. [Google Scholar] [CrossRef] [PubMed]
- Rao, X.; Montresor-Lopez, J.; Puett, R.; Rajagopalan, S.; Brook, R.D. Ambient air pollution: An emerging risk factor for diabetes mellitus. Curr. Diabetes Rep. 2015, 15, 603. [Google Scholar] [CrossRef] [PubMed]
- Kirwa, K.; Eliot, M.N.; Wang, Y.; Adams, M.A.; Morgan, C.G.; Kerr, J.; Norman, G.J.; Eaton, C.B.; Allison, M.A.; Wellenius, G.A. Residential proximity to major roadways and prevalent hypertension among postmenopausal women: Results from the Women’s Health Initiative San Diego Cohort. J. Am. Heart Assoc. 2014, 3, e000727. [Google Scholar] [CrossRef] [PubMed]
- Tonne, C.; Elbaz, A.; Beevers, S.; Singh-Manoux, A. Traffic-related air pollution in relation to cognitive function in older adults. Epidemiology 2014, 25, 674–681. [Google Scholar] [CrossRef] [PubMed]
- Tonne, C.; Yanosky, J.D.; Beevers, S.; Wilkinson, P.; Kelly, F.J. PM mass concentration and PM oxidative potential in relation to carotid intima-media thickness. Epidemiology 2012, 23, 486–494. [Google Scholar] [CrossRef] [PubMed]
- Wang, Y.; Wellenius, G.A.; Hickson, D.A.; Gjelsvik, A.; Eaton, C.B.; Wyatt, S.B. Residential Proximity to Traffic-Related Pollution and Atherosclerosis in 4 Vascular Beds Among African-American Adults: Results From the Jackson Heart Study. Am. J. Epidemiol. 2016. [Google Scholar] [CrossRef] [PubMed]
- CMS. Nursing Home Data Compendium 2015 Edition; Centers for Medicare and Medicaid Services (CMS): Baltimore, MD, USA, 2015.
- Klepeis, N.E.; Nelson, W.C.; Ott, W.R.; Robinson, J.P.; Tsang, A.M.; Switzer, P.; Behar, J.V.; Hern, S.C.; Engelmann, W.H. The National Human Activity Pattern Survey (NHAPS): A resource for assessing exposure to environmental pollutants. J. Expo. Anal. Environ. Epidemiol. 2001, 11, 231–252. [Google Scholar] [CrossRef] [PubMed]
- Avery, C.L.; Mills, K.T.; Williams, R.; McGraw, K.A.; Poole, C.; Smith, R.L.; Whitsel, E.A. Estimating error in using residential outdoor PM2.5 concentrations as proxies for personal exposures: A meta-analysis. Environ Health Perspect. 2010, 118, 673–678. [Google Scholar] [CrossRef] [PubMed]
- Sarnat, J.A.; Schwartz, J.; Catalano, P.J.; Suh, H.H. Gaseous pollutants in particulate matter epidemiology: Confounders or surrogates? Environ. Health Perspect. 2001, 109, 1053–1061. [Google Scholar] [CrossRef] [PubMed]
- Sarnat, J.A.; Koutrakis, P.; Suh, H.H. Assessing the relationship between personal particulate and gaseous exposures of senior citizens living in Baltimore, MD. J. Air Waste Manag. Assoc. 2000, 50, 1184–1198. [Google Scholar] [CrossRef] [PubMed]
- Nursing Home Compare Datasets. Available online: https://data.medicare.gov/data/nursing-home-compare (accessed on 15 April 2014).
- CMS. Design for Nursing Home Compare Five-Star Quality Rating System: Technical User’s Guide, January 2017; Centers for Medicare and Medicaid Services: Baltimore, MD, USA, 2017.
- Highway Performance Monitoring System (HPMS). Geospatial Data, 2011–2015 [Internet]. U.S. Department of Transportation Federal Highway Administration. Available online: https://www.fhwa.dot.gov/policyinformation/hpms/shapefiles.cfm. 2014 (accessed on 1 August 2017).
- Zhu, Y.; Hinds, W.C.; Kim, S.; Sioutas, C. Concentration and size distribution of ultrafine particles near a major highway. J. Air Waste Manag. Assoc. 2002, 52, 1032–1042. [Google Scholar] [CrossRef] [PubMed]
- Bentayeb, M.; Norback, D.; Bednarek, M.; Bernard, A.; Cai, G.; Cerrai, S.; Eleftheriou, K.K.; Gratziou, C.; Holst, G.J.; Lavaud, F.; et al. Indoor air quality, ventilation and respiratory health in elderly residents living in nursing homes in Europe. Eur. Respir. J. 2015, 45, 1228–1238. [Google Scholar] [CrossRef] [PubMed]


| Characteristics | Distance to A1/A2 (m) | A1&A2 Traffic Density (Length) in 300 m Buffer (m) | ||
|---|---|---|---|---|
| ≤150 | >150 | >0 | =0 | |
| n (%) | n (%) | n (%) | n (%) | |
| All | 3918 (28) | 9925 (72) | 6034 (41) | 8746 (59) |
| Facility-level characteristics | ||||
| Ownership | 3918 (28) | 9925 (72) | 6034 (41) | 8746 (59) |
| For profit | 2870 (29) | 7160 (71) | 4408 (41) | 6255 (59) |
| Government | 239 (30) | 552 (70) | 351 (39) | 546 (61) |
| Non profit | 809 (27) | 2213 (73) | 1275 (40) | 1945 (60) |
| Certification | 3918 (28) | 9925 (72) | 6034 (41) | 8746 (59) |
| Medicaid | 67 (25) | 201 (75) | 106 (35) | 196 (65) |
| Medicare | 128 (24) | 411 (76) | 205 (36) | 372 (64) |
| Both | 3723 (28) | 9313 (72) | 5723 (41) | 8178 (59) |
| Council type | 3918 (28) | 9925 (72) | 6034 (41) | 8746 (59) |
| Family | 8 (30) | 19 (70) | 13 (43) | 17 (57) |
| Resident | 2906 (28) | 7314 (72) | 4483 (41) | 6398 (59) |
| Both | 921 (28) | 2311 (72) | 1409 (40) | 2073 (60) |
| None | 83 (23) | 281 (77) | 129 (33) | 258 (67) |
| Occupancy (beds) | 3918 (28) | 9925 (72) | 6034 (41) | 8746 (59) |
| >81 | 1826 (28) | 4697 (72) | 2922 (40) | 4331 (60) |
| ≤81 | 1877 (28) | 4809 (72) | 3112 (41) | 4415 (59) |
| Tract-level characteristics | ||||
| % Urban | 3706 (28) | 9511 (72) | 5728 (41) | 8103 (59) |
| 100% | 1728 (24) | 5525 (76) | 2770 (37) | 4714 (63) |
| <100% | 1978 (33) | 3986 (67) | 2958 (47) | 3389 (53) |
| % Non-White | 3706 (28) | 9511 (72) | 5728 (41) | 8103 (59) |
| >15% | 1630 (25) | 4940 (75) | 2646 (38) | 4227 (62) |
| ≤15% | 2076 (31) | 4571 (69) | 3082 (44) | 3876 (56) |
| Household median income | 3703 (28) | 9506 (72) | 5725 (41) | 8096 (59) |
| >46,000 | 1902 (28) | 4933 (72) | 2848 (40) | 4296 (60) |
| ≤46,000 | 4801 (28) | 4573 (72) | 2877 (43) | 3800 (57) |
| Characteristics | Distance to A1 or A2 ≤150 m PR (95% CI) | High Traffic Density (Length) PR (95% CI) |
|---|---|---|
| Facility-level characteristics | ||
| Ownership | ||
| For profit | 1.096 (1.001–1.201) | 1.075 (0.992–1.165) |
| Government | 1.184 (0.997–1.406) | 0.981 (0.843–1.141) |
| Non profit | - | - |
| Certification | ||
| Medicaid | 0.834 (0.631–1.102) | 0.773 (0.609–0.981) |
| Medicare | 0.779 (0.637–0.953) | 0.787 (0.662–0.937) |
| Both | - | - |
| Council type | ||
| Family | 1.425 (0.602–3.374) | 1.529 (0.721–3.246) |
| Resident | 1.345 (1.049–1.725) | 1.401 (1.131–1.737) |
| Both | 1.349 (1.044–1.744) | 1.359 (1.089–1.697) |
| None | - | - |
| Occupancy (beds) | ||
| >81 | 0.974 (0.904–1.049) | 0.957 (0.896–1.022) |
| ≤81 | - | - |
| Tract-level characteristics | ||
| % Urban | ||
| 100% | 0.630 (0.584–0.680) | 0.673 (0.629–0.721) |
| <100% | - | - |
| % Non-White | ||
| >15% | 0.727 (0.673–0.784) | 0.787 (0.736–0.842) |
| ≤15% | - | - |
| Household median income | ||
| >46,000 | 0.979 (0.907–1.056) | 0.876 (0.818–0.937) |
| ≤46,000 | - | - |
| Characteristics | A1&A2 Total AADT in 300 m Buffer (Count/Year) PR (95% CI) | A1&A2 Combo Truck AADT in 300 m Buffer (Count/Year) PR (95% CI) |
|---|---|---|
| Facility-level characteristics | ||
| Ownership | ||
| For profit | 1.373 (1.211–1.556) | 1.500 (1.323–1.701) |
| Government | 0.680 (0.532–0.868) | 1.542 (1.216–1.955) |
| Non profit | - | - |
| Certification | ||
| Medicaid | 0.564 (0.378–0.842) | 1.181 (0.803–1.737) |
| Medicare | 2.034 (1.514–2.732) | 0.844 (0.639–1.117) |
| Both | - | - |
| Council type | ||
| Family | 0.316 (0.083–1.198) | 0.871 (0.277–2.733) |
| Resident | 1.028 (0.724–1.459) | 1.070 (0.754–1.519) |
| Both | 1.149 (0.801–1.648) | 0.939 (0.655–1.347) |
| None | - | - |
| Occupancy (beds) | ||
| >81 | 2.444 (2.204–2.710) | 1.025 (0.927–1.134) |
| ≤81 | - | - |
| Tract-level characteristics | ||
| % Urban | ||
| 100% | 4.426 (3.961–4.945) | 0.893 (0.805–0.991) |
| <100% | - | - |
| % Non-White | ||
| >15% | 2.020 (1.818–2.245) | 1.206 (1.087–1.338) |
| ≤15% | - | - |
| Household median income | ||
| >46,000 | 1.879 (1.692–2.086) | 0.859 (0.775–0.953) |
| ≤46,000 | - | - |
© 2018 by the authors. Licensee MDPI, Basel, Switzerland. This article is an open access article distributed under the terms and conditions of the Creative Commons Attribution (CC BY) license (http://creativecommons.org/licenses/by/4.0/).
Share and Cite
Wang, Y.; Fan, H.; Banerjee, R.; Weaver, A.M.; Weiner, M. A National County-Level Assessment of U.S. Nursing Facility Characteristics Associated with Long-Term Exposure to Traffic Pollution in Older Adults. Int. J. Environ. Res. Public Health 2018, 15, 487. https://doi.org/10.3390/ijerph15030487
Wang Y, Fan H, Banerjee R, Weaver AM, Weiner M. A National County-Level Assessment of U.S. Nursing Facility Characteristics Associated with Long-Term Exposure to Traffic Pollution in Older Adults. International Journal of Environmental Research and Public Health. 2018; 15(3):487. https://doi.org/10.3390/ijerph15030487
Chicago/Turabian StyleWang, Yi, Hao Fan, Rudy Banerjee, Anne M. Weaver, and Michael Weiner. 2018. "A National County-Level Assessment of U.S. Nursing Facility Characteristics Associated with Long-Term Exposure to Traffic Pollution in Older Adults" International Journal of Environmental Research and Public Health 15, no. 3: 487. https://doi.org/10.3390/ijerph15030487
APA StyleWang, Y., Fan, H., Banerjee, R., Weaver, A. M., & Weiner, M. (2018). A National County-Level Assessment of U.S. Nursing Facility Characteristics Associated with Long-Term Exposure to Traffic Pollution in Older Adults. International Journal of Environmental Research and Public Health, 15(3), 487. https://doi.org/10.3390/ijerph15030487